- 1Key Laboratory of Transport Industry of Big Data Application Technologies for Comprehensive Transport, Ministry of Transport, Beijing Jiaotong University, Beijing, China
- 2Institute of Transportation System Science and Engineering, Beijing Jiaotong University, Beijing, China
- 3Traffic Control Technology Co., Ltd, Beijing, China
- 4Beijing Key Laboratory of Traffic Engineering, College of Metropolitan Transportation, Beijing University of Technology, Beijing, China
Measuring the interaction between cities is an important research topic in many disciplines, such as sociology, geography, economics, and transportation science. The traditional and most widely used spatial interaction model is the gravity model, but it requires the parameters to be artificially set. In this paper, we propose a parameter-free interactive city choice (ICC) model that measures intercity interaction from the perspective of individual choice behavior. The ICC model assumes that the probability of an individual choosing to interact with a city is proportional to the number of opportunities in the destination city and inversely proportional to the number of intervening opportunities between the origin city and the destination city, calculated using the travel time in the transportation network. The intercity interaction intensity can be obtained by calculating the product of this probability and the origin city’s population. We apply the ICC model to measure the interaction intensity among 339 cities in China and analyze the impact of changes in the Chinese land transportation network from 2005 to 2018 on the intercity and city interaction intensity. The results show that our model provides an alternative method for measuring the intercity interaction.
1 Introduction
The rapid development of cities worldwide and the acceleration of urbanization have led to more than half of the world’s population living in cities [1], and thus cities have become the main location for human activities in today’s society [2]. The connections between cities through the transportation network promotes the flow of people, goods, information, money, and skills among cities; such flow between cities is called intercity interaction [3, 4]. Understanding and predicting intercity interaction patterns has long been an important research topic in sociology, geography, economics, transportation science, and many other disciplines [5, 6]. It also has great significance in the rational formulation of urban development strategies [7, 8], the promotion of regional sustainable development [9], communicable disease control [10–12], and other fields. As the intercity interaction intensity increases, cities are no longer regarded as isolated individuals but as interdependent urban systems [13]. Therefore, understanding the intercity interaction and establishing a model that can accurately measure the interaction between cities are of great value for optimizing the spatial structure of urban agglomerations [14, 15].
The gravity model was the first model proposed to measure intercity interaction [16]. The model assumes that the intensity of interaction between two cities is proportional to the product of their sizes (e.g., population, GDP) and inversely proportional to a power law function of their distance. The gravity model is simple in form and is widely used to predict intercity interactions, such as intercity travel [17], commuting trips [18, 19], population migration [20], and international trade [21]. However, this model is based on analogy with Newton’s law of universal gravitation and does not involve individual spatial choice behavior [5, 22]. It is an important issue in social physics to characterize how constituents (such as individuals, institutions, governments) choose interactive objects from the perspective of human choice behavior [2, 23]. Furthermore, the parameter of the gravity model’s power law distance function is artificially defined. For example, some researchers set the parameter to 1 [24–26], while others set it to 2 [27–29]. Therefore, it would be a valuable contribution to establish a parameter-free model to measure intercity interactions from the perspective of individual spatial choice behavior.
Simini et al. took an important step forward in spatial interaction modeling by establishing a parameter-free model named the radiation model [30] to predict commuting trips between counties in the U.S. This model assumes that the individual will consider the employment opportunities provided by the work location and the benefits that the opportunities may bring to him/her when choosing a work location. He/she will choose the work location nearest to his/her home that offers a benefit greater than the best offer available in his/her home county. Some researchers improve the radiation model and propose various commuting prediction models, such as the radiation model with selection [31], and the flow and jump model [32]. Recently, many researchers have applied the radiation model or improved radiation models to measure intercity interaction intensity [33–35]. However, the radiation model assumes that the individual will only choose the nearest location with a higher benefit than his/her home, which reflects a cautious tendency of individual choice behavior. It can predict commuting trips but is not suitable for predicting general travel [36] because travelers may choose not only the closest location with a higher benefit than the origin but also other locations with higher benefits than the origin and intervening destinations. To solve this problem, Liu and Yan proposed another parameter-free model, named the opportunity priority selection (OPS) model [37], that adopts the perspective of individual destination choice behavior. The OPS model assumes that when the individual chooses a destination, he/she will choose a location with a higher benefit than the benefit of the origin, and the benefits of the intervening opportunities [38]. This reflects an exploratory tendency in individual choice behavior and can accurately predict human mobility within and between cities. Compared with the radiation model, the OPS model can better describe individual destination choice behavior between cities, which implies that the OPS model is more suitable for measuring the intercity interaction intensity. However, applications of the OPS model to measure intercity interactions is still lacking.
In this paper, we establish an intercity interaction measurement model named the interactive city choice (ICC) model by improving the OPS model. We further apply this model to measure the intercity interaction intensity in China and analyze the impact of the change in China’s land transportation network from 2005 to 2018 on the city interaction intensity.
2 Interactive City Choice Model
The OPS model [37] assumes that when an individual chooses a destination, similar to the classic radiation model [30] and the population-weighted opportunities model [39, 40], he/she first evaluates the benefit of the opportunities in each location, in which the number of opportunities in a location is proportional to the location’s population, and the benefit of opportunities is a random variable with a continuous distribution. After evaluating the benefit, the individual will select a location that presents higher benefits than the origin and any intervening opportunities. According to the above assumption, when an individual at location i makes a choice for location j, the probability of location j being selected (see Supplementary Appendix S1 for details) is
where mi is the number of opportunities at location i, and sij is the number of intervening opportunities (i.e., the sum of the number of opportunities at all locations at a shorter distance to i than j [38]; see Figure 1A).
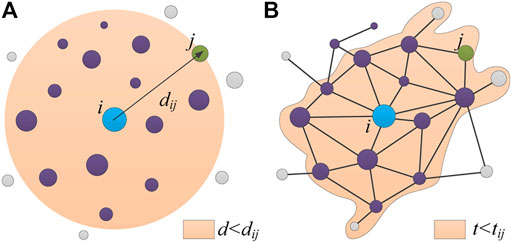
FIGURE 1. Schematic diagram of the calculation of intervening opportunities. Each dot represents a location. Location i (blue dot) is the origin, and location j (green dot) is the destination. (A) In the OPS model, the intervening opportunity sij refers to the sum of the number of opportunities at all locations (i.e., locations in the orange circle, except location i and location j) whose distance d from location i is less than the distance dij from location i to location j. (B) In the ICC model, intervening opportunity sij refers to the sum of the number of opportunities at all locations (i.e., locations in the orange area, except location i and location j) whose travel time t from location i is less than the travel time tij from location i to location j, where the travel time is obtained by calculating the shortest travel time path through the transportation network.
From Eq. 1, we can see that the OPS model can calculate the probability of an individual choosing a destination without any adjustable parameters. However, there are two problems in applying the OPS model to measure intercity interactions. One is that the intervening opportunities sij in the OPS model are calculated by the geographic distance between two locations, as shown in Figure 1A. However, in reality, locations are connected by a transportation network. Most individuals compare which locations are easier to reach by taking travel time, instead of geographic distance, as the main factor. Therefore, the intervening opportunities sij should be calculated by the travel time between two locations [41], as shown in Figure 1B. The other is that the OPS model assumes that the number of location opportunities is proportional to its population. However, the number of opportunities provided by each city is not directly proportional to the population but is more related to the city’s industrial scale, GDP or other economic indicators [42], among which the most commonly used indicator is GDP [21]. Therefore, it is more reasonable to use GDP to reflect the number of opportunities.
To solve these two problems, we establish a probability model for individuals to choose to interact with a city. We assume that the set of locations for calculating intervening opportunity sij in Eq. 1 is created using travel time (see Figure 1B) and that the number of location opportunities is proportional to the city’s GDP. Furthermore, if we know the total population ni of city i, we can calculate the interaction intensity from city i to city j as
where mi is the GDP of city i, and sij is the sum of the GDP of all cities whose travel time from city i is shorter than that of city j (see the orange area in Figure 1B). We name Eq. 2 the interactive city choice (ICC) model. It should be noted that the spatial interaction intensity Tij is not an actual flow volume but a dimensionless value. Furthermore, according to the spatial interaction intensity Tij, we can calculate the interaction intensity of the city as
where Ai is the interaction intensity of city i,
3 Application of the ICC Model to Measuring Intercity Interaction Intensity
In this section, we apply the ICC model to measure the interaction intensity between cities in China and analyze the impact of the change in the Chinese land transportation network from 2005 to 2018 on city interaction intensity. It should be noted that China started to build high-speed railways in 2005; thus, we select 2005 as the starting year. Because we can only download Chinese economic and demographic data up to 2018, when we started this work, we select 2018 as the ending year.
3.1 Data and Processing Methods
We select 339 Chinese cities, including 333 prefecture-level cities, four municipalities (Beijing, Tianjin, Shanghai, and Chongqing) and two special administrative regions (Hong Kong and Macao), as the research objects. We download the population and GDP data of the 339 Chinese cities in 2005 and 2018 from the official website of the National Bureau of Statistics of China and the data of the cities’ central points, Chinese road networks and railway networks in 2018 from the OpenStreetMap website. The reason for selecting the road and railway network data is that the total annual transportation volume of these two land transportation modes accounts for more than 84% of the total annual transportation volume of all intercity transportation modes (including railway, road, waterway and airway) in both 2005 and 2018, as shown in Table 1. In these two types of data, roads include highways, national roads, provincial roads, county roads, and township roads; railways include high-speed railways and normal railways. Since travel between any two cities can be realized through national roads, we select the national road data as the basic land transportation network data. Furthermore, we add three other types of data (i.e., highways, normal railways, and high-speed railways) that are designed to provide faster travel than national roads in the land transportation network. We establish the 2018 land transportation network, in which the edges represent highways, national roads, and normal railways or high-speed railways. We add the city central point to the land transportation network by connecting it to the nearest road within the urban area. We also connect it to the nearest railway if there is a railway station within the urban area. We also need to assign the travel time value to each edge to calculate the intercity travel time in the land transportation network. We know the length of each edge in the land transportation network, so we only need to set the speeds of these four transportation modes (i.e., national road, highway, normal railway, and high-speed railway) to calculate the travel time. According to the standards, including Code for Design of Railway Line (TB 10098-2017) and Design Specification for Highway Alignment (JTG D20-2017), the design speed range of high-speed railway is from 250 to 350 km/h, of the normal railway is from 80 to 200 km/h, of the highway is from 80 to 120 km/h and of the national road is from 60 to 100 km/h. For simplicity, we use the median value of the speed range, i.e., 300 km/h as the assumed speed for the high-speed railway, 140 km/h for the normal railway, 100 km/h for the highway, and 80 km/h for the national road. We then calculate the travel time of each edge by dividing its length by its assumed speed. We obtain the 2005 land transportation network by deleting roads and railways built after 2005 in the 2018 land transportation network according to the 2005 Chinese road map and 2005 Chinese railway map, as shown in Figure 2.

TABLE 1. The proportion of annual passengers and freight transportation volume for various transportation modes in China.
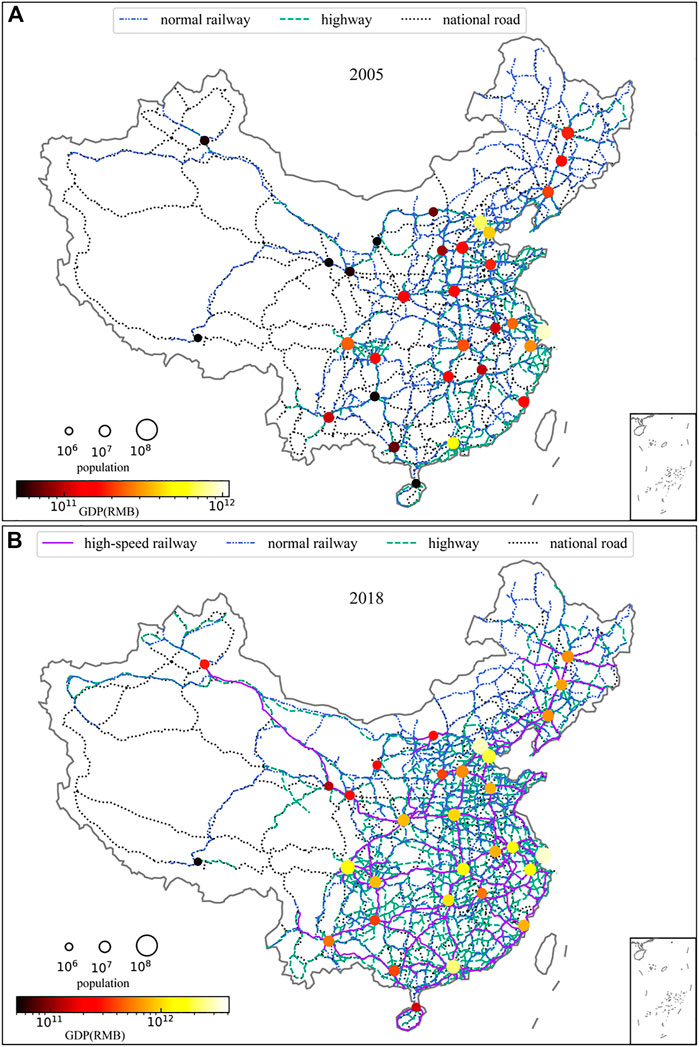
FIGURE 2. Chinese land transportation network and selected important cities (A) 2005. (B) 2018. Each circle represents a provincial capital city or municipality. The size and color of the circle represent the population and GDP of the city, respectively. Solid lines represent high-speed railways, dashed-dotted lines represent normal railways, dashed lines represent highways, and dotted lines represent national roads.
3.2 Calculation of the Intercity Interaction Intensity
We apply the ICC model to calculate the intercity interaction intensity in 2005 and 2018. We first calculate the travel time between cities by finding the shortest intercity travel time path in both the 2005 and 2018 land transportation networks. According to the intercity travel time, we can obtain sij by summing the GDP of all cities whose travel time from city i is less than the travel time from city i to city j. We then calculate the intercity interaction intensity in 2005 and 2018 according to Eq. 2. The results are shown in Figure 3, from which we can see that the intercity interaction intensity in the east of the Heihe-Tengchong line [44] is higher than that in the west in both 2005 and 2018. Considering Figures 2, 3 comprehensively, we can see that the interaction intensity between large cities in 2018 is significantly higher than that in 2005. This increase is due to the more intensive construction of high-speed railways and highways between large cities during these 13 years. Additionally, the intercity travel time has been greatly shortened with the development of the land transportation network. We can see from Figure 4 that the proportion of short-time interactions increases and the proportion of long-time interactions decreases from 2005 to 2018. The longest travel time was shortened from 54 h in 2005 to 43 h in 2018. Furthermore, as shown in the subgraph of Figure 4, it only takes 7.5 h to fall within 95% of the total national interaction intensity in the land transportation network in 2018, while it took 13 h to reach that in 2005.
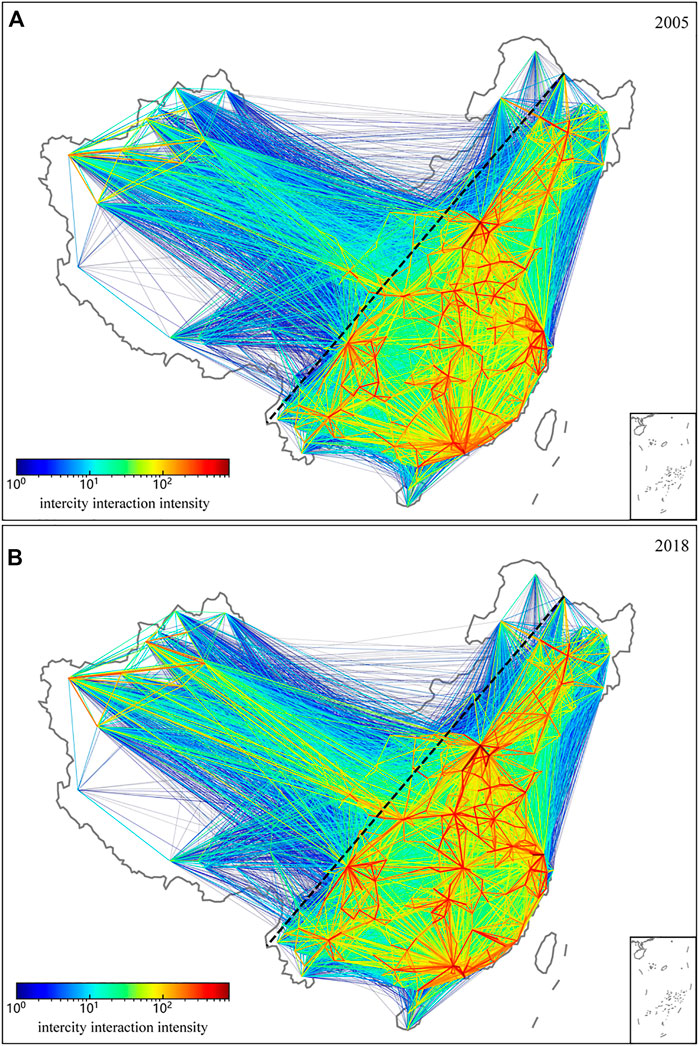
FIGURE 3. Distribution of interaction intensity among Chinese cities (A) 2005. (B) 2018. The black dashed line is the Heihe-Tengchong line. The thickness and color of the other lines indicate the intercity interaction intensity.
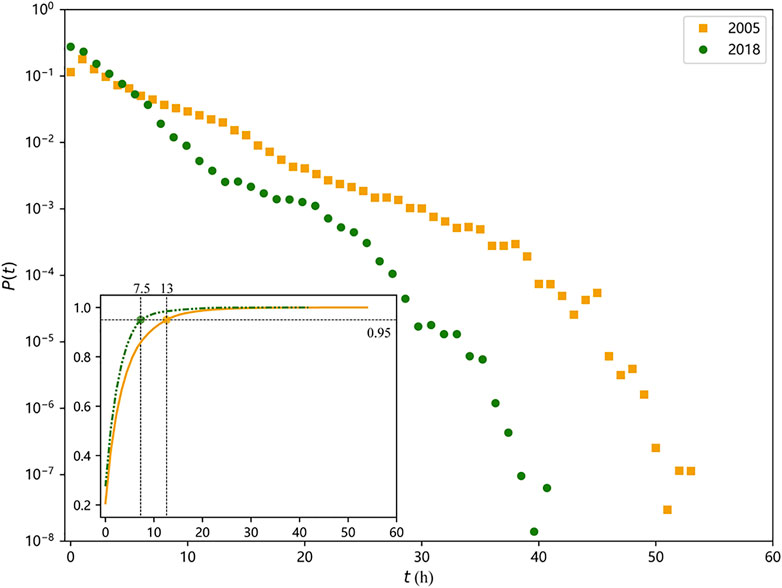
FIGURE 4. Travel time distribution. The square dot and circular dot in the figure represent the proportion of the intercity interaction intensity with a travel time of t hours in 2005 and 2018, respectively. The solid line and dotted lines in the subgraph represent the cumulative probability distribution of travel time in 2005 and 2018, respectively.
3.3 Calculation of the City Interaction Intensity
We calculate the interaction intensity of Chinese cities in 2005 and 2018 according to Eq. 3. The results are shown in Figure 5A,B, from which we can see that the 2 years show a similar distribution of city interaction intensity, i.e., the cities with high interaction intensity are mainly concentrated east of the Chinese Heihe-Tengchong Line. This is mainly because these cities have a more developed economy, more opportunities and a more intensive surrounding land transportation network, as shown in Figure 2. Furthermore, we calculate the difference in city interaction intensity between 2005 and 2018, as shown in Figure 5C. We can see that the interaction intensity of many cities, e.g., Wuhan, significantly improves, and while the interaction intensity of some cities, e.g., Hong Kong, decreases. The reasons for this phenomenon are the changes in these cities’ GDP and the development of land transportation networks (especially high-speed railway networks) from 2005 to 2018. For example, Wuhan’s GDP increased from 223.823 billion yuan in 2005 to 1484.729 billion yuan in 2018, with a growth rate of 563.35%. In addition, the two national high-speed railway arteries (i.e., Beijing-Guangzhou and Shanghai-Hanrong high-speed railways) established after 2005 both pass through Wuhan. The development of Wuhan’s GDP and transportation infrastructure have led to a rapid increase in its attractiveness for interaction, so the interaction intensity of Wuhan significantly improves. In contrast, Hong Kong’s GDP increased from 1384.5 billion yuan in 2005 to 2400.098 billion yuan in 2018, with a growth rate of 73.35%. It has the lowest GDP growth rate compared with other 398 Chinese cities, which reduces its attraction for interaction. In addition, we can see from Figure 5C that the interaction intensity of most cities along the high-speed railway increases, while that of cities far from the high-speed railway generally decreases. This is mainly because the travel time between cities along the high-speed railway and other cities has been significantly reduced with the construction and rapid development of the high-speed railway. Cities along the high-speed railway will be chosen with higher probability by those choosing to interact with a city.
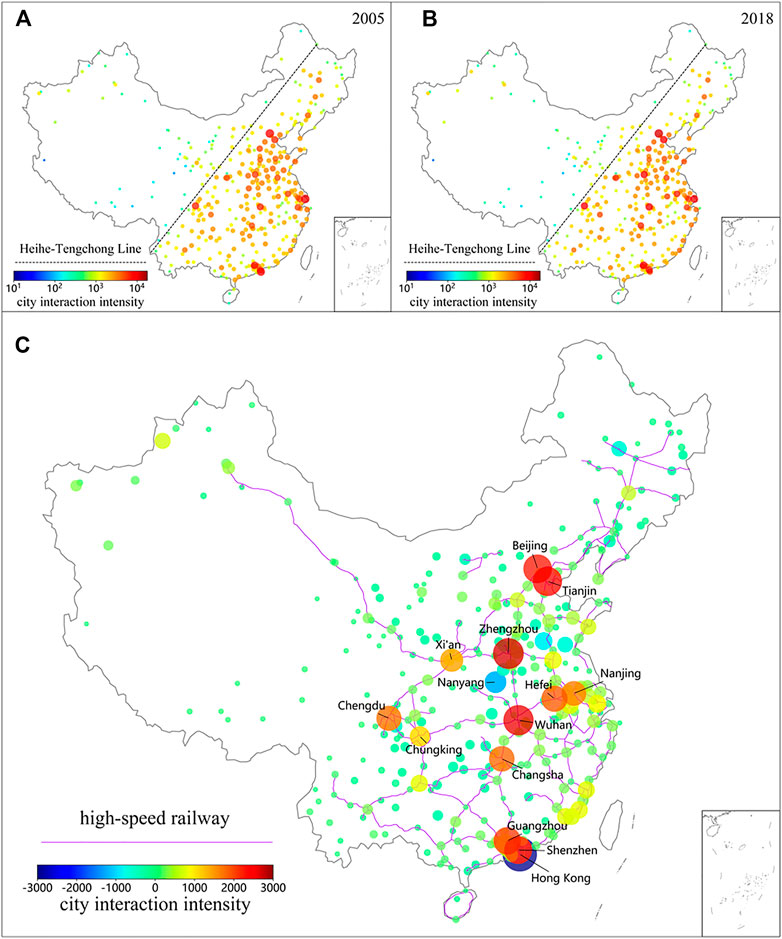
FIGURE 5. City interaction intensity and the difference between city interaction intensity in 2005 and that in 2018. (A) 2005 and (B) 2018 Chinese city interaction intensity. The dotted line is the Heihe-Tengchong line and each circle represents a city. The color and size of the circle indicate the city interaction intensity. (C) The difference between city interaction intensity in 2005 and that in 2018. Each circle represents a city and the size of the circle represents the absolute value of the difference value.
We further rank the 339 cities according to their interaction intensity in 2005 and 2018. The results are shown in Figure 6, from which we can see that the ranking of city interaction intensity changes greatly from 2005 to 2018. For example, Guangzhou’s ranking rises from fourth place to third place, Shenzhen’s ranking rises from ninth place to seventh place, and Hong Kong’s ranking drops from third place to fifteenth place. Although these three cities are geographically close and their 2018 GDPs are similar (the GDPs of Guangzhou, Shenzhen and Hong Kong are 2285.935, 2422.198, and 2400.098 billion yuan respectively), they differ greatly in their city interaction intensity due to their different positions in the land transportation network. Guangzhou is one of three national comprehensive transportation hubs with three national road arteries (i.e., Beijing-Guangzhou Line, Guiyang-Guangzhou Line and Nan-Guangzhou Line). Shenzhen is also a comprehensive transportation hub that connects Hong Kong, Macao and mainland China. These results once again demonstrate the important influence of transportation network on the city interaction intensity.
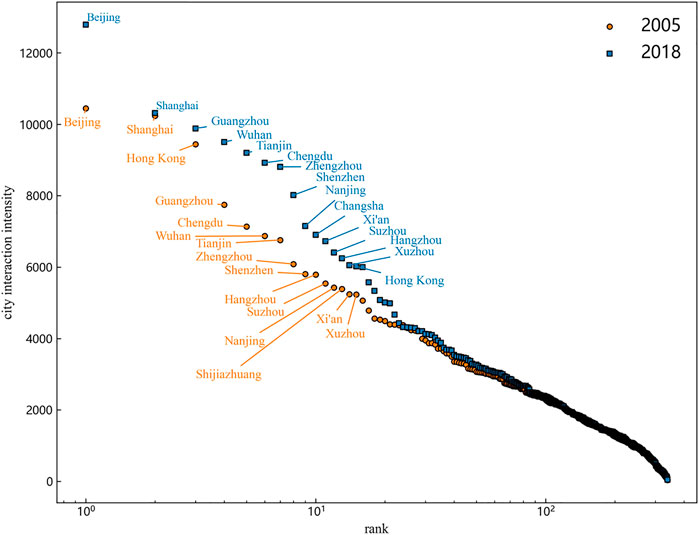
FIGURE 6. Ranking of city interaction intensity. The circular dot and square dot in the figure represent the city interaction intensity in 2005 and 2018, respectively. The horizontal axis represents the ranking of cities, and the vertical axis represents the city interaction intensity.
We next apply the radiation model [30]
to calculate the intercity interaction intensity, and then use Eq. 3 to calculate the interaction intensity of each city in 2018. We list the ranking of the interaction intensity of the top 20 Chinese cities calculated by the ICC model and radiation model in Table 2, from which we can see that the city interaction intensity obtained by the radiation model is quite different from the general understanding of the importance of cities. For example, Zhengzhou ranks 3rd while Shanghai only ranks 6th in the results of the radiation model. Compared with the radiation model, the ICC model’s results are more consistent with our subjective perception, implying that the ICC model can better reflect the comprehensive impact of the city’s population, GDP and transportation network on the city interaction intensity.
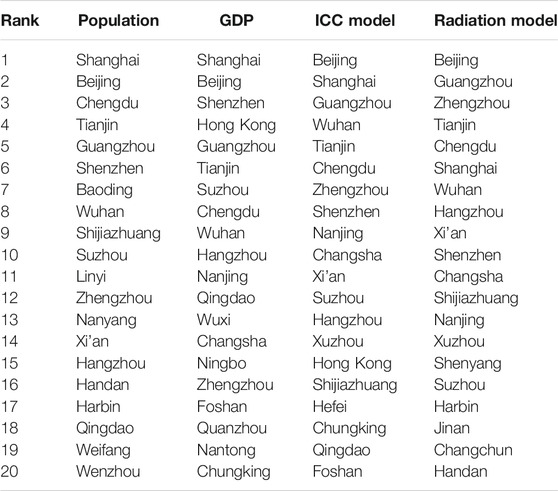
TABLE 2. Ranking of population, GDP and city interaction intensity calculated by the ICC model and radiation model.
4 Conclusion and Discussion
The measurement of intercity interaction has important research significance. In this paper, we develop the ICC model from the perspective of individual choice behavior, which assumes that the probability of an individual choosing to interact with a city is proportional to the number of opportunities, as expressed by the GDP of the destination city, and inversely proportional to the number of intervening opportunities, calculated by the shortest travel time in the land transportation network. Multiplying this probability by the origin city’s population, one can obtain the intercity interaction intensity. To demonstrate the advantage of the ICC model, we apply the ICC model to measure the interaction intensity among 339 cities in China. After collecting and processing the big data related to intercity interaction, we analyze the impact of the change in the land transportation network from 2005 to 2018 on the intercity and city interaction intensity. We find that the travel time between cities has decreased and the interaction intensity between large cities has increased due to the development of land transportation. In particular, the interaction intensity of cities along high-speed railways has greatly increased. These results show that our model provides an alternative method for measuring the intercity interaction.
The proposed ICC model not only helps us measure the intercity interaction intensity but also offers potential additional applications. For example, the ICC model provides a new perspective for identifying suburbs, which is a hot topic in geographical research. The traditional suburban identification method usually refers to population density and the nature of residential land [34]. The ICC model introduces the spatial interaction intensity between city districts, which can improve the method of suburban identification. In addition, the ICC model can calculate the interaction intensity within and between urban agglomerations, providing valuable indicators for a comprehensive evaluation of the degree of urban agglomeration [33, 45], which is of great significance for urban agglomeration sustainable development.
Although the ICC model can obtain reasonable results when measuring intercity interaction intensity, it still has room for expansion in practical applications. In this paper, we use GDP, which is a key factor affecting the number of opportunities, to reflect the number of opportunities. In reality, there are many other factors, e.g., urban population, industrial size and industrial structure, that also affect a city’s opportunities. Therefore, we can use multiple factors to calculate the number of opportunities in future applications. In addition, we only use the travel time calculated by the shortest time path algorithm in the land transportation networks, including roads, and railways, to measure the interaction intensity among 339 Chinese cities. However, the importance of various transportation modes is different in different countries or regions. For example, airways are an important mode of passenger transportation between the U.S. cities [46], and waterways are the main mode of freight transport between European cities [47]. Therefore, future research can consider extending the land transportation network to a more comprehensive three-dimensional transportation network including roads, railways, airways, and waterways to make more reasonable measurements of intercity interactions.
Data Availability Statement
The raw data supporting the conclusion of this article will be made available by the authors, without undue reservation.
Author Contributions
X-YY and E-JL designed the research; X-YJ, E-JL, C-YC, ZH, and X-YY performed the research; X-YJ, E-JL, and C-YC analysed the empirical data; X-YJ, E-JL, ZH, and X-YY wrote the paper.
Funding
This work was supported by the National Natural Science Foundation of China (Grant Nos. 71871010, 71621001, and 71822102).
Conflict of Interest
Author C-YC was employed by Traffic Control Technology Co. Ltd.
The remaining authors declare that the research was conducted in the absence of any commercial or financial relationships that could be construed as a potential conflict of interest.
Publisher’s Note
All claims expressed in this article are solely those of the authors and do not necessarily represent those of their affiliated organizations, or those of the publisher, the editors and the reviewers. Any product that may be evaluated in this article, or claim that may be made by its manufacturer, is not guaranteed or endorsed by the publisher.
Acknowledgments
We thank Professor Kai Liu and her postgraduate student Wei-Hua Zhu at Beijing Normal University for their help with our early research.
Supplementary Material
The Supplementary Material for this article can be found online at: https://www.frontiersin.org/articles/10.3389/fphy.2022.850415/full#supplementary-material
References
2. Barthelemy M. The Statistical Physics of Cities. Nat Rev Phys (2019) 1:406–15. doi:10.1038/s42254-019-0054-2
3. Ord K. Estimation Methods for Models of Spatial Interaction. J Am Stat Assoc (1975) 70:120–6. doi:10.1080/01621459.1975.10480272
4. Besag J. Spatial Interaction and the Statistical Analysis of Lattice Systems. J R Stat Soc Ser B (Methodological) (1974) 36:192–225. doi:10.1111/j.2517-6161.1974.tb00999.x
5. Wilson AG. A Family of Spatial Interaction Models, and Associated Developments. Environ Plan A (1971) 3:1–32. doi:10.1068/a030001
6. Najem S, Faour G. Debye–hückel Theory for Refugees’ Migration. EPJ Data Sci (2018) 7:1–9. doi:10.1140/epjds/s13688-018-0154-8
7. Batty M. The Size, Scale, and Shape of Cities. Science (2008) 319:769–71. doi:10.1126/science.1151419
8. Paldino S, Bojic I, Sobolevsky S, Ratti C, González MC. Urban Magnetism through the Lens of Geo-Tagged Photography. EPJ Data Sci (2015) 4:5. doi:10.1140/epjds/s13688-015-0043-3
9. Gately CK, Hutyra LR, Wing IS. Cities, Traffic, and Co2: A Multidecadal Assessment of Trends, Drivers, and Scaling Relationships. Proc Natl Acad Sci U.S.A (2015) 112:4999–5004. doi:10.1073/pnas.1421723112
10. Hufnagel L, Brockmann D, Geisel T. Forecast and Control of Epidemics in a Globalized World. Proc Natl Acad Sci U.S.A (2004) 101:15124–9. doi:10.1073/pnas.0308344101
11. Eubank S, Guclu H, Kumar VSA, Marathe MV, Srinivasan A, Toroczkai Z, et al. Modelling Disease Outbreaks in Realistic Urban Social Networks. Nature (2004) 429:180. doi:10.1038/nature02541
12. Balcan D, Colizza V, Goncalves B, Hu H, Ramasco JJ, Vespignani A. Multiscale Mobility Networks and the Spatial Spreading of Infectious Diseases. Proc Natl Acad Sci (2009) 106:21484–9. doi:10.1073/pnas.0906910106
13. Batten DF. Network Cities: Creative Urban Agglomerations for the 21st century. Urban Stud (1995) 32:313–27. doi:10.1080/00420989550013103
14. Barthelemy M. The Structure and Dynamics of Cities. Cambridge: Cambridge University Press (2016).
15. Le Néchet F. Urban Spatial Structure, Daily Mobility and Energy Consumption: a Study of 34 European Cities. Cybergeo (2012) 2012:580. doi:10.4000/cybergeo.24966
16. Stewart JQ. An Inverse Distance Variation for Certain Social Influences. Science (1941) 93:89–90. doi:10.1126/science.93.2404.89
17. Jung W-S, Wang F, Stanley HE. Gravity Model in the Korean Highway. Europhys Lett (2008) 81:48005. doi:10.1209/0295-5075/81/48005
18. Viboud CEC, Bj O Rnstad ON, Smith DL, Simonsen L, Miller MA, Grenfell BT. Synchrony, Waves, and Spatial Hierarchies in the Spread of Influenza. Science (2006) 312:447–51. doi:10.1126/science.1125237
19. Lenormand M, Bassolas A, Ramasco JJ. Systematic Comparison of Trip Distribution Laws and Models. J Transp Geogr (2016) 51:158–69. doi:10.1016/j.jtrangeo.2015.12.008
20. Tobler W. Migration: Ravenstein, Thornthwaite, and beyond. Urban Geogr (1995) 16:327–43. doi:10.2747/0272-3638.16.4.327
21. Fagiolo G. The International-Trade Network: Gravity Equations and Topological Properties. J Econ Interact Coord (2010) 5:1–25. doi:10.1007/s11403-010-0061-y
22. Yan X-Y, Zhou T. Destination Choice Game: A Spatial Interaction Theory on Human Mobility. Sci Rep (2019) 9:9466. doi:10.1038/s41598-019-46026-w
23. Wang H, Yan X-Y, Wu J. Free Utility Model for Explaining the Social Gravity Law. J Stat Mech Theor Exp. (2021) 2021:033418. doi:10.1088/1742-5468/abee18
24. Goldenberg J, Levy M. Distance Is Not Dead: Social Interaction and Geographical Distance in the Internet Era. arXiv (2009). arXiv:0906.3202.
25. Backstrom L, Sun E, Marlow C. Find Me if You Can: Improving Geographical Prediction with Social and Spatial Proximity. In: Proceedings of the 19th international conference on World wide web; April, 2010; Raleigh North Carolina USA (2010). p. 61–70.
26. Rahman MM. Australia’s Global Trade Potential: Evidence from the Gravity Model Analysis. In: Proceedings of the 2009 Oxford Business and Economics Conference (OBEC 2009); June 2008; Oxford, England (2009). p. 1–41.
27. Krings G, Calabrese F, Ratti C, Blondel VD. Urban Gravity: a Model for Inter-city Telecommunication Flows. J Stat Mech Theor Exp. (2009) 2009:L07003. doi:10.1088/1742-5468/2009/07/l07003
28. Keum K. Tourism Flows and Trade Theory: a Panel Data Analysis with the Gravity Model. Ann Reg Sci (2010) 44:541–57. doi:10.1007/s00168-008-0275-2
29. Alam M, Uddin G, Taufique K. Import Inflows of bangladesh: the Gravity Model Approach. Int J Econ Finance (2009) 1:131–9. doi:10.5539/ijef.v1n1p131
30. Simini F, González MC, Maritan A, Barabási A-L. A Universal Model for Mobility and Migration Patterns. Nature (2012) 484:96. doi:10.1038/nature10856
31. Simini F, Maritan A, Néda Z. Human Mobility in a Continuum Approach. PLoS One (2013) 8:e60069. doi:10.1371/journal.pone.0060069
32. Varga L, Tóth G, Néda Z. Commuting Patterns: the Flow and Jump Model and Supporting Data. EPJ Data Sci (2018) 7:37. doi:10.1140/epjds/s13688-018-0167-3
33. Li F, Feng Z, Li P, You Z. Measuring Directional Urban Spatial Interaction in china: A Migration Perspective. PLoS One (2017) 12:e0171107. doi:10.1371/journal.pone.0171107
34. Tian Y. Mapping Suburbs Based on Spatial Interactions and Effect Analysis on Ecological Landscape Change: A Case Study of Jiangsu Province from 1998 to 2018, Eastern china. Land (2020) 9:159. doi:10.3390/land9050159
35. Zheng W, Kuang A, Wang X, Chen J. Measuring Network Configuration of the Yangtze River Middle Reaches Urban Agglomeration: Based on Modified Radiation Model. Chin Geogr Sci (2020) 30:677–94. doi:10.1007/s11769-020-1131-2
36. Liu E-J, Yan X-Y. A Universal Opportunity Model for Human Mobility. Sci Rep (2020) 10:1–10. doi:10.1038/s41598-020-61613-y
37. Liu E, Yan X. New Parameter-free Mobility Model: Opportunity Priority Selection Model. Physica A (2019) 526:121023. doi:10.1016/j.physa.2019.04.259
38. Stouffer SA. Intervening Opportunities: a Theory Relating Mobility and Distance. Am Sociol Rev (1940) 5:845–67. doi:10.2307/2084520
39. Yan X-Y, Zhao C, Fan Y, Di Z, Wang W-X. Universal Predictability of Mobility Patterns in Cities. J R Soc Interf (2014) 11:20140834. doi:10.1098/rsif.2014.0834
40. Yan X-Y, Wang W-X, Gao Z-Y, Lai Y-C. Universal Model of Individual and Population Mobility on Diverse Spatial Scales. Nat Commun (2017) 8:1639. doi:10.1038/s41467-017-01892-8
41. Ren Y, Ercsey-Ravasz MAR, Wang P, Gonz A Lez MC, Toroczkai ZAN. Predicting Commuter Flows in Spatial Networks Using a Radiation Model Based on Temporal Ranges. Nat Commun (2014) 5:5347. doi:10.1038/ncomms6347
42. Reilly WJ. Methods for the Study of Retail Relationships. Texas: University of Texas Bulletin (1929).
43. Sim A, Yaliraki SN, Barahona M, Stumpf MP. Great Cities Look Small. J R Soc Interf (2015) 12:20150315. doi:10.1098/rsif.2015.0315
44. Huanyong H. Distribution of china’s Population: Accompanying Charts and Density Map(in Chinese). Acta Geogr Sin (1935) 2:33–74.
45. Shi Q, Yan X, Jia B, Gao Z. Freight Data-Driven Research on Evaluation Indexes for Urban Agglomeration Development Degree. Sustainability (2020) 12:4589. doi:10.3390/su12114589
46. Zhang J, Fang H, Wang H, Jia M, Wu J, Fang S. Energy Efficiency of Airlines and its Influencing Factors: A Comparison between china and the united states. Resour Conserv Recycl (2017) 125:1–8. doi:10.1016/j.resconrec.2017.05.007
Keywords: intercity interaction, individual choice behavior, human mobility patterns, land transportation network, trip distribution
Citation: Jia X-Y, Liu E-J, Chen C-Y, He Z and Yan X-Y (2022) An Interactive City Choice Model and Its Application for Measuring the Intercity Interaction. Front. Phys. 10:850415. doi: 10.3389/fphy.2022.850415
Received: 07 January 2022; Accepted: 03 February 2022;
Published: 03 March 2022.
Edited by:
Dong Hao, University of Electronic Science and Technology of China, ChinaReviewed by:
Zhidan Zhao, Shantou University, ChinaZi-Ke Zhang, Hangzhou Normal University, China
Xiao-Pu Han, Hangzhou Normal University, China
Copyright © 2022 Jia, Liu, Chen, He and Yan. This is an open-access article distributed under the terms of the Creative Commons Attribution License (CC BY). The use, distribution or reproduction in other forums is permitted, provided the original author(s) and the copyright owner(s) are credited and that the original publication in this journal is cited, in accordance with accepted academic practice. No use, distribution or reproduction is permitted which does not comply with these terms.
*Correspondence: Er-Jian Liu, ZXJqaWFubGl1QGJqdHUuZWR1LmNu; Xiao-Yong Yan, eWFueHlAYmp0dS5lZHUuY24=
 Xiang-Yu Jia
 Er-Jian Liu1,2*
 Xiao-Yong Yan