- 1Department of Economic Informatics, Kanazawa Gakuin University, Kanazawa, Japan
- 2National Institute of Informatics, Tokyo, Japan
- 3The Graduate University for Advanced Studies (SOKENDAI), Kanagawa, Japan
- 4Center for Advanced Research in Finance, The University of Tokyo, Tokyo, Japan
We employed the latest version of the world’s largest corporate financial database and identified the following three statistical properties of the physical labor productivity of firms: 1) The probability density function (PDF) of labor productivity follows power-law and log-normal distributions in the large- and mid-scale ranges. 2) Time-reversal symmetry was observed in the correlation of labor productivities in two consecutive years, and the initial-value dependence of the growth-rate distribution has regularity. These two properties accurately derive the above two kinds of PDFs. 3) The dependence of labor productivity distribution is negligible on the number of employees. This indicates a slight difference in the distribution of labor productivity among large-, mid-, and small-sized firms.
1 Introduction
In recent years, large-scale corporate financial data have been released to researchers. Although traditional economics has dealt with the representative values of groups, such as the average values of economic variables, it has become possible to directly analyze the distribution of variables themselves Mantegna and Stanley [1]; Saichev et al. [2]; Garibaldi and Scalas [3]; Aoyama et al. [4,5]. For example, the statistical properties observed in groups of firm-size variables, such as sales, number of employees, assets, and profits, which represent a firm size, can be clarified (See Ref. Ishikawa [6]).
Typical research on firm-size variables is the observation that the probability density function (PDF) follows power-law Pareto [7]; Newman [8]; Clauset et al. [9] and log-normal Gibrat [10]; Badger [11]; Montroll and Shlesinger [12] distributions in large- and mid-scale ranges, and the determination of their origins. In addition, although not covered in this paper, the analysis of such network structures as inter-firm transactions and corporate shareholding has increased the understanding of the microstructures of corporate connections (See Refs. Goto et al. [13]; Mizuno et al. [14]).
Furthermore, it has been reported that the productivity of firms calculated using the firm-size variables also follows a power law in the large-scale range and a log-normal distribution in the mid-scale range Mizuno et al. [15]; Head et al. [16]; Nigai [17]. However, to the best of our knowledge, there has been insufficient discussion of the origin of the productivity distribution, such as labor productivity, capital productivity, and total factor productivity. As an exception, it is important to refer to the statistical physics approach to labor productivity distribution, which began with Aoki and Yoshikawa’s study Aoki and Yoshikawa [18] that was eventually extended by Aoyama and Iyetomi’s group Aoyama et al. [19,20]; Souma et al. [21]; Aoyama et al. [22]; Iyetomi [23]; Aoyama et al. [5,24]; Yoshikawa [25]. These works all tackle the power-law and downward-convex-shaped distributions in the large- and small-scale ranges of labor productivity distribution by correlating the employees and labor productivities of firms with the particles and energy levels of a multisystem.
Now that comprehensive large-scale corporate financial data are available, the importance of the above productivity analyses has surpassed interest in the studies of firm-size variables themselves. The most critical aspect of the economy is the productivity of firms, because the productivity fuels its development and its maintenance. In this paper, using the knowledge we have gained in the analyses of firm-size variables, we derive power-law distributions of productivity in the large-scale range and log-normal distributions in the mid-scale range from the short-term properties of productivity in two consecutive years. At the same time, our observations of the distribution of labor productivity conditional on the number of employees show that there is almost no dependence of the distribution of labor productivity on the number of employees.
Measuring the total factor productivity is difficult because it involves estimating the degree to which firms’ production depends on assets and labor Cobb and Douglass [26]. As an approach to this problem, the authors propose a method to determine the form of the Cobb-Douglas production function and estimate the dependence of production on assets and labor Ishikawa et al. [27] using the geomorphological index of surface openness Yokoyama et al. [28,29]; Prima et al. [30]. This paper does not deal with such difficult issues. Instead its analysis focuses on physical labor productivity, which can be simply calculated from the firm-size variables. This is because in large-scale corporate financial databases, the data on the number of employees exist up to several people, and coverage of the small scale is higher than that of capital.
The following is the structure of this paper. Section 2 describes the number of employees, the operating revenues, and the physical labor productivity data of the firms covered in this paper. Section 3 observes these data and describes the scatter plots, the PDFs, and the initial-value dependence of the growth-rate and the ratio distributions of firm-size variables. We show that labor productivity follows power-law and log-normal distributions in the large- and mid-scale ranges as well as in the firm-size variables. In Section 4, we derive PDFs from the time-reversal symmetry observed in the scatter plot of the firm-size variables and the initial-value dependence of the growth-rate distribution by statistically describing the observations in Section 3. This is the first time that our approach to such firm-size variables as the number of employees and operating revenues has been applicable to labor productivity. In this sense, this paper considers labor productivity as a firm-size variable. Furthermore, the quasi-inversion symmetry observed in the scatter plot of the number of employees and operating revenues indicates that the dependency of the labor productivity distribution on the number of employees is negligible. We also confirm this property in the empirical data. Finally, Section 5 summarizes the results of this paper, discusses them, and presents future issues.
2 Data
This section describes the data employed in our paper. ORBIS, a corporate financial database from Bureau van Dijk BvD [31], is one of the world’s largest publicly available sources for researchers. The latest ORBIS 2020 edition shows results from 386, 461, 729 firms worldwide. However, the amount of data for 2020 is small because it is still being collected. For example, Table 1 shows the number of firms that have both number of employees and operating revenues data in Japan, Spain, and France for each year. Bureau van Dijk signed exclusive deals with worldwide data vendors to provide data for the last 10 years of each firm. As a result, the amount of available data prior to 2010 drastically decreased.
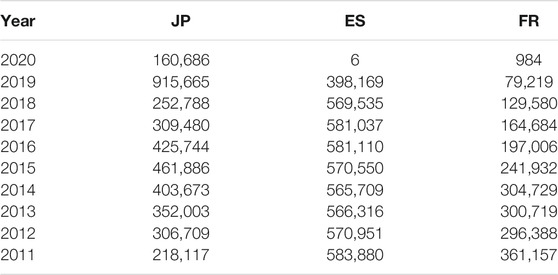
TABLE 1. Number of Japanese, Spanish, and French firms that have both number of employees and operating revenues data in ORBIS 2020 edition.
In this paper, we analyze physical labor productivity, which is the sales (operating revenue) per unit number of employees of each firm:
Here, operating revenue means the amount of sales (revenue) in a firm’s core business. Because of physical labor productivity, we denote the number of employees (NE) as L and the operating revenue (OR) as Y. The unit of L is employee. The unit of Y is one thousand of US dollars, calculated using the exchange rate at the time. Therefore, the unit of c is one thousand of US dollars per employee. Furthermore, to link the distribution of labor productivity c with its time variation in two consecutive years, this paper analyzed the data of 393, 556 firms that contain the number of employees and operating revenues data in 2014 and 2015 when the data volume is the largest (Table 2). Note that the observation of labor productivity c in two consecutive years is to confirm the time-reversal symmetry, not to view the flow.
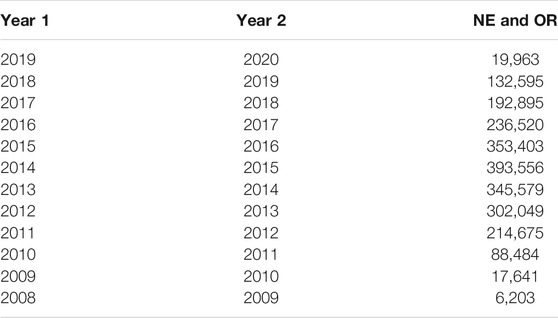
TABLE 2. Number of Japanese firms that have both number of employees and operating revenues data in two consecutive years in ORBIS 2020 edition.
3 Data Observations
In this section, we observe the statistical properties of the 2014 and 2015 operating revenues and labor productivity data of Japanese firms in the corporate financial database introduced in Section 2. In Section 3.1, we observe the data correlations of two consecutive years or of different data of the same year in scatter plots. We simultaneously observe the PDFs of the data. Section 3.2 discusses the initial-value dependences of the growth-rate and the data’s ratio distributions.
3.1 Scatter Plots and PDFs
First, we observed the correlations between the operating revenues of Japanese firms and their labor productivity. Figure 1 is a scatter plot of the operating revenues of 393, 556 Japanese firms in 2014 and 2015 listed in the database. The horizontal and vertical axes represent the operating revenues in 2014 (Y2014) and in 2015 (Y2015). Both logarithmic axes are used. In Figure 1, the PDF of Y2014 is also plotted by ◦ when Y2014 ∈ [2n−1, 2n) (n = 1, 2, … , 27). The scale is on the right vertical axis.
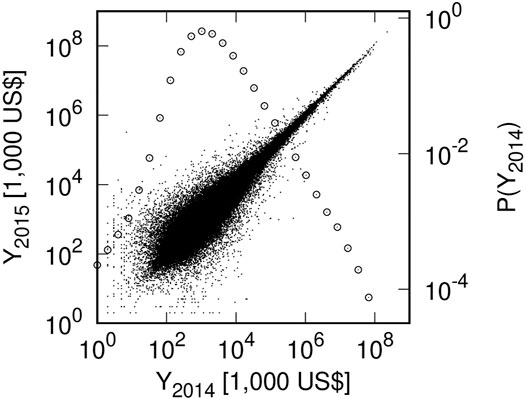
FIGURE 1. Scatter plot of Japanese firms’ operating revenues in 2014 and 2015 (Y2014, Y2015): Small black dots indicate a firm. PDF of Y2014 is also plotted by ◦ when Y2014 ∈ [2n−1, 2n) (n = 1, 2, … , 27).
As described in Section 1, a power-law distribution is observed in the large-scale range of firm-size variables, such as operating revenues Pareto [7]; Newman [8]; Clauset et al. [9]:
Here we denote Y2014 = x. P(x) is a PDF, μ is called Pareto’s index, and x0 is the lower bound of the large-scale range. Applying the least squares method to range 215 (∼ 104.5) ≤ Y2014 ≤ 227 (∼ 108.1), we estimate μY = 0.90 ± 0.01.
Similarly, a log-normal distribution is observed in the mid-scale range of firm-size variables (operating revenues in this case) Gibrat [10]; Badger [11]; Montroll and Shlesinger [12]:
where xmin is the lower bound of the mid-scale range and α is a parameter indicating a reciprocal of the spread of the log-normal distribution. Applying the least squares method to range 25 (∼ 101.5) ≤ Y2014 ≤ 215 (∼ 104.5), we obtain αY = 0.27 ± 0.01.
Figure 2 is a scatter plot of the labor productivity 1) in 2014 and 2015. The horizontal and vertical axes represent it in 2014 (c2014) and 2015 (c2015). Both logarithmic axes are used. In Figure 2, the PDF of c2014 is also plotted by ◦ when c2014 ∈ [2n−1, 2n) (n = − 1, 0, 1, … , 19). In the distribution of labor productivity, a power-law distribution 2) is observed in the large-scale range as well as in such firm-size variables as operating revenues. In this case, we denote c2014 = x. Applying the least squares method to range 211 (∼ 103.3) ≤ c2014 ≤ 219 (∼ 105.7), we estimated μc = 1.79 ± 0.04. Similarly, we found that a log-normal distribution (3) is observed in the mid-scale range of the labor productivity. Applying the least squares method to range 25 (∼ 101.5) ≤ c2014 ≤ 211 (∼ 103.3), we obtained αc = 0.64 ± 0.03.
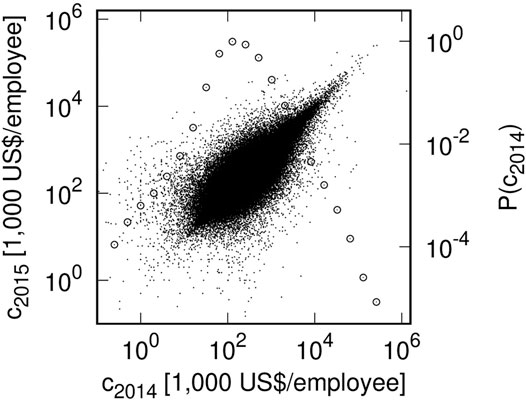
FIGURE 2. Scatter plot of Japanese firms’ labor productivity in 2014 and 2015 (c2014, c2015): Small black dots indicate firms. PDF of c2014 is also plotted by ◦ when c2014 ∈ [2n−1, 2n) (n = − 1, 0, 1, … , 19).
Figures 1, 2 are scatter plots of firm-size variables for two consecutive years, and Figure 3 is a scatter plot of the number of employees and operating revenues for the same year (2014). The horizontal and vertical axes represent the number of employees (L2014) and the operating revenues in 2014 (Y2014). Both logarithmic axes are used. In this figure, the ratio of the value on the horizontal axis to the value on the vertical axis of each firm (Y/L) is labor productivity (c). In Figure 3, six lines of c = Y/L = 10i (i = 0, 1, … , 5) are drawn as a scale of labor productivity.
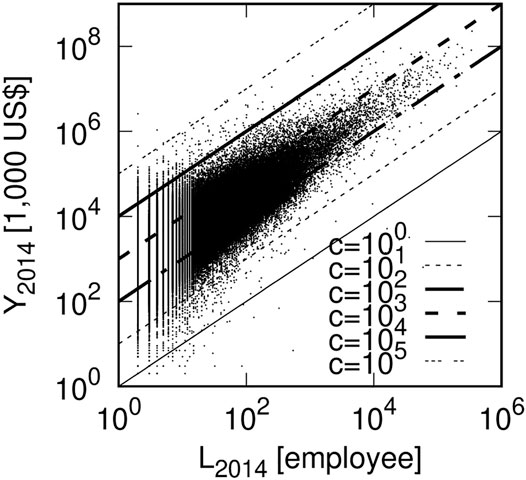
FIGURE 3. Scatter plot of Japanese firms’ number of employees and operating revenues in 2014 (L2014, Y2014): Small black dots indicate firms. Ratio of value on horizontal axis to value on vertical axis of each firm is labor productivity (c2014 = Y2014/L2014). As the scale, six lines of c2014 = 10i (i = 0, 1, … , 5) are drawn.
Figure 4 is a scatter plot of labor productivity and the number of employees for the same year (2014), slightly rewriting Figure 3. The horizontal and vertical axes represent the labor productivity (c2014) and the number of employees (L2014) in 2014. Both logarithmic axes are used. In Figure 4, six lines of c = Y/L = 10i (i = 0, 1, … , 5) are also drawn as in Figure 3. In Figure 4, the PDF of c2014 is also plotted by ◦ when c2014 ∈ [2n−1, 2n) (n = − 1, 0, 1, … , 19), similarly to Figure 2. The PDFs in Figures 2, 4 are identical.
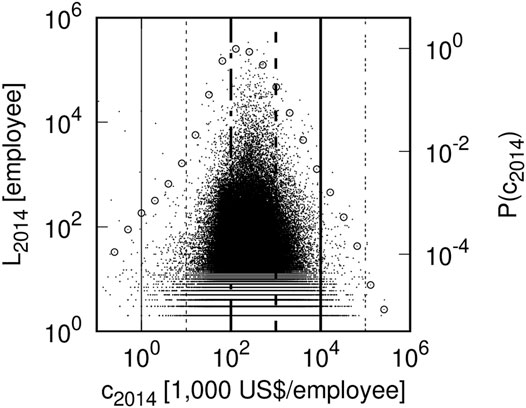
FIGURE 4. Scatter plot of Japanese firms’ labor productivity and number of employees in 2014 (c2014, L2014): Small black dots indicate firms. As in Figure 3, there are six lines: c2014 = 10i (i = 0, 1, … , 5). As in Figure 2, PDF of c2014 is plotted by ◦ when c2014 ∈ [2n−1, 2n) (n = − 1, 0, 1, … , 19).
3.2 Initial-Value Dependences of Growth-Rate and Ratio Distributions
Next from the data of Figures 1–3, we observed the distributions of the ratio between the values of the horizontal and vertical axes when conditioned by the value of the former.
First, we put the data from Figure 1 into five bins, each of which has a logarithmically equal-sized horizontal axis: Y2014 ∈ [100.5(m−1)+2, 100.5 m+2) (m = 1, 2, … , 5). Figure 5 plots the five distributions of the growth rates (RY = Y2015/Y2014) for them in each mth range. In Figure 5, the horizontal and vertical axes use logarithmic growth rate rY = log 10RY and conditional PDF q (rY|m).
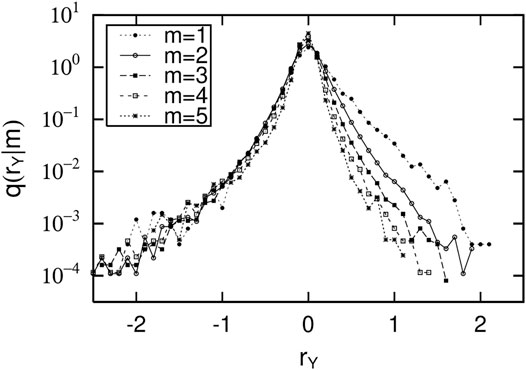
FIGURE 5. Five distributions of growth rates (RY = Y2015/Y2014) of data in each of five bins: Y2014 ∈ [100.5(m−1)+2, 100.5m+2) (m = 1, 2, … , 5) for scatter plot of operating revenues in two consecutive years (Figure 1): Horizontal and vertical axes use logarithmic growth rate rY = log 10RY and conditional PDF q (rY|m).
Similarly, we put the data from Figure 2 into five bins, each of which has a logarithmically equal-sized horizontal axis: c2014 ∈ [100.5(m−1)+1.5, 100.5 m+1.5) (m = 1, 2, … , 5). Figure 6 plots five distributions of the growth rates (Rc = c2015/c2014) for the data in each mth range. In Figure 6, the horizontal and vertical axes also use logarithmic growth rate rc = log 10Rc and conditional PDF q (rc|m).
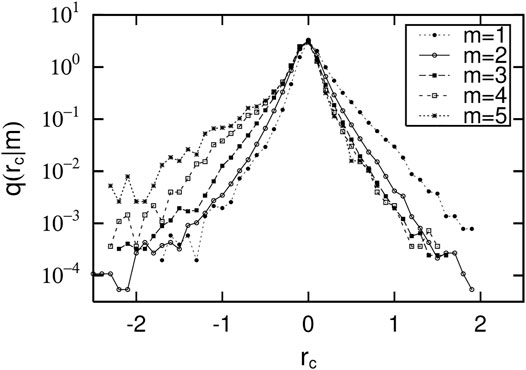
FIGURE 6. Five distributions of growth rates (Rc = c2015/c2014) of data in each of five bins: c2014 ∈ [100.5(m−1)+1.5, 100.5m+1.5) (m = 1, 2, … , 5) for scatter plot of operating revenues in two consecutive years (Figure 2): Horizontal and the vertical axes use logarithmic growth rate rc = log 10Rc and conditional PDF q (rc|m).
Figures 5, 6 show the growth-rate distributions by the initial conditions of the firm-size variables in two consecutive years. Similarly, we put data from Figure 3, a scatter plot between the number of employees and the operating revenues for the same year into seven bins, each of which has a logarithmically equal-sized horizontal axis: L2014 ∈ [100.5(m−1)+0.5, 100.5 m+0.5) (m = 1, 2, … , 7). Figure 7 plots the seven distributions of the ratio, identical to the labor productivity (c2014 = Y2014/L2014), for the data in each mth range. In Figure 7, the horizontal and vertical axes also use logarithmic ratio log 10c2014 and conditional PDF q (log 10c2014|m). Here, it is important that the growth rate (RY, Rc) of the operating revenues or the labor productivity in Figures 5, 6 is replaced by labor productivity 3) in Figure 7.
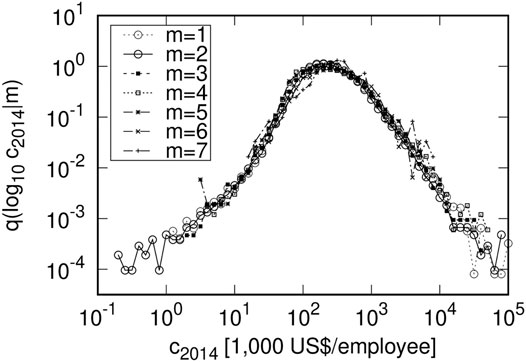
FIGURE 7. Seven distributions of ratio (c2014 = Y2014/L2014) of data in each of seven bins: L2014 ∈ [100.5(m−1)+0.5, 100.5m+0.5) (m = 1, 2, … , 7) for scatter plot of different two kinds of firm-size variables in same year (Figure 3). The unit of operating revenue is one thousand of US dollars, calculated using the exchange rate at that time.
4 Statistical Properties and Their Relations
In the previous section, we observed the correlations of the operating revenues of Japanese firms in two consecutive years and their labor productivity, their PDFs, and the initial-value dependence of the growth-rate distributions. This section shows that these PDFs can be derived from the time-reversal symmetry observed in the correlation of firm-size variables and the initial-value dependence of the growth-rate distributions. This method was first presented by Fujiwara et al. in the large-scale range of firm-size variables Fujiwara et al. [32,33], and we extended it to the mid-scale range Ishikawa [34,35]; Ishikawa et al. [36]; Ishikawa [6]. In this paper, we show for the first time that the PDF of labor productivity can be derived in the same way as other firm-size variables. In addition, we discuss the quasi-inversion symmetry observed in the scatter plot between the number of employees and the operating revenues for the same year and the dependency of the distribution of labor productivity, which is the ratio of the values on the horizontal axis to those on the vertical axis, on the number of employees.
4.1 Time-Reversal Symmetry of the Joint Probability Density Function
Figures 1, 2 are scatter plots of Japanese firms’ 2014 and 2015 operating revenues (YT, YT+1) and labor productivity (cT, cT+1). Figure 1 shows a very strong correlation between operating revenues in two consecutive years. Figure 2 also shows a strong correlation between labor productivity in two consecutive years. Figures 1, 2 also show that their correlations are symmetric with respect to the interchange of the vertical and horizontal axes (xT ↔ xT+1), i.e., time-reversal symmetry Fujiwara et al. [32,33].
Time-reversal symmetry is expressed using a joint PDF PJ (xT, xT+1):
Here PJ must have the same functional form on both sides.
4.2 Initial-Value Dependences of Growth-Rate Distributions and Gibrat’s Law
Next we consider the dependence of the growth-rate distributions on the initial value (value on the horizontal axis) in Figures 1, 2. Figure 5 is the initial-value dependence of the growth-rate distribution of operating revenues (Y) in two consecutive years. This figure shows the following properties.
Conditional PDF q (r|xT) for logarithmic growth rate r has a maximum at r = 0, a downward convex decreasing function for r > 0, and a downward convex increasing function for r < 0 using the logarithmic axes. q (r|xT) with these properties is most simply expressed by Ishikawa et al. [36]:
Since q (r|xT) is PDF, we must cut off the upper and lower bounds of the r range in Eq. 5 and Eq. 6. However, the cut off is not explicitly written to avoid excessive complexity. In this paper, we also use the q (r|xT) conditional on initial value xT and the q (r|m) conditional on bin number m containing xT in the same sense.
Figure 6 shows the initial-value dependence of the growth-rate distribution of labor productivity (c) in two consecutive years. PDF q (r|xT) is also maximized at r = 0. Using the logarithmic axes, the PDF is a decreasing function for r > 0 and is an increasing function for r < 0. The curvature is slightly smaller than in Figure 5. If we approximate the curvature to 0, we can express it by zeroing out the second term in Eq. 5 and Eq. 6 for r: u±(xT) = 0.
A property common to Figures 5, 6 is that as initial-value xT increases, the change in q (r|xT) decreases. Interestingly, as the initial value increases, the growth-rate distribution becomes almost independent of the initial value. This property is called Gibrat’s law Gibrat [10]; Sutton [37]. This state can be written in Eq. 5 and Eq. 6 as u±(xT), t±(xT), and c (xT) are constants.
The significant difference between Figures 5, 6 is the direction in which q (r|xT) changes as initial-value xT increases. In Figure 5, q (r|xT) decreases as xT increases, whether r > 0 or r < 0. Their rate of decrease is larger for r > 0 than for r < 0. On the other hand, in Figure 6, as initial value xT increases, q (r|xT) decreases for r > 0, but increases for r < 0. The rate of change is similar for r < 0 and r > 0. We discuss how this difference occurs in Section 4.3.
4.3 Time-Reversal Symmetry, Initial-Value Dependence of Growth-Rate Distribution, and PDF
Here we derive log-normal distribution (3) and power-law distribution (2) from the time-reversal symmetry (4) and the initial-value dependence of the conditional growth-rate distribution (5) (6).
Time-reversal symmetry (4) can be rewritten using variables (xT, R (= xT+1/xT)):
From now on, we write xT as x for simplicity. Measures in Eq. 7 are organized so that the time-reversal symmetry becomes:
Using conditional PDF: Q (R|x) = PJ (x, R)/P(x), this expression can be written:
Using the relationship between growth rate R and logarithmic growth rate r = log 10R,
the initial-value dependence (5) and (6) can be expressed in Q (R|x):
Here we ignored the x dependency of c(x) in Eqs. 5, 6. In Figures 5, 6, q (r|m) at r = 0 is almost independent of m. Therefore, in the range of x considered in these figures, this treatment of c(x) is a valid approximation. At the same time, ignoring the x dependencies of u±(x) in Eq. 5 and Eq. 6, we address the simplest approximation to introduce the downward convex curvature into a conditional PDF. See our previous studies Ishikawa et al. [36] and Ishikawa [6] that do not ignore the x dependence of u±(x).
Substituting Eq. 11 and Eq. 12 into Eq. 9 for R > 1 yields
This result expands as R = 1 + ϵ (ϵ ≪ 1) near the time-reversal symmetry axis of R = 1. The zeroth order of ϵ yields only a trivial expression. Then from the linear terms of ϵ, we obtain
Using this expression, rewriting the derivative of P(x) to P(x) yields the second and third terms of ϵ:
No useful information can be obtained from the fourth or higher terms of ϵ.
t±(x) is determined from simultaneous differential Eq. 15 and Eq. 16:
where α±, D1, and D2 are integral constants. Substituting these equations into Eq. 14 and assuming μ = D1 − D2, a log-normal distribution (3) is obtained. Here α in Eq. 3 is given:
In addition, u± is connected by
The same argument yields identical results for R < 1, obtained near R = 1. By setting μ = D1 − D2, these results always satisfy Eq. 13. In other words, these results are equivalent expressions that have a necessary and sufficient relationship with Eq. 13.
If the growth-rate distribution can be approximated by a straight line on the logarithmic axes, as in Figure 6, we believe that there is no quadratic term in r in Eq. 5 and Eq. 6. That is, u± = 0. In this case, by Eq. 20, α+ = − α−. This situation creates the difference between Figures 5, 6 that is described in Section 4.2. In addition, α+ > α− in Figure 5 corresponds to the positive value of α connected by Eq. 19. These analytical conclusions can be confirmed by empirical data as follows.
In Figure 5, we confirm α+ > α− > 0 as in
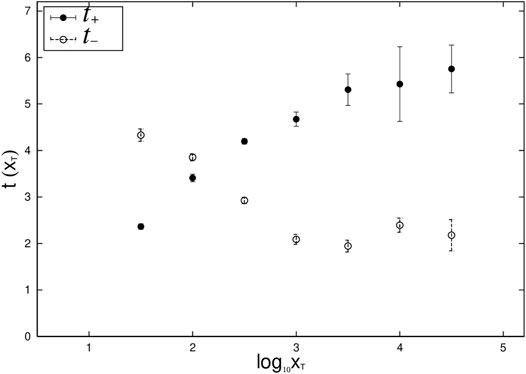
FIGURE 8. Values of t±(xT) evaluated by applying Eq. 17 and Eq. 18 to q (r|xT) in Figure 6. Here to simplify understanding the figure, m = 6, 7 are added to m = 1, 2, … , 5 in Figure 6.
We can also obtain
In the large-scale range, all of the x dependencies of the growth-rate distributions (5) and (6) disappear. This is Gibrat’s law. This corresponds to a situation where t± does not have x dependency, which is actually observed in Figure 8 and achieved by setting α± to zero in Eq. 17 and Eq. 18. At x = x0, the mid-scale log-normal distribution (3) is switched to the power-law distribution (2) in the large-scale range. Note the following points. To derive a power-law distribution (2), it is not necessary to assume Eq. 5 and Eq. 6; it is sufficient to use Gibrat’s law where the growth-rate distribution is independent of the initial value. For a proof of this, see Fujiwara et al. Fujiwara et al. [32,33], upon which the above discussion is based. Their proof requires a reflection law corresponding to μ = D1 − D2.
4.4 Quasi-Inverse Symmetry, Initial-Value Dependence of Ratio Distribution, and PDF
In the previous subsection, we considered changes in the firm-size variables in two consecutive years. In this subsection we focus on the distribution of labor productivity, as the ratio of number of employees to operating revenues, which are the firm-size variables in the same year.
This paper presents the distribution of labor productivity in two ways. One is derived from the time-reversal symmetry in labor productivity in two consecutive years (Figure 2) and the initial-value dependence of the growth-rate distribution (Figure 6). The other appears as a distribution of ratios (Figure 4) under the quasi-inversion symmetry of the number of employees and operating revenues in the same year (Figure 3). In this case, the initial-value dependency of the distribution of the ratio is directly the employee number dependency of the labor productivity distribution. These will be discussed in detail below.
First, consider the properties observed in the scatter plot. Figure 3 is a scatter plot between number of employees (L) and operating revenues (Y) for Japanese firms in 2014. They are correlated similar to the vertical and horizontal axes in Figures 1, 2. Figure 3 also shows that the correlation is symmetric with respect to line log 10Y = log 10L + log 10a (where a is a parameter). The authors call this quasi-inversion symmetry Ishikawa et al. [38]. In Figure 3, parameter a can be evaluated as log 10a = 2.47 ± 0.13 using the index of the surface openness Yokoyama et al. [28,29]; Prima et al. [30].
This quasi-inversion symmetry can be expressed using a joint PDF:
Figure 4 is a scatter plot between labor productivity 3) and number of employees (L) of Japanese firms in 2014. This is a revision of Figure 3 using Eq. 1: c = Y/L. This diagram is useful for understanding how the labor productivity distribution (◦ in Figure 4) consists of firms with a certain number of employees.
Next we consider the properties of the distribution of ratios. Figures 5, 6 are the initial-value dependence of the growth-rate distribution of the firm-size variables in two consecutive years. On the other hand, Figure 7 shows the distribution of the ratio of the number of employees to operating revenues in the same year, that is, the labor productivity distribution itself, and the dependency on the number of employees. This is of great interest in Figure 7 because the dependence of labor productivity on the number of employees is a critical economic issue. The greatest characteristic of Figure 7 is that the shape of the distribution of labor productivity is almost independent of the number of employees. This is Gibrat’s law between different firm-size variables in the same year. In addition, the right side of the distribution in Figure 7 decreases according to a power-law function; the left side has a wider tail. Figure 7 shows that this tail consists of firms with m = 1, 2 or 100.5 (∼ 3.2) ≤ L < 101.5 (∼ 31.6) employees. This can also be observed in Figure 7, which shows that in firms with m = 3, 4, ⋯ or 101.5 (∼ 31.6) ≤ L employees, the left tail decreases according to a power-law function.
In Figure 7, the maximum value of q (log 10c|L) is around log 10c ∼ 2.5. This corresponds to a shift of the quasi-inverse symmetry in Figure 3: log 10Y ↔ log 10L + log 10a above the inverse symmetry by log 10a = 2.47 ± 0.13. The labor productivity distribution in Figures 2, 4 is obtained by superimposing the seven distributions in Figure 7. Furthermore in Figure 7, the maximum of q (log 10c|L) is not sharp like in Figures 5, 6. This reflects the fact that the correlation between the number of employees and operating revenues in the same year is not as strong as the correlation between the firm-size variables in two consecutive years.
This property is observed in countries other than Japan. Similar properties can be also observed in countries where comprehensive corporate financial data is available, such as Spain and France (Figures 9, 10). The unit of operating revenue in these countries is also one thousand of US dollars, calculated using the exchange rate at that time.
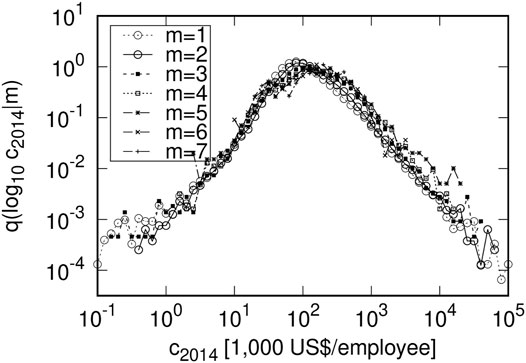
FIGURE 9. Dependence of labor productivity on number of employees in Spanish firms in 2014: Bins were sorted identically as in Figure 7. The unit of operating revenue is one thousand of US dollars, calculated using the exchange rate at that time.
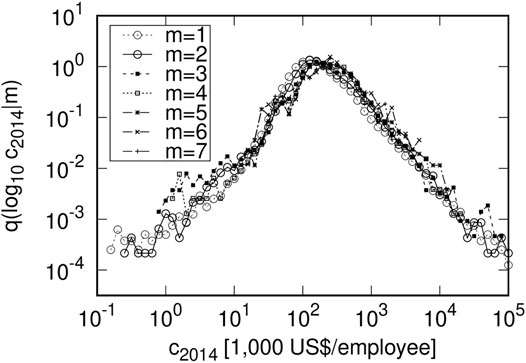
FIGURE 10. Dependence of labor productivity on number of employees in French firms in 2014: Bins were sorted identically as in Figure 7. The unit of operating revenue is one thousand of US dollars, calculated using the exchange rate at that time.
5 Results and Discussion
Employing the latest version of ORBIS, the world’s largest corporate financial database available to researchers, we discuss the statistical properties of physical labor productivity using number of employees and operating revenues. In this paper, we regarded physical labor productivity, which is the operating revenues per unit employee of each firm as one of firm-size variables.
It has long been known that the time-reversal symmetry observed in the joint PDF of firm-size variables in two consecutive years and the initial-value dependence of the growth-rate distribution lead to PDFs in the range of large- and mid-scale firm-size variables. As well as those, we first confirm that the joint PDF of labor productivity in two consecutive years shows time-reversal symmetry. We also confirm that the initial-value dependence of the growth-rate distribution is also regular, as was the case with other firm-size variables. We show analytically that power-law and log-normal distributions in the large- and mid-scale labor productivity can also be derived from these two properties and confirm the analytic results with empirical data.
Furthermore, we found a significant difference between the initial-value dependence of the distribution of the growth-rate distributions of the operating revenues and those of the labor productivity. As the initial value increases, both the positive and negative growth-rate distributions of the operating revenues decrease. Similar properties are observed in the growth-rate distribution of the number of employees, although not covered in this paper. On the other hand in the latter case, as the initial value increases, the positive growth-rate distribution decreased while the negative distribution increases at the same rate of change. This is similar to what we observed in our previous study with positive net income data Ishikawa [34,35] where the properties observed in positive net income were also observed in labor productivity. This suggests that such a property exists in the firm-size variables, including net income and labor productivity, which are composed of subtraction or division of firm-size variables.
By exploiting the fact that the quasi-inversion symmetry observed in the correlation between the number of employees and the operating revenues in the same year is directly related to the labor productivity distribution, which is their ratio, we also show that the shape of the labor productivity distribution is basically independent of the number of employees. This means that the shape of the labor productivity distribution is identical regardless whether the firm size is large, medium, or small. This conclusion is different from the argument in economics that larger firms have higher labor productivity. However, it is the same conclusion derived by Aoyama et al. whose analysis divided a large amount of corporate financial data into large firms and small and medium firms by the number of employees Aoyama et al. [20,39]. In this paper, we show that even when the number of employees is subdivided, the shape of the distribution of labor productivity agrees very accurately.
Aoyama et al. went further and focused on the shape of the downward convex observed in the small-scale range of the labor productivity distribution. The analysis in our paper shows that this downward convex form consists of firms with approximately 30 or fewer employees. In this small-scale range, the symmetry axis with respect to the time reversal is unclear, and the dependence of the growth-rate distribution on the initial value cannot be expressed in the form employed in this paper. Therefore, discussing the PDF of small-scale labor productivity is difficult by simply extending the approach in our paper to the small-scale range. This idea is related to the fact that small-scale labor productivity is mainly composed of firms whose number of employees and operating revenues are on the small scale, i.e., the completeness of firms constitutes small-scale labor productivity. Note however, that Aoyama et al. discussed the relationship between labor productivity and the average number of employees, not the distribution of labor productivity itself.
To further develop our paper, the analytical relationships of PDFs can be derived using simple relationship rc = rY − rL among the logarithmic growth rate of the number of employees, the operating revenues, and labor productivity (rL, rY, rc). This paper focuses on labor productivity, although capital productivity and total factor productivity can be also discussed in the same manner. Since its purpose was discussing the relationship between the statistical properties of firm-size variables, we did not analyze the relationship by industry or time. These analyses are of great economic importance in the future.
Data Availability Statement
Publicly available datasets were analyzed in this study. This data can be found here: Bureau van Dijk Electronic Publishing KK. https://www.bvdinfo.com/en-gb.
Author Contributions
AI and SF conceived of the presented idea. AI developed the theory and performed the computations. TM supervised the findings of this work. All authors have read and agreed to the published version of the manuscript.
Funding
This study was supported by JSPS KAKENHI Grant Numbers 17K01277, 21H01569, and 21K04557.
Conflict of Interest
The authors declare that the research was conducted in the absence of any commercial or financial relationships that could be construed as a potential conflict of interest.
Publisher’s Note
All claims expressed in this article are solely those of the authors and do not necessarily represent those of their affiliated organizations, or those of the publisher, the editors and the reviewers. Any product that may be evaluated in this article, or claim that may be made by its manufacturer, is not guaranteed or endorsed by the publisher.
Acknowledgments
The authors thank Dr. Yuji Aruka for providing an opportunity to start this research.
References
1. Mantegna RN, Stanley HE. Introduction to Econophysics: Correlations and Complexity in Finance. Cambridge: Cambridge University Press (2000).
2. Saichev AI, Malevergne Y, Sornette D. Theory of Zip’s Law and beyond. Berlin Heidelberg: Springer-Verlag (2010).
3. Garibaldi U, Scalas E. Finitary Probabilistic Methods in Econophysics. Cambridge: Cambridge University Press (2010).
4. Aoyama H, Fujiwara Y, Ikeda Y, Iyetomi H, Souma W. Econophysics and Companies: Statistical Life and Death in Complex Business Networks. Cambridge: Cambridge University Press (2010).
5. Aoyama H, Fujiwara Y, Ikeda Y, Iyetomi H, Souma W, Yoshikawa H. Macro-Econophysics: New Studies on Economic Networks and Synchronization (Physics of Society: Econophysics and Sociophysics). Cambridge: Cambridge University Press (2017).
6. Ishikawa A Statistical Properties in Firms’ Large-Scale Data (Evolutionary Economics and Social Complexity). Tokyo: Springer (2021).
8. Newman MEJ. Power Laws, Pareto Distributions and Zipf’s Law. Contemp Phys (2005) 46:323–51. doi:10.1080/00107510500052444
9. Clauset A, Shalizi CR, Newman MEJ Power-law Distributions in Empirical Data. SIAM Rev (2009) 51:661–703. doi:10.1137/070710111
11. Badger WW. An Entropy-Utility Model for the Size Distribution of Income. In: BJ West, editor. Mathematical Models as a Tool for the Social Science. New York: Gordon & Breach (1980). p. 87–120.
12. Montroll EW, Shlesinger MF. Maximum Entropy Formalism, Fractals, Scaling Phenomena, and 1/f Noise: A Tale of Tails. J Stat Phys (1983) 32:209–30. doi:10.1007/bf01012708
13. Goto H, Takayasu H, Takayasu M Empirical Analysis of Firm-Dynamics on Japanese Interfirm Trade Network. In: H Takayasu, N Ito, I Noda, and M Takayasu, editors. Proceedings of the International Conference on Social Modeling and Simulation, Plus Econophysics Colloquium 2014. Cham: Springer (2015). p. 195–204. doi:10.1007/978-3-319-20591-5_18
14. Mizuno T, Doi S, Kurizaki S. The Power of Corporate Control in the Global Ownership Network. PLoS ONE (2020) 15:e0237862. doi:10.1371/journal.pone.0237862
15. Mizuno T, Ishikawa A, Fujimoto S, Watanabe T. Power Laws in Firm Productivity. Prog Theor Phys Supple (2012) 194:122–34. doi:10.1143/ptps.194.122
16. Head K, Mayer T, Thoenig M Welfare and Trade without Pareto. Am Econ Rev (2014) 104:310–6. doi:10.1257/aer.104.5.310
17. Nigai S. A Tale of Two Tails: Productivity Distribution and the Gains from Trade. J Int Econ (2017) 104:44–62. doi:10.1016/j.jinteco.2016.10.006
18. Aoki M, Yoshikawa H. Reconstructing Macroeconomics - A Perspecrive from Statistical Physics and Conbinatiorial Stochastic Processes. Cambridge: Cambridge University Press (2007).
19. Aoyama H, Yoshikawa H, Iyetomi H, Fujiwara Y Labour Productivity Superstatistics. Prog Theor Phys Suppl (2009) 179:80–92. doi:10.1143/ptps.179.80
20. Aoyama H, Fujiwara Y, Ikeda Y, Iyetomi H, Souma W. Superstatistics of Labor Productivity in Manufacturing and Nonmanufacturing Sectors. Econ Open-Access, Open-Assessment E-Journal (2009) 3:2009–22. doi:10.5018/economics-ejournal.ja.2009-22
21. Souma W, Ikeda Y, Iyetomi H, Fujiwara Y. Distribution of Labor Productivity in Japan over the Period 1996–2006. Econ Open-Access, Open-Assessment E-Journal (2009) 3:2009–14. doi:10.5018/economics-ejournal.ja.2009-14
22. Aoyama H, Yoshikawa H, Iyetomi H, Fujiwara Y Productivity Dispersion: Facts, Theory, and Implications. J Econ Interact Coord (2010) 5:27–54. doi:10.1007/s11403-010-0063-9
23. Iyetomi H. Labor Productivity Distributions with Negative Temperature. Prog Theor Phys Supple (2012) 194:135–43. doi:10.1143/ptps.194.135
24. Aoyama H, Iyetomi H, Yoshikawa H. Equilibrium Distribution of Labor Productivity. J Econo Interact Coord (2015) 10:135–43. doi:10.1007/s11403-013-0118-9
25. Yoshikawa H. Reconstructing Macroeconomics - Keynes and Schumpeter (In Japanese). Tokyo: Iwanami Shoten (2020).
27. Ishikawa A, Fujimoto S, Mizuno T Why Does Production Function Take the Cobb-Douglas Form? Evolut Inst Econ Rev (2020) 18:79–102. doi:10.1007/s40844-020-00180-3
28. Yokoyama R, Sirasawa M, Kikuchi Y. Representation of Topographical Features by Opennesses (In Japanese with English Abstract). J Jpn Soc Photogrammetry Remote Sensing (1999) 38:26–34. doi:10.4287/jsprs.38.4_26
29. Yokoyama R, Sirasawa M, Pike R. Visualizing Topography by Openness: A New Application of Image Processing to Digital Elevation Models. Photogrammetric Eng Remote Sensing (2002) 68:257–65.
30. Prima ODA, Echigo A, Yokoyama R, Yoshida T. Supervised Landform Classification of Northeast Honshu from DEM-Derived Thematic Maps. Geomorphology (2006) 78:373–86. doi:10.1016/j.geomorph.2006.02.005
32. Fujiwara Y, Souma W, Aoyama H, Kaizoji T, Aoki M Growth and Fluctuations of Personal Income. Physica A: Stat Mech its Appl (2003) 321:598–604. doi:10.1016/s0378-4371(02)01663-1
33. Fujiwara Y, Di Guilmi C, Aoyama H, Gallegati M, Souma W Do Pareto-Zipf and Gibrat Laws Hold True? an Analysis with European Firms. Physica A: Stat Mech its Appl (2004) 335:197–216. doi:10.1016/j.physa.2003.12.015
34. Ishikawa A Derivation of the Distribution from Extended Gibrat’s Law. Physica A (2006) 367:425–34. doi:10.1016/j.physa.2005.12.005
35. Ishikawa A The Uniqueness of Firm Size Distribution Function from Tent-Shaped Growth Rate Distributio. Physica A (2007) 383:79–84. doi:10.1016/j.physa.2007.04.089
36. Ishikawa A, Fujimoto S, Mizuno T. Shape of Growth Rate Distribution Determines the Type of Non-gibrat’s Property. Physica A (2011) 390:4273–42854. doi:10.1016/j.physa.2011.06.043
38. Ishikawa A, Fujimoto S, Mizuno T, Watanabe T Analytical Derivation of Power Laws in Firm Size Variables from Gibrat's Law and Quasi-Inversion Symmetry: A Geomorphological Approach. J Phys Soc Jpn (2014) 83:034802. doi:10.7566/jpsj.83.034802
39. Aoyama H, Iyetomi H, Ikeda Y, Souma W, Fujiwara Y, Yoshikawa H. Firms’ Labor Productivity Distributions (In Japanese). J Econ (2012) 78:2.
Keywords: econophysics, labor productivity, Gibrat’s law, non-Gibrat’s property, time-reversal symmetry, quasi-inverse symmetry
Citation: Ishikawa A, Fujimoto S and Mizuno T (2022) Statistical Properties of Labor Productivity Distributions. Front. Phys. 10:848193. doi: 10.3389/fphy.2022.848193
Received: 04 January 2022; Accepted: 25 January 2022;
Published: 18 February 2022.
Edited by:
Raul Matsushita, University of Brasilia, BrazilReviewed by:
Ion Geru, Academy of Sciences of Moldova (ASM), MoldovaMarcelo Byrro Ribeiro, Federal University of Rio de Janeiro, Brazil
Copyright © 2022 Ishikawa, Fujimoto and Mizuno. This is an open-access article distributed under the terms of the Creative Commons Attribution License (CC BY). The use, distribution or reproduction in other forums is permitted, provided the original author(s) and the copyright owner(s) are credited and that the original publication in this journal is cited, in accordance with accepted academic practice. No use, distribution or reproduction is permitted which does not comply with these terms.
*Correspondence: Atushi Ishikawa, aXNoaWthd2FAa2FuYXphd2EtZ3UuYWMuanA=
 Atushi Ishikawa
 Shouji Fujimoto
 Takayuki Mizuno