 Zhenhai Xi1†
 Kaiyuan Zheng1†
 Chuantao Zheng1*Haipeng Zhang1
 Fang Song1
 Chunguang Li2*Weilin Ye3Yu Zhang1Yiding Wang1
 Frank K. Tittel4
- 1State Key Laboratory of Integrated Optoelectronics, College of Electronic Science and Engineering, Jilin University, Changchun, China
- 2College of Biological and Agricultural Engineering, Jilin University, Changchun, China
- 3Key Laboratory of Intelligent Manufacturing Technology of Ministry of Education, College of Engineering, Shantou University, Shantou, China
- 4Department of Electrical and Computer Engineering, Rice University, Houston, TX, United States
In this invited paper, a compact dense-pattern multipass cell-based near-infrared sensor system was demonstrated for detection of parts-per-billion in volume (ppbv)-level methane (CH4) and ethane (C2H6). The dimension size of the fabricated gas cell is 18.5 × 8 × 9 cm3 with an absorption path length of 9.39 m. CH4 measurement was realized within a spectral range of 6,046–6,048 cm−1 and an absorption line of 6,046.95 cm−1. The spectral range for C2H6 detection is 5,951–5,953 cm−1 with an absorption line of 5,951.73 cm−1. Allan deviation analysis was used for evaluating the dual-gas sensing performance, and a detection limit of 78 ppbv for CH4 and 190 ppbv for C2H6 were achieved, respectively, with an averaging time of 0.8 s. Furthermore, CH4 measurement in the indoor and outdoor atmosphere was both performed to verify the field sensing capability of the sensor system. Compared with two separate sensor systems for CH4/C2H6 sensing, the proposed dual-gas sensor system using two near-infrared lasers and one multipass cell has the advantages of low-cost, compact-size without decreasing the selectivity and sensitivity.
Introduction
Methane (CH4) and ethane (C2H6) are the two most abundant alkanes in the atmosphere [1–3]. CH4 is widely distributed in nature and is one of the main greenhouse gases. Atmospheric CH4 concentration detection is of great significance for climate research and atmospheric monitoring. CH4 is also the main component of natural gas and biogas. CH4 leakage has become the major safety hazard in the industrial field including coal mines, natural gas transportation and other industries [4–7]. Therefore, it is necessary to monitor the CH4 concentration in real time, so that people can respond and evacuate when leakage occurs.
C2H6 is the second-largest component of natural gas after CH4, which can be treated as a target gas for natural gas leakage monitoring. Also, highly-sensitive C2H6 detection has found applications in human breath analysis as a non-invasive method to identify different diseases [8–10]. CH4 and C2H6 molecules all have absorption peaks in the near-infrared range. Therefore, compact near-infrared laser source can be used for the two gas species detection. Compared with mass spectrometry and gas chromatography, infrared absorption spectroscopy, including photothermal and photoacoustic spectroscopy [11–16], provides a less-costly approach for CH4 and C2H6 concentration detection, and enables real-time measurement without the need for pretreatment or accumulation of target gas samples.
Tunable diode laser absorption spectroscopy (TDLAS) is an effective non-contact method for trace gas detection, which uses a single, narrow-band near-/mid-infrared laser to scan gas absorption peaks with to increase sensitivity and selectivity [17–20]. In TDLAS, an optical absorption cell design is generally based on White [21], Herriott [22, 23] or other multipass cell (MPC) [24, 25]. Compared with White cell, Herriott-based MPC has the advantages of simpler structure and more compact size. In recent years, Herriott MPC has been widely used in various applications [26] and the main development is the change of spot distribution, i.e. from initial single-ring Herriott to dense spot distribution. Herriott-based MPC is widely used in TDLAS sensor systems due to its improvement in effective path length and therefore in gas absorption ability. A dense-pattern (DP)-MPC with a light absorption path length of 26.4 m was designed by Gao et al., and the CH4 measurement accuracy reached 79 parts-per-billion in volume (ppbv) [27]. A mini-MPC with an absorption optical path length of 4.2 m was designed by Dong et al. The optical system is highly integrated, and the CH4 measurement accuracy reached 117 ppbv [28]. The gas absorption coefficient can also be improved by optimizing the Herriott cell configuration. A double-spot ring Heriot cell (DSR-HC) with an optical path length of 20 and 6 m was designed by Zheng et al., respectively. Two different optical paths provide different detection ranges for C2H2 detection. The practicability of the sensor is improved by increasing the detection range of C2H2. The detection limits under the two absorption path lengths were 7.9 parts-per-million in volume (ppmv) and four ppmv, respectively [29].
Most reported MPC-based TDLAS sensor systems were designed for single-gas detection. If they are used to detect multi-gas species, two sets of systems are required, which increases the whole size of the sensor system. Especially in the harsh geographical environment, it is difficult to transport safely and operate normally, which virtually limits the function of the sensor. In order to overcome the above-mentioned issue, a near-infrared dual-gas TDLAS sensor was developed using two distributed feedback (DFB) lasers, i.e. 1654 nm for CH4 and 1,680 nm for C2H6 detection, respectively. Compared to a sensor system based on mid-infrared lasers [30], near-infrared lasers are lower in cost and a sensor system based on such sensors is smaller in size, which is conducive to the integration and commercial use of the sensor system. In addition, in order to further reduce the size of the sensor system, a DP-MPC was developed, with an absorption path length of 9.39 m. Furthermore, a LabVIEW based data-processing system, which consists of a scan signal generator and a signal acquisition module was developed. Such a system can perform the normal operation of driving two DFB lasers as well as extracting the ppbv-level CH4 and C2H6 concentration employing a laptop and a data acquisition (DAQ) card. The practicability of the sensor system was verified by continuous monitoring of the indoor and atmospheric CH4 concentration levels.
Experimental Set-Up
Simulation and Modelling of the Compact MPC
A model of the compact MPC was designed based on MATLAB, and the reflection of light in the cell was simulated using a similar method with Ref. [31]. The radius of curvature of the used spherical mirror is 150 mm with a diameter of 50.8 mm and a mirror reflectivity of >95%. The obtained spot distribution on the two mirrors is shown in Figures 1A,B, where the first 20 reflection points are labeled. On mirror A, the injection hole (IH) shown as a blue circle is labeled as 0, the second reflection point is labeled 2, the third is labeled 4, the fourth is labeled 6, and so on. The connection of the first ten reflection points (numbered as 0, 2, … , 18) will form the first ellipse. The next ten reflection points (numbered as 20, 22, … 38) will be offset clockwise, and also the connection between them forms the second ellipse. It can be seen that the second ellipse can be treated as the clockwise rotation of the first ellipse. A similar distribution can be found on mirror B. All the reflection points and the formed rings on mirror A and mirror B are found to rotate clockwise to form the spot distribution. When the light is reflected for the 809th on mirror B, it escapes through the injection hole on mirror A. There are 810 reflections between the mirrors, 40 and a half ellipses and five rings are formed on each mirror. Eq. 1 is used to calculate the total optical path length
where (xi, yi, zi) is the coordinates of the ith reflection point, and N = 810 is the total reflection number. Due to the limitation in laser power and the mirror reflection loss, the signal derived by output from the detector cannot be large with too many reflections. Therefore, the laser beam was designed to exit in advance with 76 reflections. As shown in the model in Figures 1C,D, when the light is reflected for the 76th time, it escapes through the designed ejection hole (EH) on mirror B, reaches the detector for optoelectrical conversion, and the derived electrical signal enters a data acquisition (DAQ) card for data processing. The total optical path length with 76 reflections was calculated to be 9.36 m through simulation.
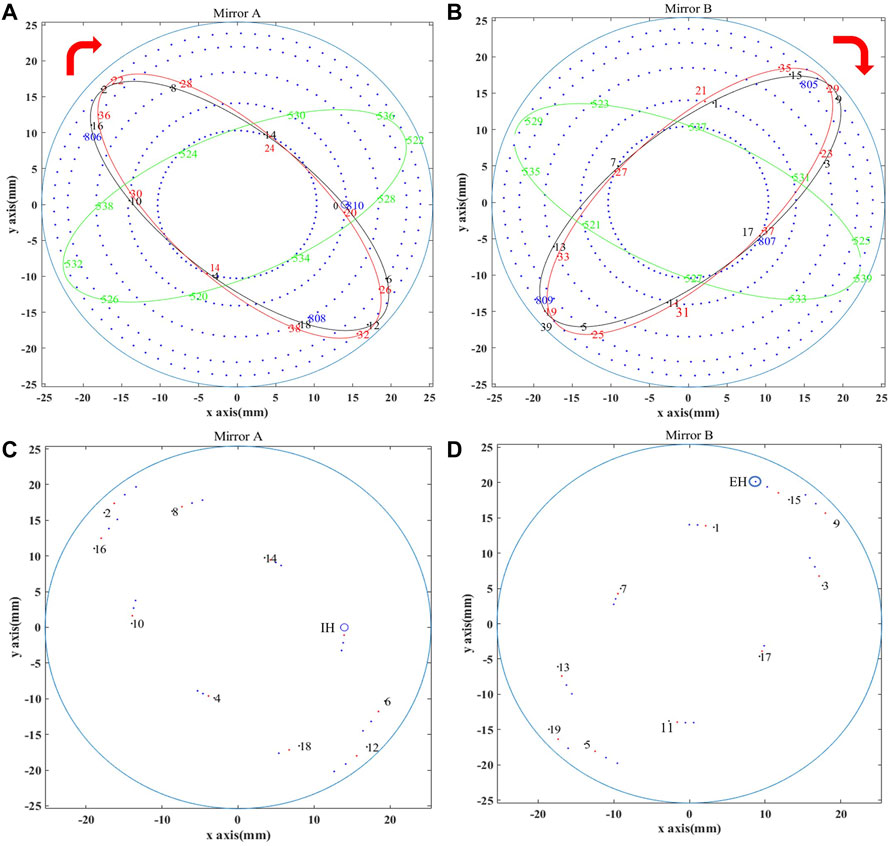
FIGURE 1. Complete spot distribution of (A) Mirror A and (B) Mirror B in simulation. Spot distribution of (C) Mirror A and (D) Mirror B in simulation with mirror refraction.
According to the designed model and optimized parameters, a compact MPC with 76 reflections was fabricated, whose photo is shown in Figure 2A. The spot distribution of the mirror shown in the inset was obtained using a He-Ne laser as a trace laser, which basically coincides with the simulated spot distribution in Figure 1D. The external dimension size of the fabricated gas cell is 18.5 × 8 × 9 cm3 with an internal volume of 683.9 mL. Two optical windows (i.e. CaF2 lens) were placed at both sides with the same aperture as the reflection mirror, and the groove where the window is placed was designed to tilt 15° to prevent the infrared light from directly reflecting into the laser collimator resulting in laser damage. An air inlet and outlet were equipped on the gas cell, separately for gas injection and ejection, and the whole gas chamber was sealed for a good gas tightness. Glass glue was used to fix the optical window at both ends of the MPC, and the upper opening was sealed with a sealing ring to ensure air tightness. With a sealing detection, the air leakage rate was measured to be 2.4 × 10⁻³ TorrL/s.
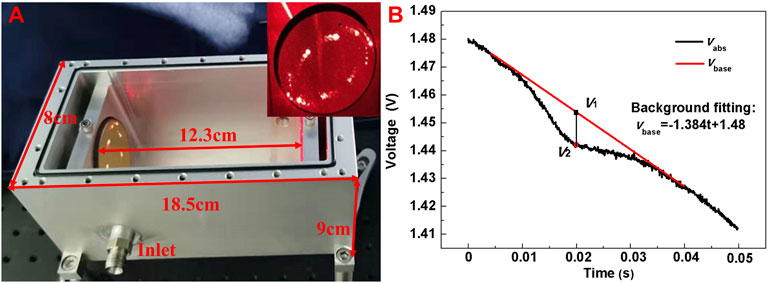
FIGURE 2. (A) Photograph of the fabricated multi-pass cell design with an external size of 18.5 × 8 × 9 cm3 and a physical spot distribution of Mirror B in the inset (B) Measured CH4 absorption signal (black curve) with the compact MPC at a concentration level of 20 ppmv. The red curve shows the background fitting signal.
To determine the actual effective optical path length, a saw-tooth scan signal with a frequency of 50 Hz was used to change the current of the DFB laser and a CH4 sample with a concentration level of 20 ppmv was injected into the compact MPC. The output signal from the detector with CH4 absorption, defined as vabs(t), is shown in Figure 2B. The red line is the background fitting signal, expressed as vbase(t). A differential signal can be obtained by subtracting vabs from vbase, which represents gas absorption. The maximum absorption (i.e. vbase–vabs) occurred at t = 0.1986 s and the corresponding voltage (V2 = vabs (t = 0.1986 s)) is 1.443 V. The non-absorption voltage (V1 = vbase (t = 0.1986 s)) is 1.453 V. Then the absorbance (α) can be calculated from Eq. 2, as
According to Eq. 2, the absorbance is 0.0069, and the actual total optical path is determined to be 9.39 m by referring to the high-transmission (HITRAN) molecular absorption database, which are highly consistent with the simulation result of 9.36 m.
Sensor Structure Design
An overall sensor system structure is shown in Figure 3, which is divided into three parts, including an optical part, an electrical part and a gas sampling part. In the optical part, two near-infrared DFB lasers were used as the excitation source for the detection of CH4 and C2H6. In order to facilitate the optical path establishment, the two lasers followed the same light propagation path. For CH4 detection, the laser operating temperature was set to 20°C, and the center current was set to 84 mA for targeting the absorption line at 6046.95 cm−1. For C2H6 detection, the laser was operated at 26°C with a center current of 90 mA for targeting the absorption line at 5951.73 cm−1. The emitted infrared laser beams were combined and the collimated laser beam enters the MPC through an optical fiber collimator. A fiber adapter as well as an optical switch can be used to automatically exchange the 1,654 nm and 1,680 nm laser for different gas detection. Because of the loss resulting from light reflection, the light power will be reduced after multiple reflections. An off-axis parabolic lens was therefore added at the exit to focus the light intensity, and then the signal amplitude output from a Ge transimpedance photodetector was increased. The electrical part included a laptop (HP model BH872PHB), a DAQ card (Model USB-6211, National Instrument, United States ), two current and temperature integrated drive modules (LDTC0520, Wavelength, United States ). Laser direct absorption spectroscopy (LDAS) technique was used for CH4 and C2H6 dual-gas detection, which is easy to realize and suitable for portable applications, compared to wavelength modulation spectroscopy (WMS). A scan signal was generated by the DAQ card controlled by the LabVIEW platform to drive the DFB laser. The output signal from the detector was sampled by the DAQ card, and synchronous sampling was realized triggered by the signal generation module. With respect to the gas sampling module, the MPC was equipped with an inlet and an outlet, allowing gas flow during measurements. CH4/C2H6:N2 mixtures were diluted from a standard 50 ppmv CH4 sample and a 100 ppmv C2H6 sample in N2 using a commercial gas mixing system (Series 4,000, Environics).
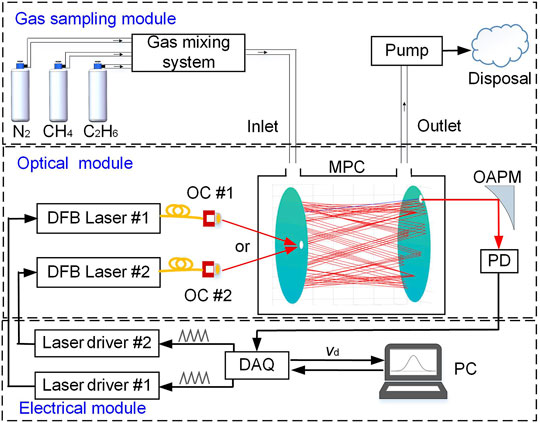
FIGURE 3. Structural diagram of the CH4/C2H6 dual-gas sensor system, consisting of an electrical part, an optical part and a gas sampling part. PC: Personal computer PD: Photodetector, MPC: Multipass cell, OAPM: Off-axis parabolic mirror, DAQ: Data acquisition, DFB: Distributed feedback laser, and laser driver includes temperature controller and current driver.
Dual-Gas Sensor Performance
Absorption Lines Selection for CH4 and C2H6
The selected absorption line of CH4 is shown in Figure 4A. According to the simulation results of HITRAN, under the conditions of temperature of 300 K, pressure of 760 Torr and optical path length of 1 m, the absorbance of CH4 at a concentration level of two ppmv and H2O at a concentration level of 2% were obtained. It can be seen that when the H2O concentration is high, it will have a certain influence on the detection of CH4. Therefore, a dehumidification treatment was performed in the gas inlet to reduce the interference of H2O. CH4 has a strong absorption line located at 6046.95 cm−1. Accordingly, we chose the laser emission wavelength range of 6046–6048 cm−1 for CH4 detection. Figure 4C shows the current variation within the selected wavenumber range when the temperature of the DFB laser is 19°C, 20 and 21°C. In Figure 4E, the emission spectrum under a laser driving current of 10–120 mA was measured at 20°C. In order to cover the CH4 absorption line, the laser temperature was set at 20°C and the central current at 84 mA.
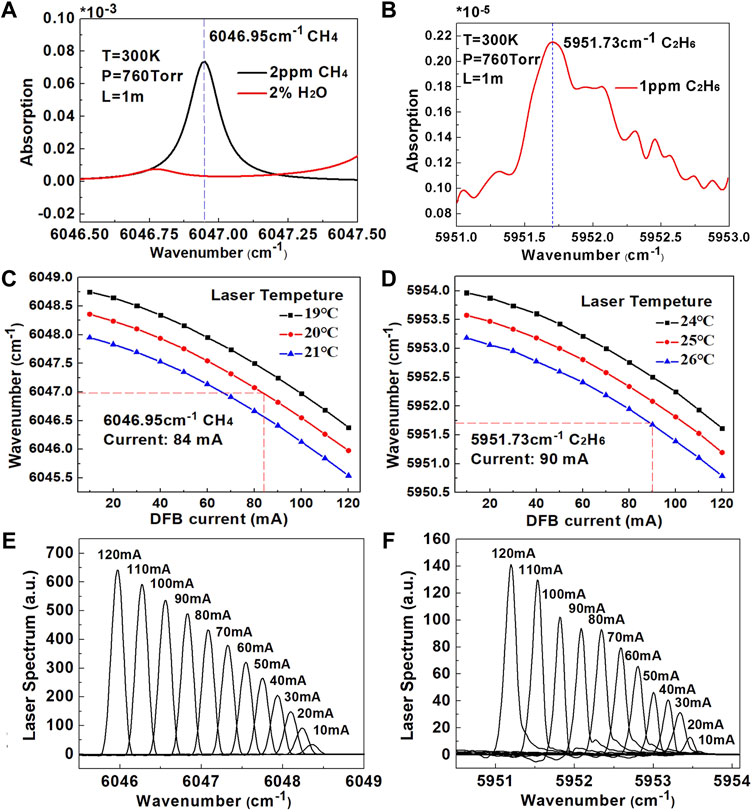
FIGURE 4. (A) The simulated absorbance of 2% H2O, two ppmv CH4 from 6046.5 cm−1 to 6047.5 cm−1 at a temperature of 300 K, a pressure of 760 Torr, and an optical path length of 1 m (B) The simulated absorbance of one ppmv CH4 from 5,951 cm to 1 to 5,953 cm-1 at a temperature of 300 K, a pressure of 760 Torr, and an optical path length of 1 m (C) Plot of the DFB emission wavenumber as a function of the current at laser temperatures of 19°C, 20°C and 21°C, respectively (D) Plot of the DFB emission wavenumber as a function of the current at laser temperatures of 24°C, 25 and 26°C, respectively (E) Emission spectrum at 20°C of the DFB laser for CH4 detection (F) Emission spectrum at 26°C of the laser for C2H6 detection.
The selected C2H6 absorption line is shown in Figure 4B. According to the simulation results of HITRAN, under the condition of temperature of 300 K, pressure of 760 Torr and optical path length of 1m, the C2H6 absorption line with one ppmv concentration was obtained. C2H6 has a strong absorption line at 5,951.73 cm−1, and the selected wavenumber range is 5,951–5,953 cm−1 for C2H6 detection. Figure 4D shows the current variation in the selected wavenumber range at a laser temperature of 24°C, 25 and 26°C. The laser drive temperature was set at 26°C, and the central current was 90 mA for C2H6 detection. In Figure 4F, the emission spectrum of the laser under a current of 10–120 mA was measured at a temperature of 26°C.
CH4 Sensor Performance
The measured amplitude of the differential signal of CH4 (i.e. vd = vbase–vabs) at different concentration levels of 0, 5, 10, 15 and 20 ppmv is shown in Figure 5A. In order to speeding the response of the sensor, a high sampling frequency was adopted, and one data point was acquired per 0.8 s. The amplitude (defined as Amp(vd), in V) at each concentration was recorded for 40 s, leading to 50 points. The average value of these 50 data was used to obtain the linear relationship between CH4 concentration and the amplitude, as shown in Figure 5B. The linear relationship is expressed by Eq. 3 with a good linear fitting degree of 99.97%, as
where CCH4 (in ppmv) is the concentration of CH4. Then, the CH4 sample with a concentration of 0 ppmv was injected into the MPC to observe the stability of the whole system, and the overall observation time was ∼16 min. The sampled signal amplitude was substituted in Eq. 3 to calculate the corresponding CH4 concentration levels. Curve of CH4 concentration level changing with measurement time is shown in Figure 5C, which is relatively stable overall and verifies the reliability of the whole sensor system. The measured concentration was then used for Allan variance analysis to obtain the detection limit of the CH4 sensor, as shown in Figure 5D. The first data point is the minimum concentration that can be detectable, which indicates that the 1σ detection limit of CH4 is 71 ppbv at an averaging time of 0.8 s. As integration time increases, system noise occurs leading to the decrease of sensor stability. This type of noise is the sensor system drift, mainly originating from the drift of the near-infrared detector, the laser power and wavelength as well as the electrical circuits for signal processing.
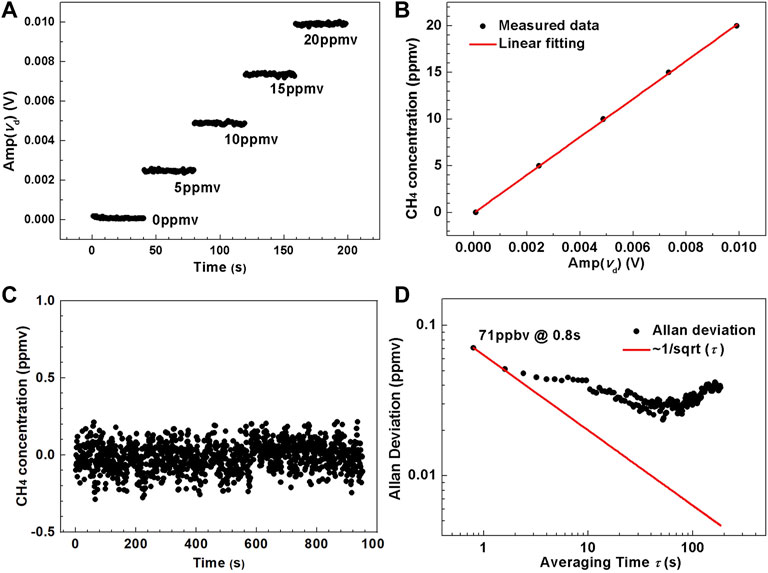
FIGURE 5. (A) Measured amplitude of the differential absorption signal versus calibration time t under different CH4 concentration levels ranging from 0 to 20 ppmv (B) Experimental data and fitting curve of CH4 concentration versus the averaged amplitude of the differential absorption signal. (C) Measured CH4 concentration by passing pure N2 into the compact MPC. (D) Allan-Werle deviation plot as a function of averaging time, τ, based on the data shown in Figure 6C.
The response time of the sensor system for CH4 detection was determined by the measured time that was needed for the CH4 concentration exchange between 0 ppmv and 10 ppmv. The sampling time for each data point was 0.8 s, as shown in Figure 6. Several repeated experiments were done to change the concentration level either from 0 ppmv to 10 ppmv or from 10 ppmv to 0 ppmv for multiple times. At each time the concentration became stable, 40 points were recorded. The response time was measured to be 4 s.
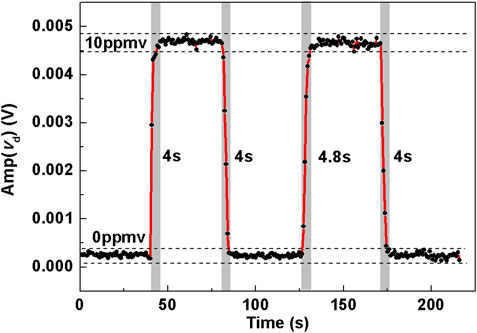
FIGURE 6. Pure N2 and 10 ppmv CH4 were injected into the compact MPC in turn to obtain the rise time and fall time of the sensor for CH4 detection.
C2H6 Sensor Performance
As shown in Figure 7A, the measured amplitude (Amp(vd)) of C2H6 at six different concentration levels of 0, 2, 4, 6, 8, and 10 ppmv were obtained. A data point was derived per 0.8 s, and the total time for recording the amplitude at each concentration was 40 s. The linear relationship between C2H6 concentration CC2H6 (in ppmv) and Amp(vd) (in V) was obtained as shown in Figure 7B, expressed as
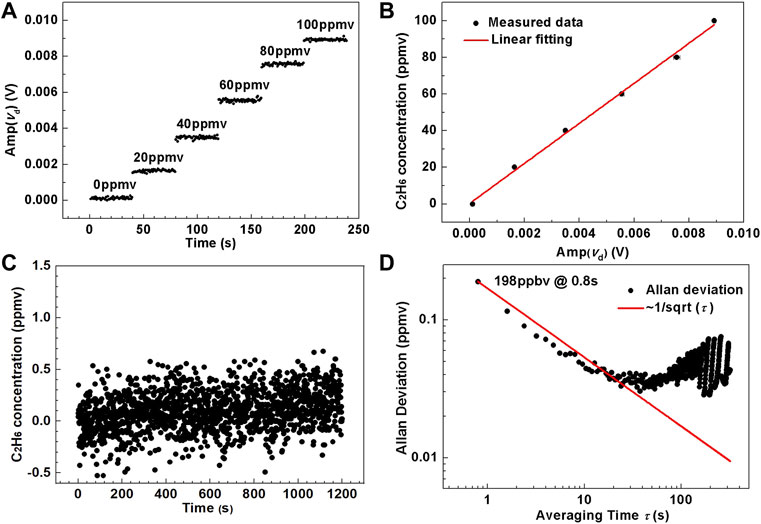
FIGURE 7. (A) Measured amplitude of the differential absorption signal versus calibration time t under different C2H6 concentration levels ranging from 0 to 100 ppmv. (B) Experimental data and fitting curve of C2H6 concentration versus the averaged amplitude of the differential absorption signal. (C) Measured C2H6 concentration by passing pure N2 into the compact MPC. (D) Allan-Werle deviation plot as a function of averaging time, τ, based on the data shown in Figure 7C.
Then the C2H6 concentration was set to 0 ppmv to observe the stability of the whole system, and the overall observation time was 18 min. The real-time C2H6 amplitude was substituted into Eq. 4 to calculate the corresponding concentration. The variation of C2H6 concentration with time is shown in Figure 7C, which proved the overall stability and verified the reliability of the whole sensor system. The obtained concentration was used for Allan variance analysis, and the C2H6 detection limit of the sensor system was achieved, as shown in Figure 7D. The first point is the minimum concentration detected, and the subsequent data is the deviation value, which indicates that the limit of detection of C2H6 is 189 ppbv at an averaging time of 0.8 s.
Then, the response characteristics of the dual-gas sensor system for C2H6 detection was determined by measuring the response time by switching the C2H6 concentration level between 0 ppmv and 100 ppmv. The sampling time for each data point was 0.8 s. The response time from 0 ppm to 100 ppmv for the first concentration exchange was about 16 s. Then several repeated experiments were done, that is, either from 0 ppmv to 100 ppmv or from 100 ppmv to 0 ppmv. 40 data points were recorded each time when the measured concentration was stabilized. As shown in Figure 8, The measured response time was maintained at 16–20 s.
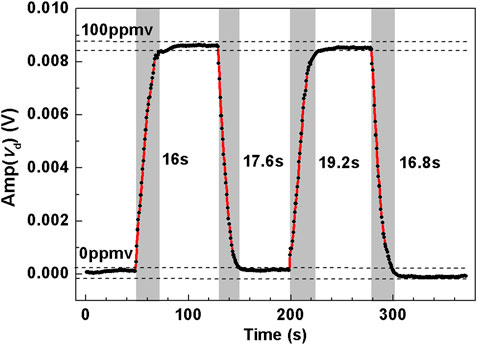
FIGURE 8. Dynamic measurement by injecting pure N2 and 100 ppmv C2H6 into the compact MPC in turn to obtain the rise time and fall time of the sensor for C2H6 detection.
Field Sensing Application
In order to verify the performance and practicability of the sensor, the demonstrated dual-gas sensor system was used to monitor the CH4 concentration levels in the laboratory and the CH4 concentration levels in the outdoor atmosphere.
Indoor CH4 Monitoring
The sensor system was evaluated by measuring the indoor CH4 concentration levels in a laboratory environment on 4 January 2021 between 2:00 p.m. and 3:20 p.m. The laboratory is located at Tang Aoqing building (GPS position, 125.291,448◦ E, 43.831,747◦ N) of Jilin University, Changchun, Jilin Province, China. The total measurement duration was 1.2 h with a sampling interval of 0.8 s (i.e. no averaging on the sampling data). As shown in Figure 9, fluctuations in CH4 concentration levels were observed during the measurement from 1.5 ppmv to 2.2 ppmv, and the concentration of CH4 showed an average of ∼1.86 ± 0.17 ppmv (1σ). Since the air circulation in the laboratory was relatively slow, the change of CH4 concentration was not obvious. It thus can be observed that the CH4 concentration level in the laboratory was relatively stable during this period.
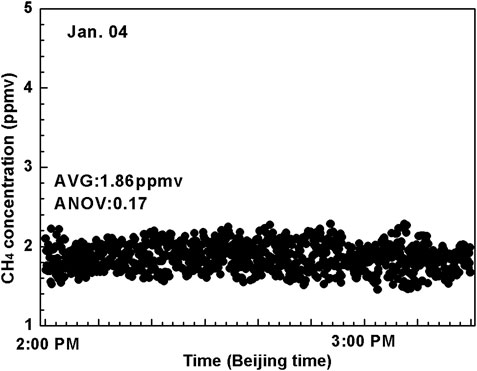
FIGURE 9. Measured concentrations of CH4 in ambient air during ∼1.2 h period on 4 Jan 2021 inside the laboratory (located in Tang Aoqing building, Jilin University).
Outdoor Atmospheric CH4 Monitoring
The sensor system was re-evaluated by measuring the outdoor CH4 concentration levels in the atmosphere. The outside air was pumped into the gas cell via a Poly Tetra Fluoroethylene (PTFE) for outdoor atmospheric CH4 testing. Pre-treatment was carried out before the atmosphere enters the gas cell to remove ambient impurities, aerosols and water vapor. The outside air was pumped into the gas cell via a PTFE filtered tube to detect the outdoor CH4 concentration levels for 1 day. The measurement was conducted in zone D, Tang Aoqing building, Jilin University, Changchun, and the measurement time was from 4:40 p.m. on 4 January 2021 to 4:40 p.m. on 5 January 2021. The sampling data was averaged per 40 s (i.e. 50 data points were averaged as one data point). As shown in Figure 10, it can be concluded from the variation trend that the CH4 concentration decreased at night and was eventually down to 2.2 ppmv–2.3 ppmv. The CH4 concentration level suddenly increased at 10:00 a.m. with a peak up to 2.7 ppmv and was eventually around 2.6 ppmv at 4:00 p.m. in the next day. Over the 1 day, the measured CH4 concentration ranged between 2.2 and 2.8 ppmv, with an average value of 2.42 ± 0.19 ppmv.
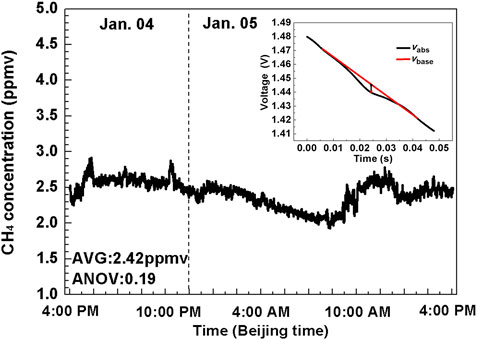
FIGURE 10. Measurement results of CH4 monitoring in the atmosphere for ∼24 h time duration on the Jilin University campus. The inset shows the waveform of a recorded absorption signal.
Conclusion
A dense-pattern MPC-based near-infrared sensor system was demonstrated for CH4/C2H6 dual-gas detection. Two laser beams were injected into the MPC with an effective path length of 9.39 m. Both indoor and outdoor CH4 concentration levels were measured to verify the performance of the sensor system. Compared with the traditional single-ring Herriott cell, the volume of the DP-based gas cell is obviously reduced and the optical path becomes longer by increasing the reflection number, and the reduced size leads to an enhanced stability and high sensitivity. Compared with a single-gas sensor, the size of the developed dual-gas sensor system becomes smaller and more convenient for field detection. The dual-gas sensor system extends the application of MPC in the field of infrared absorption spectroscopic gas sensing. Further optimization of optical path will be carried out to improve the sensitivity of C2H6 detection, so as to monitor the ppb-level C2H6 in the atmosphere.
Data Availability Statement
The original contributions presented in the study are included in the article/supplementary material further inquiries can be directed to the corresponding authors.
Author Contributions
ZX and KZ performed the experiments and wrote the manuscript. CZ and YW supported the experiments and revised the manuscript. HZ. analyzed and verified the experimental results. FS, CL, WY, YZ, YW, and FT provided technical guidance and helped to revise the paper. The manuscript was written through contributions of all authors. All authors have given approval to the final version of the manuscript.
Funding
National Natural Science Foundation of China (Nos. 61960206004, 61805099, and 62175087), Science and Technology Development Program of Jilin Province, China (Nos. 20200401059GX and 20200201228JC), Science and Technology Research Program of Department of Education, Jilin Province, China (No. JJKH20211088KJ), Key R and D Program of Changchun (No. 21ZGN24), Program for JLU Science and Technology Innovative Research Team (JLUSTIRT, 2021TD-39).
Conflict of Interest
The authors declare that the research was conducted in the absence of any commercial or financial relationships that could be construed as a potential conflict of interest.
Publisher’s Note
All claims expressed in this article are solely those of the authors and do not necessarily represent those of their affiliated organizations, or those of the publisher, the editors and the reviewers. Any product that may be evaluated in this article, or claim that may be made by its manufacturer, is not guaranteed or endorsed by the publisher.
References
1. Jin W, Bao H, Zhao P, Zhao Y, Qi Y, Wang C, et al. Recent Advances in Spectroscopic Gas Sensing with Micro/Nano-Structured Optical Fibers. Photonic Sens (2021) 11(2):141–57. doi:10.1007/s13320-021-0627-4
2. Zhu X, Xu F, He Q, Xing Z, Zhang S, Zhang X. Detection of Intermediates for Diatomic [TaO]+ Catalyzed Gas-Phase Reaction of Methane Coupling to Ethane and Ethylene by ICP-MS/MS. Microchemical J (2021) 161:105762. doi:10.1016/j.microc.2020.105762
3. Liu X, Qiao S, Ma Y. Highly Sensitive Methane Detection Based on Light-Induced Thermoelastic Spectroscopy with a 2.33 µm Diode Laser and Adaptive Savitzky-Golay Filtering. Opt Express (2022) 30(2):1304–13. doi:10.1364/OE.446294
4. Bamberger I, Stieger J, Buchmann N, Eugster W. Spatial Variability of Methane: Attributing Atmospheric Concentrations to Emissions. Environ Pollut (2014) 190:65–74. doi:10.1016/j.envpol.2014.03.028
5. Zheng H, Liu Y, Lin H, Kan R, Patimisco P, Sampaolo A, et al. Sub-ppb-level CH4 Detection by Exploiting a Low-Noise Differential Photoacoustic Resonator with a Room-Temperature Interband cascade Laser. Opt Express (2020) 28(13):19446–56. doi:10.1364/OE.391322
6. Hevia MAG, Ordóñez S, Díez FV. Effect of the Catalyst Properties on the Performance of a Reverse Flow Reactor for Methane Combustion in Lean Mixtures. Chem Eng J (2007) 129(1−3):1–10. doi:10.1016/j.cej.2006.10.028
7. Kamieniak J, Randviir EP, Banks CE. The Latest Developments in the Analytical Sensing of Methane. Trac Trends Anal Chem (2015) 73:146–57. doi:10.1016/j.trac.2015.04.030
8. Li C, Dong L, Zheng C, Lin J, Wang Y, Tittel F. Ppbv-Level Ethane Detection Using Quartz-Enhanced Photoacoustic Spectroscopy with a Continuous-Wave, Room Temperature Interband cascade Laser. Sensors (2018) 18(3):723. doi:10.3390/s18030723
9. Etiope G, Ciccioli P. Earth's Degassing: A Missing Ethane and Propane Source. Science (2009) 323(5913):478. doi:10.1126/science.1165904
10. Chen F, Jiang S, Jin W, Bao H, Ho HL, Wang C, et al. Ethane Detection with Mid-infrared Hollow-Core Fiber Photothermal Spectroscopy. Opt Express (2020) 28(25):38115–26. doi:10.1364/OE.410927
11. Ma Y, Hu Y, Qiao S, Lang Z, Liu X, He Y, et al. Quartz Tuning Forks Resonance Frequency Matching for Laser Spectroscopy Sensing. Photoacoustics (2022) 25:100329. doi:10.1016/j.pacs.2022.100329
12. Lin H, Zheng H, Montano BAZ, Wu H, Giglio M, Sampaolo A, et al. Ppb-Level Gas Detection Using On-Beam Quartz-Enhanced Photoacoustic Spectroscopy Based on a 28 kHz Tuning fork. Photoacoustics (2022) 25:100321. doi:10.1016/j.pacs.2021.100321
13. Ma Y, Hong Y, Qiao S, Lang Z, Liu X. H-Shaped Acoustic Micro-Resonator-Based Quartz-Enhanced Photoacoustic Spectroscopy. Opt Lett (2022) 47(3):601–4. doi:10.1364/OL.449822
14. Lv H, Zheng H, Liu Y, Yang Z, Wu Q, Lin H, et al. Radial-Cavity Quartz-Enhanced Photoacoustic Spectroscopy. Opt Lett (2021) 46(16):3917–20. doi:10.1364/OL.432308
15. Ma Y. Recent Advances in QEPAS and QEPTS Based Trace Gas Sensing: A Review. Front Phys (2020) 8:268. doi:10.3389/fphy.2020.00268
16. Liu X, Ma Y. Sensitive Carbon Monoxide Detection Based on Light-Induced Thermoelastic Spectroscopy with a Fiber-Coupled Multipass Cell [Invited]. Chin Opt Lett (2022) 20(3):031201. doi:10.3788/COL202220.031201
17. Wang F, Jia S, Wang Y, Tang Z. Recent Developments in Modulation Spectroscopy for Methane Detection Based on Tunable Diode Laser. Appl Sci (2019) 9(14):2816. doi:10.3390/app9142816
18. Upadhyay A, Wilson D, Lengden M, Chakraborty AL, Stewart G, Johnstone W. Calibration-Free WMS Using a Cw-DFB-QCL, a VCSEL, and an Edge-Emitting DFB Laser with In-Situ Real-Time Laser Parameter Characterization. IEEE Photon J. (2017) 9(2):6801217. doi:10.1109/JPHOT.2017.2655141
19. Lan L, Ghasemifard H, Yuan Y, Hachinger S, Zhao X, Bhattacharjee S, et al. Assessment of Urban CO2 Measurement and Source Attribution in Munich Based on TDLAS-WMS and Trajectory Analysis. Atmosphere (2020) 11(1):58. doi:10.3390/atmos11010058
20. Sur R, Sun K, Jeffries JB, Hanson RK, Pummill RJ, Waind T, et al. TDLAS-Based Sensors for In Situ Measurement of Syngas Composition in a Pressurized, Oxygen-Blown, Entrained Flow Coal Gasifier. Appl Phys B (2014) 116(1):33–42. doi:10.1007/s00340-013-5644-6
21. White JU. Long Optical Paths of Large Aperture. J Opt Soc Am (1942) 32(5):285–8. doi:10.1364/JOSA.32.000285
22. Herriott DR, Schulte HJ. Folded Optical Delay Lines. Appl Opt (1965) 4(8):883–9. doi:10.1364/AO.4.000883
23. Herriott D, Kogelnik H, Kompfner R. Off-Axis Paths in Spherical Mirror Interferometers. Appl Opt (1964) 3(4):523–6. doi:10.1364/AO.3.000523
24. McManus JB, Kebabian PL, Zahniser MS. Astigmatic Mirror Multipass Absorption Cells for Long-Path-Length Spectroscopy. Appl Opt (1995) 34(18):3336–48. doi:10.1364/AO.34.003336
25. Cui R, Dong L, Wu H, Li S, Yin X, Zhang L, et al. Calculation Model of Dense Spot Pattern Multi-Pass Cells Based on a Spherical Mirror Aberration. Opt Lett (2019) 44(5):1108–11. doi:10.1364/OL.44.001108
26. Tarsitano CG, Webster CR. Multilaser Herriott Cell for Planetary Tunable Laser Spectrometers. Appl Opt (2007) 46(28):6923–35. doi:10.1364/AO.46.006923
27. Liu K, Wang L, Tan T, Wang G, Zhang W, Chen W, et al. Highly Sensitive Detection of Methane by Near-Infrared Laser Absorption Spectroscopy Using a Compact Dense-Pattern Multipass Cell. Sensors Actuators B: Chem (2015) 220:1000–5. doi:10.1016/j.snb.2015.05.136
28. Cui R, Dong L, Wu H, Ma W, Xiao L, Jia S, et al. Three-Dimensional Printed Miniature Fiber-Coupled Multipass Cells with Dense Spot Patterns for Ppb-Level Methane Detection Using a Near-IR Diode Laser. Anal Chem (2020) 92(19):13034–41. doi:10.1021/acs.analchem.0c01931
29. Dong M, Zheng C, Yao D, Zhong G, Miao S, Ye W, et al. Double-Range Near-Infrared Acetylene Detection Using a Dual Spot-Ring Herriott Cell (DSR-HC). Opt Express (2018) 26(9):12081–91. doi:10.1364/OE.26.012081
30. Ye W, Li C, Zheng C, Sanchez NP, Gluszek AK, Hudzikowski AJ, et al. Mid-Infrared Dual-Gas Sensor for Simultaneous Detection of Methane and Ethane Using a Single Continuous-Wave Interband cascade Laser. Opt Express (2016) 24(15):16973–85. doi:10.1364/OE.24.016973
Keywords: infrared absorption, dual-gas detection, laser absorption spectroscopy, multi-pass cell, atmospheric gas monitoring
Citation: Xi Z, Zheng K, Zheng C, Zhang H, Song F, Li C, Ye W, Zhang Y, Wang Y and Tittel FK (2022) Near-Infrared Dual-Gas Sensor System for Methane and Ethane Detection Using a Compact Multipass Cell. Front. Phys. 10:843171. doi: 10.3389/fphy.2022.843171
Received: 25 December 2021; Accepted: 28 January 2022;
Published: 04 March 2022.
Edited by:
Yufei Ma, Harbin Institute of Technology, ChinaCopyright © 2022 Xi, Zheng, Zheng, Zhang, Song, Li, Ye, Zhang, Wang and Tittel. This is an open-access article distributed under the terms of the Creative Commons Attribution License (CC BY). The use, distribution or reproduction in other forums is permitted, provided the original author(s) and the copyright owner(s) are credited and that the original publication in this journal is cited, in accordance with accepted academic practice. No use, distribution or reproduction is permitted which does not comply with these terms.
*Correspondence: Chuantao Zheng, emhlbmdjaHVhbnRhb0BqbHUuZWR1LmNu; Chunguang Li, bGljaHVuZ3VhbmdAamx1LmVkdS5jbg==
†These two authors contributed equally to this research work