- 1Equipment Management and UAV Engineering College, Air Force Engineering University, Xi’an, China
- 2School of Automation, Northwestern Polytechnical University, Xi’an, China
- 3Xinjiang Institute of Engineering, Urumqi, China
- 4School of Cyberspace Security, Xi’an University of Posts and Telecommunications, Xi’an, China
UAV swarm are often subjected to random interference or malicious attacks during the execution of their tasks, resulting in UAV failure or communication interruption. When the UAV swarm is out of interference or the repair command is executed, the performance of the UAV swarm will be restored to a certain extent. However, how to measure the changes of UAV swarm’s performance during this process will be very important, and it is also crucial to determine whether the UAVs can continue to perform its mission. Based on this motivation, we propose a resilience assessment framework for UAV swarm considering load balancing after UAV swarm suffer from disturbances. We analyze the effects of different topologies and different parameters on the resilience of UAV swarm. The study found that attack intensity is the most important factor affecting UAV swarm performance. As the attack intensity increases, the performance of the UAV swarm decreases rapidly. At the same time, topology also has a very important impact on UAV swarm resilience.
Introduction
The extensive use of unmanned aerial vehicles (UAV) improves the convenience of mission execution and reduces the cost of completing missions. Meanwhile, it allows the execution of boring and dangerous tasks without causing unnecessary risks to humans [1]. With the increasing maturity of UAV manufacturing technology and the relative reduction of manufacturing costs, more and more people are interested in using UAVs to perform various tasks. For example, power maintenance, water and soil supervision, high-voltage tower fault line inspection, construction site survey, forest patrol and fire prevention, environmental inspection, oil and gas pipeline inspection and search and rescue, UAV express, traffic monitoring, etc. [2–4]. At this stage, one of the important application trends of UAVs is UAV swarms (especially military) [5]. In the swarm, a lot of small UAVs complete the set tasks through machine-machine coordination. Once individuals are concerned, each UAV has its own mission and needs to coordinate with other UAVs. Therefore, the local organizational structure is loose. Generally, the UAV swarm needs to be affected by the environment (Threats) for perception, assessment, and response. All UAVs are required to participate in this process. Therefore, the overall organizational structure is tight. In summary, UAV swarms need to be highly resilience in terms of link connection, communication, and recovery to realize the information exchange network [6]. Therefore, the UAV swarm be regarded as an information exchange network (IE network) in this article. The IE network can be represented by a graph. UAVs are nodes in the graph, and the information exchange links between UAVs represent edges in the graph.
To date, a UAV swarm can consist of hundreds of UAVs. Although the scale of UAV swarms is increasing, there are few studies on its resilience. At this stage, the research on UAV swarms is mainly focused on survivability [7]. The survivability is considered to be that UAV swarms have different attack strengths and different attack methods (malicious attacks, random failures). The ability of the system to complete tasks normally is used to evaluate the ability of UAV swarms to perform tasks after being attacked (interference). Specifically, some research network survivability indicators have been developed and used to measure the performance of UAV systems, including natural connectivity and maximum connected subgraphs. In the above research, the damage of UAV nodes and link interference are considered irreversible.
When UAV swarms are used to monitor military targets and harsh environments, they will encounter unpredictable difficulties in these dangerous environments, which often cause UAV nodes or links to fail. Although sometimes failed nodes and links can be repaired, the mission fails due to the inability to assess the degree of UAV recovery. Under this condition, historical fault data cannot help people improve the performance of UAV swarms. In order to improve the success rate of UAV swarm mission execution, in traditional methods, it is necessary to improve the robustness of UAV components to reduce the failure rate of nodes or increase redundant nodes or links (as described in the previous section). It will increase the cost of UAV swarms, which is undesirable. On the contrary, the UAV swarm considers that the performance recovery in the event of damage will be more executable. Resilience provides new methods for engineering and system design, and characterizes the ability of the system to resist the influence of uncertain factors and the ability to recover afterwards. Therefore, it is of great significance to introduce the resilience index into the performance measurement of the UAV swarm.
However, there are few researches on the resilience of UAV swarms. In the UAV swarm, when some UAV nodes fail due to interference, the swarm often uses load balancing methods to assign the tasks of the failed nodes to the normal nodes according to established rules (the degree of the nodes is considered in the article), which can improve the resilience and usability of UAV swarms. However, when the node is overloaded, it will reduce the efficiency of the normal node and affect the performance of the UAV swarm. Therefore, it is important to analyze the impact of load balancing on the resilience of UAV swarm. Based on the above motivation, we propose a method for measuring the resilience of UAV swarms considering load balancing, and establish a UAV swarm performance model, give a UAV swarm load distribution model, and the variation of UAV swarm resiliency under different topologies and parameters is analyzed. The research motivation of the article will be given in the first section. In the second section, we continue to introduce the current situation of resilience research. In the third section, we establish the UAV swarm resiliency evaluation model, and conducted a verification analysis in the fourth section. The conclusion will be given in the fifth section.
Related Works
Resilience comes from the related fields of materials and mechanics. Which refers to one thing to deform after being affected by outside, and to return to its original shape when the effect disappears [8]. Due to the ubiquity of the system, the concept of resilience is widely used in different disciplines. Although they own different definitions, the resilience system is generally considered the ability to resist external influences and recover quickly. Compared with similar concepts such as invulnerability, robustness, reliability [9–12], the research focuses more on the degree of change and recovery speed of the system after being affected by outside.
When resilience proposed, it has attracted lots of attention. In recent years, people consider the research on resilience one of the hot topics in the scientific research field [13–15]. We have gradually realized that various systems that humans rely on are vulnerable to various disasters and exhibit vulnerabilities. Once the system is affected, it will require a long recovery process, and it may not even be able to recover to its original state. For example, it is estimated that the virus COVID-19 has caused tens of trillions of dollars in economic losses around the world [16], and nuclear pollution caused by a leak at the nuclear power plant in Fukushima, Japan, will continue for 30 years or more [17]. So research on system resilience is particularly important. It is necessary for scholars to carry out research on system resilience design and effects. We hope that resilience research can improve the ability of various systems to withstand emergencies, so as to avoid secondary disasters. So research on resilience has attracted extensive attention from researchers in different fields, such as the resilience of transportation networks, supply systems, and supply chains.
The infrastructure system is generally resilience [18, 19] in transportation, more and more people concern the resilience of roads. For transportation, resilience is defined as “the system’s ability to maintain its proven service level or restore itself to that service level within a specified time frame” [20–22]. Current research on the resilience of transportation networks focuses on the measurement of resilience. Some researchers use the synonyms of robustness [23], redundancy [24], reliability or fragility [25], and they also use total traffic delays, economic losses, maximum post-disaster flow, and autonomous system components measure the resilience of the transportation network [26].
As an important infrastructure, the urban water supply system plays an important role to improve the quality of life and ensure the functions of economic activities. Unfortunately, many natural disasters, such as earthquakes, tsunamis, hurricanes, etc., affect urban water supply system, and then affect our life, commerce and industry and other activities. Research on resilience of water supply systems mainly focuses on resilience evaluation and recovery strategy simulation. In terms of resilience evaluation, energy and graph theory are two commonly used methods. In a water supply system, resilience can be regarded as the ratio of node energy reserves to input energy from sources, storage tanks and pumping stations [27]. This type of resilience index can basically be regarded as a reliability substitute index, like entropy and Robustness index [28–30]. Similarly, various graph metrics (such as link density, average node degree, and swarming coefficient) can be used to quantify network resilience [31, 32].
In recent years, when environmental uncertainty continues to rise, interruptions are unexpected situations that may have a negative impact on enterprises at any time. Therefore, supply chain resilience has been emphasized as an important capability [33]. In the field of supply chain, supply chain resilience generally refers to the ability of enterprises to be vigilant, quick to respond and adapt to changes brought about by supply chain interruptions. Scholars often quote “the supply chain can be restored to its original state in time or reach a new More ideal state system capabilities” to define resilience [34]. At this stage, the definition of supply chain resilience has attracted more and more scholars’ attention, and discussions have been conducted from the perspective of capabilities, which mainly include flexibility, responsiveness, and resilience. There are many angles to analyze the resilience of the supply chain, mainly including flexibility, redundancy, speed, visibility, time, space, density, complexity, node importance, inventory level, number of suppliers, cost, etc. [35, 36].
So, although the definition of resilience in different systems is not uniform, overall resilience is used to measure the ability to return to its original state or ideal state when it is disturbed. Resilience systems can withstand unexpected disturbances and recover quickly. Therefore, research on resilience can be found in different disciplines (such as engineering, economics, management, etc.), meanwhile more and more attention is paid. And the existing research mostly focuses on the resilience measurement and the design of resilience system. As mentioned above, UAV swarm often suffer attacks and random failures when performing tasks, which makes some UAV nodes unable to transmit information. At this time, load balancing strategies are often used to allocate tasks to complete the established tasks [37–39]. When the function of the failed node is restored, the task will be reloaded to restore the swarm performance. In this process, the swarm performance shows a resilience process of change.
If we consider resilience of the UAV swarm at the beginning of the design, it can greatly improve the ability of the UAV swarm to perform tasks, and enhance the ability of the UAV swarm to resist the influence of uncertain factors, which is important for expanding the application range of the UAV swarm significance.
Model
As mentioned earlier, UAV swarm are often subject to random failures and malicious attacks during missions. There are many reasons, mainly including the random failure of the UAV itself, the influence of the natural environment (including natural climate, mountains, forests, etc.), and man-made random attacks; malicious attacks mainly come from the enemy’s targeted Attacks generally refer to situations in which the enemy obtains the UAV swarm topology, such as attacks based on node degree centrality, or node betweenness centrality, and so on.
When the UAV swarm is attacked, we assume
Performance Model
In the UAV swarm, due to cost constraints and technical factors, each UAV node has a fixed communication capacity, that is, the amount of information that can be transmitted per unit time is fixed. Assuming the capacity of the UAV node
Among them,
Among them,
When the node of UAV swarm is attacked and fails, in order to maintain the normal operation of the communication network, the network of UAV swarm will distribute the load of the failed node to its neighbor nodes. Considering that the capacity of a node to accept load is proportional to the capacity of the node, the node’s acceptance of new load is directly proportional to the initial load. Suppose the set of adjacent nodes
Among them,
Among them,
Equation 5 gives the qualitative description of node state
So, Eq. 5 can be rewritten as
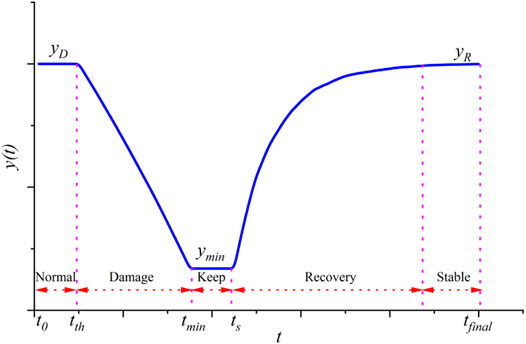
When the UAV swarm is attacked, the node-like in the UAV swarm circulates in the three states of normal, overload and failure. Initially, all UAV nodes are in normal working condition. When the UAV node is attacked, the UAV node will fail. When some nodes in the UAV swarm fail, load distribution will be triggered, which will cause the overload or overload failure of the neighbor nodes of the failed node. However, when the failed node of the UAV is repaired, the UAV swarm will return to its normal state. Overall, the performance of the UAV swarm presents a reciprocating resilience process. Therefore, the performance function of the UAV swarm at the moment can be defined as:
Among them,
UAV Swarm Resilience
In Section 3.1, we show the measurement index of UAV swarm communication performance. Performance indicators measure the ability of the UAV swarm to perform tasks. In the paper, we mainly consider the node load status and swarm load status. When the UAV swarm needs to perform tasks cooperatively, it can only be completed when sufficient information exchange. Therefore, we show the research results of Trans et al. [41] to establish the UAV swarm resilience index, which is calculated as follows:
Among them,
Among them,
Case Analysis
We focus on studying the resilience of UAV swarms when considering load balancing. In the third section, we propose the performance measurement index of UAV swarm when load balancing is considered, combined with the resilience index given in the literature [36], finally we realize the resilience measurement of UAV swarm.
In this section, we will discuss and analyze the resilience indicators given in the third section, focusing on the impact of network structure, network parameters, and repair rates on UAV swarm resilience. When designing the load balancing model, we use the degree of nodes as an indicator to measure the load capacity of UAVs in the UAV swarm, so we use maximum attack (delete the largest node in the current network) to simulate UAV swarms The interference received.
Then, the load is distributed according to the load balancing model proposed in Section 3, and the performance of the UAV swarm after each attack is calculated. In the repair process, within each discrete time t, the failed node restores its performance with probability q, and uses the inverse load distribution in Chapter 3 to reload the network load, and finally realize the resilience change process of the UAV swarm.
Analysis of Swarm Topology
In order to analyze the impact of different topologies on the performance of UAV swarms, we used four networks, BA network, ER random network, NW small world network and RR random rule network. For comparative analysis, each network has 100 fixed points and 200 edges. At the same time, in order to eliminate the influence of random factors in the process of generating the network, we generated a total of 200 networks and used the average to measure the performance of the network. Parameters of the four networks.
It can be seen from Figure 2 that when the network has the same number of edges and nodes, the network topology has a significant impact on network performance. In general, when the four networks are attacked by the same intensity, the performance of the BA network has the fastest decline, the other three networks have a slower decline, and the RR network has the best performance. In terms of attack methods, we give priority to deleting the nodes with the largest degree in the current network, and networks with uneven degree distribution will collapse first. That is to say, there are Hub nodes in this type of network. When these nodes are deleted, they will directly affect the network structure, until the network collapses [42]. From the node capacity model given in Chapter 3, we can see that nodes with higher degrees are given more capacity by us, which intensifies the heterogeneity between nodes. Therefore, under the research framework of this article, the RR network has high robustness to the maximum node degree attack.
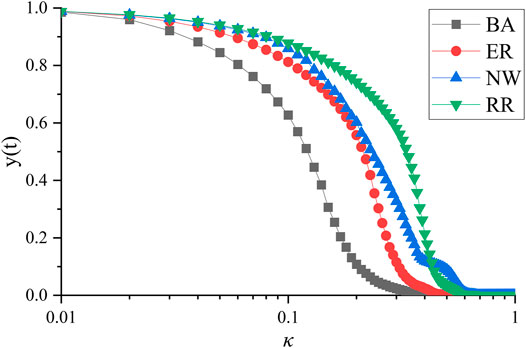
FIGURE 2. Performance of UAV swarm under different attack intensities and topological structures. The vertical axis represents the performance of the UAV swarm, and the horizontal axis represents the logarithm of attack intensity.
In Figure 3, the performance change of the UAV swarm when the load sharing reverse process is used for repair is given. The figure shows that although the UAV nodes are all repaired, the swarm performance has not been restored to the initial state. Through research, it is found that the swarm deletes the largest nodes in the network in turn, but the order of repairing nodes is random. As a result, the UAV swarm load has non-uniformity, which ultimately leads to the worst performance with BA network characteristics.
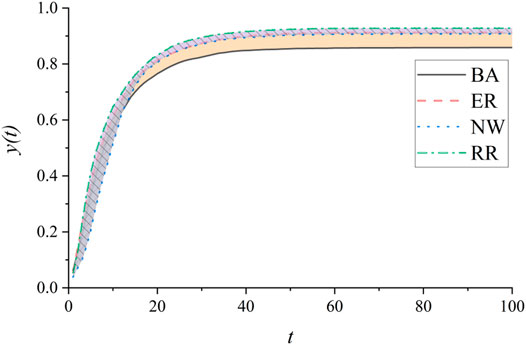
FIGURE 3. Recovery process of UAV swarm performance under different topological structures. The ordinate is the performance of the UAV swarm, and the abscissa is discrete time T. The repair probability is 0.1, that is, at every discrete time t, the probability of damaged nodes being repaired follows a uniform distribution in the interval of (0, 1).
UAV Swarm Resilience
In Section 4.1, when the maximum probability of attack and repair is reached, we find that the graph topology has a certain impact on the performance of the UAV swarm. In this section, we will study the resilience of UAV swarms. When studying the resilience of UAV swarms, we will use discrete time as the benchmark and proceed in the order of normal operation-attacked-state maintenance-repair-stability, where normal operation time and state maintenance time are. As can be seen from Figure 3, the four types of networks all show better resilience. When the network is attacked, the load capacity of the network continues to decline due to the priority deletion of nodes with greater degrees. Through the load balancing algorithm to redistribute the load of the failed node, the performance of the four networks is not degraded very quickly. However, as the number of failed nodes increases, the load of nodes that can work normally increases, causing some nodes to exceed their own load capacity and become overloaded, eventually reducing the performance of normal nodes, or even failing.
Among the four networks, the BA network exhibits stronger resilience than other networks. This shows that under malicious attacks, BA networks are susceptible to interference, that is, small disturbances will cause large fluctuations in the UAV swarm. For each network, the attack intensity will also affect the changes in network performance. That is, as the attack intensity continues to increase, the performance fluctuations of the UAV swarm will also increase.
The effect of different topologies on UAV swarm resilience is shown in Figure 4, and for comparison purposes only the average of 100 experiments is given. In Figure 5 the error of the UAV swarm resilience variation for different topologies is given. Overall, the resilience of the UAV swarm under each topology shows a large fluctuation. Among them, the fluctuation of the UAV swarm resilience is the smallest under the RR network topology (as shown in Figure 5D), i.e., it presents a stronger rigidity. In contrast, the NW network shows greater fluctuations, especially in increasing with the intensity of the attack (manifested in Figure 5C by the unevenness of the ribbon width). It is found that the reason for this phenomenon is related to the generation methods of the four networks. The RR network has the strongest regularity of degree distribution, so each generated network is highly similar and shows high similarity under the same attack strategy. NW network first generates ring network and then connects randomly. When the attack intensity is low, the network fluctuation is small. However, when the attack intensity exceeds a limit (as shown in Figure 5C, 8 nodes are deleted), the network changes dramatically, resulting in dramatic differences in UAV swarm performance. By comparison, the regularity of BA network is weaker than RR network and stronger than NW network. Therefore, the error fluctuation of the BA network is between the two, i.e., the error exists but the fluctuation is not obvious (shown in Figure 5C as a more uniform color band). ER networks are more like a combination of BA and RR networks, i.e., like BA networks with large errors, and like NW networks with insignificant thresholds.
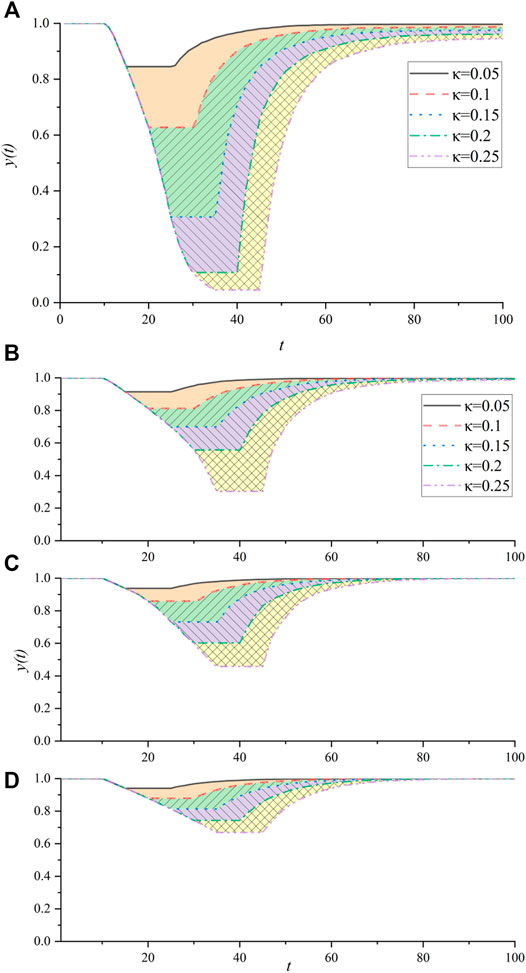
FIGURE 4. Performance of UAV swarm under four topological structures. (A) BA network, (B) ER network, (C) NW network and (D) RR network. Each network was attacked five times with varying intensity and repaired continuously. The attack mode and repair procedure are described in section 4.1.
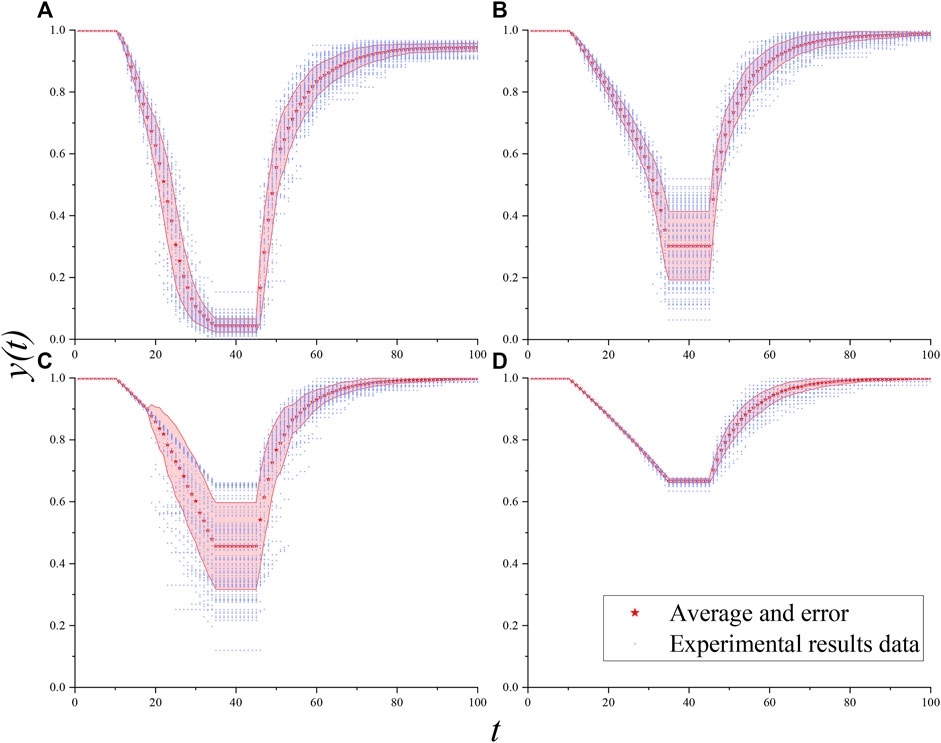
FIGURE 5. Errors of UAV swarm resilience under different topologies. In the figure, the red pentagon is the mean of 100 experiments. The pink ribbon is the standard deviation of 100 experiments. The data for each experiment are the blue hollow tilted squares.
Parameter Influence
In Section 4.1, we analyzed the impact of topology on the swarm performance, and in Section 4.2, we analyze the impact of attack intensity on the resilience of the swarm. In this section, we will analyze the influence of four parameters on the resilience of the swarm. The experimental results are shown in Figures 6–8. During the experiment, for comparative analysis, we set the attack intensity constant to 0.25.
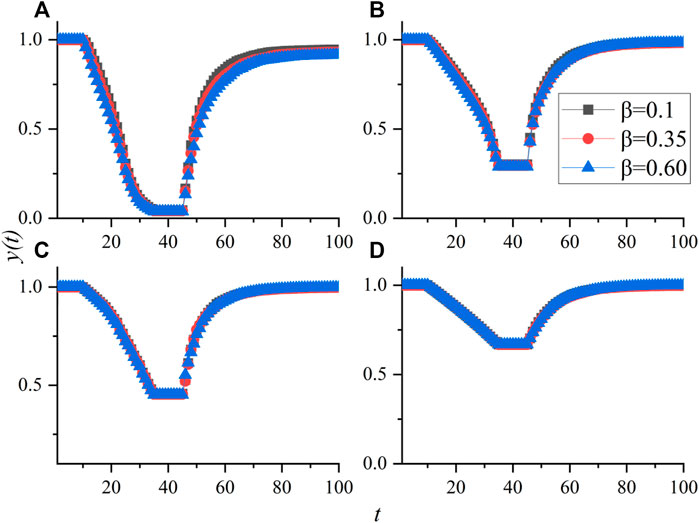
FIGURE 6. Influence of parameter
The influence of the parameters on the performance of the four types of networks is shown in Figure 6. We can find that the parameters
Figure 7 shows the impact of tolerance coefficient on network resilience. In Eq. 1, we define the tolerance factor, which characterizes the ability of an unmanned aerial vehicle to be overloaded. Larger tolerance factor means that the node can withstand more work without crashing, and vice versa. It can be seen in Figure 7 that the tolerance factor can affect the performance of the four networks, but there are significant differences in the degree of impact. The tolerance factor has a small impact on the performance of the BA network and a greater impact on the RR network. Through the topology analysis of the network, it is found that the degree distribution of the BA network presents a power-law distribution, with greater differences, while the degree distributions of the other three networks are less different, especially the RR network.
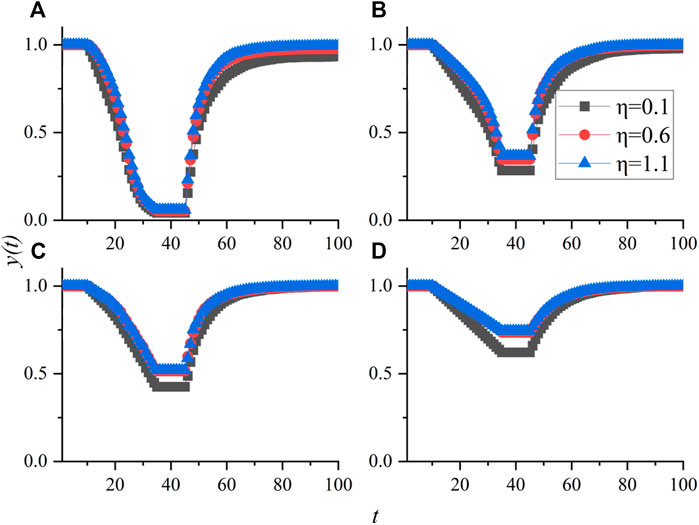
FIGURE 7. Influence of parameter
The parameter
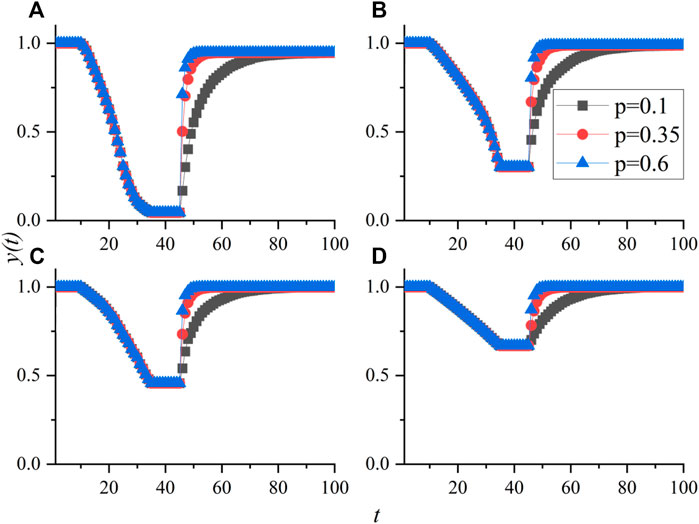
FIGURE 8. Influence of parameter
Conclusion
UAV swarm have attracted more and more attention. In the missions, the UAV itself or its communication is often subjected to random interference or malicious attacks, which causes the UAV to fail or to interrupt the communication. When the UAV swarm is out of interference or the repair command is executed, the performance of the UAV swarm will be restored to a certain extent. However, how to measure the changes in UAV swarm’s performance during this process is important, and it is also the key to determining whether the UAV can continue to perform its mission. Based on this motivation and considering the load balancing process of the UAV swarm after interference, we propose a UAV swarm resilience evaluation model that considers load balancing. In this process, the UAV node capacity model, load balancing model, overload failure model and performance resilience model are established. Finally, the resilience change process of the UAV swarm under different topological structures and parameters is analyzed. In the test process, following the characteristics of the model, we use degree attacks to test the resilience of the network. We find that attack intensity is the most important indicator that affects the performance of UAVs. With the increase of attack intensity, the performance of UAV swarm decreases rapidly, especially the performance of UAV swarm with BA network structure. Under different parameters, the performance of UAV swarm with a scale-free characteristic topology also decreases rapidly, but different parameters have different degrees of influence. Therefore, when the UAV swarm is configured with the capacity of the node degree and is attacked by the degree, the performance of the UAV degrades the fastest and the resilience changes the most.
Data Availability Statement
The original contributions presented in the study are included in the article/Supplementary Material, further inquiries can be directed to the corresponding author.
Author Contributions
PZ, JX, and TW contributed to conception and design of the study. ZL organized the database. JX and RC performed the statistical analysis. PZ wrote the first draft of the manuscript. All authors contributed to manuscript revision, read, and approved the submitted version.
Conflict of Interest
The authors declare that the research was conducted in the absence of any commercial or financial relationships that could be construed as a potential conflict of interest.
Publisher’s Note
All claims expressed in this article are solely those of the authors and do not necessarily represent those of their affiliated organizations, or those of the publisher, the editors and the reviewers. Any product that may be evaluated in this article, or claim that may be made by its manufacturer, is not guaranteed or endorsed by the publisher.
References
1. Zhou X, Gao F, Fang X, Lan Z. Improved Bat Algorithm for UAV Path Planning in Three-Dimensional Space. IEEE Access (2021) 9:20100–16. doi:10.1109/access.2021.3054179
2. Liu D, Xu Y, Wang J, Chen J, Yao K, Wu Q, et al. Opportunistic UAV Utilization in Wireless Networks: Motivations, Applications, and Challenges. IEEE Commun Mag (2020) 58(5):62–8. doi:10.1109/mcom.001.1900687
3. Kouhdaragh V, Verde F, Gelli G, Abouei J. On the Application of Machine Learning to the Design of UAV-Based 5G Radio Access Networks. Electronics (2020) 9(4):689. doi:10.3390/electronics9040689
4. Yu X, Li C, Zhou J. A Constrained Differential Evolution Algorithm to Solve UAV Path Planning in Disaster Scenarios. Knowledge-Based Syst (2020) 204:106209. doi:10.1016/j.knosys.2020.106209
5. Zhang Q, Chen J, Ji L, Feng Z, Han Z, Chen Z. Response Delay Optimization in Mobile Edge Computing Enabled UAV Swarm. IEEE Trans Veh Technol (2020) 69(3):3280–95. doi:10.1109/tvt.2020.2964821
6. Fu X, Pan J, Wang H, Gao X. A Formation Maintenance and Reconstruction Method of UAV Swarm Based on Distributed Control. Aerospace Sci Tech (2020) 104:105981. doi:10.1016/j.ast.2020.105981
7. Xu J, Deng Z, Ren X, Xu L, Liu D. Invulnerability Optimization of UAV Formation Based on Super Wires Adding Strategy. Chaos, Solitons & Fractals (2020) 140:110185. doi:10.1016/j.chaos.2020.110185
8. Masten AS, Reed MGJ. Resilience in Development[J]. In: Handbook of Positive Psychology. Oxford University Press (2002). p. 74–88.
9. Huang K, Wen H, Yang C, Gui W, Hu S. Outlier Detection for Process Monitoring in Industrial Cyber-Physical Systems, Proceeding of the IEEE Transactions on Automation Science and Engineering, June 2021 IEEE (2021). p. 1–12. doi:10.1109/TASE.2021.3087599
10. Huang K, Wu S, Li F, Yang C, Gui W Fault Diagnosis of Hydraulic Systems Based on Deep Learning Model with Multirate Data Samples, Proceeding of the IEEE Transactions on Neural Networks and Learning Systems, June 2021. IEEE (2021) p. 1–13. doi:10.1109/TNNLS.2021.3083401
11. Zhu P, Han J, Liu L, Lombardi F. Reliability Evaluation of Phased-Mission Systems Using Stochastic Computation. IEEE Trans Rel (2016) 65(3):1612–23. doi:10.1109/tr.2016.2570565
12. Zhu P, Han J, Guo Y, Lombardi F. Reliability and Criticality Analysis of Communication Networks by Stochastic Computation. IEEE Netw (2016) 30(6):70–6. doi:10.1109/mnet.2016.1500221nm
13. Keating A, Hanger-Kopp S. Practitioner Perspectives of Disaster Resilience in International Development. Int J Disaster Risk Reduction (2020) 42:101355. doi:10.1016/j.ijdrr.2019.101355
14. Harahap GY. Instilling Participatory Planning in Disaster Resilience Measures: Recovery of Tsunami-Affected Communities in Banda Aceh, Indonesia. Birex Budapest Internation Research Exact Science (2020) 2(3):394–404. doi:10.33258/birex.v2i3.1085
15. Song Z, Zhang H, Dolan C. Promoting Disaster Resilience: Operation Mechanisms and Self-Organizing Processes of Crowdsourcing. Sustainability (2020) 12(5):1862. doi:10.3390/su12051862
16. Dube K, Nhamo G, Chikodzi D. COVID-19 Cripples Global Restaurant and Hospitality Industry[J]. Curr Issues Tourism (2020) 24:1–4. doi:10.1080/13683500.2020.1773416
17. Kurihara Y, Takahata N, Yokoyama TD, Miura H, Kon Y, Takagi T, et al. Isotopic Ratios of Uranium and Caesium in Spherical Radioactive Caesium-Bearing Microparticles Derived from the Fukushima Dai-Ichi Nuclear Power Plant. Sci Rep (2020) 10(1):3281–10. doi:10.1038/s41598-020-59933-0
18. Karsai I, Schmickl T, Kampis G. Resilience and Stability of Ecological and Social Systems[M]. Springer International Publishing (2020).
19. Essuman D, Boso N, Annan J. Operational Resilience, Disruption, and Efficiency: Conceptual and Empirical Analyses. Int J Prod Econ (2020) 229:107762. doi:10.1016/j.ijpe.2020.107762
20. Wan C, Yang Z, Zhang D, Yan X, Fan S. Resilience in Transportation Systems: A Systematic Review and Future Directions. Transport Rev (2018) 38(4):479–98. doi:10.1080/01441647.2017.1383532
21. Liao T-Y, Hu T-Y, Ko Y-N. A Resilience Optimization Model for Transportation Networks Under Disasters. Nat Hazards (2018) 93(1):469–89. doi:10.1007/s11069-018-3310-3
22. Ganin AA, Kitsak M, Marchese D, Keisler JM, Seager T, Linkov I. Resilience and Efficiency in Transportation Networks. Sci Adv (2017) 3(12):e1701079. doi:10.1126/sciadv.1701079
23. Tachaudomdach S, Upayokin A, Kronprasert N, Arunotayanun K. Quantifying Road-Network Robustness Toward Flood-Resilient Transportation Systems. Sustainability (2021) 13(6):3172. doi:10.3390/su13063172
24. Xu X, Chen A, Jansuwan S, Yang C, Ryu S. Transportation Network Redundancy: Complementary Measures and Computational Methods. Transportation Res B: Methodological (2018) 114:68–85. doi:10.1016/j.trb.2018.05.014
25. Gu Y, Fu X, Liu Z, Xu X, Chen A. Performance of Transportation Network Under Perturbations: Reliability, Vulnerability, and Resilience. Transportation Res E: Logistics Transportation Rev (2020) 133:101809. doi:10.1016/j.tre.2019.11.003
26. Sun W, Bocchini P, Davison BD. Resilience Metrics and Measurement Methods for Transportation Infrastructure: The State of the Art. Sustainable Resilient Infrastructure (2020) 5(3):168–99. doi:10.1080/23789689.2018.1448663
27. Creaco E, Franchini M, Todini E. The Combined Use of Resilience and Loop Diameter Uniformity as a Good Indirect Measure of Network Reliability. Urban Water J (2014) 13(2):167–81. doi:10.1080/1573062x.2014.949799
28. Singh VP, Oh J. A Tsallis Entropy-Based Redundancy Measure for Water Distribution Networks. Physica A: Stat Mech its Appl (2015) 421:360–76. doi:10.1016/j.physa.2014.11.044
29. Greco R, Di Nardo A, Santonastaso G. Resilience and Entropy as Indices of Robustness of Water Distribution Networks. J Hydroinformatics (2012) 14(3):761–71. doi:10.2166/hydro.2012.037
30. Shang Y. Resilient Group Consensus in Heterogeneously Robust Networks with Hybrid Dynamics. Math Meth Appl Sci (2021) 44(2):1456–69. doi:10.1002/mma.6844
31. Yazdani A, Otoo RA, Jeffrey P. Resilience Enhancing Expansion Strategies for Water Distribution Systems: A Network Theory Approach. Environ Model Softw (2011) 26(12):1574–82. doi:10.1016/j.envsoft.2011.07.016
32. Porse E, Lund J. Network Analysis and Visualizations of Water Resources Infrastructure in California: Linking Connectivity and Resilience. J Water Resour Plann Manage (2016) 142(1):04015041. doi:10.1061/(asce)wr.1943-5452.0000556
33. Pettit TJ, Fiksel J, Croxton KL. Ensuring Supply Chain Resilience: Development of a Conceptual Framework. J business logistics (2010) 31(1):1–21. doi:10.1002/j.2158-1592.2010.tb00125.x
34. Pettit TJ, Croxton KL, Fiksel J. Ensuring Supply Chain Resilience: Development and Implementation of an Assessment Tool. J Bus Logist (2013) 34(1):46–76. doi:10.1111/jbl.12009
35. Hosseini S, Ivanov D, Dolgui A. Review of Quantitative Methods for Supply Chain Resilience Analysis. Transportation Res Part E: Logistics Transportation Rev (2019) 125:285–307. doi:10.1016/j.tre.2019.03.001
36. Dubey R, Gunasekaran A, Childe SJ, Fosso Wamba S, Roubaud D, Foropon C. Empirical Investigation of Data Analytics Capability and Organizational Flexibility as Complements to Supply Chain Resilience. Int J Prod Res (2021) 59(1):110–28. doi:10.1080/00207543.2019.1582820
37. Finke J, Passino KM, Sparks AG. Stable Task Load Balancing Strategies for Cooperative Control of Networked Autonomous Air Vehicles. IEEE Trans Contr Syst Technol (2006) 14(5):789–803. doi:10.1109/tcst.2006.876902
38. Yang L, Yao H, Wang J, Jiang C, Benslimane A, Liu Y. Multi-UAV-Enabled Load-Balance Mobile-Edge Computing for IoT Networks. IEEE Internet Things J (2020) 7(8):6898–908. doi:10.1109/jiot.2020.2971645
39. Wu P, Xiao F, Huang H, Wang R. Load Balance and Trajectory Design in Multi-UAV Aided Large-Scale Wireless Rechargeable Networks. IEEE Trans Veh Technol (2020) 69(11):13756–67. doi:10.1109/tvt.2020.3026788
40. Luo XS, Zhang B. Analysis of Cascading Failure in Complex Power Networks Under the Load Local Preferential Redistribution Rule[J]. Physica A: Stat Mech its Appl (2012) 391(8):2771–7.
41. Tran HT, Domerçant JC, Mavris DN. A Network-Based Cost Comparison of Resilient and Robust System-Of-Systems. Proced Comp Sci (2016) 95:126–33. doi:10.1016/j.procs.2016.09.302
Keywords: resilience, networks, UAV swarm, load balancing, malicious attacks
Citation: Zhang P, Wu T, Cao R, Li Z and Xu J (2022) UAV Swarm Resilience Assessment Considering Load Balancing. Front. Phys. 10:821321. doi: 10.3389/fphy.2022.821321
Received: 24 November 2021; Accepted: 06 January 2022;
Published: 31 January 2022.
Edited by:
Dongli Duan, Xi’an University of Architecture and Technology, ChinaReviewed by:
Yilun Shang, Northumbria University, United KingdomKeke Huang, Central South University, China
Husheng Wu, Engineering University of PAP, China
Copyright © 2022 Zhang, Wu, Cao, Li and Xu. This is an open-access article distributed under the terms of the Creative Commons Attribution License (CC BY). The use, distribution or reproduction in other forums is permitted, provided the original author(s) and the copyright owner(s) are credited and that the original publication in this journal is cited, in accordance with accepted academic practice. No use, distribution or reproduction is permitted which does not comply with these terms.
*Correspondence: Jiwei Xu, eHVAeHVwdC5lZHUuY24=
 Pengtao Zhang1
 Jiwei Xu