 Muhammad Nouman Khan1,2
 Qianqian Wang1,2*Bushra Sana Idrees1,2Wenting Xiangli1,2Geer Teng1,2Xutai Cui1,2Zhifang Zhao1,2Kai Wei1,2
 Muhammad Abrar3
- 1School of Optics and Photonics, Beijing Institute of Technology, Beijing, China
- 2Key Laboratory of Photonic Information Technology, Ministry of Industry and Information Technology, Beijing Institute of Technology, Beijing, China
- 3Departement of Physics, Hazara University, Manshera, Pakistan
Due to the new demonstrations of Laser-induced breakdown spectroscopy (LIBS) applicability in a surprisingly wide variety of applications, the use of LIBS as a medical diagnostic tool is steadily gaining momentum. Especially in different cancer diseases, LIBS has the potential to become a fast and valuable analytical tool. We addressed LIBS equipment and quantitative analytical procedures, and signal enhancement techniques for improving element detection. For detailed aspects of applications, we reviewed the recent progress of LIBS in different cancer diseases diagnoses by using different tissues and medical fluid as samples. To fulfill the high demands in the medical industry and overcome the severe tissue sample problem, it is proposed that the chemometric and signal amplification techniques for quantitative analysis should be employed, and robust and effective LIBS devices should be developed. This overview of the different cancers by LIBS is meant to summarize the research performed to date and suggest some suitable advanced chemometrics techniques and effective LIBS devices, if successfully implemented, would be significantly beneficial to the medical field in the future.
Introduction
Cancer is a kind of disease caused by the uncontrolled growth of abnormal cells in body organs. These abnormal cells are also called cancer cells, tumor cells, or malignant cells. These cells may invade other normal tissue of the body. The second major cause of death worldwide is cancer; therefore, cancer is a critical issue that impacts all human communities [1]. In a broader sense, there are more than 277 different types of cancer diseases [2]. Scientists have found multiple stages of cancer. Many scientific and therapeutic efforts are underway to identify and combat cancer effectively. For this purpose, some X-ray-based imaging techniques like particle-induced X-ray emission (PIXE), energy-dispersive X-ray spectroscopy (EDX), and X-ray fluorescence microscopy (XRF) were used [3–5]. Still, these techniques have low sensitivity and accuracy [6]. Recently several other analytical approaches are generally used as a reference point in clinical research, such as polymerase chain reaction and histopathological analysis [7]. Such techniques involve a skilled person with experience, and the research process is time-consuming and complicated. Molecular spectroscopy like near-infrared (NIR) and Raman Spectroscopy (RS) [8] were also used, which is very simple and non-destructive. Still, they give only the molecular structure of the tissue sample and have relatively weak signals and complex spectral background.
Laser-induced breakdown spectroscopy is a type of laser-based atomic emission spectroscopy. LIBS has already become a known and popular analytical spectroscopic technique for studying the elementary form of any kind of sample, along with solid, liquid, or gas [9, 10]. A high-energy laser pulse targets a material substrate (sample) to be analyzed through LIBS, resulting in plasma production due to the interaction between laser and material substrate. The spectrometer detects the radiation emitted as plasma cools and sends it to a computer, where the signals are collected and processed for further analysis. LIBS offers the most well-known benefits [11], 1) in-situ and stand-off detection capabilities; 2) no or little sample preparation; 3) micro-analysis capability when microscopically connected; 4) availability of multi-element analysis; 5) ability to analyze solids, liquids, and gases; and 6) simplicity. LIBS analyses are available for all types of biomaterials and can detect almost all elements; furthermore, when coupled with chemometrics and machine learning algorithms, the technique provides an excellent ability to quantitatively and qualitatively analyze unknown substances in real-time. Moreover, the LIBS instrument isn’t complicated and usually composed of a laser source, spectrometer, optical system, detector, etc. And access to samples in LIBS mainly includes focusing optics [12]. To achieve cancer diagnosis, LIBS was usually used for pathological detection. The current gold standard in cancer diagnosis is the histopathological examination in patient tissue biopsies or surgical excisions [8, 13]. LIBS biomedical application is mainly divided into two categories [14]. The first category analyzes and studies the microorganism (e.g., molds, yeast, bacteria), which causes different human diseases [15]. In the second category, a clinical specimen of human or animal-like (tissue samples, blood or other fluid samples, teeth and bones, etc.) is analyzed and studied [16]. In biomedical applications, significantly different kinds of cancer detection and classification are among the fastest-growing fields of study at LIBS. In the related application especially in cancer diseases diagnosis, LIBS was used by Kumar et al. [17] firstly to distinguish between normal and malignant cells of dog hemangiosarcoma and showed the variation or difference in constituent elements of the tissues sample. Similarly, Melikechi et al. [18] used mice blood plasma as a sample to detect the epithelial ovarian cancer (EOC) and concluded that LIBS can be used as a novel approach to detect EOC. Gondal et al. [19] studied the determination of heavy metals in colon cancer using normal and malignant tissue samples of humans. They concluded that LIBS is a compatible technique for the assessment and identification of heavy metals such as Pb, Hg, and Cr in cancerous colon tissues. Rizk et al. [20] reported variations of different trace elements levels like Mn, Cu, Fe, Na, Mg, K, and Ca of liver cancer by LIBS. In the same fashion, Teran-Hinojosa et al. [21] employed LIBS to find the correlation in elemental concentration between fibrotic and healthy samples of mice liver tissues. For lymphoma, and multiple myeloma (MM), Chen et al. [22, 23] used whole blood and serum sample to differentiate between normal and cancer blood samples. They preferred the entire blood sample instead of serum because the entire blood sample consists of large nutrients and can get good LIBS spectra for analysis. Similarly, Chu et al. [24] reported the classification of nasopharyngeal carcinoma using LIBS combined with chemometrics. LIBS was also used to diagnose colorectal cancer [25], cervical cancer [26], breast cancer [27], and melanoma [28]. LIBS cancer tests are fast, accurate, and less invasive. Because of their tremendous potential for early identification of different cancer diseases, LIBS and machine learning techniques give patients with more therapy alternatives and higher survival rates.
The main objective of this paper is to review and survey the relevant development in the biomedical field of LIBS, particularly in different cancer detection and analysis over the last decade. Specifically, the latest results of diagnosis, classification, and determination of different kinds of cancers (breast cancer, liver cancer, melanoma, blood cancer, stomach cancer, etc.) by using LIBS were discussed. This paper presents the measurement and detection by LIBS of various substrate samples (such as tissues, tissue in pelletized form, tissue homogenization, blood sample, blood serum, etc.) and early cancer detection. Finally, emerging developments and perceptions of the LIBS were proposed in the study of different kinds of cancers, and new possible approaches to current LIBS problems.
LIBS Fundamentals
It is essential to understand the plasma physics behind LIBS to provide an optimal environment for LIBS measurements. A considerable number of different environmental conditions impact the features and lifetime of plasma, which caused changes in spectral emissions and the efficiency of this method for chemical atomic level research. Laser ablation and matter interaction worked on the principle of quantum mechanics laws describing photons emission and absorption by atoms. Two pioneer researchers of LIBS, Miziolek, and Cremers, have published technical details of this field [29]. The LIBS cycle contains the following sequence of events, where 1) focus a high-power laser pulsed beam on the specific material substrate 2) laser-matter interaction takes place, and hot plasma plume is produced, 3) the hot plasma plume collected through optical fibre, that equipped with high-resolution gratings and collecting optical lens 4) the corresponding LIBS signal is then evaluated to determine and measure the relative existence of the target material substrate chemical constituents. In Table 1, some literature about LIBS in different cancer diseases is discussed and briefly summarizes the experimental techniques, sample preparation, spectra measurements, and different chemometric methods. In the medical field, sample collection is a huge issue and especially in cancer types of diseases. So it is essential to select the best and suitable sample type for laser ablation to collect the best spectra.
TABLE 1. Preparation and presentation of samples as well as mehtods used (in cancer diseases) for LIBS data analysis.
For excitation and de-excitation purposes, a high-energy pulsed laser (Nd: YAG laser with typical wavelength 1,064 nm) is applied to the sample (usually within nanosecond range) in LIBS [29], because of its durability, ease of use, and high energy peak pulse. Similarly, Nd: YAG laser second and third harmonic wavelengths 532 and 355 nm are also often used as excitation sources [37, 38]. The femtosecond (fs) laser is also used in various applications of LIBS [29]. In LIBS analysis, the pulsed laser energy and laser spot size are very significant to infuse on the sample’s surface [39].
LIBS Analysis for Different Cancers
Ovarian Cancer
Ovarian cancer, often known as ovaries cancer, is one of the most frequent cancers in women. Ovarian cancer is the fifth leading cause of death for women. In 2018, new cases of ovarian cancer diagnosis patients reached around 21,750 in the United States (US); an additional 13,940 deaths were also reported [40]. Ovarian cancer is one of the leading causes of death among gynecological cancers (cancer that occurs inside the reproductive organs. Cervical, ovarian, uterine, vaginal, and vulvar are five primary forms of cancer that involve a woman’s reproductive organs). Usually, there are no unique signs and symptoms; consequently, 70% of cases are found as the disease is grown at an early stage [41, 42]. For the identification of ovarian cancer, Melikechi et al. [18] conducted a preliminary investigation on the blood sample of the transgenic mice to identify and classify ovarian tumors in the wild type (normal) and transgenic mice (cancerous). For further LIBS analysis, they collected blood samples from mice at different ages of 8, 12, and 16 weeks. A total of 56 blood plasma samples were used in the experiment, 28 of each class (normal and cancerous).
This finding backs up the theory that as the tumour load in the animals grows, plasma specimens will deviate more from control specimens. When all six data are combined, however, the accuracy of classification for each age group drops. We believe this drop is because the LIBS chamber has to be re-opened after collecting LIBS spectra from one set of blood plasma samples to load the new blood plasma samples. The results of RF are shown in Figure 1. They concluded that more research is needed to classify ovarian cancer and identify atomic and ionic lines in the ablated samples. Another interesting perspective is to continue with the physical understanding of the selected set of wavelengths for good classification results.
FIGURE 1. The achieved classification accuracy result of RF technique (A) in the wavelength range of 250–680 nm (B) and 220–850 nm [18].
Yue et al. [35] used LIBS combined with machine learning techniques to diagnose and classify ovarian cancer. They also used the blood plasma of 176 patients, including ovarian cyst and normal samples. For cancer diagnosis, they achieved sensitivity and specificity 71.4 and 86.5%, respectively. In the experiment, they detected emission lines from certain minor elements in blood plasma, Fe, Si, P, and Cu, but the contribution in classification was minimal. Consequently they considered the major metal elements, K, Na, Mg, and Ca are because these elements are essential electrolytes in blood and play a critical role in preserving homeostasis in the body. As a result, an imbalance in their proportions in a patient shows a state of abnormality.
Furthermore, direct analysis of blood-related liquids is preferred for a clinical approach among various operation modes with different types of biological samples because LIBS corresponds to an easy, cost-effective, and widely used implementation of biomedical test that is suitable for a wide coverage screening and can be incorporated in a routine physical examination.
Lymphoma and Multiple Myeloma (MM)
Most blood cancers, also known as hematologic malignancies, begin in the bone marrow, which produces blood. When dysfunctional blood cells begin to develop out of control, they disrupt the function of healthy/normal blood cells, which fight infection and create new blood cells. A blood cancer diagnosis is also a big problem in clinical medicine today [43–45]. Multiple myeloma (MM), Leukaemia, and malignant lymphoma are the three most common types of blood cancer [46]. There are two key obstacles in diagnosing blood cancer: distinguishing cancer from normal blood cells and identifying the different forms of blood cancer. Lymphoma and multiple myeloma (MM) are cancers of the blood cells that affect the body’s hematopoietic and lymphatic systems. In 2015 about 29,300 died from lymphoma, and 9,200 died from MM, respectively, in China [47]. Three papers have been published to diagnose blood cancer through LIBS in 2017, 2018, and 2020 respectively.
X. Chen et al. presents a rapid and robust diagnosis and discrimination of lymphoma and MM using LIBS performed on serum samples in combination with different chemometric techniques [23]. They used k nearest neighbors (kNN), principal component analysis (PCA), linear discriminant analysis (LDA) and quadratic discriminant analysis (QDA) to build the malignancy diagnosis and discrimination models for further analysis. PCA scores are used for best features selection. In terms of precision of discrimination, the area under the curve (AUC), sensitivity, and accuracy, the kNN model displays the best results. The ROC curves for all classification models are shown in Figure 2A. The average specificity of classification was achieved at 96.0%. In the second paper, for discrimination of lymphoma using LIBS, the whole blood is taken as a sample [22]. Instead of serum samples, whole blood samples are used because they contain more components and have more spectral signatures for the study of discrimination. All blood samples from lymphoma patients and healthy controls were analysed and compared using the LIBS spectrum. Chemometric approaches have been used to study discrimination, including PCA, LDA classification, and kNN classification. Both kNN and LDA models have demonstrated extremely excellent discriminating efficiency, as shown in Figure 2B, with an accuracy of over 99.7%, a sensitivity of over 99.6%, and a specificity of over 99.7%. It is assumed, however, that the incidence of cancer is not connected to either one or two unique elements but rather to several forms of elements. The confusing impact of other mild disorders can be minimized to a restricted degree by using discrimination models based on multivariate analysis instead of univariate analysis. Yet, it can help boost the robustness of the discrimination models by incorporating benign disease controls in the model.
FIGURE 2. (A)The ROC curve for the lymphoma class of different classification models [23]. (B) Receiver operating curve (ROC) for the lymphoma class of LDA and kNN models [22].
Similarly, in the third paper, a technique uses random subspace method (RSM) based ensemble learning such as RSM-LDA in conjunction with LIBS [48]. They studied the Leukemia subtypes of blood cancer like acute myeloid leukemia (AML), chronic myelogenous leukemia (CML), and MM and lymphoma. The variable importance (VI) of the selected lines was determined to evaluate the significance of the function. The RSM-LDA model has the highest overall precision rate and AUC, compared to LDA and kNN, which means that the RSM-LDA model has the highest accuracy, as shown in Figure 3. Furthermore, Figure 4 manifests the best performing classification ROC curve for four different blood cancers. With the RSM-LDA model, the overall accuracy ratings for AML vs healthy control (HC), CML vs HC, MM vs HC, and lymphoma vs HC ranged from 94.33, 94.49, 94.61, and 94.38%–98.77, 96.54, 98.78, and 96.62%, respectively. In the above two papers of blood cancer, the serum sample and whole blood sample are used on filter paper, while in the third paper about blood cancer the whole blood sample used in the form of pellets.
FIGURE 3. (A) The accuracy rate of different models (B) confusion matrix of RSM-LDA [48].
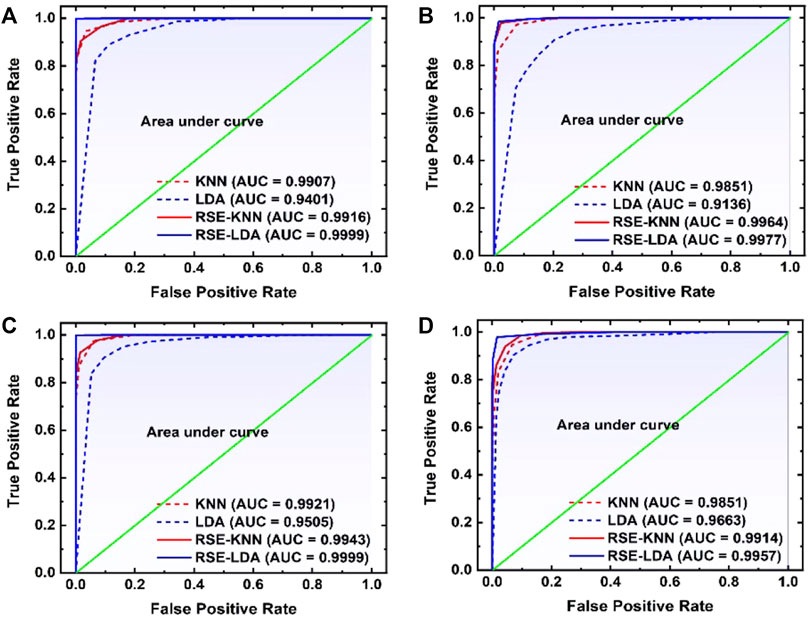
FIGURE 4. The ROC curve was used to compare four different models for (A) AML versus healthy control (HC), (B) CML vs HC, (C) MM vs HC, and (D) lymphoma vs HC [48].
Skin Cancer (Melanoma)
Skin cancer is one of the leading causes of death worldwide. Squamous Cell Carcinoma (SCC), Basal Cell Carcinoma (BCC), and Merkel cell cancer are known as non-melanoma skin cancer (NMSC). These NMSC and melanoma are categorized as skin cancer. In 2018, NMSC (excluding basal cell carcinomas, BCCs) was the world’s fifth most prevalent form of cancer, causing more than 1 million new cases and 65,000 deaths, while melanoma was the 21st in cancers lethality rank. Malignant melanoma is the most severe form of skin cancer. It leads to higher patient mortality due to late pathology diagnosis of almost 300,000 new incidents and 60,000 fatalities [49] and its increased risk of developing systemic metastases [50]. In this regard, Han et al. [30] concentrated on the feasibility of LIBS to differentiate between lesions in the surrounding dermis from melanoma. Using homogenized pellet extracts from melanoma-implanted mice, and performed a qualitative and quantitative elemental analysis of melanomas and the underlying dermis. Based on these results, they also analyzed distinguishable elements from real skin tissues of melanoma-implanted mice, reflecting the clinical situation. The sensitivity and specificity of LDA classifier for pellet samples were shown to be 99.4 and 100%, respectively, while those for tissue samples were shown to be 96.7 and 99.7%, respectively. Rosalba et al. [28] collect and compare the blood serum and tissue homogenate LIBS spectra harvested from a pre-clinical model of melanoma. The use of four distinct classification algorithms (LDA, FDA, SVM, and Gradient Boosting) is effective. The results of these four algorithms were compared, and Gradient Boosting was found to provide the best precision for classification as shown in Figure 5. The classification accuracy could be significantly impaired by various substrates, with Cu substrate the best outcomes in the experimental circumstances used. Similarly, the findings of the fs-LIBS research and analysis were reported by Moon et al. [51] elemental mapping of a study of cryosectioned melanoma as an Imaging procedure for differentiating the areas of the tumour and dermis. They concluded that dermis and skin cancer fields are distinguished and compatible in the LIBS elemental mapping picture with the histologically calculated ones, showing the viability of LIBS as a beneficial tool for quicker decision Regions of Skin Cancer. To improve the classification accuracy of normal and melanoma samples, Ekta et al. [52] used the Joint Mutual Information Estimation (MIE) and Weighted Average (WA) methods. To test and pick representative spectral lines, the MIE procedure was used, while column-wise Gaussian weighted lines based on the chosen feature lines and surrounding spectral lines, averaging was used to process two-dimensional spectral images. Khan et al. [53] recently used LIBS combined with chemometric methods to examine and discriminate against human melanoma FFPE tissue samples instead of animal samples, and achieved good classification results as shown in Figure 6.
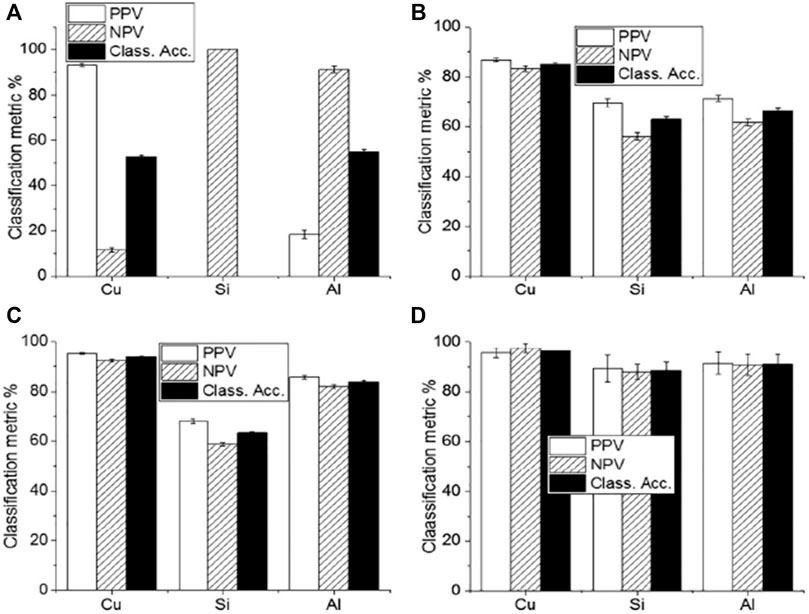
FIGURE 5. The classification accuracy result of (A) LDA (B) FDA (C) SVM and (D) Gradient boosting with different substrates of Cu, Si and Aluminum [54].
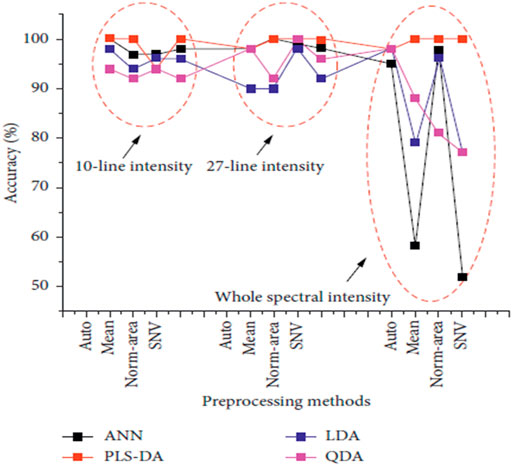
FIGURE 6. The classification accuracy of ANN, PLS-DA, LDA, and QDA models by using multiple preprocessing methods with different input data types [53].
Liver Cancer
In humans, the liver is the sixth most common primary cancer site, and it is frequently linked with cirrhosis and inflammation [55]. Kumar et al. [17]used LIBS for the first time to classify a dog’s liver tissue to identify liver cancer. The findings demonstrate that the ratios of calcium (Ca), copper (Cu) and sodium (Na) to potassium (K) line concentrations are higher in a malignant sample than those in a normal one. They also used inductively coupled plasma emission spectroscopy (ICPES) to compare the results with LIBS and achieved good approximation results of both methods.
For the diagnosis and classification of liver cancer, Sherbini et al. [20] used a scaled conjugate gradient back-propagation ANN to construct a diagnostic model to differentiate between 26 malignant samples and four regulars (zero cancer level) samples randomly selected from patients with liver cancer aged 6–56 years. All the malignant samples were accurately identified.
Hepatic fibrosis is chronic liver damage that can progress to cirrhosis, hepatic failure, and finally hepatocellular carcinoma (HCC) or liver cancer [56]. Hinojosa et al. [57] used LBS to demonstrate the differentiation of chronic liver injury known from normal for hepatic fibrosis liver diseases. For this purpose, they used a fibrotic and normal liver sample of mice. PCA is used for further classification analysis of different fibrotic levels of METAVIR score system (histopathological system for liver tissues identification) from F0 to F4, F0 is considered the normal one as shown in Figure 7. They also concluded that an increase in calcium (Ca) concentration found in cirrhosis (a late stage of scaring also known as fibrosis) could be linked to intracellular or extracellular calcium buildup. Although the findings are preliminary, LIBS might be used as a stand-alone, quick way to identify hepatic fibrosis at an early stage.
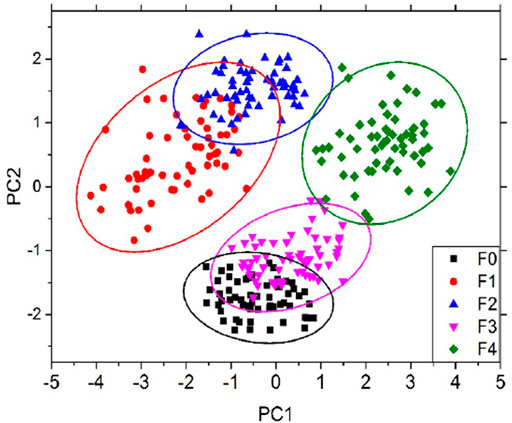
FIGURE 7. PCA score of different MTAVIR scores from F0 to F4 [57].
Brain Tumor
Glioma is a prominent brain tumor, which arises in the brain and spinal cord. According to World Health Organization (WHO), glioma is graded in four different categories: Grade I, which is typically curable by surgery; grade II, known as lower-grade glioma (LLG), grade III, known as anaplastic astrocytoma, and grade IV, known as Glioblastoma Multiform (GBM) which is the most severe kind with the lowest survival rate [58–60]. For the first time, Teng et al. [31] proposed LIBS to discriminate the infiltrative glioma boundary based on elemental components. In this work, they used fresh glioma and infiltrating boundary tissue samples for laser ablation. They concluded that to discriminate the glioma boundary, Mg and Ca are linked to the development of tumors and play a more critical factor in tumour formation.
Similarly, the CN band also contains relevant details for recognition of Tumors boundaries. They used two different chemometric models, SVM and kNN, for glioma and infiltrative boundary classification. For discrimination of glioma and infiltrating boundary SVM achieved 95% correct classification rate (CCR), which is better than kNN as shown in Figure 8A.
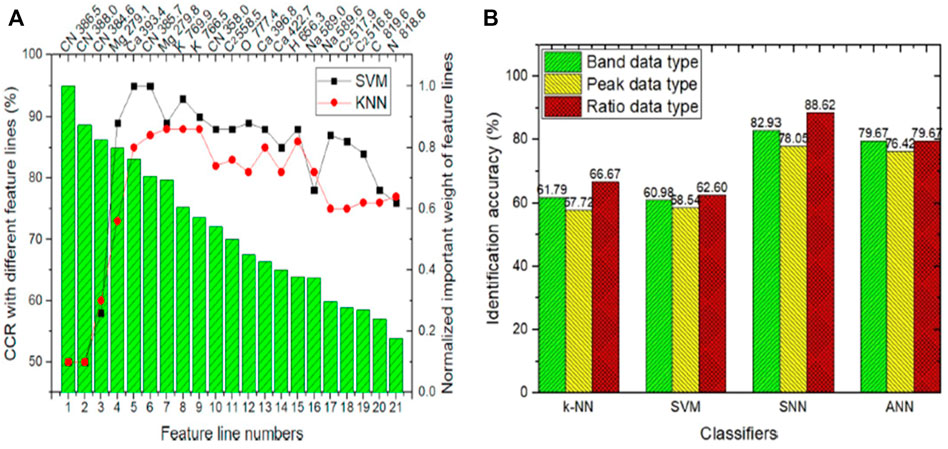
FIGURE 8. (A) Classification result of SVM and kNN of infiltrative glioma [31]. (B) The identification accuracy of an infiltrative and non-infiltrative brain tumour [61].
Similarly, for four different types of brain tumour (glioma, meningioma, hemangiopericytoma, and craniopharyngioma) classification Teng et al. [61] performed LIBS combined with machine learning techniques. They proposed to use the molecular fragment spectra (MFS) for further brain tumors diagnosis. Molecular fragments play a key role in the diagnosis of brain tumor, in literature, few researchers have worked on this. The MFS in LIBS is very new and commonly not practiced in biological samples. The most often used signals in LIBS research are the atomic spectra (AS). In this article, they used 12 patients’ tissue samples of four types of brain tumor. The four types above of brain tumors were diagnosed and classified as infiltrative and non-infiltrative tumors. Instead of the conventional machine learning technique, they established and implemented the spiking neural network (SNN) in MFS data analysis. They investigated the development processes of MFS in brain tissue in-depth, looking at three different types of formation mechanisms: combination, rearrangement, and break. The recognition precision reached 88.62% in 1–2 s, together with the proposed SNN brain-like computing system. This study presented three different MFS data types, with the ratio data type best suited for diagnosing various brain tumors. Due to substantial overfitting, the traditional machine learning methods kNN, ANN, and SVM did not perform well. SNN, as a third-generation neural network, has the potential to tackle this problem effectively, as shown in Figure 8B.
Nasopharyngeal Carcinoma
Nasopharyngeal carcinoma (NPC) is a rare subtype of head and neck cancer with a highly unbalanced endemic spread [62]. There is about one new occurrence for every 100,000 people every year in most parts of the world. The incident rate of NPC is 20–50 per 100,000 in southern China and Southeast Asia [63, 64]. For NPC discrimination, Chu et al. [65] used LIBS combined with chemometric methods. In this research, a total of 160 serum samples was used, including 100 healthy controls and 60 NPC patients.
Similarly, different chemometric methods like kNN, extreme learning machine (ELM) and feature extraction RF were used for classification and identification of NPC. The serum sample was dropped on a boric acid substrate for laser ablation. The major elements (Na, Mg, K, and Zn) from LIBS spectra were selected for diagnosis and further classification purposes. They concluded that, the variable importance of three lines (K I 766.49, K I 769.90, and Na I 589.59 nm) with RF extraction are much greater than the average variable importance. The accuracy rate, sensitivity, and specificity of NPC serum and healthy controls were 98.330, 99.022, and 97.751%, respectively, using the RF coupled with the ELM classifier. Furthermore, the RF-ELM model’s AUC was 0.987, which means that it has huge diagnostic efficiency.
Cervical Cancer
In 2018, there were nearly 570,000 cases of cervical cancer and 311,000 deaths reported. Cervical cancer is the fourth most widespread cancer among women. It is ranked after breast cancer (2.1 million cases), colorectal cancer (0.8 million), and lung cancer (0.7 million) in 2018 [66]. For the identification of cervical cancer Wang et al. [26] used paraffin-embedded tissue samples of normal and cervical cancer patients. They coupled LIBS with chemometric methods PCA and SVM for classification purposes. It was hard to distinguish between normal and cervical cancer tissue using the raw spectra. PCA was performed, but the result of PCA was overlapped, hard to differentiate the cervical and normal sample. Then for normal tissues and cervical cancer tissues identification, SVM and PCA-SVM were used. The findings found that the PCA-SVM identification accuracy is much better than SVM and increased from 93.06 to 94.44%. They also concluded that LIBS technology has a lot of potential for cancer diagnosis in real-time. To achieve the best calcification and discrimination results the sample numbers should be raised in the future.
Stomach Cancer
Stomach cancer is also known as gastric cancer. In worldwide cancer ranking, it is on fifth number. According to Cancer Global Observatory, in 2018, over one million new cases were reported [67]. For gastric cancer identification, Seifalinezhad et al. used spark discharge assisted laser-induced breakdown spectroscopy (SD-LIBS) in investigating the possibility of distinguishing neoplastic (cancerous) from non-neoplastic (normal) stomach tissues [68]. In this study, they also found the difference between neoplastic and non-neoplastic gastric tissues emission spectra. The study concentrated on an in vitro comparison of elemental concentrations in distinct tissues. Depending on these observations, the intensities of Ca and Mg in cancerous spectra are higher than the normal sample spectra obtained from the same person. Likewise, they also concluded that the number of samples used in this study was insufficient to draw a firm conclusion, and more research is needed to generalize this concept. Furthermore, the SD-LIBS technique should become easier to use in future in vivo studies.
Breast Cancer and Cervical Cancer
Breast cancer is the most top cancer among women throughout the world. In all-female cancer-related diseases, breast cancer is responsible for up to 16%. It is estimated that 2,088,849 new cases were reported, and 626,679 people died of breast cancer in 2018, and the most (69%) of deaths occur in developing countries, while this cancer is considered an acquired world disease [49]. Ghasemi et al. [69] used LIBS and acoustic response (AR) techniques to classify malignant human breast tissues from normal tissue. Here, using an acoustic analyzer, for sensing audio signals during microplasma generation. The signals distinguish the tissues according to the audio level and the spectral changes during the laser-induced development of micro-plasma. In malignant tissues, LIBS indicates a noticeable increase in trace elements such as calcium (Ca), sodium (Na), and magnesium (Mg) as determined by the characteristic emissions inside the laser induced micro-plasma.
Similarly, Hussain et al. [25] used spectroscopic techniques such as LIBS to recognize two human forms of cancer, including breast and colorectal cancer, as well as condition grade and incidence assessment. They found distinct variations in the density of calcium (Ca) and magnesium (Mg) spectral lines in the LIBS spectrum of non-neoplastic and malignant breast and colorectal tissue samples. To differentiate between cancerous in vitro human tissues of interest (breast, colon, larynx, and tongue) and normal ones, Ghasemi et al. [33] used the LIBS method. Using the laser mediated plasma spectrum, the trace elements are investigated. They concluded that the concentration of trace elements (such as calcium, sodium, and magnesium) in cancerous tumors is considerably higher in terms of the signature emissions of calcium (Ca), sodium (Na), and magnesium (Mg) within the laser-induced plasma. They also figure out that the plasma temperature is measurably higher for cancerous tissues than normal ones. Likewise, Wei et al. [70] Implemented multi-elemental LIBS mapping, based on conventional histopathological tumor therapeutic impact analysis and associated anti-tumour pathways, would offer a new approach to estimating the anti-tumor therapeutic effect and the molecular process, in line with the possible growth of precision medicine. Collectively, four distinctive elements from tumour tissues, calcium (Ca), copper (Cu), magnesium (Mg), and sodium (Na), were studied to project tumor therapeutic effects and investigate the potential of biological elements in the study of anti-tumor mechanisms. In addition, the complementarity and compatibility of elemental imaging focused on LIBS with conventional histopathology will offer a new avenue for the study of anti-tumor therapy.
Bone Cancer
Bone cancer occurs when abnormal cells in bone grow out of control [71]. It damaged normal bone tissue. The most prevalent bone cancer is osteosarcoma. This is responsible for almost two-thirds of all bone cancers cases. About 1,200 patients are diagnosed annually in the United States with osteosarcoma [72–75]. For the classification of bone tumors, Gill et al. [74] proposed research to understand the variations in femtosecond LIBS (fsLIBS) spectra. For laser ablation, they used samples of a primary bone tumour, a secondary bone tumour, and normal bone in this study. Essential differences in the fsLIBS signal between the primary tumor of the bone and normal bone samples were observed. They compared the separation of tumour and normal tissue with many other “normal” bone samples using a PCA decomposition of this combined data set. The PCA results revealed that the PCs of the two data sets substantially overlap, which shows that even when fresh new normal bone tissue is added to the data, the chemical distinctions between normal and cancerous tissue remain consistent. In tumor tissue, the magnesium (Mg) peak level (516 nm) increases compared to the calcium (Ca) peak intensity (526 nm) as well as PCA results are shown in Figure 9. The explanation why they did not notice a difference in the spectrum between metastatic bone tumor and normal bone may be because primary cancer cells migrate across the body, and other forms of cells may not cause a metabolic change (such as bone).
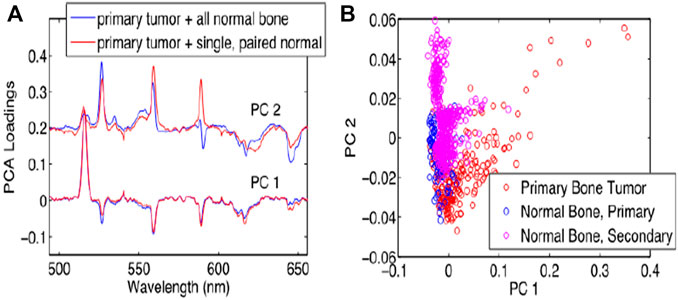
FIGURE 9. PCA result of different bone by fsLIBS [74].
Colon Cancer
Colon cancer is one of the world’s leading cancers and, along with lung, prostate and breast cancer, is considered among the major killers [75]. Gondala et al. [19] proposed a study to examine the samples of malignant and nonmalignant colon tissue using the LIBS technique and to ascertain a link between the accumulations of such heavy metals responsible for the formation of colon tissue malignancy. They found that LIBS is a reliable tool for detecting heavy metals in cancerous colon tissues, such as Hg, Cr, and Pb. These heavy metals were found in the malignant tissues, although these elements were not identified in control (healthy) colon tissue samples.
The ICP-OES methodology has been used to determine the authenticity and to validate the consistency of LIBS results. In addition, by concentrating on specific elements such as Hg and Cr in control tissues, electron temperature and electron density were calculated for the plasma derived from the malignant and control tissues to show that the plasma was in the LTE condition [19].
Lung Cancer
Lung cancer has long been seen as a significant public health issue. Every year, around 1.35 million people are diagnosed with the disease, with 1.18 million dying. This statistic is considerably higher than other cancers like breast and colon cancer, and the death rate in China and other countries is still rising [76]. The line between the lung tumour and the border tissue is blurry, during surgery. Recurrence can shorten a patient’s life if tumour excision is incomplete [77]. Lin et al. [36] used LIBS combined with machine learning techniques to differentiate lung boundaries from lung tissues. For this purpose, they used 90 tissue samples of lung tumor and lung boundary from 45 patients, of which 20 men and 25 were female, respectively. They used SVM and Boosting Tree classification models that employ PCA and RF to enhance accuracy, sensitivity, specificity, ROC curves, and AUC through 10-fold cross-validation. The RF-Boosting tree outperformed the competition in classification and recognition, with an accuracy of 98.9%, sensitivity and specificity of 99.3 and 98.6%, respectively, and an AUC of 0.988., as shown in Figure 10. The use of RF features increases data retention, reduces training time, and avoids duplicate data and interference. The combination of LIBS with an RF-Boosting Tree model to detect lung tumour boundaries is a rapid and accurate method.
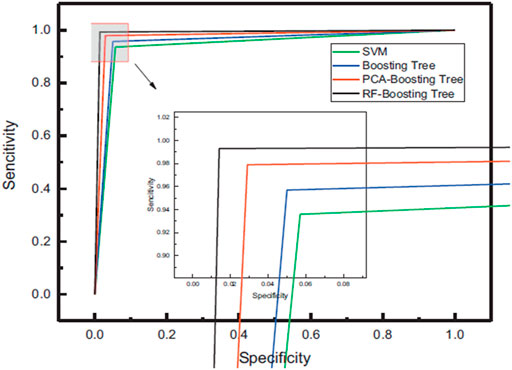
FIGURE 10. Four different classification models ROC curves [36].
Summary and Future Prospectus
In this review we discussed developments in LIBS technologies and critical discoveries on the identification and discrimination of various cancers. LIBS’s extraordinary discrimination findings based on different samples (tissues, blood) samples are extremely promising. Table 1 lists the LIBS technique studies on various cancers published in the literature, organized with varying sample categories. This table also recorded information on the laser, spectrometer, and analytical instruments used in the experiments. LIBS is a valuable and credible method for distinguishing between malignant and benign tissues and classifying normal tissues. A significant research project is to find ways to reduce the gap between LIBS laboratory research and clinical translation.
Any kind of sample can be analyzed using LIBS in a typical laboratory environment. It is vital to prevent any surface contamination when processing the sample to perform repeatable LIBS analysis. Furthermore, instrumental parameters (such as laser energy and sample surface orientation about the laser focus) must be monitored and maintained during the whole experiment. LIBS can also be used in combination with other spectroscopic techniques, including Raman spectroscopy [78], and laser-induced fluorescence [79, 80]. These multi-modal methods hold massive potential because they can gather detailed information about the samples’ composition.
Furthermore, in-depth evaluation and analysis with high precision are needed for various aspects such as the economy, health, and lifestyle. To this end, new methods for medical samples analysis are being tested regularly to keep up with scientific advancements. Preliminary tests on a variety of different tissues or fluids samples have shown extremely impressive findings for LIBS. The number of applications requiring different chemometric data processing has grown significantly in recent years to enhance the system’s capability. Chemometrics is also used to solve a variety of practical problems, such as the exploitation of biologically active species, the effective use of biomarkers, the advancement of clinical diagnosis, the monitoring and prediction of a patient’s condition, drug design, and the classification of toxic chemical substances [81].
Regarding future developments and practical uses of LIBS in cancer detection and classification, the following suggestions were made: 1) Suitable chemometric methods and preprocessing methods should be used to enhance LIBS calibration and classification accuracy. Chemometrics models’ performance, accuracy, and pattern recognition in cancer detection and classification differ depending on the sample type and model type utilized. Further performance improvements of LIBS technology in various application fields, especially in the medical area, will undoubtedly be part of the future advancement of chemometrics analysis of LIBS data. Preprocessing methods combination with chemometrics, we believe, play a critical role in LIBS. 2) For a deeper understanding and practical use, the mechanism of laser-matter interaction for medical samples should be investigated further. While signal enhancement and data processing methods have enhanced efficiency, the mechanisms beyond these methods are still unknown. 3) For successful LIBS analysis, the input data must be of the highest quality, optimizing the experimental parameters and controlling them during LIBS measurements. 4) To achieve the best calssification and discrimination results the sample numbers should be raised in the future.
Finally, this review aims to assist those who wish to use the LIBS technique in a medical setting in gaining a basic understanding of the prerequisites and shortcomings to do a thorough study of this field. The reader is also faced with various chemometrics tools that can be used in LIBS measurements to obtain valid qualitative and quantitative data, especially in different cancers detection and classification.
Author Contributions
MK, BI and WX, contributed to conception and design of the study. GT and XC organized the database. KW wrote the first draft of the manuscript. QW wrote sections of the manuscript and reviewed carefully. MA also reviewed the paper. ZZ contribution is the review of the revise version, she also contributed in the literature of LIBS in different cancers, especially designed the Table 1 in the review manuscript. All authors contributed to manuscript revision, read, and approved the submitted version.
Funding
This work was supported by the National Natural Science Foundation of China (62075011) and Graduate Technological Innovation Project of Beijing Institute of Technology (2019CX20026).
Conflict of Interest
The authors declare that the research was conducted in the absence of any commercial or financial relationships that could be construed as a potential conflict of interest.
Publisher’s Note
All claims expressed in this article are solely those of the authors and do not necessarily represent those of their affiliated organizations, or those of the publisher, the editors and the reviewers. Any product that may be evaluated in this article, or claim that may be made by its manufacturer, is not guaranteed or endorsed by the publisher.
References
1. Hassanpour SH, Dehghani M. Review of Cancer from Perspective of Molecular. J Cancer Res Pract (2017) 4(04):127–9. doi:10.1016/j.jcrpr.2017.07.001
2. Das P, Srivastav AK, Muthukannan MR. A Study on Molecular Targeted Approaches to Cancer Therapy and the Role of Chalcones in Chemoprevention. Eur J Mol Clin Med (2021) 8(03):3254–3267. Available from: https://ejmcm.com/article_11701.html.
3. Singh Kainth H, Khandelwal D, Singh R, Singh G, Puri S. Role of Trace Elements in Breast Cancer and Their Characterization Using X-Ray Fluorescence Techniques. In: Trace Elements and its Effects on Human Health and Disease. London, UK: IntechOpen (2020). doi:10.5772/intechopen.95491
4. Ladeira LCM, Dos Santos EC, Valente GE, da Silva J, Santos TA, dos Santos Costa Maldonado IR. Could Biological Tissue Preservation Methods Change Chemical Elements Proportion Measured by Energy Dispersive X-ray Spectroscopy? Biol Trace Elem Res (2020) 196(1):168–72. doi:10.1007/s12011-019-01909-x
5. Puja P, Vinita NM, Devan U, Velangani AJ, Srinivasan P, Yuvakkumar R, et al. Fluorescence Microscopy‐based Analysis of Apoptosis Induced by Platinum Nanoparticles against Breast Cancer Cells. Appl Organomet Chem (2020) 34(9):e5740. doi:10.1002/aoc.5740
6. Busser B, Moncayo S, Coll J-L, Sancey L, Motto-Ros V. Elemental Imaging Using Laser-Induced Breakdown Spectroscopy: A New and Promising Approach for Biological and Medical Applications. Coord Chem Rev (2018) 358:70–9. doi:10.1016/j.ccr.2017.12.006
7. Meenu S, Sairam ST, Panicker AS, Oommen S, Sankaran R. Comparison of Polymerase Chain Reaction (PCR), Microbiological and Histopathological Observations in the Diagnosis of Endometrial Tuberculosis. J Obstet Gynecol India (2020) 70(6):510–5. doi:10.1007/s13224-020-01367-9
8. Santos IP, Barroso EM, Bakker Schut TC, Caspers PJ, van Lanschot CGF, Choi D-H, et al. Raman Spectroscopy for Cancer Detection and Cancer Surgery Guidance: Translation to the Clinics. Analyst (2017) 142:3025–47. doi:10.1039/c7an00957g
9. Chen T, Zhang T, Li H. Applications of Laser-Induced Breakdown Spectroscopy (LIBS) Combined with Machine Learning in Geochemical and Environmental Resources Exploration. Trac Trends Anal Chem (2020) 133:116113. doi:10.1016/j.trac.2020.116113
10. Harmon RS, Senesi GS. Laser-Induced Breakdown Spectroscopy - A Geochemical Tool for the 21st century. Appl Geochem (2021) 128:104929. doi:10.1016/j.apgeochem.2021.104929
11. Arantes de Carvalho GG, Bueno Guerra MB, Adame A, Nomura CS, Oliveira PV, Pereira de Carvalho HW, et al. Recent Advances in LIBS and XRF for the Analysis of Plants. J Anal Spectrom (2018) 33(6):919–44. doi:10.1039/c7ja00293a
12. Thakur SN, Singh JP. Fundamentals of LIBS and Recent Developments. In: Laser-Induced Breakdown Spectroscopy. Amsterdam, Netherlands: Elsevier (2020). p. 3–22. doi:10.1016/b978-0-12-818829-3.00001-0
13. de Carvalho LFDCES, Saito Nogueira M. New Insights of Raman Spectroscopy for Oral Clinical Applications. Analyst (2018) 143:6037–48. doi:10.1039/c8an01363b
14. Jolivet L, Leprince M, Moncayo S, Sorbier L, Lienemann C-P, Motto-Ros V. Review of the Recent Advances and Applications of LIBS-Based Imaging. Spectrochimica Acta B: At Spectrosc (2019) 151:41–53. doi:10.1016/j.sab.2018.11.008
15. Morel S, Leone N, Adam P, Amouroux J. Detection of Bacteria by Time-Resolved Laser-Induced Breakdown Spectroscopy. Appl Opt (2003) 42:6184. doi:10.1364/ao.42.006184
16. Rehse SJ, Salimnia H, Miziolek AW. Laser-induced Breakdown Spectroscopy (LIBS): an Overview of Recent Progress and Future Potential for Biomedical Applications. J Med Eng Technol (2012) 36(2):77–89. doi:10.3109/03091902.2011.645946
17. Kumar A, Yueh F-Y, Singh JP, Burgess S. Characterization of Malignant Tissue Cells by Laser-Induced Breakdown Spectroscopy. Appl Opt (2004) 43(28):5399. doi:10.1364/ao.43.005399
18. Melikechi N, Markushin Y, Connolly DC, Lasue J, Ewusi-Annan E, Makrogiannis S. Age-specific Discrimination of Blood Plasma Samples of Healthy and Ovarian Cancer Prone Mice Using Laser-Induced Breakdown Spectroscopy. Spectrochimica Acta Part B: At Spectrosc (2016) 123:33–41. doi:10.1016/j.sab.2016.07.008
19. Gondal MA, Aldakheel RK, Almessiere MA, Nasr MM, Almusairii JA, Gondal B. Determination of Heavy Metals in Cancerous and Healthy colon Tissues Using Laser Induced Breakdown Spectroscopy and its Cross-Validation with ICP-AES Method. J Pharm Biomed Anal (2020) 183:113153. doi:10.1016/j.jpba.2020.113153
20. El Sherbini AM, Hagras MM, Farag HH, Mohamed RM. Diagnosis and Classification of Liver Cancer Using LIBS Technique and Artificial Neural Network. Int J Sci Res (2015) 4:1153. doi:10.7717/peerj-cs.270/fig-1
21. Teran-Hinojosa E, Sobral H, Sánchez-Pérez C, Pérez-García A, Alemán-García N, Hernández-Ruiz J. Differentiation of Fibrotic Liver Tissue Using Laser-Induced Breakdown Spectroscopy. Biomed Opt Express (2017) 8(8):3816–27. doi:10.1364/boe.8.003816
22. Chen X, Li X, Yang S, Yu X, Liu A. Discrimination of Lymphoma Using Laser-Induced Breakdown Spectroscopy Conducted on Whole Blood Samples. Biomed Opt Express (2018) 9(3):1057. doi:10.1364/boe.9.001057
23. Chen X, Li X, Yu X, Chen D, Liu A. Diagnosis of Human Malignancies Using Laser-Induced Breakdown Spectroscopy in Combination with Chemometric Methods. Spectrochimica Acta Part B: At Spectrosc (2018) 139:63–9. doi:10.1016/j.sab.2017.11.016
24. Chu Y, Chen T, Chen F, Tang Y, Tang S, Jin H, et al. Discrimination of Nasopharyngeal Carcinoma Serum Using Laser-Induced Breakdown Spectroscopy Combined with an Extreme Learning Machine and Random forest Method. J Anal Spectrom (2018) 33(12):2083–8. doi:10.1039/c8ja00263k
25. El-Hussein A, Kassem AK, Ismail H, Harith MA. Exploiting LIBS as a Spectrochemical Analytical Technique in Diagnosis of Some Types of Human Malignancies. Talanta (2010) 82(2):495–501. doi:10.1016/j.talanta.2010.04.064
26. Wang J, Yang LP, Zhu YY, Hao MZ, Li X. Identification of Cervical Cancer Using Laser-Induced Breakdown Spectroscopy Coupled with Principal Component Analysis and Support Vector Machine. Lasers Med Sci (2018) 33:1381–6. doi:10.1007/s10103-018-2500-2
27. Li X, Yang S, Chen X, Yao G, Liu A, Yu X. Multi-elemental Imaging of Breast Cancer Tissues Using Laser-Induced Breakdown Spectroscopy. In: 2019 Conference on Lasers and Electro-Optics Europe & European Quantum Electronics Conference (CLEO/Europe-EQEC). Munich, Germany: IEEE (2019). p. 1. doi:10.1109/cleoe-eqec.2019.8871560
28. Gaudiuso R, Ewusi-Annan E, Melikechi N, Sun X, Liu B, Campesato LF, et al. Using LIBS to Diagnose Melanoma in Biomedical Fluids Deposited on Solid Substrates: Limits of Direct Spectral Analysis and Capability of Machine Learning. Spectrochimica Acta Part B: At Spectrosc (2018) 146:106–14. doi:10.1016/j.sab.2018.05.010
29. Cremers DA, Radziemski LJ. Handbook of Laser-Induced Breakdown Spectroscopy. Hoboken, NJ, USA: John Wiley & Sons (2013). doi:10.1007/978-3-642-20668-9
30. Han JH, Moon Y, Lee JJ, Choi S, Kim Y-C, Jeong S. Differentiation of Cutaneous Melanoma from Surrounding Skin Using Laser-Induced Breakdown Spectroscopy. Biomed Opt Express (2016) 7(1):57. doi:10.1364/boe.7.000057
31. Teng G, Wang Q, Zhang H, Xiangli W, Yang H, Qi X, et al. Discrimination of Infiltrative Glioma Boundary Based on Laser-Induced Breakdown Spectroscopy. Spectrochimica Acta Part B: At Spectrosc (2020) 165:105787. doi:10.1016/j.sab.2020.105787
32. Ghasemi F, Parvin P, Hosseini Motlagh NS, Amjadi A, Abachi S. Laser Induced Breakdown Spectroscopy and Acoustic Response Techniques to Discriminate Healthy and Cancerous Breast Tissues. Appl Opt (2016) 55(29):8227–35. doi:10.1364/ao.55.008227
33. Ghasemi F, Parvin P, Reif J, Abachi S, Mohebbifar MR, Razzaghi MR. Laser Induced Breakdown Spectroscopy for the Diagnosis of Several Malignant Tissue Samples. J Laser Appl (2017) 29(4):042005. doi:10.2351/1.4989376
34. Seifalinezhad A, Bahreini M, Hassani Matin MM, Tavassoli SH. Feasibility Study on Discrimination of Neo-Plastic and Non-neoplastic Gastric Tissues Using Spark Discharge Assisted Laser Induced Breakdown Spectroscopy. J Lasers Med Sci (2018) 10(1):64–9. doi:10.15171/jlms.2019.10
35. Yue Z, Sun C, Chen F, Zhang Y, Xu W, Shabbir S, et al. Machine Learning-Based LIBS Spectrum Analysis of Human Blood Plasma Allows Ovarian Cancer Diagnosis. Biomed Opt Express (2021) 12(5):2559–74. doi:10.1364/boe.421961
36. Lin X, Sun H, Gao X, Xu Y, Wang Z, Wang Y. Discrimination of Lung Tumor and Boundary Tissues Based on Laser-Induced Breakdown Spectroscopy and Machine Learning. Spectrochimica Acta Part B: At Spectrosc (2021) 180:106200. doi:10.1016/j.sab.2021.106200
37. Fahad M, Abrar M. Laser-induced Breakdown Spectroscopic Studies of Calcite (CaCO3) marble Using the Fundamental (1064 Nm) and Second (532 Nm) Harmonic of a Nd:YAG Laser. Laser Phys (2018) 28(8):085701. doi:10.1088/1555-6611/aac5cd
38. Martínez-Hernández A, Oujja M, Sanz M, Carrasco E, Detalle V, Castillejo M. Analysis of Heritage Stones and Model wall Paintings by Pulsed Laser Excitation of Raman, Laser-Induced Fluorescence and Laser-Induced Breakdown Spectroscopy Signals with a Hybrid System. J Cult Heritage (2018) 32:1–8. doi:10.1016/j.culher.2018.02.004
39. Verma A. Speculating the Impact of Physics in Medical World (2020). doi:10.1016/j.ejmp.2018.06.183
40. Indini A, Nigro O, Lengyel CG, Ghidini M, Petrillo A, Lopez S, et al. Immune-Checkpoint Inhibitors in Platinum-Resistant Ovarian Cancer. Cancers (2021) 13(7):1663. doi:10.3390/cancers13071663
41. Is W, Cancer O. What Is Ovarian Cancer? (2021). 1–14. Available from: https://www.cdc.gov/cancer/ovarian/basic_info/.
42. Prat J, D'Angelo E, Espinosa I. Ovarian Carcinomas: at Least Five Different Diseases with Distinct Histological Features and Molecular Genetics. Hum Pathol (2018) 80:11–27. doi:10.1016/j.humpath.2018.06.018
43. Ohmachi K, Ogura M, Suehiro Y, Ando K, Uchida T, Choi I, et al. A Multicenter Phase I Study of Inebilizumab, a Humanized Anti-CD19 Monoclonal Antibody, in Japanese Patients with Relapsed or Refractory B-Cell Lymphoma and Multiple Myeloma. Int J Hematol (2019) 109(6):657–64. doi:10.1007/s12185-019-02635-9
44. Stecco A, Buemi F, Iannessi A, Carriero A, Gallamini A. Current Concepts in Tumor Imaging with Whole-Body MRI with Diffusion Imaging (WB-MRI-DWI) in Multiple Myeloma and Lymphoma. Leuk Lymphoma (2018) 59(11):2546–56. doi:10.1080/10428194.2018.1434881
45. Graklanov V, Popov V. Vitamin D Levels in Patients with Non-hodgkin Lymphoma/diffuse Large B-Cell Lymphoma, Chronic Lymphocytic Leukemia and Multiple Myeloma. J Int Med Res (2020) 48(7):030006052094342. doi:10.1177/0300060520943421
46. Ravi P, KumarCerhan SK, Maurer JRMJ, Ansell DSM, Rajkumar SV. Defining Cure in Multiple Myeloma: a Comparative Study of Outcomes of Young Individuals with Myeloma and Curable Hematologic Malignancies. Blood Cancer J (2018) 8(3):1–7. doi:10.1038/s41408-018-0065-8
47. Bongaarts J. World Health Organization Health in 2015: From MDGs, Millennium Development Goals, to SDGs, Sustainable Development Goals Geneva: WHO Press, 2016. 212 P. $60.00 (pbk.). Popul Develop Rev (2016) 42:575. doi:10.1111/padr.12006
48. Chu Y, Chen F, Sheng Z, Zhang D, Zhang S, Wang W, et al. Blood Cancer Diagnosis Using Ensemble Learning Based on a Random Subspace Method in Laser-Induced Breakdown Spectroscopy. Biomed Opt Express (2020) 11(8):4191–202. doi:10.1364/boe.395332
49. Bray F, Ferlay J, Soerjomataram I, Siegel RL, Torre LA, Jemal A. Erratum: Global Cancer Statistics 2018: GLOBOCAN Estimates of Incidence and Mortality Worldwide for 36 Cancers in 185 Countries. CA A Cancer J Clin (2020) 70:313. doi:10.3322/caac.21609
50. Turner N, Ware O, Bosenberg M. Genetics of Metastasis: Melanoma and Other Cancers. Clin Exp Metastasis (2018) 35(5):379–91. doi:10.1007/s10585-018-9893-y
51. Moon Y, Han JH, Choi J-h., Shin S, Kim Y-C, Jeong S. Mapping of Cutaneous Melanoma by Femtosecond Laser-Induced Breakdown Spectroscopy. J Biomed Opt (2018) 24(03):1. doi:10.1117/1.jbo.24.3.031011
52. Srivastava E, Jang H, Shin S, Choi J, Jeong S, Hwang E. Weighted-averaging-based Classification of Laser-Induced Breakdown Spectroscopy Measurements Using Most Informative Spectral Lines. Plasma Sci Technol (2019) 22(1):015501. doi:10.1088/2058-6272/ab481e
53. Khan MN, Wang Q, Idrees BS, Teng G, Cui X, Wei K. Discrimination of Melanoma Using Laser-Induced Breakdown Spectroscopy Conducted on Human Tissue Samples. J Spectrosc (2020) 2020:1–11. doi:10.1155/2020/8826243
54. Gaudiuso R, Ewusi-Annan E, Melikechi N, Sun X, Liu B, Campesato LF, et al. Using LIBS to Diagnose Melanoma in Biomedical Fluids Deposited on Solid Substrates: Limits of Direct Spectral Analysis and Capability of Machine Learning. Spectrochimica Acta Part B: At Spectrosc (2018) 146(April):106–14. doi:10.1016/j.sab.2018.05.010
55. Li X, Ramadori P, Pfister D, Seehawer M, Zender L, Heikenwalder M, The Immunological and Metabolic Landscape in Primary and Metastatic Liver Cancer, Nat Rev Cancer (2021) 21:541–57. doi:10.1038/s41568-021-00383-9
56. Sun M, Tan, L, Hu M. The Role of Autophagy in Hepatic Fibrosis. Am J Transl Res (2021) 13(6):5747–57. doi:10.1007/s10067-020-05111-6
57. Teran-Hinojosa E, Sobral H, Sánchez-Pérez C, Pérez-García A, Alemán-García N, Hernández-Ruiz J. Differentiation of Fibrotic Liver Tissue Using Laser-Induced Breakdown Spectroscopy. Biomed Opt Express (2017) 8(8):3816. doi:10.1364/boe.8.003816
58. Myronenko A. 3D MRI Brain Tumor Segmentation Using Autoencoder Regularization. Int MICCAI Brainlesion Workshop (2019) 11384:311–20. doi:10.1007/978-3-030-11726-9_28
59. Ari A, Hanbay D. Deep Learning Based Brain Tumor Classification and Detection System. Turk J Elec Eng Comp Sci (2018) 26(5):2275–86. doi:10.3906/elk-1801-8
60. Abiwinanda N, Hanif M, Hesaputra ST, Handayani A, Mengko TR. Brain Tumor Classification Using Convolutional Neural Network. World congress Med Phys Biomed Eng (2019) 68(1):183–9. doi:10.1007/978-981-10-9035-6_33
61. Teng G, Wang Q, Yang H, Qi X, Zhang H, Cui X, et al. Pathological Identification of Brain Tumors Based on the Characteristics of Molecular Fragments Generated by Laser Ablation Combined with a Spiking Neural Network. Biomed Opt Express (2020) 11(8):4276–89. doi:10.1364/boe.397268
62. Chen Y-P, Chan ATC, Le Q-T, Blanchard P, Sun Y, Ma J. Nasopharyngeal Carcinoma. Lancet (London, England) (2019) 394(10192):64–80. doi:10.1016/b978-0-12-814936-2.00001-8
63. Cui Q, Feng F-T, Xu M, Liu W-S, Yao Y-Y, Xie S-H, et al. Nasopharyngeal Carcinoma Risk Prediction via Salivary Detection of Host and Epstein-Barr Virus Genetic Variants. Oncotarget (2017) 8(56):95066–74. doi:10.18632/oncotarget.11144
64. Chu YW, Chen F, Tang Y, Chen T, Yu YX, Jin HL, et al. Diagnosis of Nasopharyngeal Carcinoma from Serum Samples Using Hyperspectral Imaging Combined with a Chemometric Method. Opt Express (2018) 26(22):28661–71. doi:10.1364/oe.26.028661
65. Chu Y, Chen T, Chen F, Tang Y, Tang S, Jin H, et al. Discrimination of Nasopharyngeal Carcinoma Serum Using Laser-Induced Breakdown Spectroscopy Combined with an Extreme Learning Machine and Random forest Method. J Anal Spectrom (2018) 33(12):2083–8. doi:10.1039/c8ja00263k
66. Marc A, Weiderpass E, Bruni L, de Sanjosé S, Saraiya M, Ferlay J, et al. Articles Estimates of Incidence and Mortality of Cervical Cancer in 2018 : a Worldwide Analysis. Lancet Glob Health (2019) 19:1–13. doi:10.1016/S2214-109X(19)30482-6
67. Bray F, Ferlay J, Soerjomataram I, Siegel RL, Torre LA, Jemal A. Global Cancer Statistics 2018: GLOBOCAN Estimates of Incidence and Mortality Worldwide for 36 Cancers in 185 Countries. CA: A Cancer J Clinicians (2018) 68(6):394–424. doi:10.3322/caac.2160910.3322/caac.21492
68. Seifalinezhad A, Bahreini M, Hassani Matin MM, Tavassoli SH. Feasibility Study on Discrimination of Neo-Plastic and Non-neoplastic Gastric Tissues Using Spark Discharge Assisted Laser Induced Breakdown Spectroscopy. J Lasers Med Sci (2019) 10(1):64–9. doi:10.15171/jlms.2019.10
69. Ghasemi F, Parvin P, Hosseini Motlagh NS, Amjadi A, Abachi S. Laser Induced Breakdown Spectroscopy and Acoustic Response Techniques to Discriminate Healthy and Cancerous Breast Tissues. Appl Opt (2016) 55(29):8227. doi:10.1364/ao.55.008227
70. Wei H, Zhao Z, Lin Q, Duan Y. Study on the Molecular Mechanisms against Human Breast Cancer from Insight of Elemental Distribution in Tissue Based on Laser-Induced Breakdown Spectroscopy (LIBS). Biol Trace Elem Res (2020) 199:1686–92. doi:10.1007/s12011-020-02292-8
71. Tarver T, Albano J, Samuels A, Ward ME, Thum JM. Cancer Facts & Figures 2012. American Cancer Society (ACS). J Consumer Health Internet (2012) 16:366–7. doi:10.1080/15398285.2012.701177
72. Ferguson JL, Turner SP. Bone Cancer: Diagnosis and Treatment Principles. Am Fam Physician (2012) 98(4):205–13. Available from: https://pubmed.ncbi.nlm.nih.gov/30215968/.
73.PDQ Pediatric Treatment Editorial Board. Ewing Sarcoma Treatment (PDQ®). In: PDQ Cancer Information Summaries [Internet]. Bethesda, Maryland: National Cancer Institute United States (2018). Available from: https://pubmed.ncbi.nlm.nih.gov/26389350/.
74. Gill RK, Smith ZJ, Panchal RR, Bishop JW, Gandour-Edwards R, Wachsmann-Hogiu S. Preliminary fsLIBS Study on Bone Tumors. Biomed Opt Express (2015) 6(12):4850–8. doi:10.1364/boe.6.004850
75. Grothey A, Sobrero AF, Shields AF, Yoshino T, Paul J, Taieb J, et al. Duration of Adjuvant Chemotherapy for Stage III Colon Cancer. N Engl J Med (2018) 378(13):1177–88. doi:10.1056/nejmoa1713709
76. Visser MPJ, van Grimbergen I, Hölters J, Barendregt WB, Vermeer LC, Vreuls W, et al. Performance Insights of Endobronchial Ultrasonography (EBUS) and Mediastinoscopy for Mediastinal Lymph Node Staging in Lung Cancer. Lung Cancer (2021) 156:122–8. doi:10.1016/j.lungcan.2021.04.003
77. Osarogiagbon RU, Smeltzer MP, Faris NR, Ray MA, Fehnel C, Ojeabulu P, et al. Outcomes after Use of a Lymph Node Collection Kit for Lung Cancer Surgery: A Pragmatic, Population-Based, Multi-Institutional, Staggered Implementation Study. J Thorac Oncol (2021) 16(4):630–42. doi:10.1016/j.jtho.2020.12.025
78. Dhanada VS, George SD, Kartha VB, Chidangil S, Unnikrishnan VK. Hybrid LIBS-Raman-LIF Systems for Multi-Modal Spectroscopic Applications: a Topical Review. Appl Spectrosc Rev (2021) 56(6):1–29. doi:10.1080/05704928.2020.1800486
79. Shen XK, Wang H, Xie ZQ, Gao Y, Ling H, Lu YF. Detection of Trace Phosphorus in Steel Using Laser-Induced Breakdown Spectroscopy Combined with Laser-Induced Fluorescence. Appl Opt (2009) 48(13):2551–8. doi:10.1364/ao.48.002551
80. Li J, Hao Z, Zhao N, Zhou R, Yi R, Tang S, et al. Spatially Selective Excitation in Laser-Induced Breakdown Spectroscopy Combined with Laser-Induced Fluorescence. Opt Express (2017) 25(5):4945–51. doi:10.1364/oe.25.004945
Keywords: laser-induced breakdown spectroscopy, cancer, detection, tissue, chemometrics
Citation: Khan MN, Wang Q, Idrees BS, Xiangli W, Teng G, Cui X, Zhao Z, Wei K and Abrar M (2022) A Review on Laser-Induced Breakdown Spectroscopy in Different Cancers Diagnosis and Classification. Front. Phys. 10:821057. doi: 10.3389/fphy.2022.821057
Received: 23 November 2021; Accepted: 05 January 2022;
Published: 01 February 2022.
Edited by:
Yufei Ma, Harbin Institute of Technology, ChinaReviewed by:
Ye Tian, Ocean University of China, ChinaLianbo Guo, Huazhong University of Science and Technology, China
Copyright © 2022 Khan, Wang, Idrees, Xiangli, Teng, Cui, Zhao, Wei and Abrar. This is an open-access article distributed under the terms of the Creative Commons Attribution License (CC BY). The use, distribution or reproduction in other forums is permitted, provided the original author(s) and the copyright owner(s) are credited and that the original publication in this journal is cited, in accordance with accepted academic practice. No use, distribution or reproduction is permitted which does not comply with these terms.
*Correspondence: Qianqian Wang, cXF3YW5nQGJpdC5lZHUuY24=