- 1School of Electronic and Electrical Engineering, Shanghai University of Engineering Science, Shanghai, China
- 2Engineering School, DEIM, University of Tuscia, Viterbo, Italy
Engineering applications of the fractional Weibull distribution (fWd) are quite limited because a corresponding stochastic process is not yet constituted and completely analyzed of fundamental properties. In order to fill this gap, the fractional Weibull process (fWp) is defined in this paper with the realization algorithm. The self-similarity property as well as long range dependence (LRD) are proven for the future research. The simulation is conducted by the actual data. The fWd is utilized to fit the actual probability distribution and the corresponding process is generated to reflect the stochasticity of the data. The random walk based on the fWp expands the simulation to the planar space.
1 Introduction
After the discovery of fractal geometry, there has been recently a growing interest for the application of the fractional dimension processes in several fields. The fractional process is often used in the modeling of the Internet traffic. An abstract model for aggregated connectionless traffic, which is based on the fractional Brownian motion, is presented in [1]. In [2], generalized fractional Gaussian noise is proposed and used in the traffic modelling. The stochastic process with fractional dimension can also be used in the field of remaining useful life prediction for the mechanical parts. The remaining useful life is the remaining time for the mechanical parts before the next failure. The purpose of the remaining useful life prediction is to schedule the maintenance of the system and improve the reliability. The multi-modal fractional Lévy stable motion degradation model is developed to predict the remaining useful life of a blast furnace [3].
The Weibull distribution was originally introduced for modeling the strength data of material by Weibull in 1939, which is inspired by the works of the extreme value distribution, and then extended to several fields [4]. The traditional applications of the Weibull distribution is in the field of mechanical engineering, which is the lifetime prediction. A new extended model is used in the lifetime prediction in [5]. The Weibull distribution is combined with the artificial neural network to form a new predicting model for the prediction of the remaining useful life of the bearing [6]. There are also a lot of applications of Weibull distribution in the power system. The combining modified Weibull distribution model is proposed for the forecast of the power system reliability [7]. Based on simple and complex Weibull distributions, a hypothesis of the power system reliability has been confirmed [8]. In [9] the upper-truncated Weibull distribution has been used both for modeling the wind speed data and estimating the wind power density. Weibull distribution is combined with the artificial neural network to establish an advanced wind speed prediction model [10].
The versatility of Weibull distribution raises people’s interests on the fractional transformation. In [11] the fWd was proposed for modeling the wind speed data. The researchers find out that the actual wind speed data contains a lot of low wind speed values. By discarding the wind speed data that is close to zero, the wind speed is fitted by the fWd with high accuracy for the speed range suitable for wind power production. The fractal parameter is the fraction of data extracted from the wind speed data to make a better fit. Therefore, the essence of the fWd is to improve the fitting results by an additional fractal parameter.
In [12], the power load is modeled by the Weibull distribution. The power load data resembles the wind speed data because the power load is commonly be zero or approximate to zero. In the power break, the load is zero. At night, the factories are closed, therefore the total power load consumption in the area is close to zero. Therefore, this paper proposes the fWd for the modelling of the power load in wish of a better modelling result.
Probability distribution as fWd describes the time series in the statistical sense. In order to express the temporal characteristics of the time series conforming to fWd, the corresponding stochastic process need to be defined and studied. In this paper, the fWp is defined with respect to fWd. At each of the time point, draw a value randomly from the fWd will constitute the corresponding fWp temporally. If we count the values of the fWp in a long enough time period, the frequency distribution of the counted data will be the corresponding fWd. Therefore, the fWd and fWp are strongly connected mathematically.
As a stochastic process is defined, some fundamental and crucial property for the process need to be studied. Random walk characteristics is a common stochastic behavior for a process, which is beneficial in the optimization and graph machine learning. The random walk can be useful for the optimization to avoid the local maximum and the graph machine learning to simplify the graph. A lot of stochastic time series in the application conveys the properties of the self-similarity and LRD, which is useful for the study. Stochastic process with self-similarity and LRD can be employed in the modeling and prediction of the time series with the same properties. Therefore, in this paper, the random walk characteristics, self-similarity and LRD of the fWd are studied and illustrated to facilitate the future engineering application of the proposed process.
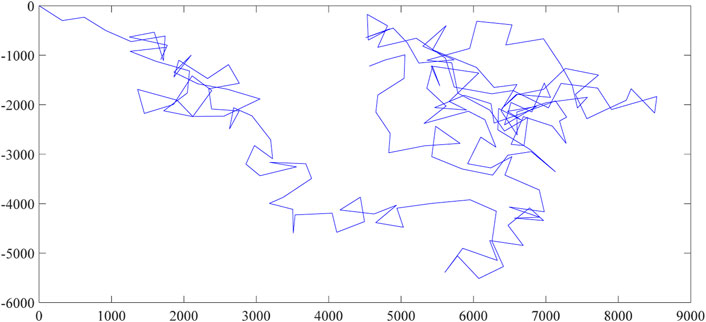
A random walk is known as a random behavior, in which a particle in space takes a succession of random steps to create a trajectory of moving [13]. In each of the step, the direction is random and the step length follows a certain distribution. If the distribution is normal distribution, then the random walk is called Rayleigh flight [14]. The random walk with the probability distribution to be Lévy distribution is called the Lévy flight [15]. In this paper, the random walk based on the fWp is proposed, in which the probability for the step length is the fWd.
Self-similarity means that the partial segment of the stochastic process or distribution resembles the whole stochastic process or distribution [16]. In [17], the Weibull distribution is used in the modelling of the self-similar Internet traffic and the formula of the self-similarity parameter is derived in [18]. The Hurst parameter of the Weibull distribution belongs to (0.5,1), which can be confirmed from the formula in [18]. Moreover, the mathematical definition of self-similarity contains the concept of equality in distribution [19]. Two random variables X and Y are said to be equal in distribution, if they have the same probability distribution function. In [20] a proposition is proven for the equivalent condition of the equality in distribution. In this paper, the proposition is employed to prove the self-similarity of the fWp.
LRD means that the value of the stochastic process is strongly influenced by the previous values of the time series [21]. The autocorrelation function of the long range dependent signal cannot be integrated in the infinity range, instead it diverges to infinity. The reason for the divergence is that the autocorrelation decays to zero very slowly as the power functional speed. In order to make the integration to converge, the autocorrelation need to decay exponentially, which corresponds to the short range dependence.
In [22] the following theorem about the connection between the self-similarity and LRD has been proved so that we can prove the LRD based on self-similarity:
If a process is self-similar with self-similarity parameter belonging to the half unit interval of (0.5, 1) and the second moments exist, then it can be shown that its incremental stochastic process is characterized by LRD.
In this paper, fWp is defined with respect to the fWd and the random walk characteristics is analyzed. The self-similarity property and the existence of the second moments are proved, therefore the incremental process of fWp is characterized by LRD [22]. Furthermore, LRD of the fWp is derived. The simulation is carried out with the real data.
The rest of the paper is arranged as follows: In Section 2, the properties of fWd is elaborated and the corresponding fWp is defined with the realization algorithm. In Section 3 and Section 4, the self-similarity and LRD of the fWp are proven. In Section 5, the simulation of the fWp is carried out with the analysis for the corresponding random walk. The work of this paper is summarized in the conclusion.
2 The fWp as well as the corresponding random walk
2.1 Data modeling with the fWd
The density function of the fWd is defined as:
where
The location parameter
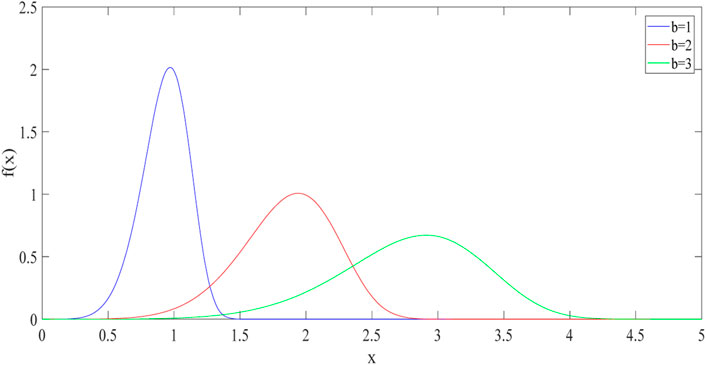
Changing the scale parameter b while the other parameters are hold constants will cause the curve to shift both vertically and horizontally (see e. g., Figure 1). With the increase of the scale parameter, the dispersion of the distribution is larger. and the skewness of the data is smaller.
The skewness is very important for the modeling of the real physical quantities. The maximum and minimum of the data is confined by the application background of the data. Therefore, the data area with high probability is relatively small and the probability for other areas are close to zero. This common phenomenon introduces skewness to the actual density function with its admissible range between zero and positive infinity. The skewness of fWd makes it easier to describe this sort of data distribution.
Comparing with the Weibull density function, the probability density function of the fWd has a scaling factor
The physical meaning of
2.2 Definition and realization algorithm of the fWp
Definition of the fWp:
The stochastic process is fWp if the following two conditions are satisfied:
1.
2.The increments of the fWp are independent (2.3)
3. For given
Set s to be 0 and combining Eq. 2.2 and Eq. 2.4, Eq. 2.5 can be reached:
Derivation of the realization algorithm for fWp
Select a minimum calculation step length
where the argument
Substitute the discrete argument to the density function of the fWd:
The definition range of the stochastic time series is limited by the physical law and there is only a proportion of the definition range that can raise people’s research interests. Therefore, the maximum value of the argument
The maximum value of
Therefore, the finite valued and discretized density function of the fWd:
where
The parameter
Define another discrete random variable
The discrete random variable
The constitution of the stochastic process can be separated into three steps. The.
First step is to draw an integer value of
Therefore, we can define the fWp as follows:
where
Substitute the value of
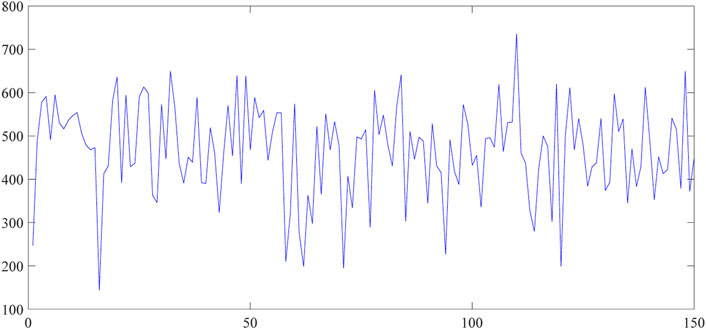
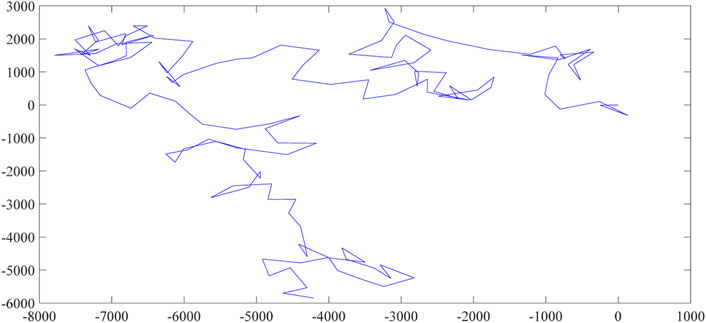
There are six different parameters in the fWp. Four of them are the same as the fWd and are estimated by the actual data. These four parameters can reflect the statistical characteristics of the data. The other two parameters are determined based on the physical background of the data. In this section, a trajectory of the fWp and the corresponding random walk are depicted separately in Figure 3 and Figure 4. The parameters are chosen randomly in this section and in Section 5 the whole procedure for the construction of the fWp as well as the corresponding random walk is provided.
3 Self-similarity property
3.1 Self-similarity criterion for a general stochastic process
Let
where
In [20], the following proposition expressed by Eq. 3.2 and Eq. 3.3 are proved. Equations 3.2 is the general form of the equivalent condition for equality in distribution with respect to two different random variables. If the random variable is Weibull distribution, then the specialized form is presented as Eq. 3.3.
Given two cumulative distribution functions
where
For the Weibull distribution, we can get the specialized definition for
By combining the self-similarity definition (3.1) with Eq. 3.2, we can get the criterion of the self-similarity for a general stochastic process:
where
Substituting (3.5) into (3.4) we get
which is a practical criterion for the self-similarity of a stochastic process
On the left side of Eq. 3.6, it is the discriminant function
3.2 The discriminant function for the fWp
In the following, we will derive the discriminant function for the fWp.
The following equations can be derived from the definitions:
where
From Eq. 3.2, we have:
Besides the additional coefficient
3.3 Self-similarity for the fWp
In this subsection we will show the self-similarity of the fWp.
Theorem 1. The fWp is self-similar
Proof Combining Eq. 3.3 and Eq. 3.6, we can reach Eq. 3.12:
By considering the self-similarity condition (3.6) and Eq. 3.11, we have to show that the following Eq. 3.14 and Eq. 3.15 are equal to prove the self-similarity of the fWp.
In fact (3.14) and (3.15) can be transformed into (3.16) and (3.17), respectively, as follows.
Therefore, the equality of (3.16) and 3.17 can be transformed into the equality of (3.18) and 3.19:
According to Eq. 3.13, the two functions (3.18) and (3.19) are equal if we select the same self-similar parameter with the Weibull distribution. Therefore, the self-similarity of the fWp is proven because there exists a self-similar parameter to make Eq. 3.1 to hold, which is within the interval of (0.5,1).
4 The second moments and LRD property
4.1 The second moments of the fWp exists
For simplicity we give here only one kind of second moment, since the derivation of other moments are similar. The second moment about zero of the fWp can be easily obtained by a direct computation as follows:
Therefore, we have proven that the second moments of the fWp exists.
4.2 The LRD of the fWp
The LRD means the slow decay of the auto-correlation function
where
Eq. 4.2 summarizes the physical meaning of the LRD. The slow decaying rate of the auto-correlation function does not specify the exact decaying rate. By changing the values of constants
Let
Based on the theorem in [22], we can show the incremental process
Theorem 2. The fWp is of LRDProof: According to the definition (4-4), we can express
From Eq. 4.6 and the law of infinitesimal substitution, there follows that the auto-correlation function of
Therefore, we have proven that the auto-correlation function of
5 Simulation on the fWp
5.1 Time series fitted with the fWd
In this paper, the power load data from the European Network on Intelligent.
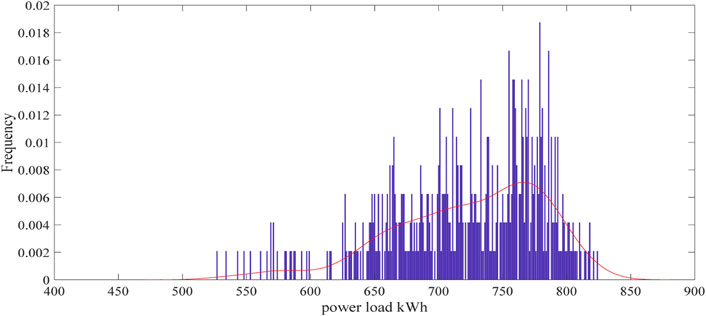
Technologies prediction contest is used in the validation of the proposed process. In Figure 5, the actual power load frequency distribution is plotted and the corresponding probability density function is provided numerically
The power load data cannot be negative values, therefore the Gaussian fit is not appropriate. Select fWd to fit the actual power load distribution and can achieve a better fitting result than the Weibull distribution because of the fractal parameter. The location parameter a is set to be zero for the power load are positive and the scale fractal parameter is determined later through experiment. The scale parameter and shape parameter are estimated by the maximum similarity estimation.
The maximum likelihood function of the fWd:
The logarithmic maximum likelihood function of the fWd:
Take the partial derivative of the logarithmic maximum likelihood function with respect to the scale parameter b and then make it equal to zero.
Separate the scale parameter b and the shape parameter c:
Take the partial derivative of the logarithmic maximum likelihood function with respect to the shape parameter c and then make it equal to zero.
After performing some algebraic calculation, the equivalent equation can be derived
Substituting Eq. 5.4 to Eq. 5.6:
Therefore, the estimation of the scale parameter b and the shape parameter c is reached. The scale parameter b is estimated to be 748.4289 and the shape parameter c is estimated to be 15.7742.
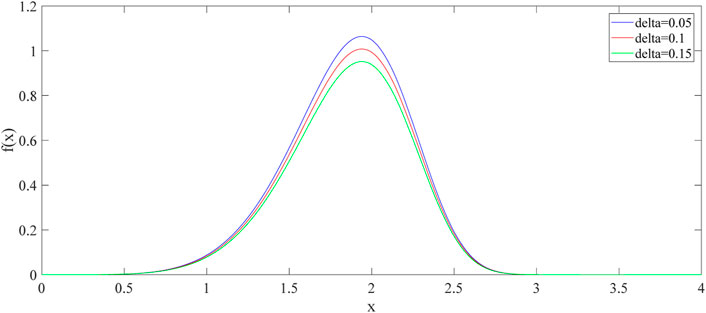
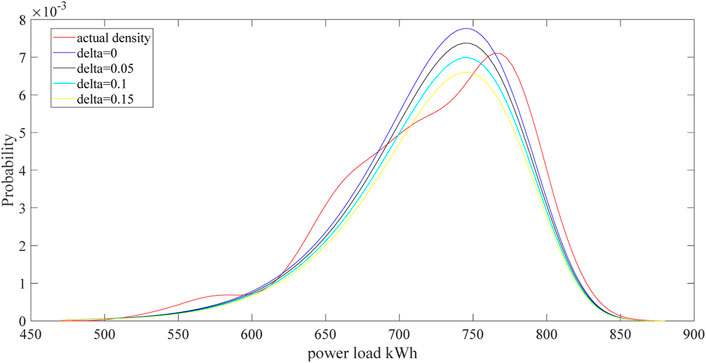
The fractal parameter needs to be evaluated chosen by the fitting results. The density function of the fWd with different fractal parameters are depicted in Figure 6 as well as the actual power load density function. The criterions of goodness of fitting (GoF) are the sum of squared error (SSE) and the root mean square error (RMSE) [23]. The formulas are listed below. For both criterions, the smaller value means better fitting results.
The calculations of the SSE and RMSE are listed in Table 1. The density function of fWd with zero fractal parameter is Weibull distribution. As we can see from Table 1, the delta value of 0.05 is chosen in the end because both the values of SSE and RMSE are the smallest.
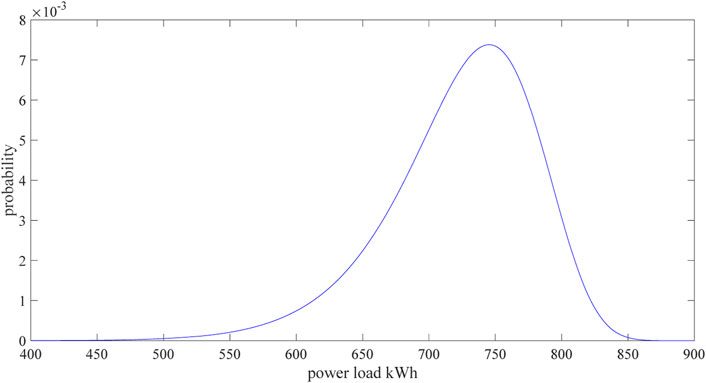
After the parameter estimation and the experiment, the power load is fitted with the fractional Weibull distribution in Figure 7.
5.2 The construction of the fWp
On the purpose of generating the fWp conveying the stochasticity of the stochastic time series, the other parameters in the fWp need to be calculated.
The step length
where
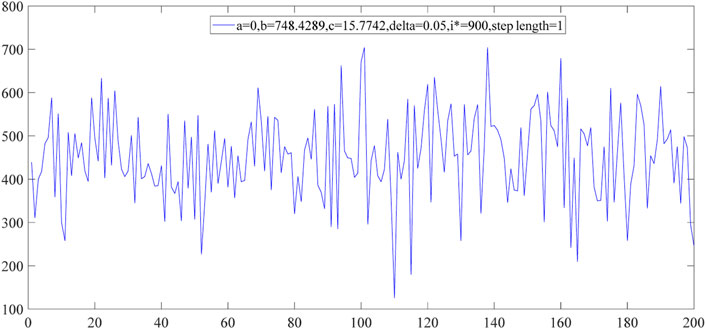
Therefore, the fWp with the stochasticity of the time series is depicted in Figure 8.
5.3 The simulated path for the random walk of the fWp
After the construction of the fWp, the corresponding random walk path can be simulated. As depicted in Figure 9, the particle in the random walk starts from the origin. At each of the iteration, the jump direction is random and the jump length follows the fWd with parameters estimated from the actual data. The simulation path of the random walk expands the dimension of the fWp to a planar space with the same stochasticity coming from the actual data.
6 The potential engineering applications of the fWp
Wind power generation is very unreliable because it relies solely on the wind speed. The historical wind speed data can be used to construct the fWp for representing its stochasticity and the statistical wind speed prediction model can be constructed. Once the wind speed variation tendency is predicted in advance, the wind power generation can be predicted with accuracy and the power system reliability can be improved [24].
The power load prediction is very important for the reliability of the power system. If there is surplus electricity according to the power load prediction results, the maintenance of the power facilities can be scheduled. If the power consumption is difficult to guarantee, the dispatching of electricity need to be carried out [25]. With the fWp conveying the stochasticity of the power load, the power load statistical prediction model can be established and the blackouts caused by the high temperature can be reduced.
7 Conclusion
The fWd can be considered to be the generalization of the Weibull distribution with a non-zero fractal parameter. In this paper, the definition of the fWp is provided and the algorithm of realization is derived. In order to facilitate the future research, the self-similarity and LRD are proven. The actual time series is employed for the simulation of the fWp. The random walk characteristics for the fWp is analyzed in the planar space. The future research can focus on the prediction model for the potential engineering application areas of the fWp.
Data availability statement
The original contributions presented in the study are included in the article/Supplementary Material, further inquiries can be directed to the corresponding author.
Author contributions
WD: initial draft, software; WS: concept, validation, revision; CC: revision, language editing; JC: validation, revision; XC: validation, revision.
Acknowledgments
We thank the help from Shanghai university of engineering and science and university in Tuscia. Without the help of them, this work cannot be finished. The diligent work from the reviewers and editor is really helpful for this work.
Conflict of interest
The authors declare that the research was conducted in the absence of any commercial or financial relationships that could be construed as a potential conflict of interest.
Publisher’s note
All claims expressed in this article are solely those of the authors and do not necessarily represent those of their affiliated organizations, or those of the publisher, the editors and the reviewers. Any product that may be evaluated in this article, or claim that may be made by its manufacturer, is not guaranteed or endorsed by the publisher.
Abbreviations
fWd, Fractional weibull distribution; fWp, fractional Weibull process; LRD, long range dependence; GoF, goodness of fitting; SSE, Sum of squared error; RMSE, Root mean square error.
References
1. Norros I. On the use of fractional Brownian motion in the theory of connectionless networks. IEEE J Sel Areas Commun (1995) 13:953–62. doi:10.1109/49.400651
2. Li M. Generalized fractional Gaussian noise and its application to traffic modeling. Physica A: Stat Mech its Appl (2021) 579:126138. doi:10.1016/j.physa.2021.126138
3. Shouwu D, Wanqing S, Enrico Z, Carlo C, Ming L. Product technical life prediction based on multi-modes and fractional Lévy stable motion. Mech Syst Signal Process (2021) 161:107974. doi:10.1016/j.ymssp.2021.107974
4. Hallinan J A review of the Weibull distribution. J Qual Tech (1993) 25:85–93. doi:10.1080/00224065.1993.11979431
5. Ibrahim E, Mohamed Z, Mahdi R, Ahamed AZ. A new extended Weibull model for lifetime data. J Appl Probab Stat (2019) 14:1.
6. Jaouher BA, Brigitte CM, Lotfi S, Simon M, Farhat F. Accurate bearing remaining useful life prediction based on Weibull distribution and artificial neural network. Mech Syst Signal Process (2015) 56-57:150–72. doi:10.1016/j.ymssp.2014.10.014
7. Ming D, Alexandre BN. Combining modified Weibull distribution models for power system reliability forecast. IEEE T Power Syst (2019) 34:2. doi:10.1109/TPWRS.2018.2877743
8. Kalaba DV, Radakovic ZJ, Dordevic ML, Kirin SD. Determining the theoretical reliability function of thermal power system using simple and complex Weibull Distribution. Therm Sci (2014) 18:229–38. doi:10.2298/TSCI120611168K
9. Yeliz MK, Ilnan U. Analysis of the upper-truncated Weibull distribution for wind. Speed Energ Convers Manage (2015) 81:88. doi:10.1016/j.enconman.2015.02.063
10. Athraa AK, Noor IAW, Lshak A, Jasronita J, Ahmed NA. Advanced wind speed prediction model based on a combination of Weibull distribution and an artificial neural network. Energies (2017) 10:11. doi:10.3390/en10111744
11. Zuwei Y, Akiner T. Fractional Weibull wind speed modeling for wind power production estimation, In proceedings of the International Conference on Sustainable Power Generation and Supply. Nanjing, China (2009), 952–7. doi:10.1109/PES.2009.5275785
12. Muhammad UA, Intisar AS, Luigi M. Weibull distribution model for the characterization of aggregate load patterns. In: proceedings of the IEEE international Conference on Environment and Electrical Engineering. Palermo, Italy (2018). p. 1–5. doi:10.1109/EEEIC.2018.8494371
13. Feng X, Jiaying L, Hansong N, Yonghao F, Liangtian W, Xiangjie K. Random walks: A review of algorithms and applications. IEEE Trans Emerg Top Comput Intell (2020) 95:95. doi:10.1109/TETCI.2019.2952908
14. Wilfrid SK. Rayleigh random flights on the Poisson line SIRSN. Electron J Probab (2020) 1:36. doi:10.1214/20-EJP526
15. Mridul C, Manoj D. Levy flights in metaheuristics optimization algorithms - a review. Appl Artif Intell (2018) 9-10:802–21. doi:10.1080/08839514.2018.150.8807
16. Yuantao C, Jin W, Xi C, Mingwei Z, Kai Y, Zhi W, et al. Single-image super- resolution algorithm based on structural self-similarity and deformation block features. IEEE ACESS (2019) 58791:58801. doi:10.1109/ACCESS.2019.291.1.892
17. Popoola J, Ipinyomi RA. Empirical performance of Weibull self-similar tele-traffic model. Int J Eng Appl Sci (2017) 8:4.
18. Anatolii L, Yevgenii L. Investigation of simulating methods for self-similar traffic flows the qos-characteristics depend on the type of distribution in self-similar traffic. In: proceedings of the 4th International Scientific-Practical Conference Problems of Infocommunications-Science and Technology(PIC S&T). Ukraine: Khark (2017). p. 410–3. doi:10.1109/INFOCOMMST.2017.8246428
19. Mobaraki H, Hassani A, Kashkalani T, Khalilnejad R, Chimeh EE. Equality in distribution of human resources: The case of Iran's ministry of health and medical education. Iran J Public Health (2013) 161:165.
20. Dan K, Eric M, Robert DS. On the equality in distribution of the random variables X and g(X). Int J Pure Appl Math (2005).
21. Shaifu G, Dileep AD. Long range dependence in cloud servers: A statistical analysis based on google work load trace. Computing (2020) 102:6. doi:10.1007/s00607-019-00779-4
22. Michele P. Self-similarity and long range dependence in teletraffic. In: Proceedings of the 15th international Asian School-Seminar Optimization Problems of Complex Systems (OPCS). Novosibirsk, Russia (2019). p. 125–30. doi:10.1109/OPCS.2019.8880260
23. Haobo Z, Wufeng H, Junhui Z, Jiefeng L, YiYi Z, Shi Z, et al. A normal falling model for wind speed probability distribution of wind farms. Renew Energ 91–9. doi:10.1016/j.renene.2021.11.073
24. He L, Wanqing S, Enrico Z. Generalized Cauchy difference iterative forecasting model for wind speed based on fractal time series. Nonlinear Dynam (2021) 759–73. doi:10.1007/s11071-020-06150-z
Keywords: self-similarity, long range dependence, fractional Weibull distribution, fractional Weibull process, random walk
Citation: Deng W, Song W, Cattani C, Chen J and Chen X (2022) On the fractional weibull process. Front. Phys. 10:790791. doi: 10.3389/fphy.2022.790791
Received: 07 October 2021; Accepted: 18 August 2022;
Published: 10 October 2022.
Edited by:
Víctor M. Eguíluz, Institute of Interdisciplinary Physics and Complex Systems, (CSIC), SpainReviewed by:
Sergio Da Silva, Federal University of Santa Catarina, BrazilHaci Mehmet Baskonus, Harran University, Turkey
Luis Manuel Sánchez Ruiz, Universitat Politècnica de València, Spain
Copyright © 2022 Deng, Song, Cattani, Chen and Chen. This is an open-access article distributed under the terms of the Creative Commons Attribution License (CC BY). The use, distribution or reproduction in other forums is permitted, provided the original author(s) and the copyright owner(s) are credited and that the original publication in this journal is cited, in accordance with accepted academic practice. No use, distribution or reproduction is permitted which does not comply with these terms.
*Correspondence: Carlo Cattani, Y2F0dGFuaUB1bml0dXMuaXQ=
 Wujin Deng
 Wanqing Song
 Carlo Cattani
 Jianxue Chen1