- 1State Key Laboratory of Precision Measuring Technology and Instruments, Tianjin University, Tianjin, China
- 2Tianjin Key Laboratory of Optoelectronic Detection Technology and System, School of Electronics and Information Engineering, Tiangong University, Tianjin, China
This study proposes a novel method to compress and decompress the 3D models for safe transmission and storage. The 3D models are first extracted to become 3D point clouds, which would be classified by the K-means algorithm. Then, these nearby 3D point clouds are converted into a computer-generated hologram (CGH) by calculating the point distribution on the hologram plane using the optical wavefront propagation method. The computer-generated hologram (CGH) contains the spatial coordinate information on point clouds, which can be decompressed using the convolutional neural network (CNN) method. The decompression accuracy of 3D point clouds is quantitatively assessed by normalized correlation coefficients (NCCs), reflecting the correlation between two points and influenced by the hologram resolution, the convolution kernel, and the diffraction distance. Numerical simulations have shown that the novel method can reconstruct a high-quality 3D point cloud with an accuracy of 0.1 mm.
1 Introduction
With the rapid development of 3D data acquisition equipment and technology, the location information on 3D objects and scenes can be collected and transmitted in real time [1–4]. Since discrete point clouds in 3D space contain depth information and can accurately reproduce real-world scenes, they can be used to record and reconstruct 3D scenes [5–7]. Those 3D point clouds can be used in visual displays such as city modeling [8,9] and mobile applications of interaction [10,11]. In particular, the point clouds consisting of a large number of 3D points can accurately represent 3D environments and enable more immersive visual experiences. It will give rise to many new multimedia applications, such as virtual reality and augmented reality [12].
However, the accurate reconstruction of point clouds is positively related to the total amount of data in the point clouds, so the reconstructed point cloud data that can meet the visual needs require huge storage space and transmission bandwidth [13]. It is important to develop a 3D point cloud compression (3PCC) algorithm with high secrecy, low complexity, and high decompression accuracy for real-time applications. In the last decade, many attempts have been made to improve the compression efficiency. Jae Kyun et al. [7] proposed an adaptive technique of range image coding for compressing large-scale 3D point clouds, which adaptively predicts the radial distance of each pixel using its previously encoded neighbors. Queiroz et al. [14] investigated a technique to compress point cloud colors based on hierarchical transformations and arithmetic coding. Vicente Morell et al. [15] proposed a 3D lossy compression system based on plane extraction. These proposed methods mainly reduce the number of point clouds or improve the presentation of point clouds. With the current hardware conditions, it is difficult to store and transmit a large amount of point cloud data.
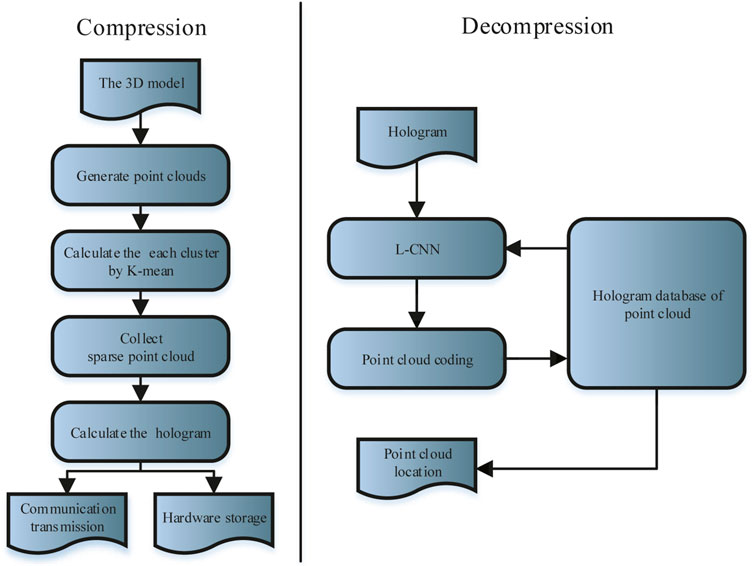
In this article, we propose a highly encrypted 3D point cloud compression and dimensionality reduction algorithm for 3D point cloud transmission and storage. Figure 1 shows an overview of the compression and decompression algorithm.
2 Methods
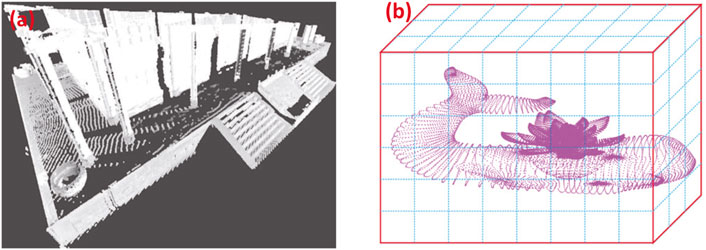
In a 3D coordinate system, the outer surface of a 3D object can be represented by point clouds, which are a series of data points defined by X, Y, and Z coordinates. The point cloud acquisition is from 3D scanners or directly from 3D applications. Figure 2 shows the two point clouds using each of the aforementioned two methods. Figure 2A is generated by using a 3D scanner (FARO Focus3D X130), and Figure 2B is created by a 3D application.
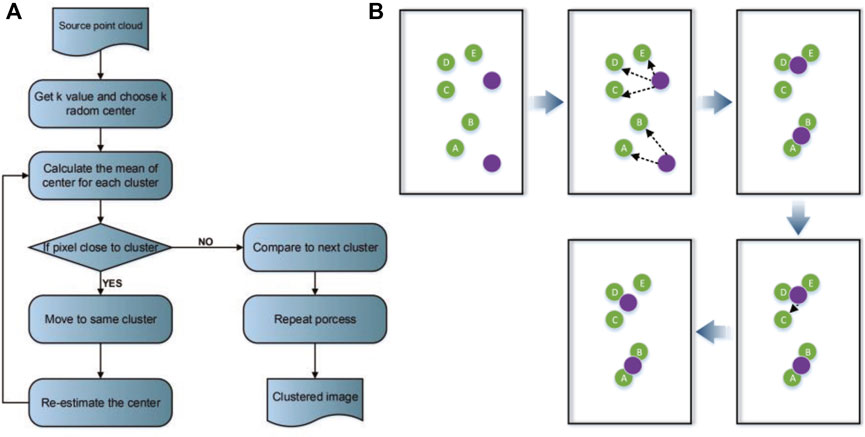
This study mainly focuses on the compression and encryption of point cloud positions and does not consider the color values of the point clouds. We first segmented the point cloud using an unsupervised clustering segmentation method (the K-means algorithm). It can divide the point cloud into k clusters to ensure that each point is located in a cluster. The clustering of point clouds is the grouping of points by specific features. We initially needed to determine the number of clusters (k) and the centers of k clusters randomly. The simple Euclidean function, Minkowski function, and Cityblock function were applied to calculate the distance between each point and the cluster center. The point would be moved to the particular cluster to keep the shortest distance from the cluster center [16]. Figure 3 shows the flow chart and diagram of the K-means algorithm.
To achieve point cloud data encryption and compression, we calculated the point distribution on the hologram plane by the propagation of the optical wavefront method, which needs to be carried out in two steps: 1) the points in the point cloud can be assumed to be point sources, as shown in Figure 4, whose distribution in the plane in front of the Fourier lens needs to be calculated. 2) The Fourier lens phase data, which are optical transmissions between two parallel planes, also need to be added to the distribution of the final hologram plane [17–19]. The phase distribution is crucial in the reconstruction process of the 3D point cloud since the phase data contain the direction information.
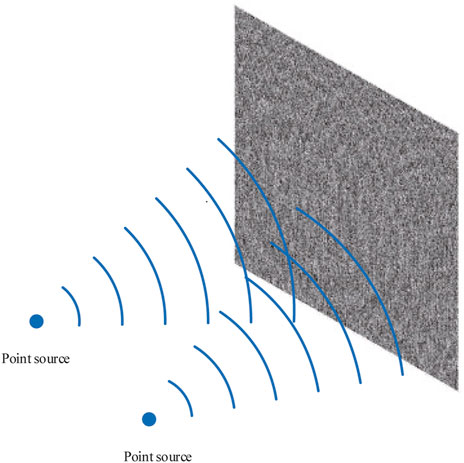
FIGURE 4. Schematic diagram of point cloud hologram generation. The hologram includes depth information.
In the propagation of the optical wavefront method, the phase distribution on the final hologram plane precisely records the real-world object. It can calculate and simulate the optical transmission process from the point source to the hologram plane [20,21]. The complex amplitude H(x, y) on the midplane of the point clouds can be calculated and simulated by the optical wavefront.
where k is the sparse point number of a point cloud after segmentation, Aj is the wave amplitude, and in our work, Aj = 1, and
The convolutional neural network (CNN) can be used to deal with the input fluctuations and obtain the invariance characteristics. It is commonly used in image data and is a variation of the MLP that evolved from the idea of biology. There is a complex distribution of cells in the visual cortex that are sensitive to external inputs, called the “receptive field.” These cells are locally sensitive to the input image and are able to mine images for targets, functioning like a filter. Each filter is superimposed over the entire receptive field. The CNN can identify the local information on objects by enhancing the local connectivity patterns (LCPs) of nodes between adjacent layers.
Although the CNN has dominated many tasks in computer vision [22–25] and object detection [26–28], the application of the CNN in point cloud processing is still lacking. Most of the approaches are still based on the TIN framework, which leads to limited accuracy and processing speed.
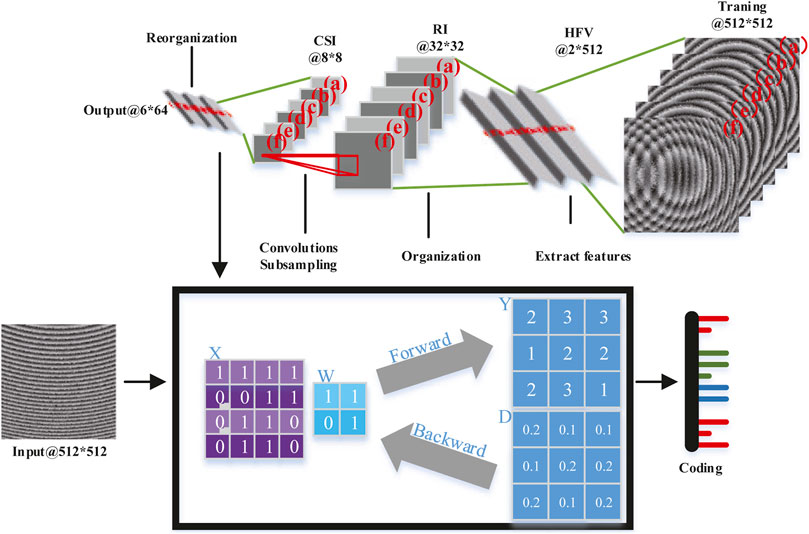
In this work, we apply the CNN algorithm to recognize the hologram and reconstruct the point clouds. In our approach, we need the weight of each feature as a code to find the position of the point cloud. The data must first be preprocessed using the following techniques: data regularization and data degradation. It can increase the recognition rate because the non-zero mean of the training sample does not match the non-zero mean of the testing sample. Also, different image features can be obtained by using different convolution kernels. These convolution kernels are similar to different types of filters and are the core of the CNN. A pooling layer follows the convolutional layer to reduce the dimension. In general, the size of the original convolution output matrix is transformed to half of its original size. The pooling layer would increase the robustness of the system and turn the original detailed description into a coarse description (originally, the matrix size was 28 × 28, and now, it is 14 × 14, but the boundary would lose partial information). Two pooling operations (max pooling and mean pooling) would improve the variance of the extracted features. However, the error in feature extraction would come from two ways: 1) the estimate variance increasing caused by the limited size of the neighborhood. 2) estimated mean shifting caused by the convolutional parameter error. Specifically, mean pooling can reduce the first error and preserve the background information about the image. Max pooling can reduce the second error (the derivative does not affect the other points) and preserve texture information.
As shown in Figure 5, the histogram feature vector (HFV) needs to be extracted before rebuilding the point cloud from the hologram. The HFV consists of vertical projection and horizontal projection of the hologram. Then, convolutions and subsampling are performed to get a feature map of 8 × 8 pixels. The feature map is used to reconstruct the feature vector. Also, the computer-generated holograms can be extracted from the feature vectors and numbered to form a look-up table. When a point cloud hologram is decompressed, the CNN method identifies the encoding of holograms. With the encoding, we can find the unsampled hologram in the look-up table and calculate its spatial value.
3 Results
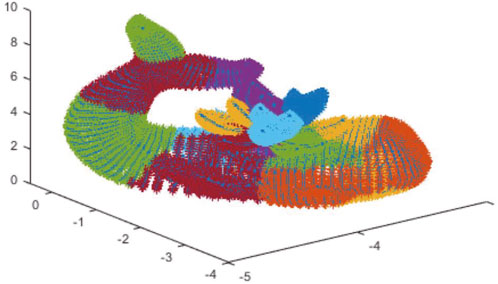
Figure 2B is the point cloud given as input to the preprocessing and K-means algorithms. The algorithm calculates the clustering of the point cloud using the Cityblock function. Figure 6 is the output for spatial segmentation by the K-means algorithm with k = 20.
For the given point cloud, the cluster means mk is calculated as follows:
The distance D(k) between the cluster and each point is calculated as follows:
Iteratively compute the preceding two steps until the mean value convergence is attained.
Four original models are chosen as the compression objects, as shown in Figures 7A1–A4. The simulation of the models is as follows: 1) the models first generate four groups of point clouds by the sampling process, respectively, as shown in Figures 7B1–B4. 2) The K-means method is applied to simplify the data while preserving the data information since the point cloud of the 3D model has a huge amount of data. For example, the point cloud of the first model (a1) has 10,684 points, the second model (a2) has 1,177 points, the third model (a3) has 35,871 points, and the last model (a4) has 40,248 points. As shown in Figures 7C1–C4, the set of points could (b1–b4) be divided into k groups by the principle of the nearest distance. The k value of (c1), (c2), (c3), and (c4) is 174, 84, 171, and 130, respectively. 3) The k point is transformed into a hologram, calculating the point distribution on the hologram plane. The holograms in Figures 8A1–A4 are generated with the following parameters: the diffraction distance is z = 240 mm, the hologram has 512 × 512 pixels, and the wavelength of the laser used in our experiment is 632.8 nm. 4) Using the CNN algorithm to decompress the hologram, get the point cloud code, and look up the table to know the point cloud distribution.
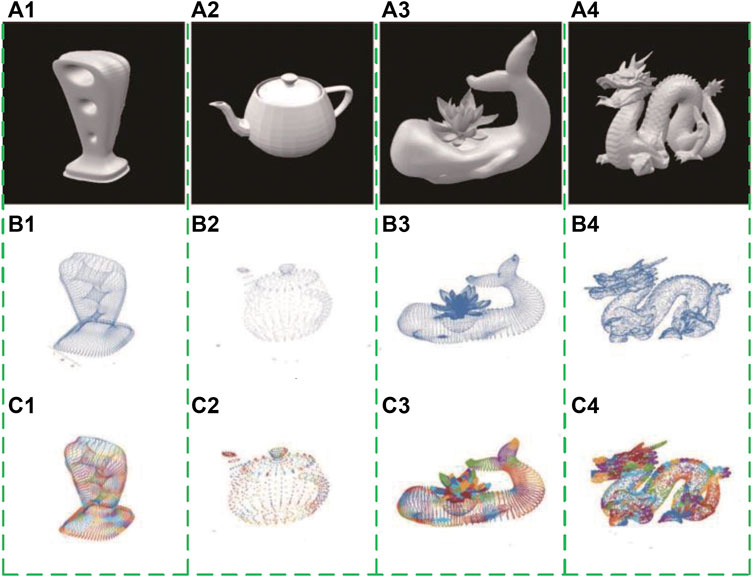
FIGURE 7. 3D models and point clouds. (A1–A4) 3D models. (b1–b4) Point clouds generated from the models by the sampling process. (C1–C4) Point clouds are divided into k groups.
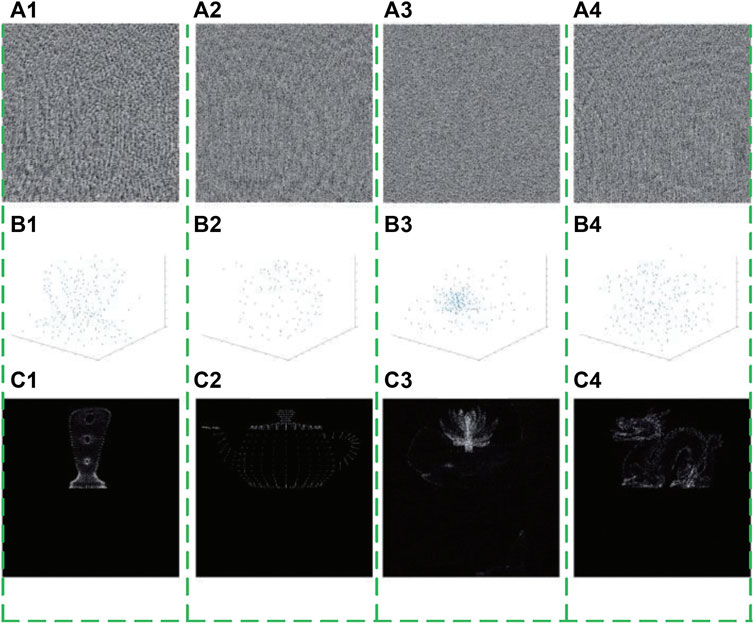
FIGURE 8. Holograms and decompression of the point cloud. (A1–A4) Holograms generated from the four models. (B1–B4) Point clouds decompressed from holograms. (C1–C4) Simulation results for comparison.
The models and point clouds are shown in Figure 7. The point clouds are divided by the K-means method and kc1 = 174, kc2 = 84, kc3 = 171, and kc4 = 130. The k cluster centers are used as point sources of holograms (see Figures 7C1–C4). The hologram contains the location information on point clouds. The compression and decompression results of the models are shown in Figure 8. The holograms are generated from the point sources and by the propagation of the optical wavefront method, as shown in Figures 8A1–A4. Figures 8B1–B4 shows the decompression points by the CNN method, respectively. Simulation results (Figures 8C1–C4) show that the decompression point clouds have high decompression accuracy and low crosstalk with the number of point clouds increasing.
4 Discussion
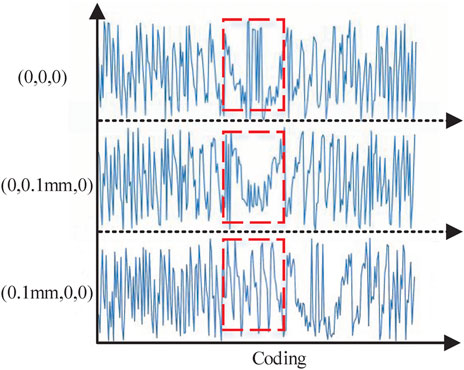
The discrete point cloud is compressed using virtual light with a wavelength of 632.8 nm. The compression layer resolution is 256 × 256 pixels, and the compression distance is 24 cm. When compressing a single discrete point cloud in different positions (0, 0, 0), (0, 0.1, 0), and (0.1, 0, 0) and analyzing the compressed data, we can find that the encoding is completely different, although the difference is only 0.1 mm (Figure 9). Therefore, the hologram has enough coding expression space to store the point cloud data, and the three-dimensional space information is converted into two-dimensional information. Fresnel diffraction is performed on the discrete point to transform voxels into pixels, which ensures that the original data and information are preserved in the case of dimensionality reduction.
In the proposed method, the hologram converted from the point clouds can record the space position through diffraction. When decompressing the hologram, the accuracy of point clouds is affected by the hologram resolution, the convolution kernel, and the diffraction distance. The accuracy of decompression point clouds can be quantitatively assessed by normalized correlation coefficients (NCCs). It reflects the correlation between two points and can be expressed as Eq. 5, where R0(i, j) expresses the feature vector of the point (0, 0, 0), R1(i, j) indicates the feature vector of the point (0.1, 0, 0), and (I, j) denotes an element in the feature vector. h and l represent the row and column numbers of the feature vector, respectively.
The NCCs of the hologram feature vector under different parameters are shown in Table 1. There are correlations in the holograms with 512 × 512 pixels, 256 × 256 pixels, and 128 × 128 pixels; the diffraction distance with 20 cm, 24 cm, and 28 cm; and the convolution kernel with 3 × 3 pixels, 6 × 6 pixels, and 9 × 9 pixels. The different correlation coefficients are in the range of 0.0272–0.5944, which show that different parameters have different correlation coefficients. The smaller correlation coefficient indicates that the spatial point cloud accuracy is higher. In particular, the hologram (512 × 512 pixels and z = 24 cm) and the convolution kernel (3 × 3) can extract point clouds with a spatial resolution of 0.1 mm.
5 Conclusion
In this study, a 3D point cloud compression and decompression method based on holograms and the CNN is proposed. The sparse 3D point clouds generated from the 3D model are transformed into a hologram, and the position of the point cloud can be extracted by the CNN method in the decompression process. The hologram can reduce the dimension of spatial data and realize the three-dimensional data recording. The accuracy of the decompression point clouds would be affected by the hologram resolution, the convolution kernel, and the diffraction distance. Under the conditions of the hologram with 512 × 512 pixels and z = 24 cm, the point cloud can be reconstructed with an accuracy of 0.1 mm. Simulation results and quantitative analysis based on the hologram and CNN method show that the proposed method can meet the demand for three-dimensional model transmission and storage.
Data availability statement
The original contributions presented in the study are included in the article/Supplementary Material; further inquiries can be directed to the corresponding author.
Author contributions
Conceptualization, YS and MZ; methodology, PN and CL; software, SZ; formal analysis, SB; investigation, JG. All authors have read and agreed to the published version of the manuscript.
Funding
This research was funded by the National Key Research and Development Program of China (No. 2020YFC2008703).
Conflict of interest
The authors declare that the research was conducted in the absence of any commercial or financial relationships that could be construed as a potential conflict of interest.
Publisher’s note
All claims expressed in this article are solely those of the authors and do not necessarily represent those of their affiliated organizations, or those of the publisher, the editors, and the reviewers. Any product that may be evaluated in this article, or claim that may be made by its manufacturer, is not guaranteed or endorsed by the publisher.
References
1. Alexiadis DS, Zarpalas D, Daras P. Real-time, full 3-d reconstruction of moving foreground objects from multiple consumer depth cameras. IEEE Trans Multimedia (2013) 15:339–58. doi:10.1109/TMM.2012.2229264
2. Zhang C, Cai Q, Chou PA, Zhang Z, Martin-Brualla R. Viewport: A distributed, immersive teleconferencing system with infrared dot pattern. IEEE MultiMedia (2013) 20:17–27. doi:10.1109/MMUL.2013.12
3. Masuda H, He J. Tin generation and point-cloud compression for vehicle-based mobile mapping systems. Adv Eng Inform (2015) 29:841–50. doi:10.1016/j.aei.2015.05.007
4. Li F, Zhao H. 3d real scene data collection of cultural relics and historical sites based on digital image processing. Comput Intelligence Neurosci (2022) 2022:1–12. doi:10.1155/2022/9471720
5. Mitchell DJ, Tiddy GJT, Waring L, Bostock T, McDonald MP. Phase behaviour of polyoxyethylene surfactants with water. mesophase structures and partial miscibility (cloud points). J Chem Soc Faraday Trans 1 (1983) 79:975–1000. doi:10.1039/F19837900975
6. Rusu RB, Cousins S. 3d is here: Point cloud library (pcl). In: IEEE International Conference on Robotics and Automation, ICRA 2011; 9-13 May 2011; Shanghai, China (2011). p. 1–4. doi:10.1109/ICRA.2011.5980567
7. Ahn J-K, Lee K-Y, Sim J-Y, Kim C-S. Large-scale 3d point cloud compression using adaptive radial distance prediction in hybrid coordinate domains. IEEE J Sel Top Signal Process (2015) 9:422–34. doi:10.1109/JSTSP.2014.2370752
8. Pylvänäinen T, Berclaz J, Korah T, Hedau V, Aanjaneya M, Grzeszczuk R. 3d city modeling from street-level data for augmented reality applications. In: 3D Imaging, Modeling, Processing, Visualization and Transmission (3DIMPVT), 2012 Second International Conference, October 13-15, 2012, Zurich, Switzerland (2012). p. 238–45. doi:10.1109/3DIMPVT.2012.19
9. Wu Y, Zhou Z. Intelligent city 3d modeling model based on multisource data point cloud algorithm. J Funct Spaces (2022) 2022:1–10. doi:10.1155/2022/6135829
10. Korah T, Tsai Y-T. Urban canvas: Unfreezing street-view imagery with semantically compressed lidar pointclouds. In: 10th IEEE International Symposium on Mixed and Augmented Reality, ISMAR 2011; October 26-29, 2011; Basel, Switzerland (2011). p. 271–2. doi:10.1109/ISMAR.2011.6143897
11. Xu Y, Tong X, Stilla U. Voxel-based representation of 3d point clouds: Methods, applications, and its potential use in the construction industry. Automation in Construction (2021) 126:103675. doi:10.1016/j.autcon.2021.103675
12. Waschbüsch M, Würmlin S, Cotting D, Gross M. Point-sampled 3d video of real-world scenes. Signal Processing: Image Commun (2007) 22:203–16. Special issue on three-dimensional video and television. doi:10.1016/j.image.2006.11.009
13. Zhang Y, Kwong S, Jiang G, Wang H. Efficient multi-reference frame selection algorithm for hierarchical b pictures in multiview video coding. IEEE Trans Broadcast (2011) 57:15–23. doi:10.1109/TBC.2010.2082670
14. de Queiroz RL, Chou PA. Compression of 3d point clouds using a region-adaptive hierarchical transform. IEEE Trans Image Process (2016) 25:3947–56. doi:10.1109/TIP.2016.2575005
15. Morell V, Orts S, Cazorla M, Garcia-Rodriguez J. Geometric 3d point cloud compression. Pattern Recognition Lett (2014) 50:55–62. doi:10.1016/j.patrec.2014.05.016
16. Selvakumar J, Lakshmi A, Arivoli T. Brain tumor segmentation and its area calculation in brain mr images using k-mean clustering and fuzzy c-mean algorithm. In: IEEE-International Conference On Advances In Engineering, Science And Management (ICAESM -2012); 30-31 March 2012; Nagapattinam, India (2012). p. 186–90.
17. Zhang H, Zhao Y, Gu H, Tan Q, Cao L, Jin G. Fourier holographic display system of three-dimensional images using phase-only spatial light modulator. Proc SPIE (2012) 8556:03. doi:10.1117/12.999268
18. Zhang H, Zhao Y, Wang Z, Cao L, Jin G. Calculation for high-resolution computer-generated hologram with fully-computed holographic stereogram. In: Proceedings of SPIE - The International Society for Optical Engineering 9271, August 17-21, 2014, San Diego, California (2014). p. 92711T. doi:10.1117/12.2071617
19. Jiang Q, Jin G, Cao L. When metasurface meets hologram: Principle and advances. Adv Opt Photon (2019) 11:518–76. doi:10.1364/AOP.11.000518
20. Zhang H, Zhao Y, Cao L, Jin G. Fully computed holographic stereogram based algorithm for computer-generated holograms with accurate depth cues. Opt Express (2015) 23:3901. doi:10.1364/OE.23.003901
21. Schnars U. Direct phase determination in hologram interferometry with use of digitally recorded holograms. J Opt Soc Am A (1994) 11:2011–5. doi:10.1364/JOSAA.11.002011
22. Chua L, Roska T. The cnn paradigm. IEEE Trans Circuits Syst (1993) 40:147–56. doi:10.1109/81.222795
23. Roska T, Chua L. The cnn universal machine: An analogic array computer. IEEE Trans Circuits Syst (1993) 40:163–73. doi:10.1109/82.222815
24. Xie G-S, Zhang X-Y, Yan S, Liu C-L. Hybrid cnn and dictionary-based models for scene recognition and domain adaptation. IEEE Trans Circuits Syst Video Technol (2017) 27:1263–74. doi:10.1109/TCSVT.2015.2511543
25. Yu C, Han R, Song M, Liu C, Chang C-I. A simplified 2d-3d cnn architecture for hyperspectral image classification based on spatial–spectral fusion. IEEE J Sel Top Appl Earth Obs Remote Sens (2020) 13:2485–501. doi:10.1109/JSTARS.2020.2983224
26. Chua LO. Cnn: A vision of complexity. Int J Bifurcation Chaos (1997) 07:2219–425. doi:10.1142/S0218127497001618
27. Razavian A, Azizpour H, Sullivan J, Carlsson S. Cnn features off-the-shelf: An astounding baseline for recognition. In: 2014 IEEE conference on computer vision and pattern recognition workshops, June 24-27, 2014, Columbus, Ohio (2014). p. 1403. doi:10.1109/CVPRW.2014.131
Keywords: 3D point clouds, compression and decompression, CNN, 3D models, hologram
Citation: Sun Y, Zhao M, Niu P, Zheng Y, Liu C, Zhang S, Bai S and Guo J (2022) A digital hologram-based encryption and compression method for 3D models. Front. Phys. 10:1063709. doi: 10.3389/fphy.2022.1063709
Received: 07 October 2022; Accepted: 24 October 2022;
Published: 16 November 2022.
Edited by:
Hongda Chen, Institute of Semiconductors (CAS), ChinaReviewed by:
Qun Ma, Jinhang Technical Physics Research Institute, ChinaWeiming Yang, Tianjin University of Science and Technology, China
Ying Tong, Tianjin Normal University, China
Copyright © 2022 Sun, Zhao, Niu, Zheng, Liu, Zhang, Bai and Guo. This is an open-access article distributed under the terms of the Creative Commons Attribution License (CC BY). The use, distribution or reproduction in other forums is permitted, provided the original author(s) and the copyright owner(s) are credited and that the original publication in this journal is cited, in accordance with accepted academic practice. No use, distribution or reproduction is permitted which does not comply with these terms.
*Correspondence: Meirong Zhao, bWVpcm9uZ3poYW9fYWNhZEAxNjMuY29t
 Yukai Sun1
 Meirong Zhao
 Pingjuan Niu