 Jiu-Cheng Xie1
 Hao Gao
95% of researchers rate our articles as excellent or good
Learn more about the work of our research integrity team to safeguard the quality of each article we publish.
Find out more
ORIGINAL RESEARCH article
Front. Phys. , 03 November 2022
Sec. Medical Physics and Imaging
Volume 10 - 2022 | https://doi.org/10.3389/fphy.2022.1048833
This article is part of the Research Topic Artificial Intelligence for Medical Informatics View all 8 articles
As the voice disorder is a typical early symptom of Parkinson, some researchers attempt to diagnose this disease based on voice data collected from suspected patients. Although existing methods can provide acceptable results, they just work in partial scenarios. In other words, they are not generable and robust enough. To this end, we present a Parkinson’s auxiliary diagnosis system based on human speech, which can adaptively build a suitable deep neural network based on sound features. The system includes two modules: hybrid features extraction and adaptive network construction. We extract kinds of information from the voice data to form a new compound feature. Furthermore, particle swarm optimization (PSO) algorithm is employed to build the corresponding 1D convolution network for features classification. Extensive experiments on two datasets consisting of English and Italian are conducted for evaluation purposes. Experimental results show that our method improves the accuracy of voice-based Parkinson’s disease detection to some extent.
Parkinson’s disease (PD) is a neurological illness caused by the loss of dopamine-producing cells in the brain, which injures brain function. With the aggravation of the patient’s condition, there will be problems in the coordination between different parts of the brain and body, and various symptoms begin to appear, including motor symptoms [1] (tremor [2], bradykinesia [3], sound disturbance, balance [4], etc.) and non-motor symptoms (sense of smell, facial expressions, etc.) [5]. Some researchers proposed the Unified Parkinson’s Disease Rating Scale (UPDRS) [6] for the symptoms of Parkinson’s disease, each of which is divided into a scale of 0–4 (0 for normal and four for severe). However, according to the Unified Parkinson’s Disease Rating Scale (UPDRS), the results depend on the subjective diagnosis, which means different evaluators may give diverse judgements.
On the other hand, it is found that Nearly 90% of people with Parkinson’s disease show symptoms of voice disorders at an early stage [7]. Moreover, there are great differences and changes in voice signals between patients with Parkinson’s disease and normal people. In recent years, many researchers explore the detection of Parkinson’s disease based on voice signals. At present, the research on voice disorders of Parkinson’s disease in the field of information processing mainly focuses on three aspects: information collection [8–14], feature selection [7, 15–19], and classification diagnosis [20–25]. For example, in terms of information collection, the first Parkinson’s disease speech disorder dataset OPDD (Oxford Parkinson’s Disease Dataset) [8] was established in 2007. Orozcoarroyave found the limitations of English pronunciation detection and proposed collection methods for Spanish, German and Czech [12]. On the aspect of feature analysis and feature extraction, SanDeep et. al use Fourier transform and correlation methods to extract relevant features from voice signals to classify engine faults according to sound [15]. R. Das et al. propose the rough set method for feature selection [16] and Frid employs the self-learning characteristics of a convolution network for feature selection [17]. Regarding classification of extracted speech features, Meghraoui et al. [20] introduced Bernoulli and polynomial naive Bayesian to select the most relevant feature parameters to diagnose Parkinson’s. Guruler et al. [21] used K-means clustering features and artificial neural networks to classify Parkinson’s disease and proposed a hybrid system called KMCFW-CVANN. Zayrit Soumaya et al. [25] introduce a discrete wavelet transform method to extract features from voice signals and use Genetic Algorithm to optimize SVM to classify Parkinson’s.
Recently, deep learning techniques have gained tremendous success in the field of computer vision and natural language processing. To some extent, deep neural networks can be regarded as powerful feature extractors or classifiers according to different structures and objectives employed. Since diagnosis of Parkinson’s disease based on voice signals can be treated as a multi-class classification problem, neural networks are naturally applicable to this task. Some work has made relevant attempts [26–28] which have profound meaning in multiple aspects. Firstly, using the dedicated medical equipment for diagnosis requires a certain amount of expenditure. Secondly, it involves physical interference, which tends to be a burden since most patients with Parkinson’s disease are old people. Thirdly, under the pandemic of COVID-19 nowadays, going to the hospital is inconvenient. If the algorithm capable of accurately detecting the appearance of Parkinson’s disease based on voice signals is available, then we can deploy it on small-scale electronic products like mobile phone, realizing initial diagnosis with low cost and high convenience.
An important problem of employing deep neural networks is to determine specific network structures [29, 30]. Some researchers consider using evolutional algorithms (EAs) in neural architecture search (NAS). Motivations behind this consideration can be summarized into two points: 1) manually constructing the network candidates is inefficient because of the large searching space; 2) EAs are usually good at finding the global optimum with relatively few iterations. Several valuable attempts [31–33] have been made in this direction. For instance, Xue et al. [31] modify the genetic algorithm to include novel ad-hoc crossover and mutation operators. they are used deal with a multi-objective modeling of the network design. Zhang et al. [32] employ the particle swarm optimization (PSO) to help the construction and stable training of a generative adversarial network. Experiments on CelebA dataset validate the effectiveness and robustness of their method.
Inspired by the findings and related work mentioned above, here we propose a new method for computer-aided diagnosis of Parkinson’s disease based on voice signals. We extract various types of features from the human speech data and combine them into a hybrid one. The particles and updating rules of PSO have been transferred to the scene of network structure search, which eventually finds the optimal 1D convolutional neural work that is able to produce the best performance among all network candidates. The main contributions of this work are following:
1. The introduction of a new approach for PD detection using voice recordings. Extensive experiments on two datasets verify its effectiveness and robustness.
2. Experimental evidence show that hybrid features embedding diverse kinds of information is superior to those with single contents in PD diagnosis.
3. A paradigm of how to leverage PSO to search for 1D neural architecture structures.
The rest of this article is organized as follows. Section 2 introduces the various datasets and methods used in this study. Section 3 presents the results and discussion. Finally, section 4 gives the conclusion and future scope.
Italian Parkinson’s Voice and Speech Database consists of audio recordings, which are yielded by 15 healthy people between the ages of 19–29 years, 22 healthy people between the ages of 60–77 years, and 28 PD patients within the ages of 40–80 years. All participants are from Italy. They are asked to produce vocals in different modes and execution times, as described in the following list:
a) Two readings of a phonemically balanced text spaced by a pause (30 s);
b) Execution of the syllable ‘pa’ (5 s), pause (20 s), execution of the syllable ‘ta’ (5 s);
c) Two phonations of the vowel ‘a’;
d) Two phonations of the vowel ‘e’;
e) Two phonations of the vowel ‘i’;
f) Two phonations of the vowel ‘o’;
g) Two phonations of the vowel ‘u’;
h) Reading of some phonemically balanced words, pause (1 min), and reading of some phonemically balanced phrases.
In this study, we select 593 recordings of short vowel pronunciations from the database and name the total of them as “Pronunciation of Italian Vowels” dataset.
The “Mobile Device Voice Recordings at King’s College London” (MDVR-KCL) are collected from 37 participants. In particular, 16 of them are patients who are at early or late stage of PD, while the rest persons are healthy ones. The subjects are asked to read two paragraphs, which include “Sun and wind” and a snippet of “computer applications in geography”. Since these two paragraphs are relatively large, segmentation is performed on the relevant sound data. To be more specific, manual segmentation is performed at the standstill point including commas and periods that locate in the middle and at the end of a sentence, respectively. For the case of long sentences, they are separated by conjunctions. In this way, we obtain a total of 297 segmented recordings which are taken as the “MDVR-KCL ReadText” dataset in this study. A brief summarization of the above two datasets is given in Table 1.
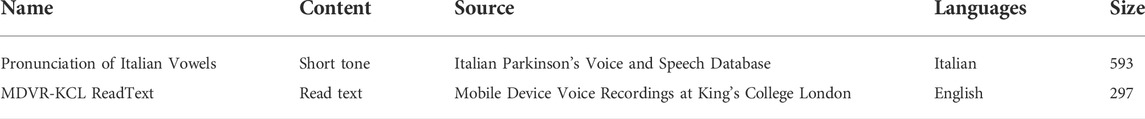
TABLE 1. Details of two datasets.
Voice signals are the mixture of sustained oscillations and non-oscillatory transients. In this work, we extract three types of characteristics from sound files and apply them to different subsequent classification methods. The first kind of characteristic is the time series features which are directly extracted from sounds. The time-series feature of sound is a 1D time-domain signal, so it is difficult to get the law of frequency change intuitively. If it is directly transformed to the frequency domain by Fourier transform, the frequency distribution of the signal can be seen without time-domain information, and the change of frequency distribution over time cannot be obtained. Therefore, the second kind of characteristic is collected by converting time-series features to spectrograms with the help of short-time Fourier transform [34]. Specifically, in the time domain, the digitally sampled data is first sliced into overlapping windowed segments, and Fourier transform is conducted on each segment to generate a frequency spectrum [17]. We then compute corresponding power spectrums and apply the Mel-scale filter banks to them to get its Mel Spectrogram.
And the last way is to extract different types of features from voice samples and combine them as the third kind of characteristic. In this paper, we use Praat acoustic analysis software [35] to extract a group of 26 linear and time-frequency features from each piece of voice sample. For the frame features, we intentionally extract 13 statistics including mean, median, root-mean, square, maximum, minimum, first and third quartile, interquartile range, standard deviation, skewness, and kurtosis. In total, 187 manual features at frame and segment levels are extracted from audio, covering attributes based on frequency, structure, statistics, and time. Note that a segment refers to a complete piece of audio, while a frame is a chunk that makes up a piece of audio. Table 2 gives a detailed description of the above features.
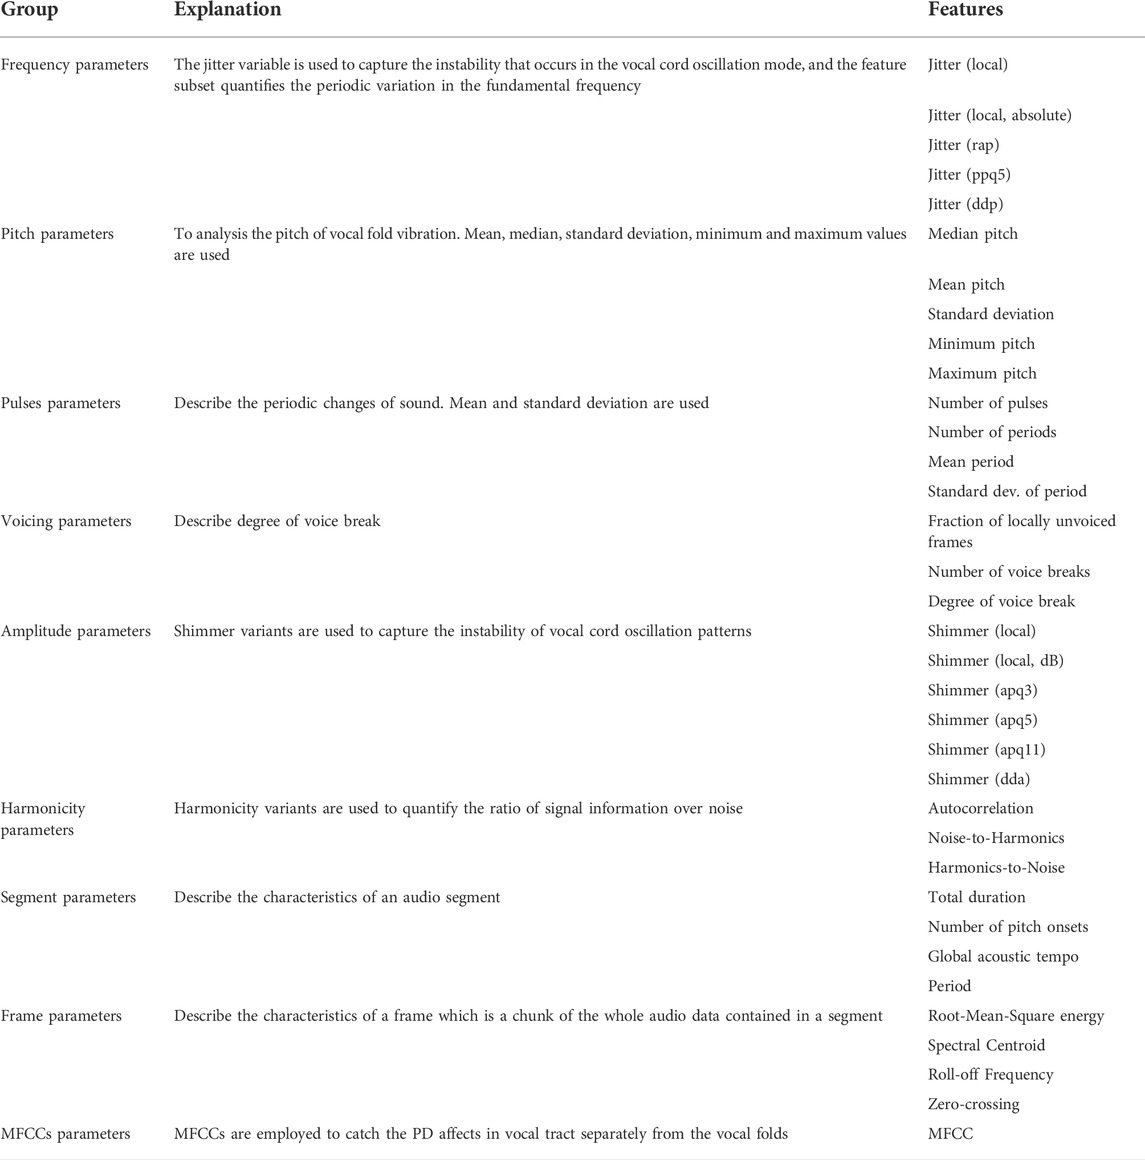
TABLE 2. Overview of the features used in this study.
In this paper, a new method for detecting Parkinson’s disease using sound data is proposed. As mentioned before, we integrate 26 linear and time-frequency features with 187 artificial features. These features are utilized as inputs to the classifier. In this work, we introduce particle swarm optimization (PSO) algorithm to the adaptive construction process of a 1D convolution network, whose final structure depends on the kind of languages and features. Figure 1 shows a graphical representation of the proposed framework.
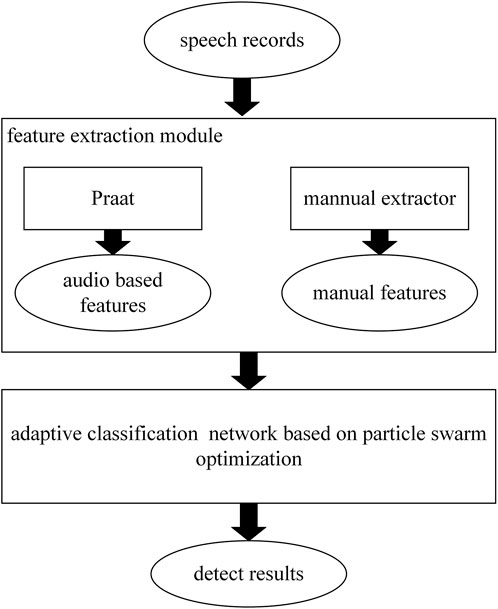
FIGURE 1. The pipeline of the proposed method.
The PSO algorithm originates from the study of the predation behavior of birds, and its purpose is to find the optimal solution through cooperation and information sharing among individuals in the group. PSO is initialized into a group of random particles (random solution). Then the optimal solution is found after series of iteration. In each iteration, the particle updates itself by simultaneously tracking its own and the whole swarm’s best positions (denoted as “pBest” and “gBest”) in the searching space. After finding these two optimal values, the particles update their speed and position through the following formula.
Among them, i = 1, 2, … , N is the total number of particles in this group,
PSO algorithm is used to find the most suitable architecture of a 1D convolution network for Parkinson’s classification based on voice recordings. More specifically, it determines to use how many convolution layers and fully-connected layers to constitute the final classification network, which layers are convolution layers, and which layers are fully connected layers. Considering the fact that the audio features used are specially selected, thus we do not employ pooling layers in our classification network since that may discard some information useful. First, the particle swarm and the network structure are initialized randomly according to the specified input and output. To ensure that the network structure is trainable, we limit that the first and the last layers to be convolutional and fully-connected, respectively. Figure 2 is an example of the structure of particles.
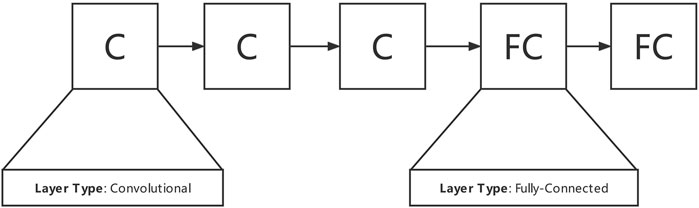
FIGURE 2. Example of a single particle used in the network structure search.
After a network structure is determined, the particles are trained, the loss function is calculated, and the particle swarm is evaluated by the loss function, thereby updating the gBest and pBest. In order to calculate the velocity of the current particle P, it is first necessary to compare the differences between the network structures. As shown in Figure 3, the convolutional layer and the fully-connected layer are compared separately. If the current layer structure of the two particles is the same, the difference is zero. Note that the comparison is based on the first network. If the first network has fewer layers than the second, the difference is recorded as -1, which means the layer should be removed. If the case is opposite, the result of the network comparison of this layer will be recorded as + L, indicating that a layer of type L needs to be added. The differences between the current particle P and gBest and pBest can be obtained by conducting above operations.
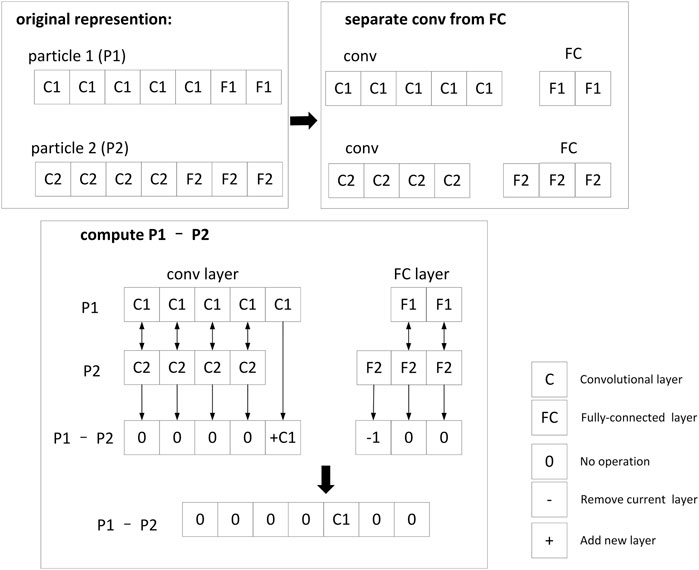
FIGURE 3. Demo of how to compute differences between two particles.
Recall that the goal of optimization is to search for the most appropriate network structure and determine the type of each layer of the network. For a specific layer in the network, three candidate operations would be applied to it: holding, deleting, or changing type. The final velocity is calculated by randomly selecting a number between
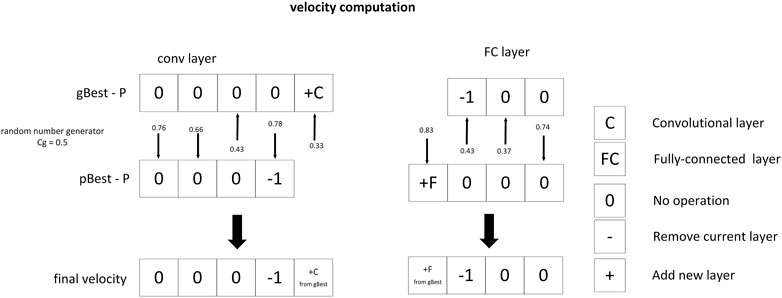
FIGURE 4. Demo of velocity computation.
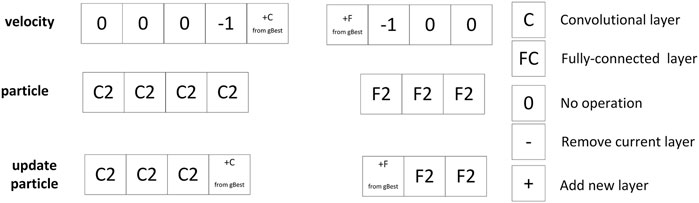
FIGURE 5. Demo of how to update a particle architecture.
Results with time-series features and Mel Spectrograms. In recent years, under the continuous efforts of many researchers, outstanding achievements have been made in audio classification. LEAF [36] is a fully learnable frontend for audio classification which achieves good results in many audio classification tasks. Here we used it to diagnose the Parkinson’s disease based on time-series features extracted from speech signals. LEAF frontend cascades a Gabor 1D-convolution, a Gaussian lowpass pooling (GLP), and smoothed Per-Channel Energy Normalization (sPCEN). Then a convolutional neural network (CNN) was trained to be the classifier. The above process is shown in Figure 6. Time series are utilized as input features to train the LEAF model separately while all other parameters are consistent. We chose a learning rate of 1e-4, a batch size of 64, and total epochs of 50.
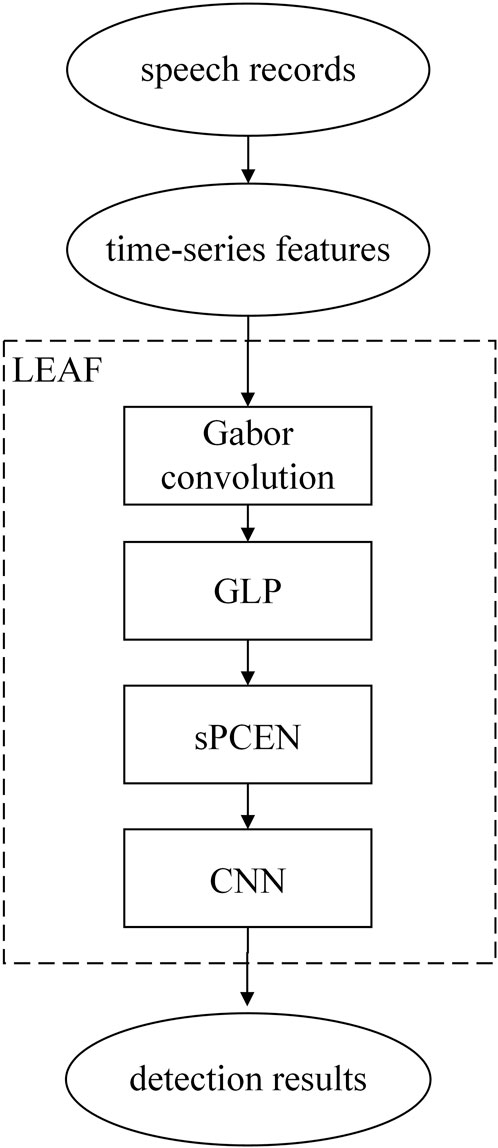
FIGURE 6. Optimal model structure for dataset one searched by PSO.
In addition to general audio classification methods, converting audio signals into image data and using the image classification approaches to detect Parkinson’s disease is also a major trend in recent years. In this work, we utilized short-time Fourier transform (STFT) to extract spectrograms from speech recordings and converted them to Mel Spectrograms with Mel-scaled filters. Then, the ResNet50 [37] was selected as the backbone which was trained with the Mel Spectrogram data. The above process is demonstrated in Figure 7. We converted the Mel Spectrogram to the right size and fine-tuned the network structure as needed. For the model using ResNet50 as the backbone, we set the learning rate to 1e-3, the batch size to 64, and entire epochs to 100. ReduceLROnPlateau was employed to update the learning rate and speed up training.
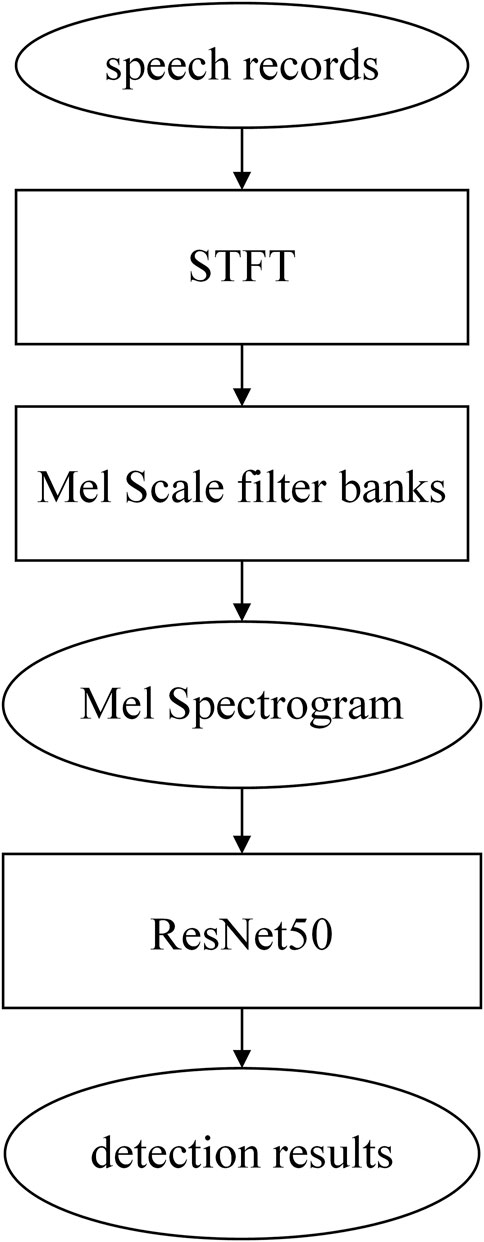
FIGURE 7. Optimal model structure for dataset two searched by PSO.
Experimental results on two datasets of respectively using time-series features and Mel Spectrograms to diagnose Parkinson’s disease are shown in Figure 8. Seeing from them, we can have the following observations. 1) No matter for the method based on LAEAF or ResNet50, a much higher recognition accuracy on the Pronunciation of Italian Vowels dataset is obtained than that on the MDVR-KCL dataset, while the performance gaps are 12.51% and 9.38% for each approach, respectively. A possible reason for this phenomenon is that, compared to pronouncing a single vowel, reading texts usually lasts for a longer period of time, which may exhibit more conditions of the speaker. As a result, algorithms might have more information to make judgements. 2) On each specific database, ResNet50 plus Mel Spectrograms consistently outperforms the LAEAF plus time-series features. The former even reached 100% accuracy when making diagnosis on the Pronunciation of Italian Vowels dataset. This again validates that the Mel Spectrogram is a powerful hand-engineered representation of sound, considering its desirable properties of invariance to shift and insensibility to small deformations.
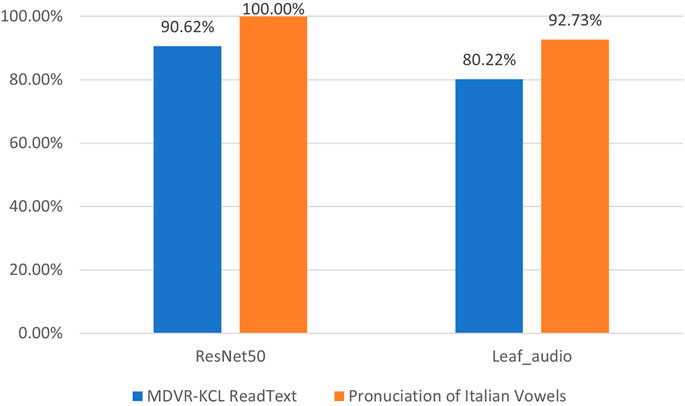
FIGURE 8. Diagnostic accuracy of Parkinson’s disease using LEAF and ResNet50.
Results with hybrid features. To study the effectiveness of proposed hybrid feature, we conducted experiments on six different conventional machine learning classification methods, including Support Vector Machine (SVM) [38], K-Neareast Neighbors (KNN) [19], Random Forest [39], Decision Tree [40], Logistic Regression [41], and Multi-Layer Perceptron (MLP) [42]. Looking at the results in Figures 9, 10, we can observe that, employing the hybrid features with 213 dimensions consistently improve the PD classification accuracy compared to merely using 26-dimensional basic features. Taking the experiments on Pronunciation of Italian Vowels for example, after replacing the basic features consisting of linear and time-frequency voice signals with the proposed hybrid features, the recognition accuracy of Parkinson’s disease by these six methods was significantly improved, with the margin of 13.33%, 15.85%, 10.21%, 10.21%, 7.33% and 9.96%, respectively.
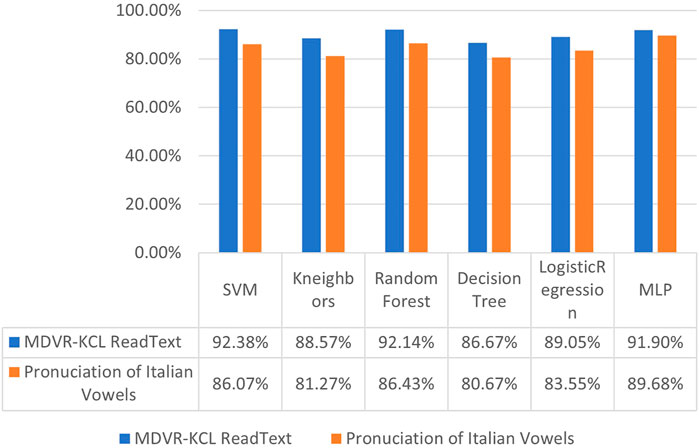
FIGURE 9. Diagnostic accuracy of Parkinson’s disease using conventional machine learning algorithms with linear and time-frequency features.
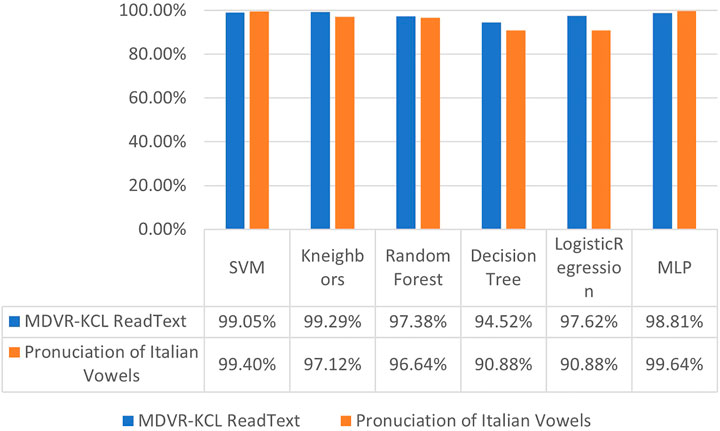
FIGURE 10. Diagnostic accuracy of Parkinson’s disease using conventional machine learning algorithms with hybrid features.
Firstly, the key feature combinations are extracted from the dataset, and then a suitable 1D convolution network is built by PSO. For dataset 1, the structure of the optimized network model is shown in Figure 11, which consists of four convolution layers, five standardization layers, and one full connection layer. For dataset 2, the optimal network structure includes two convolution layers, five standardization layers, and three full connection layers which can be seen in Figure 12. For network training, we employed the categorical cross-entropy loss function and the Adam optimizer. The learning rate was initialized to 0.01 and then updated with the assistance of ReduceLROnPlateau function provided by Keras deep learning framework. Results in Figures 13, 14 show that training process on two datasets.
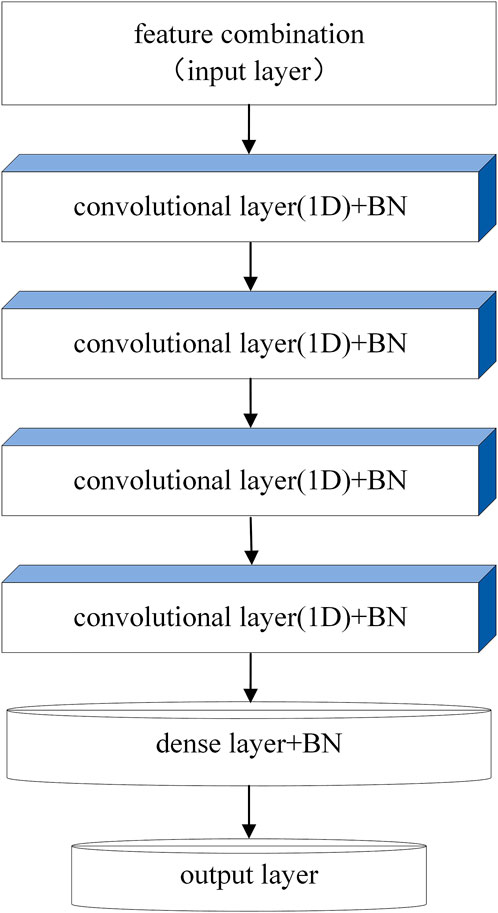
FIGURE 11. Parkinson detection model based on LEAF and time-series features.
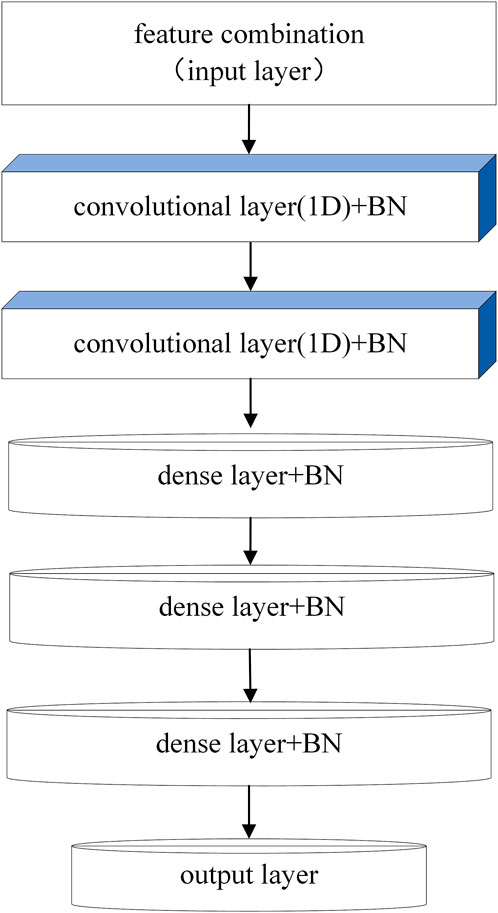
FIGURE 12. Parkinson detection model based on ResNet50 and Mel Spectrograms.
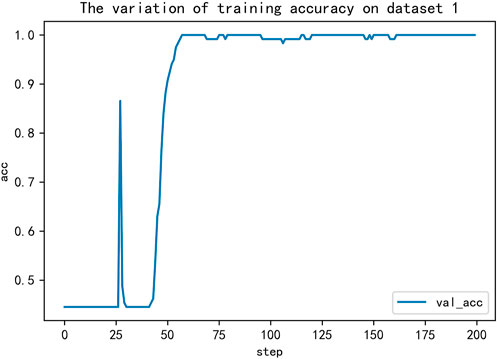
FIGURE 13. The variation of training accuracy on dataset 1.
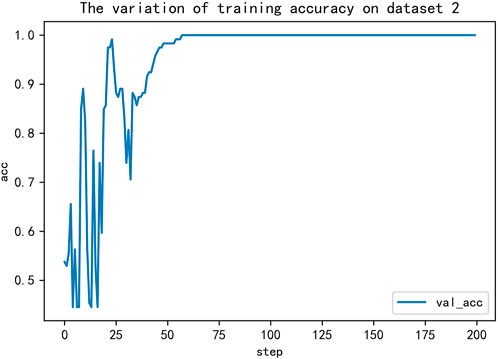
FIGURE 14. The variation of training accuracy on dataset 2.
In this section, we compare our entire method, namely employing the optimal neural network structure found by PSO to deal with hybrid features of the speech signals (denoted as PSOCNN), with other approaches on the diagnosis of Parkinson’s disease. The results are given in Figure 15. The LEAF obtained the worst performance on two datasets compared to other approaches. This indicates that general audio classification methods performing well in common life scenarios may be not suitable for the diagnosis of Parkinson’s disease. Although the Mel Spectrograms are strong audio features, ResNet50 network using them to judge whether the occurrence of Parkinson’s disease only got 90.62% accuracy, which is largely behind the performance of considered machine learning methods. It is notable that the SVM with the proposed hybrid features obtained recognition accuracies of 99.05% and 99.40% on two datasets. Our full method PSOCNN still outperforms it by achieving 100% accuracies on two databases.
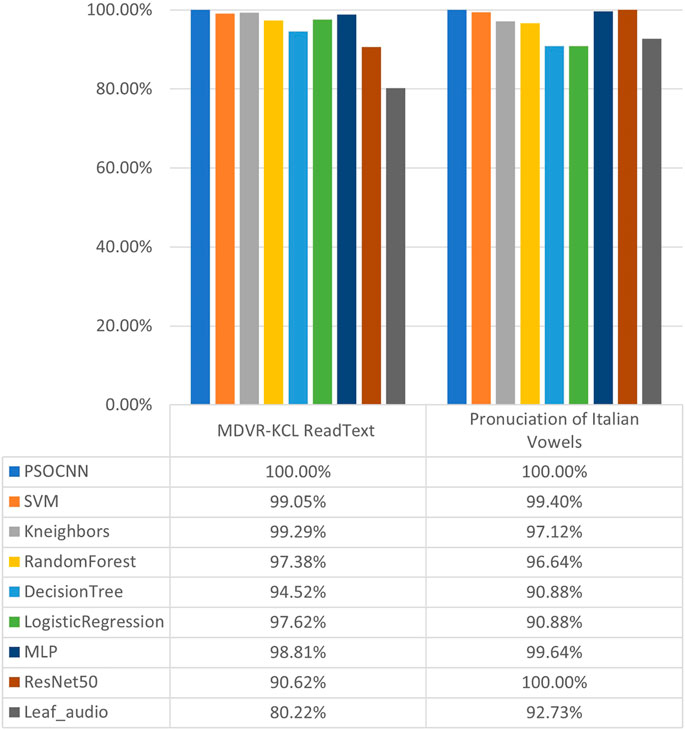
FIGURE 15. Diagnostic accuracy of Parkinson’s disease using different methods.
The key problem in the diagnosis of Parkinson’s disease is that there is no simple screening method to detect it in the early stage. Meanwhile, it is difficult for doctors to make diagnosis based on the voice of suspected patients. This paper introduces in detail how to extract different kinds of feature data from voice data, and proposes a set of key feature combinations for Parkinson’s speech recognition. In addition, the PSO optimization algorithm is introduced to adaptively build a most appropriate 1D convolution network for feature classification purposes. That removes the requirement of manually constructing network components according to specific voice signals. Experimental results on two datasets validate the efficacy of our method. In the future, more efficient, accurate, and practical approach to diagnose Parkinson’s disease still deserve to be further explored.
The original contributions presented in the study are included in the article/supplementary material further inquiries can be directed to the corresponding author.
J-CX and YG conducted experiments and wrote the manuscript. PL given medical advices of the methodology. RL helped with the English writing. HG conceptualized the idea of this study and revised the manuscript.
The work was funded in part by National Nature Science Foundation of China (No. 61931012), in part by Natural Science Research Start-up Foundation of Recruiting Talents of Nanjing University of Posts and Telecommunications (Grants No. NY222019, NY221019 and NY221074), in part by Natural Science Foundation of Jiangsu Province of China (Grant No. BK20210594), and in part by the Science and Technology Development Fund of Macau SAR under File 0034-2019-AMJ, 0087-2020-A2, and 0049–2021-A.
The authors declare that the research was conducted in the absence of any commercial or financial relationships that could be construed as a potential conflict of interest.
All claims expressed in this article are solely those of the authors and do not necessarily represent those of their affiliated organizations, or those of the publisher, the editors and the reviewers. Any product that may be evaluated in this article, or claim that may be made by its manufacturer, is not guaranteed or endorsed by the publisher.
1. Olanow CW, Stern MB, Sethi K. The scientific and clinical basis for the treatment of Parkinson disease. Neurology (2009) 72(21):S1–136. doi:10.1212/WNL.0b013e3181a1d44c
2. Gugliandolo G, Campobello G, Capra PP, Marino S, Bramanti A, Di Lorenzo G, et al. A movement-tremors recorder for patients of neurodegenerative diseases. IEEE Trans Instrum Meas (2019) 68(5):1451–7. doi:10.1109/TIM.2019.2900141
3. Lahmiri S. Gait nonlinear patterns related to Parkinson’s disease and age. IEEE Trans Instrum Meas (2019) 68(7):2545–51. doi:10.1109/TIM.2018.2866316
4. Ando B, Baglio S, Marletta V, Pistorio A, Dibilio V, Mostile G, et al. A wearable device to support the pull test for postural instability assessment in Parkinson’s disease. IEEE Trans Instrum Meas (2018) 67(1):218–28. doi:10.1109/TIM.2017.2753478
5. Jankovic J. Parkinson’s disease: clinical features and diagnosis. J Neurol Neurosurg Psychiatry (2008) 79(4):368–76. doi:10.1136/jnnp.2007.131045
6. Goetz CG, Tilley BC, Shaftman SR, Stebbins GT, Fahn S, Martinez-Martin P, et al. Movement disorder society-sponsored revision of the unified Parkinson’s disease rating scale (MDS-UPDRS): scale presentation and clinimetric testing results. Mov Disord (2008) 23(15):2129–70. doi:10.1002/mds.22340
7. Sakar CO, Serbes G, Gunduz A, Tunc HC, Nizam H, Sakar BE, et al. A comparative analysis of speech signal processing algorithms for Parkinson’s disease classification and the use of the tunable Q-factor wavelet transform. Appl Soft Comput (2019) 74:255–63. doi:10.1016/j.asoc.2018.10.022
8. Little MA, McSharry PE, Roberts SJ, Costello DA, Moroz I. Exploiting nonlinear recurrence and fractal scaling properties for voice disorder detection. Nat Prec (2007) 2:35. doi:10.1038/npre.2007.326.1
9. Tsanas A, Little MA, McSharry PE, Ramig LO. Accurate telemonitoring of Parkinson’s disease progression by non-invasive speech tests. Nat Prec (2009) 4:10. doi:10.1038/npre.2009.3920.1
10. Sakar BE, Isenkul ME, Sakar CO, Sertbas A, Gurgen F, Delil S, et al. Collection and analysis of a Parkinson speech dataset with multiple types of sound recordings. IEEE J Biomed Health Inform (2013) 17(4):828–34. doi:10.1109/jbhi.2013.2245674
11. Tsanas A, Little MA, Fox C, Ramig LO. Objective automatic assessment of rehabilitative speech treatment in Parkinson’s disease. IEEE Trans Neural Syst Rehabil Eng (2014) 22(1):181–90. doi:10.1109/tnsre.2013.2293575
12. Orozco-Arroyave JR, Hönig F, Arias-Londoño JD, Vargas-Bonilla JF, Daqrouq K, Skodda S, et al. Automatic detection of Parkinson’s disease in running speech spoken in three different languages. The J Acoust Soc America (2016) 139(1):481–500. doi:10.1121/1.4939739
13. Dimauro G, Di Nicola V, Bevilacqua V, Caivano D, Girardi F. Assessment of speech intelligibility in Parkinson’s disease using a speech-to-text system. IEEE Access (2017) 5:22199–208. doi:10.1109/ACCESS.2017.2762475
14. Hagen J, Dhaval T, Michael S. Mobile device voice recordings at King’s College London (MDVR-KCL) from both early and advanced Parkinson’s disease patients and healthy controls (2022). doi:10.5281/zenodo.2867216Accessed September 15, 2022].
15. Yadav SK, Tyagi K, Shah B, Kalra PK. Audio signature-based condition monitoring of internal combustion engine using FFT and correlation approach. IEEE Trans Instrum Meas (2011) 60(4):1217–26. doi:10.1109/TIM.2010.2082750
16. Bolat B, Sert SB. Classification of Parkinson’s disease by using voice measurements. Int J Reasoning-based Intell Syst (2010) 2(3/4):279. doi:10.1504/ijris.2010.036875
17. Frid A, Kantor A, Svechin D, Manevitz LM. Diagnosis of Parkinson’s disease from continuous speech using deep convolutional networks without manual selection of features. In: 2016 IEEE International Conference on the Science of Electrical Engineering (ICSEE); 16-18 November 2016; Eilat, Israel (2016). 1–4.
18. Despotovic V, Skovranek T, Schommer C. Speech based estimation of Parkinson’s disease using gaussian processes and automatic relevance determination. Neurocomputing (2020) 401:173–81. doi:10.1016/j.neucom.2020.03.058
19. Tuncer T, Dogan S, Acharya UR. Automated detection of Parkinson’s disease using minimum average maximum tree and singular value decomposition method with vowels. Biocybernetics Biomed Eng (2020) 40(1):211–20. doi:10.1016/j.bbe.2019.05.006
20. Meghraoui D, Boudraa B, Merazi-Meksen T, Boudraa M. Parkinson’s disease recognition by speech acoustic parameters classification. In: S Chikhi, A Amine, A Chaoui, MK Kholladi, and DE Saidouni, editors. Modelling and implementation of complex systems. Cham: Springer (2016). 165–73.
21. Gürüler H. A novel diagnosis system for Parkinson’s disease using complex-valued artificial neural network with k-means clustering feature weighting method. Neural Comput Appl (2017) 28(7):1657–66. doi:10.1007/s00521-015-2142-2
22. Karaman O, Cakın H, Alhudhaif A, Polat K. Robust automated Parkinson disease detection based on voice signals with transfer learning. Expert Syst Appl (2021) 178:115013. doi:10.1016/j.eswa.2021.115013
23. Rizvi DR, Nissar I, Masood S, Ahmed M, Ahmad F. An LSTM based deep learning model for voice-based detection of Parkinson’s disease. Int J Adv Sci Tech (2020) 29(5):337–43.
24. Kaur S, Aggarwal H, Rani R. Hyper-parameter optimization of deep learning model for prediction of Parkinson’s disease. Machine Vis Appl (2020) 31(5):32. doi:10.1007/s00138-020-01078-1
25. Soumaya Z, Drissi Taoufiq B, Benayad N, Yunus K, Abdelkrim A. The detection of Parkinson disease using the genetic algorithm and SVM classifier. Appl Acoust (2021) 171:107528. doi:10.1016/j.apacoust.2020.107528
26. Kamran I, Naz S, Razzak I, Imran M. Handwriting dynamics assessment using deep neural network for early identification of Parkinson’s disease. Future Generation Computer Syst (2021) 117:234–44. doi:10.1016/j.future.2020.11.020
27. Vidya B, Sasikumar P. Parkinson’s disease diagnosis and stage prediction based on gait signal analysis using EMD and CNN–LSTM network. Eng Appl Artif Intelligence (2022) 114:105099. doi:10.1016/j.engappai.2022.105099
28. Modi H, Hathaliya J, Obaidiat MS. Deep learning-based Parkinson disease classification using PET scan imaging data. In: IEEE 6th International Conference on Computing, Communication and Automation (ICCCA)17-19 December 2021; Arad, Romania (2021). 837–41.
29. Ge S. Efficient deep learning in network compression and acceleration. In: V Asadpour, editor. Digital systems. London, UK: IntechOpen (2018).
30. Mellor J, Turner J, Storkey A, Neural architecture search without training. In: International Conference on Machine Learning (ICML); 18-24 July 2021; Online (2021). 7588–98.
31. Xue Y, Jiang P, Neri F, Liang J. A multi-objective evolutionary approach based on graph-in-graph for neural architecture search of convolutional neural networks. Int J Neural Syst (2021) 31(09):2150035. doi:10.1142/S0129065721500350
32. Zhang L, Zhao L. High-quality face image generation using particle swarm optimization-based generative adversarial networks. Future Generation Computer Syst (2021) 122:98–104. doi:10.1016/j.future.2021.03.022
33. Kan X, Fan Y, Fang Z, Cao L, Xiong NN, Yang D, et al. A novel IoT network intrusion detection approach based on adaptive particle swarm optimization convolutional neural network. Inf Sci (2021) 568:147–62. doi:10.1016/j.ins.2021.03.060
34. Nuruzzaman A, Boyraz O, Jalali B. Time-Stretched short-time Fourier transform. IEEE Trans Instrum Meas (2006) 55(2):598–602. doi:10.1109/TIM.2006.864246
35. Paul B, David W. Praat: doing phonetics by computer. Available at: https://www.fon.hum.uva.nl/praat/(2022) [Accessed September 15, 2022].
36. Zeghidour N, Teboul O, Quitry Fde C, Tagliasacchi M. Leaf: A learnable frontend for audio classification. In: The 9th International Conference on Learning Representations (ICLR); 03-07 May 2021; Online (2021).
37. He K, Zhang X, Ren S. Deep residual learning for image recognition. In: IEEE Conference on Computer Vision and Pattern Recognition (CVPR); 27-30 June 2016; Las Vegas, NV, USA (2016). 770–8.
38. Osowski S, Siroic R, Markiewicz T, Siwek K. Application of support vector machine and genetic algorithm for improved blood cell recognition. IEEE Trans Instrum Meas (2009) 58(7):2159–68. doi:10.1109/TIM.2008.2006726
39. Mekha P, Teeyasuksaet N. Image classification of rice leaf diseases using random forest algorithm. In: 2021 Joint International Conference on Digital Arts, Media and Technology with ECTI Northern Section Conference on Electrical, Electronics, Computer and Telecommunication Engineering; 03-06 March 2021; Cha-am, Thailand (2021). 165–9.
40. Rochmawati N, Hidayati HB, Yamasari Y, Yustanti W, Rakhmawati L, Tjahyaningtijas HPA, et al. Covid symptom severity using decision tree. In: 2020 Third International Conference on Vocational Education and Electrical Engineering (ICVEE); 03-04 October 2020; Surabaya, Indonesia (2020). 1–5.
41. Huamán-Romaní YL, Roque-Tito E, Bautista-Lopez L, Gutierrez-Aguilar MD. Level of depression of college students with binary logistic regression model approximation in Covid-19 times. In: 2021 IEEE 1st International Conference on Advanced Learning Technologies on Education & Research (ICALTER); 16-18 December 2021; Lima, Peru (2020). 1–4.
Keywords: Parkinson’s disease (PD), audio analysis, particle swarm optimization (PSO), convolutional neural network (CNN), classification
Citation: Xie J-C, Gan Y, Liang P, Lan R and Gao H (2022) Exploring robust computer-aided diagnosis of Parkinson’s disease based on various voice signals. Front. Phys. 10:1048833. doi: 10.3389/fphy.2022.1048833
Received: 20 September 2022; Accepted: 20 October 2022;
Published: 03 November 2022.
Edited by:
Junxin Chen, Northeastern University, ChinaReviewed by:
Muhammad Saadi, University of Central Punjab, PakistanCopyright © 2022 Xie, Gan, Liang, Lan and Gao. This is an open-access article distributed under the terms of the Creative Commons Attribution License (CC BY). The use, distribution or reproduction in other forums is permitted, provided the original author(s) and the copyright owner(s) are credited and that the original publication in this journal is cited, in accordance with accepted academic practice. No use, distribution or reproduction is permitted which does not comply with these terms.
*Correspondence: Hao Gao, dHNnYW9oYW9AZ21haWwuY29t
Disclaimer: All claims expressed in this article are solely those of the authors and do not necessarily represent those of their affiliated organizations, or those of the publisher, the editors and the reviewers. Any product that may be evaluated in this article or claim that may be made by its manufacturer is not guaranteed or endorsed by the publisher.
Research integrity at Frontiers
Learn more about the work of our research integrity team to safeguard the quality of each article we publish.