- 1College of Management and Economics, Tianjin University, Tianjin, China
- 2Laboratory of Computation and Analytics of Complex Management Systems (CACMS), Tianjin University, Tianjin, China
- 3Pittsburgh Institute, Sichuan University, Chengdu, China
The currency market is one of the most important financial markets in the world. The exchange rate movement has effect on international trade and capital flow. This study presents a forecasting method for exchange rate based on multi-modal combination market trend. The method facilitates the more accurate identification of volatility link between exchange rates, unlike the conventional ones, in which only information related to itself is used as input. We select multiple characteristics of the exchange rate from other countries as input data. Then the Pearson correlation coefficient and random forest model are used to filter these characteristics We integrate the data with higher correlation into the temporal convolutional network model to forecast the exchange rate. For the empirical samples, a nine-year period historical exchange rates of the Euro, Ruble, Australian dollar, and British pound corresponding to the Renminbi are used. The empirical results show the more stable effect using the forecasting method proposed in this study than the traditional models.
1 Introduction
Financial markets play an important role in the development of the global economy. And the currency market is an influential component of the financial market. Thus, exchange rate forecasting has come into one focus of the academia and economic [1, 2]. Several scholars have conducted studies on the exchange rates [3–5]. In addition, the study of exchange rate time-series data has been an invaluable component of time-series research. This involves the judgment and speculation of fluctuation ranges and trend changes in the exchange rate relationships.
Henrique B M et al. [6] analyzed the application of current commonly used machine learning methods in the field of financial forecasting. By analyzing machine learning models in many papers, the author shows that machine learning methods can predict the trend of financial prices. Sezer OB et al. [7] analyzed papers on machine learning models and deep learning models published in 2020 and before. The results show that the popularity of deep learning models in the field of financial forecasting is gradually improving, and the deep learning model also has good prediction accuracy. Howerer, traditional neural networks have defects. Deep neural network (DNN) is not proper to the time series. Recurrent neural network (RNN) cannot perform massively parallel processing. Convolutional neural network (CNN) has the advantage of massive parallel processing, regardless of the network’s depth. Long short-term memory (LSTM) and gate recurrent unit (GRU) degrades to random guesses as the time length T grows. However, temporal convolutional network (TCN) [8] overcomes the shortcomings of the traditional models. The review of [9] introduces TCN and documents its application in the field of time series prediction. The fact that TCN does not utilize future information and that input and output lengths are equal makes TCN models of considerable interest to researchers. Soleymani and [10] proposed a novel deep learning framework called the QuantumPath for long-term stock-price forecasting. They also incorporated a TCN into the model to ensure causality. The experiments demonstrated the effectiveness of the proposed method. Totannanavar [11] used the TCN to predict stock prices. In relation to other neural networks, this model has several advantages. Wiese et al. [12] proposed data-driven models called quant generative adversarial networks (GANs). The model consists of a generator and a discriminator function and uses a TCN to capture long-term dependencies. To predict the stock prices, Janssen [13] combined a TCN with attention mechanisms. The study’s finding shows a more significant effect of the combination of temporal attention and TCN. Tan et al. [14] developed a new financial time series GAN (FinGAN) based on TCN. The results show that the model can more accurately fit high-volatility convertible bonds. Lei et al. [15] constructed a deep TCN model to predict volatility under high-frequency financial data based on other trading information such as trading volume, trend indicators, and quote change rate. The results show that TCN model with investor attention provides better prediction accuracy than that of the TCN model without investor attention. Using a TCN, Dai et al. [16] classified price changes into several categories and predicted the conditional probability of each category. They also added a mechanism to the TCN architecture to model the time-varying distribution of stock price changes. Empirical evidence indicates that the proposed method outperforms the comparison model. According to Zhang et al. [17], the TCN is an effective method to predict return volatility and value-at-risk in exchange rate forecasting studies.
This study investigates the exchange rate changes among countries using TCN, considering the advantages of TCN in financial forecasting. Furthermore, although many studies have used several methods to predict exchange rates, none of them considers the correlation between the exchange rates from different countries. The progress in global economic integration have increasingly correlated the exchange rate movements between countries. As exchange rates have both linear and nonlinear behavioural characteristics, a single linear or nonlinear model can not predict exchange rates roundly. Instead of using only information related to the individual exchange rate as input, we use information related to exchange rate volatility as input. This enables us to determine the relationship between volatility and the exchange rate. We present a multimodal combination-based method for forecasting exchange rate market trends, using multiple exchange rate characteristics from other countries as input data. We also filter multiple exchange rate characteristics using a Pearson correlation coefficient and a random forest model. We incorporate data with higher correlation to improve the accuracy and stability of exchange rate forecasting. Subsequently, we analyse the exchange rate prediction by considering the TCN model. In terms of the data, we select nine-years historical data of the exchange rate of the Euro (EUR), Ruble (RUB), Australian dollar (AUD), and the British pound (GBP) to RMB. Four evaluation indicators are applied to compare with other four from the traditional models. We test different datasets separately.
The contributions of this study are as follows. First, this study attempts a pure end-to-end approach to predict the movement of the exchange market. Specifically, this research utilizes a model combining feature extraction and TCN. Only the raw exchange rate data are used as input. Hence, it can eliminate the human intervention. Second, this study identifies the characteristics of the movement of exchange rate based on the exchange rate in several other countries. We combine the Pearson correlation coefficient with a random forest to filer the multiple exchange rate characteristics. Then, we identify the characteristics with higher correlation from the filtered characteristics. As a result, we integrate the historical exchange rate data and exchange rate characteristics into one specific data set. The results demonstrate that the proposed method provides more stable prediction effect than the traditional models.
The rest of this article is organized as follows. Section 2 reviews related methodologies. The data and the empirical results are provided in Section 3. Section 4 concludes the article.
2 Methodologies
2.1 Temporal convolutional networks
A RNN performs well on almost all time-series issues. However, in practice, RNN presents serious problems. Since the network can only process one time step at a time, the latter must wait until the processing is complete in the preceding step, before it can be computed. This problem means that an RNN cannot perform massive parallel processing, which implies that RNN is computationally demanding.
When a CNN processes an image, it treats the image as a two-dimensional block (m × n matrix). Moving to time series, time series can be viewed as a one-dimensional object (1 × n vector). Through the multilayer network structure, the CNN retrieves a sufficiently large receptive field. This practice deepens the model structure of the CNN. However, the CNN saves time owing to the advantage of massive parallel processing, regardless of the network’s depth.
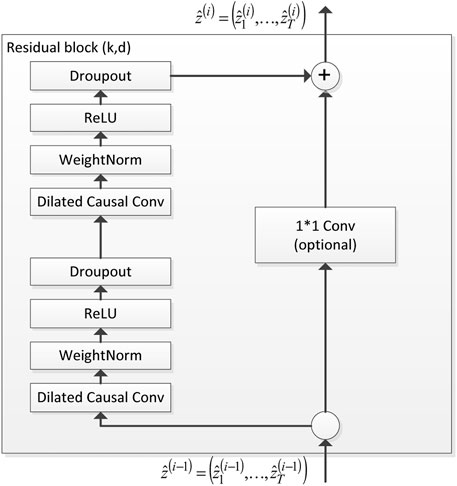
The network combines the structural features of the RNN and CNN with more flexible perceptual fields, more stable gradient changes, and less memory usage. The main structure of the TCN is shown in Figure 1. The TCN mainly comprises five parts—the dilated causal convolutional, WeightNorm, activation function, and dropout layers and a residual connection block.
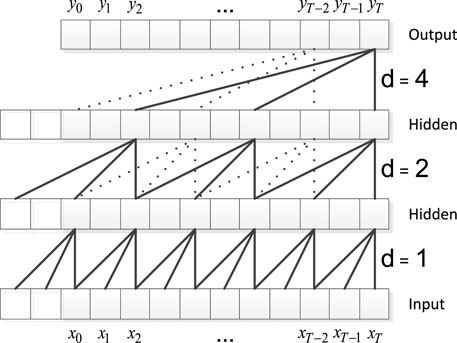
The dilated causal convolutional layer mines the data features for analysis. Figure 2 shows the structure of the dilated causal convolutional layer. The WeightNorm layer accelerates the model by rewriting the weights of the deep network. The activation function layer increases the nonlinearity of the network and improves the model’s expressiveness. The dropout layer prevents model overfitting. The residual connection block is a 1 × 1 convolution block. The residual connection locks not only enable the network to transmit information across layers but also ensure the consistency of the input and output.
2.2 Multimodal combination-based method for forecasting exchange rate
With economic globalization, countries are becoming increasingly closely connected. This indicates an obvious correlation between the exchange rate prices from different economies. However, the differences in the relationships between countries yields different correlations between exchange rate prices of different countries. Some exchange rate data and forecast exchange rates have an obvious strong correlation, whereas others have an obvious weak correlation. Therefore, this study proposes a method for forecasting the trend of the exchange rate market based on a multimodal combination.
Figure 3 illustrates the specific process of the proposed model. First, we use the Pearson correlation coefficient to extract the features highly correlated with the predicted exchange rate in the input data. Pearson’s correlation coefficient ranges from −1 to 1. The closer the absolute value is to 1, the stronger is the linear correlation between exchange rates.
The Pearson correlation coefficient is linear, reflecting the degree of linear correlation between the two quantities. However, the exchange rates of various countries are interrelated, and there is a nonlinear relationship between the exchange rate prices. Therefore, this study uses the random forest algorithm to analyse the impact of the closing price of the exchange rate of other countries on the predicted exchange rate.
Finally, we use the TCN to predict exchange rate changes by combining the Pearson correlation coefficient and random forest features.
3 Empirical results
3.1 Data
We collect the nine-years period data of the exchange rate data from the Wind database, from 1 January 2012 to 31 December 2021. The closing price of Australia’s exchange rate to RMB (AUD/RMB), the closing price of the Euro exchange rate to RMB (EUR/RMB), the closing price of the Sterling’s exchange rate to RMB (GBP/RMB), and the closing price of the Ruble’s exchange rate to RMB (RUB/RMB) are selected as empirical data. The data consists of two parts. The first part introduces the closing prices of exchange rates of other countries in each forecast data set. The second part consists of the closing, opening, lowest, and highest prices, which are extracted from the forecast data.
3.2 Test indicators
We use the mean absolute error (MAE), mean absolute percentage error (MSE), root mean squared error (RMSE), and R2 as evaluation indices which read,
In the above equation,
We use the DM test [18–20] improved by Harvey et al. to perform a robustness test.
where
3.3 Characteristic screening analysis
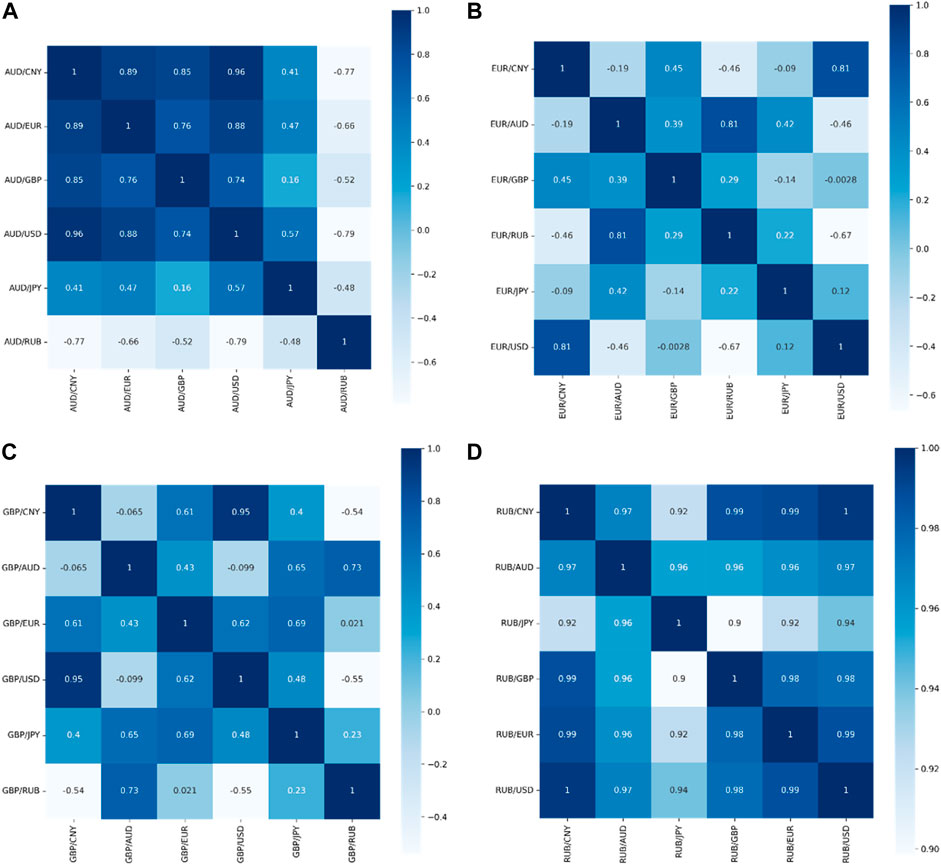
We adopt the Pearson correlation coefficient and random forest to detect the two components. Figure 4 shows the Pearson coefficients between the closing prices of the forex data. We set 0.8 as the threshold value, that is, we preserve only the relationships with the absolute value of Pearson coefficients larger than 0.8 and filter out the others.
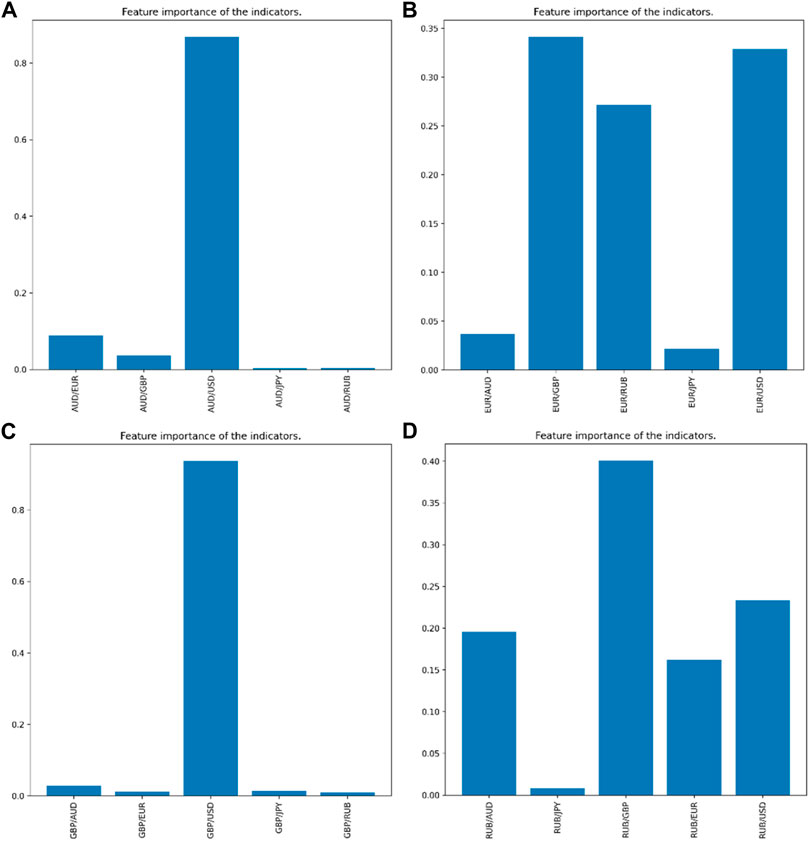
We select foreign exchange-related data with a cumulative percentage of 90% or more of the random forest feature importance ranking as the filtering condition. Figure 5 shows the results of the random forest algorithm for feature importance ranking.
3.4 Comparative experimental analysis
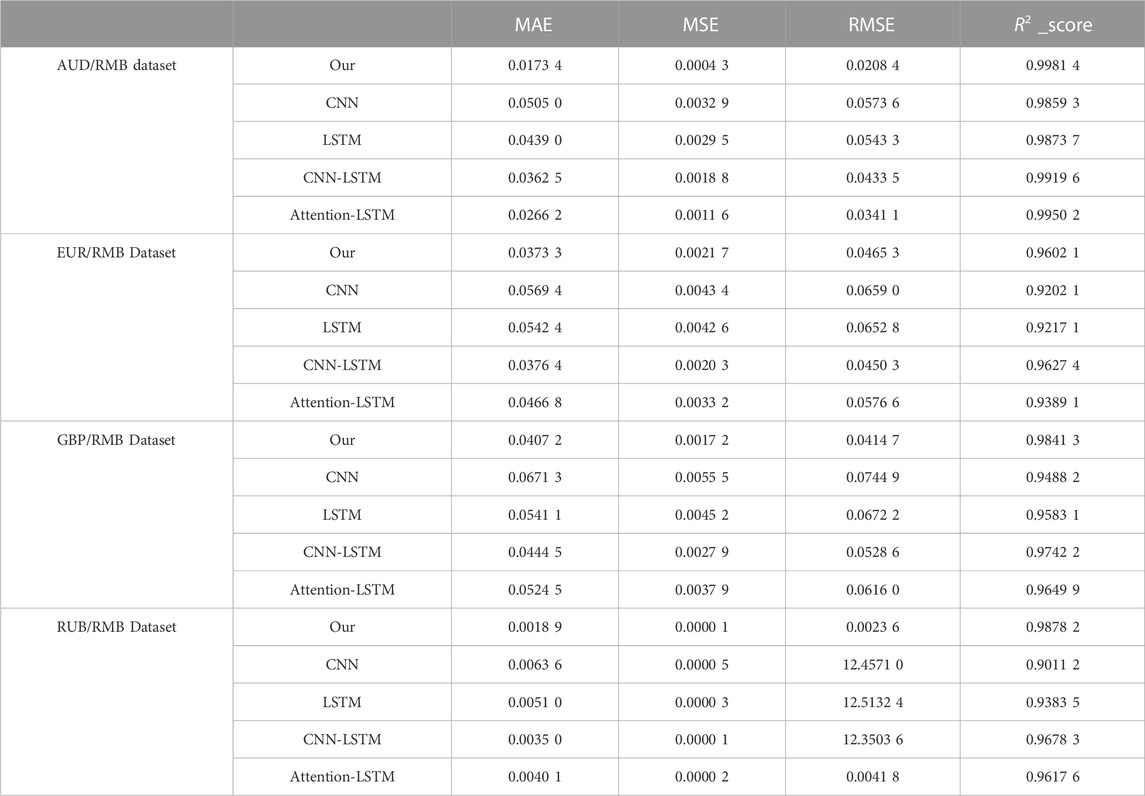
To verify the prediction effect of the proposed model, we conduct a comparative analysis between CNN [21], LSTM [22], CNN-LSTM [23], and attention-LSTM [24], which are deep learning models. Table 1 shows that the prediction effect of the LSTM model is higher than that of the CNN model. This indicates that the LSTM model with the introduction of a gating unit has better adaptability for the prediction of time-series data with a nonlinear nature. The prediction effect of the CNN-LSTM model was higher than that of the LSTM model. This indicates that the convolution operation of the CNN helps in extracting long time-series features. Compared with the other models, the proposed model achieves the best prediction results for each prediction index. This indicates that, relative to the simple model superimposed by CNN and LSTM, it is easier to mine the change rules in the time-series data.
Table 2 shows the results of the DM detection. Most p-values are less than 0.05, and the DM value is less than 0. This shows that this study’s model is better than the other models in most cases. Relative to the CNN-LSTM model only on the GBP/RMB dataset, all p-values exceed 0.05. In this case, both models perform equally. Overall, the TCN model performs better than the other models.
To show the prediction effect of each model more intuitively, we visually integrate the prediction data. As shown in Figure 6 (for better visibility of the length of the graphs, we chose to plot the first 150 predictions in this study). The method proposed in this study can fit the real data better than the other comparative models. This indicates that the model has a certain degree of robustness.
4 Conclusion
We present a method for predicting the movement of the currency market based on the combined model. We also analyse the multiple characteristics of foreign exchange rates as inputs. The Pearson correlation coefficients and random forest characteristics are used as input filters. The findings show that the exchange rate has a high correlation with the target extraction features. The results of the simulated empirical data based on the EUR, RUB, AUD, and GBP show that the proposed approach for exchange rate prediction has stronger stability and accuracy than that of the traditional methods. This proposed approach can be used to provide recommendations regarding the currency market projections. This study also indicates that, when forecasting exchange rates, it is crucial to refer to the movement of exchange rate in other economies. Our future work will continue to mine features, other than the exchange rate data, to improve the robustness of the model.
Data availability statement
The original contributions presented in the study are included in the article/Supplementary Material, further inquiries can be directed to the corresponding author.
Author contributions
XL: conceptualization, methodology, formal analysis, software, writing—original draft preparation, writing—review and editing. XX: formal analysis, visualization, investigation, supervision. BG: data curation, writing—review and editing.
Funding
This work was supported by National Natural Science Foundation of China (Grants Nos. 72141304 and 71790594), Fundamental Research Funds for the Central Universities, Tianjin Development Program for Innovation and Entrepreneurship.
Conflict of interest
The authors declare that the research was conducted in the absence of any commercial or financial relationships that could be construed as a potential conflict of interest.
Publisher’s note
All claims expressed in this article are solely those of the authors and do not necessarily represent those of their affiliated organizations, or those of the publisher, the editors and the reviewers. Any product that may be evaluated in this article, or claim that may be made by its manufacturer, is not guaranteed or endorsed by the publisher.
References
1. Liu J. Impact of uncertainty on foreign exchange market stability: Based on the LT-TVP-VAR model. China Finance Rev Int (2020) 11:53–72. doi:10.1108/CFRI-07-2019-0112
2. Wu Y. The causes and challenges of low interest rates: Insights from basic principles and recent literature. China Finance Rev Int (2020) 11:145–69. doi:10.1108/CFRI-06-2020-0071
3. Mate C, Jimeńez L. Forecasting exchange rates with the iMLP: New empirical insight on one multi-layer perceptron for interval time series (ITS). Eng Appl Artif Intelligence (2021) 104:104358. doi:10.1016/j.engappai.2021.104358
4. Cao H, Lin F, Li Y, Wu Y. Information flow network of international exchange rates and influence of currencies. Entropy (2021) 23:1696. doi:10.3390/e23121696
5. Antwi A, Kyei KA, Gill RS. The use of mutual information to improve value-at-risk forecasts for exchange rates. IEEE Access (2020) 8:179881–900. doi:10.1109/ACCESS.2020.3027631
6. Henrique BM, Sobreiro VA, Kimura H. Literature review: Machine learning techniques applied to financial market prediction. Expert Syst Appl (2019) 124:226–51. doi:10.1016/j.eswa.2019.01.012
7. Sezer OB, Gudelek MU, Ozbayoglu AM. Financial time series forecasting with deep learning: A systematic literature review: 2005-2019. Appl Soft Comput J (2020) 90:106181. doi:10.1016/j.asoc.2020.106181
8. Bai S, Kolter JZ, Koltun V. An empirical evaluation of generic convolutional and recurrent networks for sequence modeling (2018). arXiv [Preprint] arXiv:1803.01271.
9. Torres JF, Hadjout D, Sebaa A, Martinez-Alvarez F, Troncoso A. Deep learning for time series forecasting: A survey. Big Data (2021) 9:3–21. doi:10.1089/big.2020.0159
10. Soleymani F, Paquet E. Long-term financial predictions based on Feynman–Dirac path integrals, deep Bayesian networks and temporal generative adversarial networks. Machine Learn Appl (2022) 7:100255. doi:10.1016/j.mlwa.2022.100255
11. Totannanavar S. Co-relation between the financial news articles and Stock prices and Stock Prediction. Dublin: National College of Ireland (2019).
12. Wiese M, Knobloch R, Korn R, Kretschmer P. Quant GANs: Deep generation of financial time series. Quantitative Finance (2020) 20:1419–40. doi:10.1080/14697688.2020.1730426
13. Janssen P. Attention based Temporal Convolutional Network for stock price prediction. Utrecht: Utrecht University (2022).
14. Tan X, Zhang Z, Zhao X, Wang S. DeepPricing: Pricing convertible bonds based on financial time-series generative adversarial networks. Financial Innovation (2022) 8:64–38. doi:10.1186/s40854-022-00369-y
15. Lei B, Zhang B, Song Y. Volatility forecasting for high-frequency financial data based on web search index and deep learning model. Mathematics (2021) 9:320. doi:10.3390/math9040320
16. Dai W, An Y, Long W. Price change prediction of ultra high frequency financial data based on temporal convolutional network. Proced Comp Sci (2022) 199:1177–83. doi:10.1016/j.procs.2022.01.149
17. Zhang CX, Li J, Huang XF, Zhang JS, Huang HC. Forecasting stock volatility and value-at-risk based on temporal convolutional networks. Expert Syst Appl (2022) 207:117951. doi:10.1016/j.eswa.2022.117951
18. Dai PF, Xiong X, Zhang J, Zhou WX. The role of global economic policy uncertainty in predicting crude oil futures volatility: Evidence from a two-factor GARCH-MIDAS model. Resour Pol (2022) 78:102849. doi:10.1016/j.resourpol.2022.102849
19. Dai PF, Xiong X, Huynh TLD, Wang J. The impact of economic policy uncertainties on the volatility of European carbon market. J Commodity Markets (2022) 26:100208. doi:10.1016/j.jcomm.2021.100208
20. Harvey D, Leybourne S, Newbold P. Testing the equality of prediction mean squared errors. Int J Forecast (1997) 13:281–91. doi:10.1016/S0169-2070(96)00719-4
21. Panda MM, Panda SN, Pattnaik PK. Forecasting foreign currency exchange rate using convolutional neural network. Int J Adv Comp Sci Appl (2022) 13:607–16. doi:10.14569/IJACSA.2022.0130272
22. Adekoya AF, Nti IK, Weyori BA. Long short-term memory network for predicting exchange rate of the Ghanaian cedi. FinTech (2021) 1:25–43. doi:10.3390/fintech1010002
23. Sun L, Xu W, Liu J. Two-channel attention mechanism fusion model of stock price prediction based on CNN-LSTM. Trans Asian Low-Resource Lang Inf Process (2021) 20:1–12. doi:10.1145/3453693
Keywords: Pearson correlation coefficient, deep learning, random forest, artificial intelligence, exchange rate prediction
Citation: Lv X, Xiong X and Geng B (2023) Increasing the prediction performance of temporal convolution network using multimodal combination input: Evidence from the study on exchange rates. Front. Phys. 10:1008445. doi: 10.3389/fphy.2022.1008445
Received: 31 July 2022; Accepted: 28 December 2022;
Published: 12 January 2023.
Edited by:
Jianbo Wang, Southwest Petroleum University, ChinaReviewed by:
Liang Wu, Southwestern University of Finance and Economics, ChinaJun Hu, Rey Juan Carlos University, Spain
Huijie Yang, University of Shanghai for Science and Technology, China
Copyright © 2023 Lv, Xiong and Geng. This is an open-access article distributed under the terms of the Creative Commons Attribution License (CC BY). The use, distribution or reproduction in other forums is permitted, provided the original author(s) and the copyright owner(s) are credited and that the original publication in this journal is cited, in accordance with accepted academic practice. No use, distribution or reproduction is permitted which does not comply with these terms.
*Correspondence: Xiong Xiong, eHhwZXRlckB0anUuZWR1LmNu
 Xueling Lv1
 Xiong Xiong