- 1Key Laboratory of Advanced Theory and Application in Statistics and Data Science, MOE, School of Statistics, East China Normal University, Shanghai, China
- 2School of Mathematics and Statistics, Shanxi Datong University, Datong, China
This article develops two new empirical likelihood methods for long-memory time series models based on adjusted empirical likelihood and mean empirical likelihood. By application of Whittle likelihood, one obtains a score function that can be viewed as the estimating equation of the parameters of the long-memory time series model. An empirical likelihood ratio is obtained which is shown to be asymptotically chi-square distributed. It can be used to construct confidence regions. By adding pseudo samples, we simultaneously eliminate the non-definition of the original empirical likelihood and enhance the coverage probability. Finite sample properties of the empirical likelihood confidence regions are explored through Monte Carlo simulation, and some real data applications are carried out.
1 Introduction
The empirical likelihood (EL) method is originally designed to construct a confidence region only for independent data [1,2]. Nowadays, it is quite popular in the statistical inference of time series, (dependent data) thanks to the asymptotical independent property of the periodogram ordinates, see [3], [4], and [5]. EL received considerable attention because of its nice statistic properties. For example, it runs a low risk of a misspecified probability model by setting up a semi-parametric moment model; it is easy to construct a confidence region or interval under the chi-square approximation; there is no need to calculate the covariance estimates when it is used to construct confidence regions; and the shape of confidence region that is naturally driven by data.
In spite of nice properties of EL, it still does not work well for the case of small sample or high-dimensional data. Its main drawback is the large coverage error of the corresponding confidence region. One reason for the under-coverage is that the original EL ratio poorly approximates to the chi-square limiting distribution. This under-coverage issue can be alleviated to some extent by the Bartlett correction [6]. Another reason for the under-coverage is the non-definition problem of the EL ratio. When the sample size is small, the definition of the original EL ratio often does not exist. [7] proposed adjusted EL by adding pseudo points to ensure the original convex hull lie on the opposite of the origin, which not only eliminates the non-definition but also improves the accuracy of approximation with the conventional level of adjustment. [8] put forward the optimal adjustment level to improve the chi-square approximation with a high-order precision, but the problem is not solved. Afterward, [9] derived an adjustment factor from the Bartlett correction and proved by adding two pseudo observations; the new adjusted EL (AEL) has the same order of chi-square approximation as the Bartlett correction. Many research studies about choosing an optimal adjustment factor arose, such as [10], [11], [12], and [13]. In practice, when the dimension of the unknown parameter is large, it is difficult to calculate the Bartlett correction factor. Recently, the mean EL (MEL) was proposed to improve the precision of the EL-based confidence regions by constructing a new pseudo data point [14]. By greatly increasing the sample size, the MEL method leads to a more accurate chi-square approximation. Hence, the corresponding coverage error is reduced, and the coverage probability is enhanced.
For time series, EL inherits the undesirable problem of under-coverage. To the best of our knowledge, there have been some works applying AEL on the improvement of the precision of the EL-based confidence region, such as [15] and [16]. But under their proposed conventional adjustment level a = max (1, log(n)/2), the precision of chi-square approximation distribution of AEL is not obviously enhanced. In this article, we propose another adjustment level to construct new AEL for the parameters in stationary short- and long-memory time series models with Gaussian noise. Following the Liu & Chen’s method, our proposed AEL possesses a high-order approximation to chi-square distribution by adding two pseudo observations. We also propose the MEL method for estimating the parameters of stationary time series models. By increasing the sample size, the MEL does enhance the confidence precision. The Monte Carlo simulation results indicate that our proposed AEL-based confidence regions benefit more accurate coverage probabilities than those of the original EL and the previous AEL. When the sample size is moderate, the coverage probability based on MEL is comparable to the previous AEL. There is no need to compute the Bartlett correction factor for MEL, which is a challenge when the dimension of the parameter vector is large.
The remainder of this article is organized as follows; in Section 2, we present the proposed AEL and MEL ratio statistics for parameters in stationary ARMA and ARFIMA processes and deduce their asymptotical chi-square properties. Monte Carlo simulation results are provided in Section 3 to show the improved finite-sample performance of our methods. Real data examples are presented in Section 4. Section 5 is the brief proof of the theorem.
2 Methodology
In this section, we derive the asymptotical chi-square properties of the new AEL and MEL ratio statistics for the parameters in representative stationary short- and long-memory models, that is, ARMA and ARFIMA models. We begin with introducing the moment-estimating equations of parameters in these models.
2.1 Estimating Equations
Suppose, we have a time series
where
By taking the derivative of Whittle likelihood [21], the estimating equations are derived as
where N = [(T − 1)/2] and [x] is the integer part of x. The periodogram ordinates are denoted as
and the spectral density function is
2.2 AEL of β
It is well known that when the origin lies out of certain convex constraints
For simplicity, denote ψi≔ψi (I (ωi), β). Based on the original sample set
If the origin contains in the convex set Ωβ, by a simple Lagrange multiplier calculation,
where
To overcome such drawback, we propose a new AEL following the Liu & Chen’s method. By adding two pseudo observations, the AEL not only guarantees the likelihood ratio to be always well defined but also obviously improves the coverage probability of the confidence region in stationary time series. Set the two pseudo observations
By the Lagrange method, we have
where the Lagrange multiplier
[22] proved such AEL ratio statistic RA (β0) approximated to chi-square distribution with order O (n−2) for the independent sample when β0 is the true value. Here, we assert that such result is preserved for the stationary time series model as the following theorem:
Theorem 2.1. Assume the characteristic function of ψ satisfies
Also E‖ψ‖18 < ∞ and var(ψ) are positive definites. If β0 is the true value, then
Consequently, the 1 − α confidence region for β based on AEL is constructed as
whose coverage error is O (n−2).
Remark 1. The proof of Theorem 2.1 is similar to that of Theorem 1 in [22], hence is omitted. The two positive adjustment factors a1 and a2 are also obtained following the way of [22]. That is, a1 and a2 originate from the Bartlett correction factor. It is the intrinsic relationship between the new AEL and the Bartlett-corrected EL that makes the precision of approximation to enhance obviously. In practice, a1 and a2 are replaced by their moment estimators, which do not affect the order of chi-square approximation. For more details, refer to [22].
2.3 MEL of β
When the dimension of the parameter vector m ≥ 3, it is difficult to compute the Bartlett correction factor. To avoid the computation and to resolve the under-coverage problem, we derive the MEL method in this subsection. By greatly increasing the sample size, MEL is constructed on the pseudo sample set
Then, the MEL ratio for given β is defined as
By a simple Lagrange calculation, we have
and the Lagrange multiplier
Theorem 2.2. Under the assumptions of A1–A4 [4], if β0 is the true value,
Consequently, the MEL-based confidence region for β of level 1 − α is
In the next section, we will verify the accurate coverage probability of the confidence region under the finite sample by simulation study for different versions of EL.
3 Simulation
To investigate the finite-sample performance of our proposed AEL*(the notation of our proposed AEL in the following statements) and MEL, we carry out extensive Monte Carlo simulation studies of the ARMA (p,q) and ARFIMA (p,d,q) models in this section. To emphasize that our proposed adjustment level is better than the conventional adjustment level a = max{ log(N)/2, 1} of AEL of [15] and [16], we also studied the unadjusted EL and their AEL. Furthermore, we studied the confidence region graphically.
3.1. Simulation Setup
We consider several ARMA (p,q) and ARFIMA (p,d,q) processes with different sample sizes and Gaussian noise with zero mean. In each case, 5,000 replications are generated to compute the coverage probability. Nominal levels are set to be 1 − α = 0.90, 0.95, 0.99, respectively. It is notable that although the series length is T, the sample size we use is only N = [(T − 1)/2]. In the simulations, we use the consistent estimators
where αrs⋯t = E (YrYs … , Yt), Yt is the tth component of Y, Y = Pτψ0, ψ0 = ψ(I(ω), β0), and P is the orthogonal matrix such that
3.2 Simulation Results
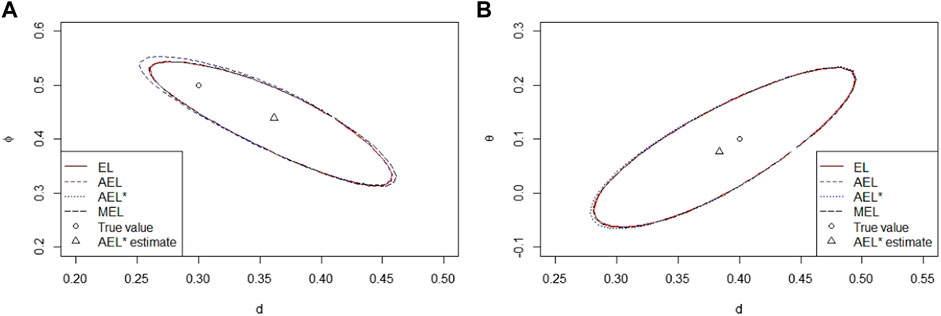
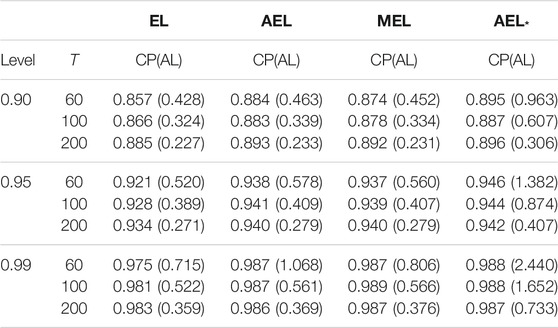
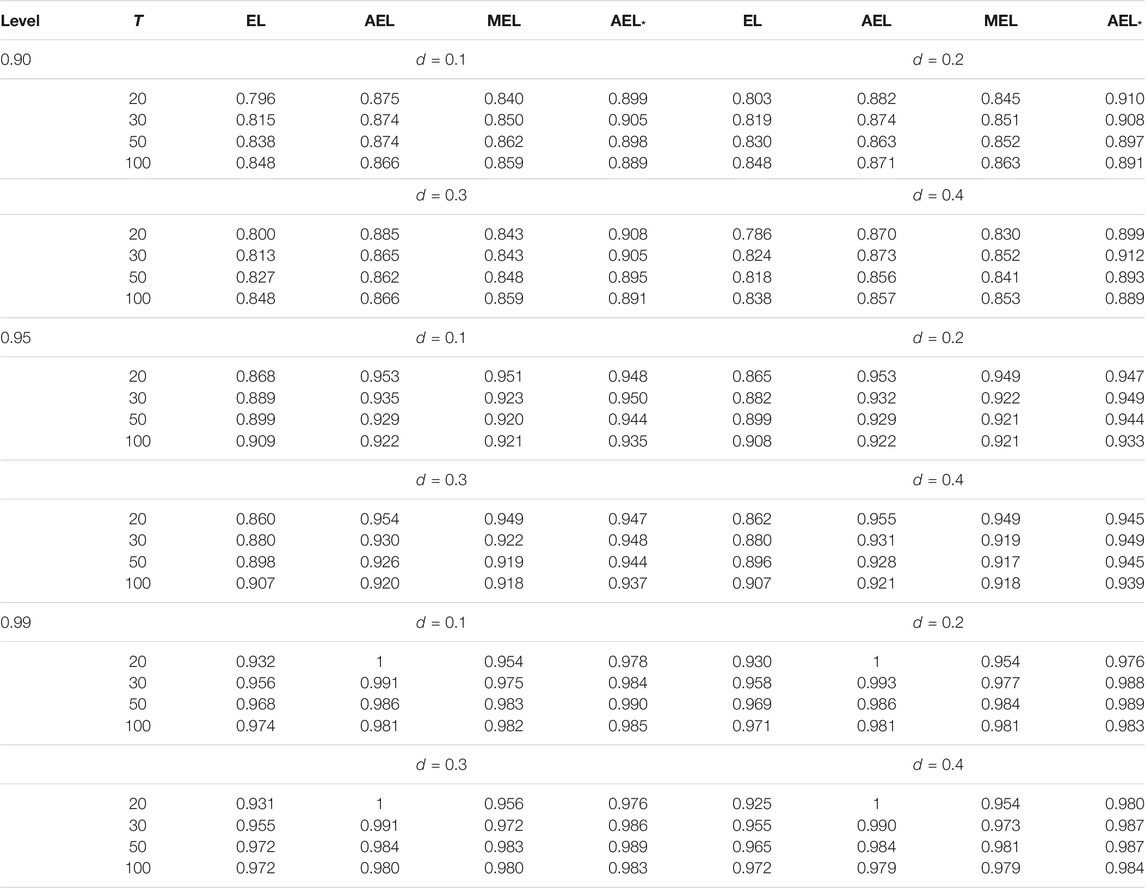
Tables 1–7 report the coverage probabilities of confidence regions based on four versions of EL. First, we find that our proposed AEL* performs better than other ELs in terms of the coverage probability for all cases and that the coverage probability of our proposed AEL* is the closest to the normal level. Second, when the sample size is very small, the coverage probability based on MEL is smaller than that based on AEL with the adjustment level a = max (log(N)/2, 1). But, when the sample size is moderate, the coverage probability is comparable to that based on AEL method, which is because the improvement only relies on the increasing sample size in essence. So, MEL enhances the coverage probability at some expense of computational efficiency. Third, the coverage probabilities based on AEL and AEL* are not always enhanced with the increasing sample size. Fourth, from Table 1, when the coverage probability increases, the corresponding average length of the confidence interval is getting large. Fifth, Table 3 indicates that the coverage probabilities become small when the parameter approximates the critical value tending to non-stationarity. The confidence regions in Figures 1, 2 are respectively depicted as the case with the series length 1,000 and 200. When the sample size is large, there is little difference in four kinds of the confidence region in Figure 1. In Figure 2, obviously, when the sample size is small, our proposed AEL*-based confidence region is the smallest among the four counterparts, and the MEL-based confidence contour contains others. It indicates that our proposed AEL* has not only high-coverage probabilities but also small confidence regions, and MEL has high-coverage probabilities and relative large confidence regions. The shape of the confidence region matches with the data-driven property of the EL method. That is, the shapes of confidence regions are completely determined by the data.

FIGURE 1. 95% confidence regions with a sample size 1,000. (A) Confidence regions of (d,Φ)=(0.3,0.5) in ARFIMA(1,d,0); (B) Confidence regions of (d,θ)=(0.4,0.1) in ARFIMA(0,d,1).

FIGURE 2. 95% confidence regions with a sample size 200. (A) Confidence regions of (θ1,θ2)=(0.5,0.2) in MA(2); (B) Confidence regions of (Φ1,Φ2)=(0.2,0.6) in AR(2).
4 Real Examples
In this section, we illustrate and compare the validity of our proposed EL methods described in previous sections by analyzing some real examples.
4.1 Annual U.S. Unemployment Rate
First, we take annual U.S. unemployment rate series as an example to investigate the confidence region of our proposed EL methods. The data are collected from 1948 to 2019 and available from https://forecast-chart.com/forecast-unemployment-rate.html. The trajectory of these data is displayed in Figure 3A. We consider it as a realization of a stationary process. By the sample autocovariance function (ACF) and partial autocovariance function (PACF) analysis, we fit the unemployment rate by an AR (2) model. The 95% confidence regions based on our proposed AEL* and MEL are displayed in Figure 3B. The shapes coincide with EL’s data-driven property, and the size indicates our proposed methods are much better than the previous EL and AEL methods.

FIGURE 3. (A) Trajectory of the annual U.S. unemployment rate from 1948 to 2019; (B) plot of 95% confidence regions for parameters (ϕ1, ϕ2) based on EL, AEL, AEL*, and MEL methods; the corresponding AEL* point estimate is denoted as △.
4.2 S&P 500 VIX
S&P 500 VIX is a forward-looking index. If it is extended to the price observations of the broader market level index, the investor will get a peek into volatility of the larger market. So, it is meaningful to fit a proper model. Here, we collect the data from April 25, 2019 to November 21, 2019. The trajectory is displayed in Figure 4A. We fit the data by an ARFIMA (1,d, 0) model with maximum likelihood point estimates

FIGURE 4. (A) Trajectory of VIX series from April 25, 2019 to November 21, 2019; (B) plot of 95% confidence regions for parameters (ϕ, d) in ARFIMA (1,d, 0) based on EL, AEL, AEL*, and MEL methods; corresponding maximum likelihood and EL point estimates are denoted as ◦ and △, respectively.
4.3 Shanghai Securities Composite Index
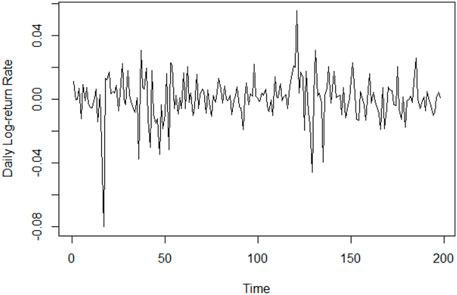
Finally, we analyze the daily log-return rate of Shanghai Securities Composite Index. The data range from June 4, 2020 to March 26, 2021. Figure 5A displays the realization of the index. We fit it as an ARFIMA (0,d, 0) model. The maximum likelihood and the EL estimate are

TABLE 8. Point estimates and the length of 95% confidence interval of the Shanghai Securities Composite Index by fitting it as an ARFIMA (0,d,0) model.
5 Conclusion
In this article, we introduce two new versions of EL to construct confidence regions for parameters in stationary short- and long-memory time series. Our proposed AEL* and MEL do enhance the approximation precision of chi-square limiting distribution, which determines the good performance of corresponding confidence regions. Simulations show that our proposed AEL* has the better coverage probability than that of the previous AEL and MEL.
Data Availability Statement
The original contributions presented in the study are included in the article/Supplementary Material, further inquiries can be directed to the corresponding author.
Author Contributions
ZL and XZ are responsible for the theoretical part. RZ is responsible for the simulation and application. ZLu and RZ are responsible for writing.
Conflict of Interest
The authors declare that the research was conducted in the absence of any commercial or financial relationships that could be construed as a potential conflict of interest.
Publisher’s Note
All claims expressed in this article are solely those of the authors and do not necessarily represent those of their affiliated organizations, or those of the publisher, the editors, and the reviewers. Any product that may be evaluated in this article, or claim that may be made by its manufacturer, is not guaranteed or endorsed by the publisher.
References
1. Owen AB Empirical Likelihood Ratio Confidence Intervals for a Single Functional. Biometrika (1988) 75:237–49. doi:10.1093/biomet/75.2.237
2. Owen AB Empirical Likelihood Ratio Confidence Regions. Ann Stat (1990) 18:90–120. doi:10.1214/aos/1176347494
3. Monti A Empirical Likelihood Confidence Regions in Time Series Models. Biometrika (1997) 84:395–405. doi:10.1093/biomet/84.2.395
4. Nordman DJ, Lahiri SN A Frequency Domain Empirical Likelihood for Short- and Long-Range Dependence. Ann Stat (2006) 34:3019–50. doi:10.1214/009053606000000902
5. Yau CY Empirical Likelihood in Long-Memory Time Series Models. J Time Ser Anal (2012) 33:269–75. doi:10.1111/j.1467-9892.2011.00756.x
6. DiCiccio TJ, Hall P, Romano JP Empirical Likelihood Is Bartlett Correctable. Ann Stat (1991) 19:1053–61. doi:10.1214/aos/1176348137
7. Chen J, Variyath AM, Abraham B Adjusted Empirical Likelihood and its Properties. J Comput Graphical Stat (2008) 17:426–43. doi:10.1198/106186008x321068
8. Emerson SC, Owen AB Calibration of the Empirical Likelihood Method for a Vector Mean. Electron J Stat (2009) 3:1161–92. doi:10.1214/09-ejs518
9. Chan NH, Liu L Bartlett Correctability of Empirical Likelihood for Time Series. Jjss (2010) 40:221–38. doi:10.14490/jjss.40.221
10. Li X, Chen JH, Wu YH, Tu DS Constructing Nonparametric Likelihood Confidence Regions with High Order Precisions. Stat Sinica (2011) 21:1767–83. doi:10.5705/ss.2009.117
11. Cheng C, Liu Y, Liu Z, Zhou W Balanced Augmented Jackknife Empirical Likelihood for Two Sample U-Statistics. Sci China Math (2018) 61(6):1129–38. doi:10.1007/s11425-016-9071-y
12. Dahlhaus R, Wefelmeyer W Asymptotically Optimal Estimation in Misspecified Time Series Models. Ann Stat (1996) 24:952–74. doi:10.1214/aos/1032526951
13. Jiang F, Wang L Adjusted Blockwise Empirical Likelihood for Long Memory Time Series Models. Stat Methods Appl (2018) 27:319–32. doi:10.1007/s10260-017-0403-1
14. Liang W, Dai H, He S Mean Empirical Likelihood. Comput Stat Data Anal (2019) 138:155–69. doi:10.1016/j.csda.2019.04.007
15. Piyadi Gamage RD, Ning W, Gupta AK Adjusted Empirical Likelihood for Long-Memory Time-Series Models. J Stat Theor Pract (2017) 11:220–33. doi:10.1080/15598608.2016.1271373
16. Piyadi Gamage RD, Ning W, Gupta AK Adjusted Empirical Likelihood for Time Series Models. Sankhya B (2017) 79:336–60. doi:10.1007/s13571-017-0137-y
17. Granger CWJ, Joyeux R An Introduction to Long-Memory Time Series Models and Fractional Differencing. J Time Ser Anal (1980) 1:15–29. doi:10.1111/j.1467-9892.1980.tb00297.x
18. Li M Multi-fractional Generalized Cauchy Process and its Application to Teletraffic. Physica A: Stat Mech its Appl (2020) 550:123982. doi:10.1016/j.physa.2019.123982
19. Li M Generalized Fractional Gaussian Noise and its Application to Traffic Modeling. Physica A (2021) 579:1236137. doi:10.1016/j.physa.2021.126138
20. Li M Modified Multifractional Gaussian Noise and its Application. Phys Scr (2021) 96:125002. doi:10.1088/1402-4896/ac1cf6
21. Whittle P Estimation and Information in Stationary Time Series. Ark. Mat.r Matematik (1953) 2:423–34. doi:10.1007/bf02590998
22. Liu YK, Chen JH Adjusted Empirical Likelihood with High-Order Precision. Ann Stat (2010) 38(3):1341–62. doi:10.1214/09-aos750
Appendix
Proof of Theorem 2.2. For simplicity, denote gk≔gk (I (ωk), β),
The Taylor expansion of equation (5) is
then
Combining Equations (4.4) and (4.5) of Monti (1997) with the proof of Theorem 1 of Yau (2012), we have
Keywords: confidence region, adjusted empirical likelihood, mean empirical likelihood, stationary time series, long memory
Citation: Zhang X, Zhang R and Lu Z (2022) Confidence Regions for Parameters in Stationary Time Series Models With Gaussian Noise. Front. Phys. 9:801692. doi: 10.3389/fphy.2021.801692
Received: 25 October 2021; Accepted: 17 November 2021;
Published: 07 January 2022.
Edited by:
Ming Li, Zhejiang University, ChinaCopyright © 2022 Zhang, Zhang and Lu. This is an open-access article distributed under the terms of the Creative Commons Attribution License (CC BY). The use, distribution or reproduction in other forums is permitted, provided the original author(s) and the copyright owner(s) are credited and that the original publication in this journal is cited, in accordance with accepted academic practice. No use, distribution or reproduction is permitted which does not comply with these terms.
*Correspondence: Zhiping Lu, enBsdUBzZnMuZWNudS5lZHUuY24=
 Xiuzhen Zhang
 Riquan Zhang1
 Zhiping Lu


