- 1Tianjin Central Hospital of Gynecology Obstetrics, Tianjin, China
- 2Division of Epidemiology and Biostatistics, School of Public Health, The University of Hong Kong, Hong Kong, China
Human papillomavirus (HPV) is considered as one of the major causes of multiple cancers, including cervical, anal, and vaginal cancers. Some studies analyzed the infection patterns of cancers caused by HPV using individual clinical test data, which is resource and time expensive. In order to facilitate the understanding of cancers caused by HPV, we propose to use data analytics methods to reveal the influencing factors from the population-level statistics data, which is available more easily. Particularly, we demonstrate the effectiveness of data analytics approach by introducing a predictive analytics method in studying the risk factors of cervix cancer in the United States. Besides accurate prediction of the number of infections, the predictive analytics method discovers the population statistic factors that most affect the cervical cancer infection pattern. Furthermore, we discuss the potential directions in developing more advanced data analytics approaches in studying cancers caused by HPV.
Introduction
Human papillomavirus (HPV) is believed to cause more than 90% of anal and cervical cancers, about 70% of vaginal and vulvar cancers, and 60% of penile cancers [1, 12]. Recent studies show that HPV should be responsible for about 60–70% of cancers of the oropharynx, which traditionally have been caused by tobacco and alcohol [2]. Sexual behavior is considered as a major risk of HPV infection [13]. However, the relation between the prevalence of HPV-related cancer and the population-level demographical and economic factors remains unclear. Some studies have revealed that the rate of people getting HPV-associated cancers varies by race and ethnicity [3]. They showed that black and Hispanic women had higher rates of HPV-associated cervical cancer than women of other races and non-Hispanic women, which is of great value for further investigation into the causing mechanism of HPV-related cancers.
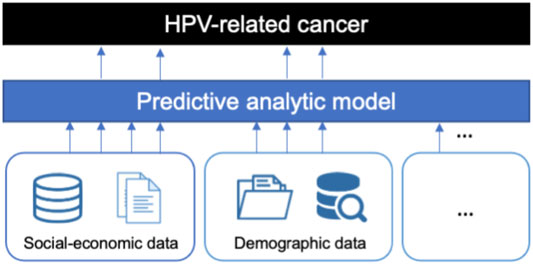
The previous studies rely on clinical test and evaluation, which is resource and time expensive. Though the predictive models have been used in the clinical HPV status prediction using biomarkers [14, 15], there are few studies on predicting population-level HPV-related cancer incidence. In order to facilitate the understanding of cancers caused by HPV, we propose a data analytics approach to discover influencing factors efficiently from heterogeneous data resources, such as demographical and social-economic statistic data. Since over 90% of the cervical cancers are caused by the HPV, we study the case of discovering the influencing factors of cervical cancers by analyzing the infection pattern in different states in the US. We demonstrate our proposed approach in Figure 1. With the predictive model, we can further predict the number of underlying HPV-related cancers, which facilitates HPV screening and vaccination by proactively deploying resources [17, 18].

FIGURE 1. The proposed framework. Predictive analytics model incorporates the indicators from heterogeneous data sources as features and then filters the most important indicators to explain the pattern of HPV-related cancer infection.
Materials and Methods
We use cervix cancer in 2018 (https://gis.cdc.gov/Cancer/USCS/#/AtAGlance/) as the target variable to analyze. We consider two types of factors: age and economic status. Specifically, we collect the population size of six age groups (children 0–18 years, adults 19–25 years, adults 26–34 years, adults 35–54 years, adults 55–64 years, adults over 65 years) and the gross domestic product (GDP) per capita income of the previous 8 years (from year 2011 to year 2018). We use these data at different states of the US as the features input into the analytics model.
We first assess the correlation between influencing factors and the target variable via a linear analytics model. We first normalize the features into [0, 1] for better analyzing the influences of these data. The formulation of the linear analytics model is:
where
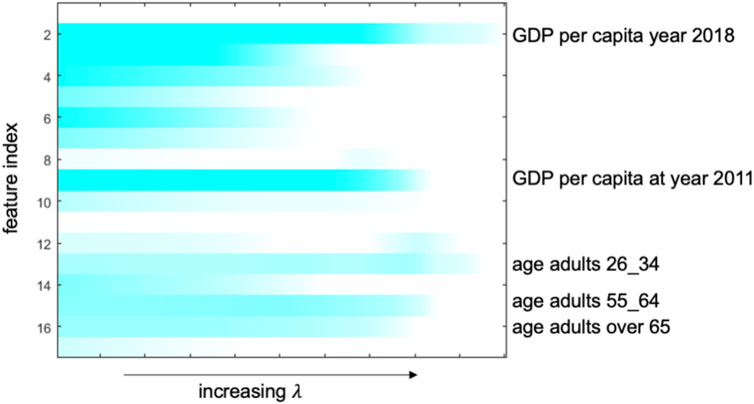
Then to determine the most influencing factors, we learn a sparse linear model via Lasso method [4]. The objective of the model learning can be written as:
where
Results
The top five important influencing factors identified by the model are GDP per capita year 2018, GDP per capita at year 2011, age adults 26–34 years, age adults 55–64 years, and age over 65 years
Finally, we examine the nonlinear correlation between the factors and the target variable via the predictivity, as discussed in [16]. We compare two models with the same input features: one linear model and a nonlinear neural network [5] with one hidden layer of size 16. We evaluate the predictive performance with leave-one-out strategy, i.e., train the model with all samples except one and then test the predictive performance on the one left. We use the mean absolute percentage error (MAPE) as the metrics of performance evaluation considering the variance of different target:
The MAPE of linear model is 0.3504, and the MAPE of neural network model is 0.3087. As the lower MAPE the better the performance, the predictive performance of neural network is much better than that of the linear model. The results show that there is nonlinear correlation among the risk factors and the incidence.
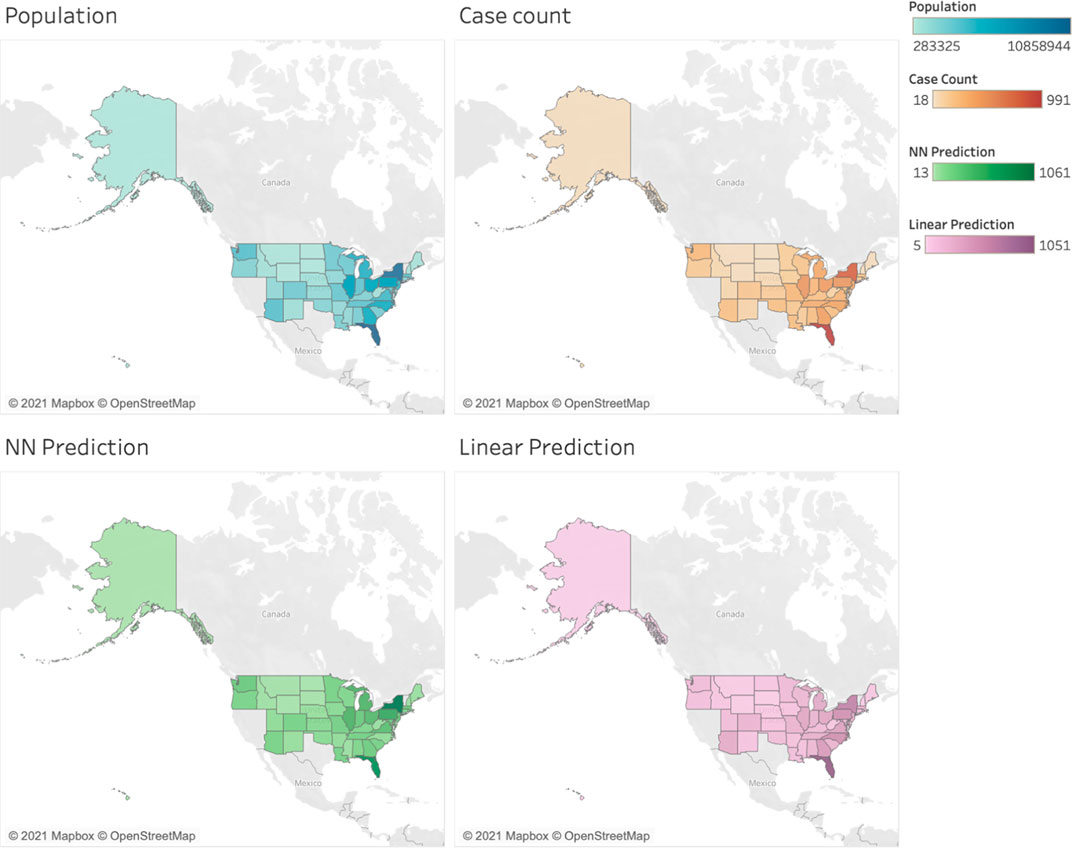
Figure 3 displays the predictive results of both models. We can see that the predictive models are able to capture the infection pattern of cervix cancers, and comparatively the neural network model produces more accurate predictions, e.g., that in New York state.

FIGURE 3. Visualization of the predictive results. The first row shows the population and case count distribution in the US, and the second row shows the predictions of neural network (NN) model and linear model.
Conclusion
In this perspective, we proposed a data analytics approach to mining the influencing factors of HPV-related cancer from population-level statistics data. We also demonstrated the effectiveness of this approach in the case of analyzing the cervical cancers in the United States. We further examined the existence of nonlinear correlation via showing the superior predictivity of nonlinear model compared with the linear model. Further studies can incorporate more risk factors, such as low socioeconomic status and smoking habit [13].
Based on the current studies, further effort should be paid to analyze the complex nonlinear correlation between the influencing factors and the HPV-related incidence. For example, the advanced nonlinear models [7] and feature selection methods can be applied in the risk factor analysis. The recurrent neural network can combine the time-aggregated effect from time series data, and the attention-based model is able to directly extract the important features based on the current context. These methods can model the nonlinear correlations between the risk factors and the disease outcome. The advances in the study of model interpretability allow us to extract the key factors from the learned nonlinear models.
Moreover, causal inference methods can be incorporated to identify the causing factors reliably. There are many complex cofounding associations under the disease progression which hinder the key causing risk factors. To overcome these challenges, causal inference methods, e.g., marginal structural networks [6], can be applied to adjust the bias from the cofounding factors. A practical way to distinguish the proper factors with the nonlinear models is to identify the important features in terms of predictivity [8]. For nonlinear models, such as neural network methods, Shapley value [11] and gradient-based methods [9, 10] are commonly used for identifying the feature importance.
Data Availability Statement
Publicly available datasets were analyzed in this study. These data can be found here: https://gis.cdc.gov/Cancer/USCS/#/AtAGlance/
Author Contributions
XD and QT designed the method and experiments. XD collected the dataset and conducted the experiment. XD and QT analyzed the results and wrote the paper.
Conflict of Interest
The authors declare that the research was conducted in the absence of any commercial or financial relationships that could be construed as a potential conflict of interest.
Publisher’s Note
All claims expressed in this article are solely those of the authors and do not necessarily represent those of their affiliated organizations or those of the publisher, the editors, and the reviewers. Any product that may be evaluated in this article, or claim that may be made by its manufacturer, is not guaranteed or endorsed by the publisher.
References
1. Saraiya M, Unger ER, Thompson TD, Lynch CF, Hernandez BY, Lyu CW, et al. HPV Typing of Cancers Workgroup. US Assessment of HPV Types in Cancers: Implications for Current and 9-valent HPV Vaccines. J Natl Cancer Inst (2015) 107(6):djv086. doi:10.1093/jnci/djv086
2. Chaturvedi AK, Engels EA, Pfeiffer RM, Hernandez BY, Xiao W, Kim E, et al. Human Papillomavirus and Rising Oropharyngeal Cancer Incidence in the United States. Jco (2011) 29(32):4294–301. doi:10.1200/jco.2011.36.4596
3. Viens LJ, Henley SJ, Watson M, Markowitz LE, Thomas CC, Thompson TD, et al. Human Papillomavirus-Associated Cancers - United States, 2008-2012. MMWR Morb Mortal Wkly Rep (2016) 65(26):661–6. doi:10.15585/mmwr.mm6526a1
4. Tibshirani R. Regression Shrinkage and Selection via the Lasso. J R Stat Soc Ser B (1996) 58(No. 1):267–88. doi:10.1111/j.2517-6161.1996.tb02080.x
6. Lim B, Alaa A. Forecasting Treatment Responses over Time Using Recurrent Marginal Structural Networks. In: Proceedings of the 32nd Conference on Neural Information Processing Systems; December 2018; Montreal, Canada.
7. Gao C, Liu J. Network-based Modeling for Characterizing Human Collective Behaviors during Extreme Events. IEEE Trans Syst Man, Cybernetics: Syst (2017) 47(1):171–83. doi:10.1109/TSMC.2016.2608658
8. Ding M, Chen Y, Bressler SL. Granger Causality: Basic Theory and Application to Neuroscience. In: S Schelter, N Winterhalder, and J Timmer, editors. Handbook of Time Series Analysis. Wienheim: Wiley (2006).
9. Shrikumar A, Greenside P, Shcherbina A, Kundaje A. Not Just a Black Box: Learning Important Features through Propagating Activation differences[J]. arXiv preprint arXiv:1605.01713 (2016).
10. Sundararajan M, Taly A, Yan Q. Axiomatic Attribution for Deep Networks. In: Proceedings of the International Conference on Machine Learning. PMLR; August 2017; Sydney, Australia.
11. Janzing D, Minorics L, Blöbaum P. Feature Relevance Quantification in Explainable AI: A Causal Problem. In: Proceedings of the International Conference on Artificial Intelligence and Statistics. PMLR; August 2020; Palermo, Sicily, Italy.
12. Lowy DR, Schiller JT. Reducing HPV-Associated Cancer Globally. Cancer Prev Res (2012) 5(1):18–23. doi:10.1158/1940-6207.capr-11-0542
13. Rai B, Bansal A, Singh M. Human Papillomavirus-Associated Cancers: A Growing Global Problem. Int J App Basic Med Res (2016) 6(2):84–9. doi:10.4103/2229-516X.179027
14. Qian G, Hu Z, Xu H, Müller S, Wang D, Zhang H, et al. A Novel Prediction Model for Human Papillomavirus-Associated Oropharyngeal Squamous Cell Carcinoma Using P16 and Subcellular β-catenin Expression. J Oral Pathol Med (2016) 45(6):399–408. doi:10.1111/jop.12378
15. Lang DM, Peeken JC, Combs SE, Wilkens JJ, Bartzsch S. Deep Learning Based HPV Status Prediction for Oropharyngeal Cancer Patients. Cancers (2021) 13:786. doi:10.3390/cancers13040786
16. Gao C, Liu J. Uncovering Spatiotemporal Characteristics of Human Online Behaviors during Extreme Events. PLOS ONE (2015) 10(10):e0138673. doi:10.1371/journal.pone.0138673
17. Du Z, Nugent C, Galvani AP, Krug RM, Meyers LA. Modeling Mitigation of Influenza Epidemics by Baloxavir. Nat Commun (2020) 11:2750. doi:10.1038/s41467-020-16585-y
Keywords: data analytics approach, HPV-related cancer, population-level statistics data, regression model, HPV—human papillomavirus
Citation: Du X and Tan Q (2021) A Data Analytics Approach for Revealing Influencing Factors of HPV-Related Cancers From Population-Level Statistics Data. Front. Phys. 9:789938. doi: 10.3389/fphy.2021.789938
Received: 05 October 2021; Accepted: 01 November 2021;
Published: 02 December 2021.
Edited by:
Chao Gao, Southwest University, ChinaReviewed by:
Chijun Zhang, Jilin University of Finance and Economics, ChinaDong Li, Shandong University, China
Copyright © 2021 Du and Tan. This is an open-access article distributed under the terms of the Creative Commons Attribution License (CC BY). The use, distribution or reproduction in other forums is permitted, provided the original author(s) and the copyright owner(s) are credited and that the original publication in this journal is cited, in accordance with accepted academic practice. No use, distribution or reproduction is permitted which does not comply with these terms.
*Correspondence: Qi Tan, dGFucWkuZ0BnbWFpbC5jb20=
 Xiaoqin Du
 Qi Tan