- 1University of Science and Technology of China, Hefei, China
- 2Jiangsu Key Laboratory of Medical Optics, CAS Center for Excellence in Molecular Cell Science, Suzhou Institute of Biomedical Engineering and Technology, Chinese Academy of Sciences, Suzhou, China
Structured illumination microscope (SIM) can double the spatial resolution by using fringed pattern illumination. However, for samples with large intra-scene dynamic ranges, such as clustered objects, SIM fails to reconstruct high-quality images and often exhibits strong artifacts. Herein, we present a high dynamic range SIM (HDR-SIM) method using a multi-exposure acquisition strategy. With HDR-SIM, individual and clustered microspheres and vesicles with 420 times intensity differences can be visualized in the same scene while the delicate structures of the sample were preserved effectively.
Introduction
SIM is a super-resolution fluorescence imaging method that can provide adequate structure information two times beyond the Diffraction-Limit [1]. Compared with other super-resolution methods [2], SIM stands out for low-photon bleaching and compatibility for most fluorescence labeling protocols. SIM’s wide-field nature makes it fit for live-cell imaging at high speed. As a result, SIM is now widely applied in studying subcellular structures [3, 4], organelle interactions [5], endocytic dynamics [6]. However, the limited dynamic range has prevented SIM from being used for biological samples like clustered vesicles or actin filaments.
In addition to imaging resolution and speed, the dynamic range is another essential factor to be concerned with when selecting imaging modalities for particular applications. An imaging system’s dynamic range determines the darkest and brightest signals that it can detect [7]. When the dynamic range of an imaging system cannot cover the intra-scene dynamic range (IDR) of samples, a trade-off must be made between the loss of weak signal and intense signal saturation. It becomes even more challenging for SIM imaging. The large IDR can lead to spatial variations in the optimal values of SIM reconstruction parameters and eventually apparent artifacts. Notably, the side-lobe artifacts of structures with strong signals might overwhelm the delicate structures with weak signals. Several attempts were proposed to eliminate the artifacts in SIM, such as Wiener filtering [8], Least-Squares solver [9], Richardson-Lucy deconvolution [10], and Hessian deconvolution [11]. But they are not sufficient for samples with large IDR. Another approach to solve the problem is to divide the whole image into several subregions and apply different reconstruction parameters for each one, as in Tiled-SIM [12]. But it is hard to tile into suitable subregions when the strong signals and weak signals are mixed irregularly. As a result, SIM is considered to be not suitable for imaging samples with large IDR.
Several approaches were developed in the photography field for high dynamic range (HDR) imaging [13]. A commonly used method is the multiple exposure technique [14]. A set of low dynamic range (LDR) images is taken with progressively increased exposure and then mathematically fused into an HDR image. The multi-exposure method was recently introduced into confocal laser scanning microscopy and two-photon microscopy [15, 16]. Another useful approach is adaptive illumination that uses a spatial light modulator to spatially control the light intensity distribution so that all points can be exposed reasonably [17, 18]. Yang et al. reported an approach to extend the dynamic of multiphoton microscopy based on a non-uniform illumination pattern by real-time negative feedback to modulate the illumination [19]. But by now, there is no prior report about extending SIM’s dynamic range to our knowledge.
In this study, we introduce an HDR-SIM method based on the multi-exposure strategy. The 8-bit spatial light modulator (SLM) grating patterns are used to illuminate the sample with different intensity and fringe patterns. Sets of LDR-SIM raw images are recorded and fused into a set of HDR raw images using a pixel-wise weighting algorithm. Finally, the HDR-SIM image is achieved by using a Wiener-filter-based reconstruction algorithm. With the proposed approach, single and clustered fluorescent beads with 420 times intensity differences can be distinguished. HDR–SIM was also used to study vesicles in live osteosarcoma cells, in which the individual dim vesicles and inter-structures of bright vesicle clusters can be visualized simultaneously.
Principle of HDR-SIM
In SIM imaging, the measured intensity
where
where I0 is the average illumination intensity,
In which, the coefficient matrix
where α, β are the minimum and maximum brightness values in all images
Since
Now we consider
where
Experimental Setup and Sample Preparation
HDR-SIM Setup
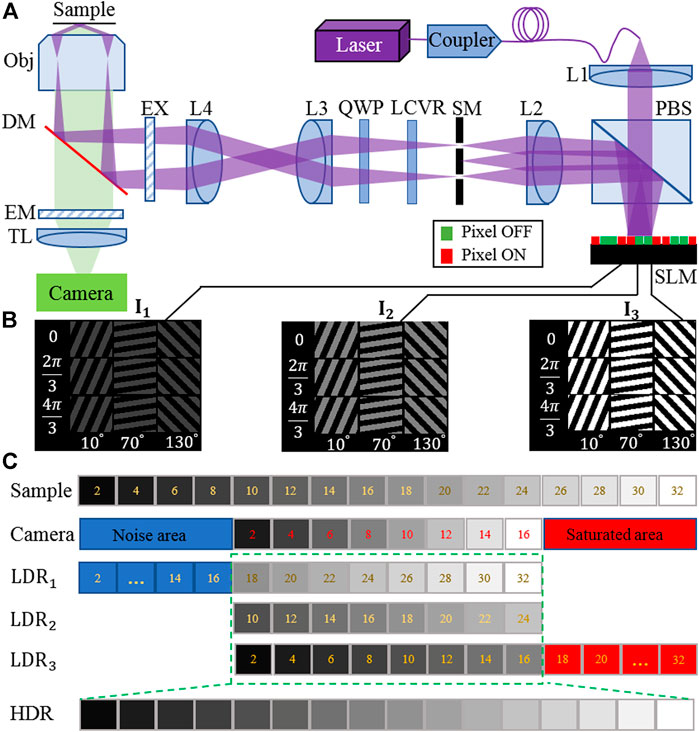
As is shown in Figure 1A, the excitation laser beam, coupled into a single-mode polarization-maintaining optical fiber, illuminates a ferroelectric SLM with 1,280 × 1,024 pixels (SXGA-3DM, Fourth Dimension Displays). Grating patterns are stored onboard and are then activated with defined timings. The grating diffracts the incoming laser beam into different diffraction orders. Only the ±1 diffraction components are allowed to pass through a spatial filter placed at the Fourier plane of lens L2, and finally form interference light fields at the sample plane. A liquid crystal variable retarders (LCVR-200-VIS, Meadowlark) and a quarter-wave plate are used to ensure that the incoming beams’ polarizations are maintained s-polarized at the sample plane. Fluorescence emitted from the sample is collected by a 100×NA1.49 oil objective (UAPON, Olympus Life Science, Japan). Images are captured using a scientific complementary metal-oxide-semiconductor camera (ORCA-Flash4.0 V2, Hamamatsu).

FIGURE 1. (A) Layout of the high dynamic range structured illumination microscopy (HDR-SIM) setup. PBS, polarization beam splitter; L1–L4, lenses; SM, spatial mask; LCVR, liquid crystal variable retarders; QWP, quarter-wave plate; EX, excitation filter; DM, dichroic mirror; EM, emission filter; TL, tube lens; SLM, spatial light modulator. (B) Three sets of illumination patterns with different orientation angles, phase, and intensity were loaded on the SLM, corresponding to 0.25, 0.5, and 1 time the maximum incident light intensity. (C) Principle of the fusing process of raw images into HDR raw data. With the camera’s limited dynamic range, only a portion of the sample information can be used effectively for each illumination set (green rectangle).
We use a constant camera exposure time for each image acquisition while manipulating equivalent illumination intensity to record sets of LDR-SIM raw images with multi-exposure. Typically three sets of excitation intensities are used, corresponding to under-, middle-, and over-exposure, respectively, as shown in Figure 1B. The manipulation of equivalent illumination intensity is realized by operating the SLM on grayscale mode. Figure 1C shows the limitation of LDR imaging and the fusing process into an HDR image.
Sample Preparation
Carboxylate-modified beads (yellow-green-fluorescent 505/515, diameter 100 nm) are purchased from Thermo Fisher Scientific (F8803). The solution of yellow-green beads was diluted 50 times and was dispensed onto a coverslip. The coverslip was left in the air and dried in ambient conditions. As a result, some beads aggregated together with very high fluorescence intensity while some beads were separated as an individual bead with low fluorescence intensity.
For cell imaging, the U2OS osteosarcoma cell line was purchased from the Stem Cell Bank at the Chinese Academy of Sciences. The U2OS cells were cultured in McCoy’s 5A (modified) medium (Thermo Fisher), supplemented with 1% penicillin G, streptomycin (Sangon), and 10% fetal bovine serum (Thermo Fisher) at 37°C in a 5% (v/v) CO2 environment. Cells were transfected using Lipofectamine 2000 (Invitrogen), following the manufacturer’s protocol. The cell vesicle was labeled by the CD63-EGFP vector constructed by inserting the homo species CD63 gene into the pEGFP-n1 vector (Clonetech). Twelve hours after transfection, the cells were detached using trypsin-EDTA, seeded onto poly-l-lysine-coated 35 mm glass-bottom dishes (Cellvis), and cultured in an incubator at 37°C with 5% CO2 for an additional 24 h before the experiments.
Results and Discussion
Extending of the Dynamic Range by HDR-SIM
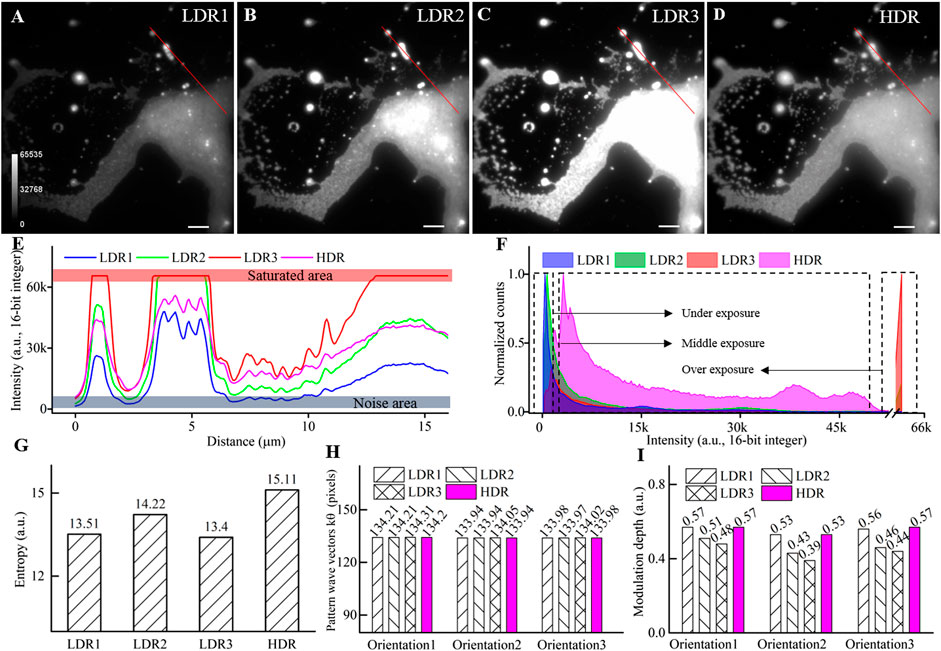
To validate HDR-SIM, we first created a large IDR sample with fluorescent beads. In the sample, some beads aggregated to form clusters that yielded intense fluorescence, while some individual beads scattered at other regions that showed weak fluorescence signals. The intensity ratio of the strong and weak signals can be estimated by

FIGURE 2. Performance of the HDR fusing to widen the dynamic range. (A–C) LDR images of clustered fluorescent beads acquired with different excitation intensities corresponding to under, middle, and overexposure. (D) HDR image by fusing the above three LDR images. (E) Intensity profiles along the red lines in (A–D). (F) The normalized histogram. (G) The entropy of the LDR and the HDR image. (H) Period of illumination pattern wave vector (k) at three orientations. (I) The modulation depth of illumination pattern at three orientations. Scale bar: 3 μm for (A–D).
The histograms of the LDR images and the combined HDR image are plotted in Figure 2F. For LDR images, the histogram’s primary domain is either at the low-intensity range or the saturated range. The broad middle part of the histogram makes minor contributions to the image details. In comparison, the combined HDR image shows significantly improved uniformity on the histogram. To quantitative compare the contained information, we further calculated the entropy of each image [22], which is defined as
where
We further compared the estimated fringe pattern parameters from LDR raw data and fused HDR data using the cross-correlation method [23]. As is shown in Figures 2H,I, both the period of the illumination pattern
HDR-SIM Imaging of Individual and Clustered Fluorescent Beads
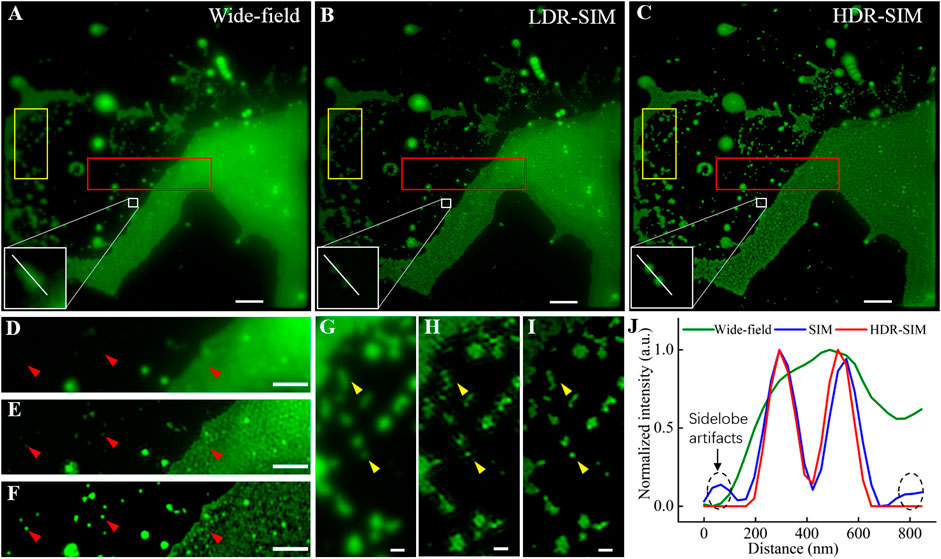
Figures 3A–C show the equivalent wide-field image, LDR-SIM image with middle excitation intensity, and HDR-SIM image, respectively. Compared with LDR-SIM, the HDR-SIM image has a higher contrast and more detailed information. Figures 3D–F show the corresponding zoomed-in image of a region with large intensity differences (red box). The fluorescent intensity of clustered beads on the right is far higher than that of the individual beads on the left. These two types of features are hard to be imaged appropriately at the same time. Figure 3D also suggested that there is a strong out-of-focus signal along with heavy background noise. By carefully adjusting the OTF attenuation parameters, the LDR-SIM image Figure 3E effectively mitigates the out-of-focus signal. It turns out to be much clearer than the wide-field image. However, in the clustered area, there are obvious artifacts most likely result from background noise. Similar scenes frequently appear when imaging actin or vesicles. In contrast, HDR-SIM image Figure 3F shows it is still possible to recognize useful structural information such as spots consisting of a small number of individual beads or lines consisting of beads huddled in one direction.

FIGURE 3. Comparative images of fluorescent beads, 100 nm in diameter, in wide-field, traditional SIM, and HDR-SIM. (A) Wide-field image. (B) SIM image reconstructed by fairSIM [21], corresponding to middle-exposure images (reconstruction parameters: strength 0.995, full-width-at-half-maximum (FWHM) of 3 cycles/μm, Wiener parameter = 0.2). (C) HDR-SIM image, the reconstruction parameters are the same as (B). (D–F) Zoom-in images corresponding to the region marked by the red boxes. (G–I) Zoom-in images corresponding to the region marked by the yellow boxes. (J) Intensity profiles along the white lines in (A–C). Scale bar: (A–C) 3 μm, (D–F) 1.5 μm, and (G–I) 0.5 μm. Gamma value: 0.5 for images in (A–C).
In traditional SIM imaging, several issues, such as low SNR, symmetry-broken of SIM-PSF, and imperfect reconstruction parameters, could induce artifacts in the reconstructed image. For samples with a large dynamic range, the estimated reconstruction parameters were mostly determined by the bright region, which may not be perfect for the dim regions. The proposed HDR-SIM can effectively mitigate the reconstruction artifacts for two reasons. First, the combined HDR image contains information from all exposures (Figure 2G), and the resulted SNR is higher than any single-shot image. Second, the fusion algorithm greatly enhances the uniformity of intensity distribution (Figure 2F), which makes estimated reconstruction parameters optimal for the entire field of view. Figures 3G–I show the zoomed-in images of another region with more scattered individual beads (yellow boxes). The arrows point to typical individual beads. LDR-SIM images show obvious artifacts, especially in the dim region shown in Figure 3H. By contrast, HDR-SIM enhanced the weak signals and suppressed the strong signals. Thus, even in the weak signal region of the reconstructed image, no obvious artifacts were observed, and the individual beads demonstrated clear round shapes, as shown in Figure 3I. Figure 3J presents the intensity profiles along the white line on the two adjacent beads in Figures 3A–C. It demonstrates that HDR-SIM has the same super-resolution capability and performs better in reducing side-lobe artifacts than LDR-SIM. We counted the full width at half maximum of 60 individual beads, and the estimated resolution for HDR-SIM is 102 ± 5 nm.
HDR-SIM Imaging of Vesicles in Live Osteosarcoma Cells
Vesicles serve as the carrier of matters and signals in live cells [24, 25], and they might exist as individual moieties or join together to form a large cluster, known as multivesicular bodies (MVBs) inside cells [26, 27]. The MVBs can contain small intraluminal vesicles that would be released into the extracellular space in response to different cell signals. To image the individual vesicles and MVBs at the same scene is always a challenging problem owing to the large IDR.
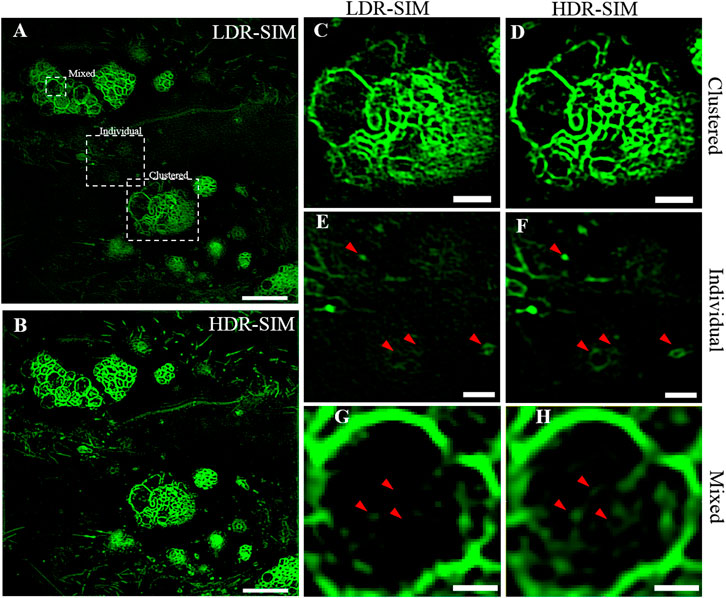
We applied HDR-SIM to image vesicles in live osteosarcoma cells. Figures 4A,B show the LDR-SIM image with moderate excitation intensity and the HDR-SIM image of the vesicles, respectively. In these images, MVBs show high brightness that dulls the fluorescence signals of individual ones. As shown in Figures 4C,D, the imaging quality of the LDR-SIM image and HDR-SIM image are similar for bright MVBs areas, and both exhibit high resolution and high contrast. In areas with weaker signals (Figures 4E,F), the HDR-SIM image maintains a high-SNR response. In contrast, the LDR-SIM image contains significant artifacts wherein the signals are almost submerged in noise. Importantly, we can now directly intraluminal vesicles inside MVBs, which are lost in LDR-SIM (Figure 4G), which can be visualized by HDR-SIM (Figure 4H). This will help a better understanding of the biochemical process and physiological function of MVBs.

FIGURE 4. Imaging of individual and clustered vesicles in live osteosarcoma cells. (A) The LDR-SIM imaging with middle excitation intensity. (B) HDR-SIM imaging of the same sample. (C,D) Zoomed-in view of a bright region showing clustered vesicles by LDR- and HDR-SIM. (E,F) Zoomed-in view of a dim region showing individual vesicles by LDR- and HDR-SIM. (G,H) Zoomed-in view of a large vesicle with an inner structure by LDR- and HDR-SIM. Color maps are scaled identically for each pair of images. Scale bar: (A,B) 5 μm, (C–E) 1.5 μm, and (F) 0.5 μm. Gamma value: 0.5 for images in (A,B).
Conclusion
In conclusion, we introduced an HDR-SIM imaging method for samples with a high dynamic range. It alleviates SIM reconstruction artifacts and enables visualization of detailed structures for both dim and bright regions at the same scene. The proposed method uses a set of grayscale periodic patterns loaded to SLM to achieve multiple excitation exposure. It can be easily implemented in any SLM-based SIM system without additional hardware costs. We believe that our HDR-SIM technique can be extensively adopted where dynamic range matters, such as studies with vesicles, mitochondria, neuron cell bodies, and their interactions in cell and molecular biology.
Data Availability Statement
The raw data supporting the conclusions of this article will be made available by the authors, without undue reservation.
Author Contributions
SL conceived the idea of this work. YL accomplished the experiment, performed the analysis of results, and wrote the manuscript. HL, JG, and XH gave the guide for analysis. ZL, JZ, and XJ prepared the biological samples. GW, LW, and CC did the simulation and analysis. All authors contributed to the discussion and manuscript revision.
Funding
National Key Research and Development Program of China (2017YFC0110100); Natural Scientific Research Foundation of China (NSFC) (61805272); Scientific Research Equipment Development Project of the Chinese Academy of Sciences (YJKYYQ20200074).
Conflict of Interest
The authors declare that the research was conducted in the absence of any commercial or financial relationships that could be construed as a potential conflict of interest.
References
1. Heintzmann R, Huser T. Super-resolution structured illumination microscopy. Chem Rev (2017) 117(23):13890–908. doi:10.1021/acs.chemrev.7b00218
2. Schermelleh L, Ferrand A, Huser T, Eggeling C, Sauer M, Biehlmaier O, et al. Super-resolution microscopy demystified. Nat Cell Biol (2019) 21(1):72–84. doi:10.1038/s41556-018-0251-8
3. Qian J, Lei M, Dan D, Yao B, Zhou X, Yang Y, et al. Full-color structured illumination optical sectioning microscopy. Sci Rep (2015) 5(1):14513. doi:10.1038/srep14513
4. Fiolka R, Shao L, Rego E, Davidson MW, Gustafsson MG. Time-lapse two-color 3D imaging of live cells with doubled resolution using structured illumination. Proc Natl Acad Sci USA (2012) 109(14):5311–5. doi:10.1073/pnas.1119262109
5. Guo Y, Li D, Zhang S, Yang Y, Liu JJ, Wang X, et al. Visualizing intracellular organelle and cytoskeletal interactions at nanoscale resolution on millisecond timescales. Cell (2018) 175(5):1430–42.e17. doi:10.1016/j.cell.2018.09.057
6. Li D, Shao L, Chen BC, Zhang X, Zhang M, Moses B, et al. ADVANCED IMAGING. Extended-resolution structured illumination imaging of endocytic and cytoskeletal dynamics. Science (2015) 349(6251):aab3500. doi:10.1126/science.aab3500
7. Adeyemi A, Barakat N, Darcie TE. Applications of digital micro-mirror devices to digital optical microscope dynamic range enhancement. Opt Express (2009) 17(3):1831–43. doi:10.1364/OE.17.001831
8. Christian K, Smedh M, Förster R, Deschout H, Fernandez-Rodriguez J, Heintzmann R. Successful optimization of reconstruction parameters in structured illumination microscopy – a practical guide. Opt Commun (2019) 436:69–75. doi:10.1016/j.optcom.2018.12.005
9. Luo J, Li C, Liu Q, Wu J, Li H, Kuang C, et al. Super-resolution structured illumination microscopy reconstruction using a least-squares solver. Front Phys (2020) 8:118. doi:10.3389/fphy.2020.00118
10. Perez V, Chang BJ, Stelzer EH. Optimal 2D-SIM reconstruction by two filtering steps with Richardson-Lucy deconvolution. Sci Rep (2016) 6(1):37149. doi:10.3389/fphy.2020.0011810.1038/srep37149
11. Huang X, Fan J, Li L, Liu H, Wu R, Wu Y, et al. Fast, long-term, super-resolution imaging with hessian structured illumination microscopy. Nat Biotechnol (2018) 36(5):451–9. doi:10.1038/nbt.4115
12. Hoffman David P, Betzig E. Tiled reconstruction improves structured illumination microscopy. bioRxiv (2020). doi:10.1101/895318
13. Feng W, Zhang F, Wang W, Xing W, Qu X. Digital micromirror device camera with per-pixel coded exposure for high dynamic range imaging. Appl Opt (2017) 56(13):3831–40. doi:10.1364/AO.56.003831
14. Debevec Paul E, Malik. J. Recovering high dynamic range radiance maps from photographs. In: Proceedings of the 24th ACM annual conference on computer graphics and interactive techniques. Proc. SIGGRAPH 1997:369–378 (Los Angeles, CA, USA). doi:10.1145/258734.258884
15. Vinegoni C, Leon Swisher C, Fumene Feruglio P, Giedt RJ, Rousso DL, Stapleton S, et al. Real-time high dynamic range laser scanning microscopy. Nat Commun (2016) 7(1):11077. doi:10.1038/ncomms11077
16. Vinegoni C, Feruglio PF, Weissleder R. High dynamic range fluorescence imaging. IEEE J Sel Top Quan Electron (2019) 25(1):6801507. doi:10.1109/JSTQE.2018.2881608
17. Krishnaswami V, Van Noorden CJF, Manders EMM, Hoebe RA. Spatially-controlled illumination microscopy: for prolonged live-cell and live-tissue imaging with extended dynamic range. Q Rev Biophys (2016) 49:e19. doi:10.1017/S0033583516000135
18. Chu Kengyeh K, Lim D, Jerome M. Enhanced weak-signal sensitivity in two-photon microscopy by adaptive illumination. Opt Lett (2017) 32(19):2846–8. doi:10.1364/OL.32.002846
19. Yang R, Weber TD, Witkowski ED, Davison IG, Mertz J. Neuronal imaging with ultrahigh dynamic range multiphoton microscopy. Sci Rep (2017) 7(1):5817. doi:10.1038/s41598-017-06065-7
20. Gustafsson MG, Shao L, Carlton PM, Wang CJ, Golubovskaya IN, Cande WZ, et al. Three-dimensional resolution doubling in wide-field fluorescence microscopy by structured illumination. Biophys J (2008) 94(12):4957–70. doi:10.1529/biophysj.107.120345
21. Marcel M, Mönkemöller V, Hennig S, Hübner W, Huser TR. Open-source image reconstruction of super-resolution structured illumination microscopy data in ImageJ. Nat Commun (2016) 7(1):10980. doi:10.1038/ncomms10980
22. Tsai DY, Lee Y, Matsuyama E. Information entropy measure for evaluation of image quality. J Digit Imaging (2008) 21(3):338–47. doi:10.1007/s10278-007-9044-5
23. Wicker K. Non-iterative determination of pattern phase in structured illumination microscopy using auto-correlations in fourier space. Opt Express (2013) 21(21):24692–701. doi:10.1364/OE.21.024692
24. Piper RC, Katzmann DJ. Biogenesis and function of multivesicular bodies. Annu Rev Cell Dev Biol (2007) 23(1):519–47. doi:10.1146/annurev.cellbio.23.090506.123319
25. Hessvik NP, Llorente A. Current knowledge on exosome biogenesis and release. Cell Mol Life Sci (2018) 75(2):193–208. doi:10.1007/s00018-017-2595-9
26. Bian S, Zhang L, Duan L, Wang X, Min Y, Yu H. Extracellular vesicles derived from human bone marrow mesenchymal Stem cells promote angiogenesis in a rat myocardial infarction model. J Mol Med (2014) 92(4):387–97. doi:10.1007/s00109-013-1110-5
Keywords: super-resolution, structured illumination microscopy, high dynamic range imaging, fusion algorithm, multiple exposures
Citation: Liang Y, Chen X, Sun Z, Wen G, Chen C, Wang L, Jin X, Zhang J, Yang G, Gao J, Li H and Li S (2021) High Dynamic Range Structured Illumination Microscope Based on Multiple Exposures. Front. Phys. 9:648174. doi: 10.3389/fphy.2021.648174
Received: 31 December 2020; Accepted: 01 February 2021;
Published: 10 March 2021.
Edited by:
Ming Lei, Xi’an Jiaotong University, ChinaReviewed by:
Zhaojun Wang, Xi’an Jiaotong University, ChinaFu Wang, Shanghai Jiao Tong University, China
Copyright © 2021 Liang, Chen, Sun, Wen, Chen, Wang, Jin, Zhang, Yang, Gao, Li and Li. This is an open-access article distributed under the terms of the Creative Commons Attribution License (CC BY). The use, distribution or reproduction in other forums is permitted, provided the original author(s) and the copyright owner(s) are credited and that the original publication in this journal is cited, in accordance with accepted academic practice. No use, distribution or reproduction is permitted which does not comply with these terms.
*Correspondence: Simin Li, bGlzbUBzaWJldC5hYy5jbg==
 Yong Liang
 Xiaohu Chen2
 Hui Li
 Simin Li