 Huimin Luo
 Hui Yang
 Ge Zhang
 Jianlin Wang
 Junwei Luo
 Chaokun Yan
- 1School of Computer and Information Engineering, Henan University, Kaifeng, China
- 2Henan Key Laboratory of Big Data Analysis and Processing, Henan University, Kaifeng, China
- 3College of Computer Science and Technology, Henan Polytechnic University, Jiaozuo, China
- 4Academy for Advanced Interdisciplinary Studies, Henan University, Zhengzhou, China
Computational drug repositioning, serving as an effective alternative to traditional drug discovery plays a key role in optimizing drug development. This approach can accelerate the development of new therapeutic options while reducing costs and mitigating risks. In this study, we propose a novel deep learning-based framework KGRDR containing multi-similarity integration and knowledge graph learning to predict potential drug-disease interactions. Specifically, a graph regularized approach is applied to integrate multiple drug and disease similarity information, which can effectively eliminate noise data and obtain integrated similarity features of drugs and diseases. Then, topological feature representations of drugs and diseases are learned from constructed biomedical knowledge graphs (KGs) which encompasses known drug-related and disease-related interactions. Next, the similarity features and topological features are fused by utilizing an attention-based feature fusion method. Finally, drug-disease associations are predicted using the graph convolutional network. Experimental results demonstrate that KGRDR achieves better performance when compared with the state-of-the-art drug-disease prediction methods. Moreover, case study results further validate the effectiveness of KGRDR in predicting novel drug-disease interactions.
1 Introduction
The traditional drug development (R&D) process is extremely expensive, lengthy, complex, and risky (Chong and Sullivan, 2007). According to a recent study (Chan et al., 2019), introducing a new drug to the market involves multiple steps, typically costs over 2 billion USD, and takes an average of 12 years. Effectively improving the success rate of R&D and reducing the expensive workload of the verification procedure has become an urgent challenge for researchers (Wang et al., 2023). Drug repositioning is an approach to finding new therapeutic potential for existing drugs that have already been approved by the Food and Drug Administration (FDA) for the treatment of diseases (Novac, 2013). This innovative strategy has many advantages, such as reducing drug risk, shortening clinical evaluation cycle, enhancing cost-effectiveness, and improving efficiency (Pushpakom et al., 2019; Luo et al., 2021). In recent years, drug repositioning has been widely applied in disease and related therapeutic areas, including anticancer drug discovery (Ye et al., 2014), identification of novel therapies for orphan and rare diseases (Setoain et al., 2015), overcoming of drug resistance (Younis et al., 2015) and advancement of personalized medicine (Li and Jones, 2012). These successful applications have shown that drug repositioning is increasingly becoming an attractive proposition (Lotfi Shahreza et al., 2018).
Many previous studies of computational drug repositioning mainly utlized drug and disease similarity information to predict potential drug-disease associations (Wang et al., 2019; Zhang et al., 2018; Luo et al., 2018). However, most of these methods typically used a single type of similarity information, which can lead to various data quality issues, such as missing information, sparse data and insufficient generalization ability. Based on various biomedical information, multiple drug similarities and disease similarities can be calculated (Huang et al., 2021). These similarities can be integrated to enhance the feature representation of drugs and diseases in multiple dimensions (Peng et al., 2021). In recent years, many methods have been proposed to integrate multiple similarity information to improve the performance of drug-disease interaction prediction. These integration methods primarily use two main schemes including linear-based and nonlinear-based strategies to handle multiple similarities.
The similarity integration methods based on the first strategy train the prediction model by jointly learning linear combination of multiple similarities. AVE (Nascimento et al., 2016) was the most intuitive linear approach that simply averaged multiple similarity networks by assigning the same weight to each network. Hilbert–Schmidt Independence Criterion (HSIC) (Ding et al., 2020) applied the HSIC metric to achieve the optimal combination of different similarity networks. This method utilized multi-kernel learning to assign weights to each similarity network, thereby maximizing the dependency on the ideal similarity network. Local Interaction Consistency (LIC) (Liu and Tsoumakas, 2021) introduced the concept of local balance, which refers to the proportion of similar drugs or diseases with the same drug-disease interaction. This method improves the prediction performance by assigning higher weights to similarity networks with better local balance. Liu et al. (2023) proposed a fine-grained selective similarity integration method (FGS), which further used a similarity selection step based on LIC to filter out noise information with finer granularity. However, these linear-based similarity integration methods can’t capture complex relations among these networks effectively.
Integration methods using the second strategy regard each similarity network as a graph and exploit the structure of the graph to find complex nonlinear relations between network nodes. These integration methods can be divided into two categories: (1) methods using SNF (Wang et al., 2014), and (2) methods using matrix joint decomposition strategies. SNF used a nonlinear approach based on message-passing theory and updated each similarity network iteratively to make it more similar to the others, eventually converging to a single network. Recently several works have extended SNF in different ways to propose novel integration approaches. For example, considering that the Euclidean distance metric used in SNF suffers from the curse of dimensionality (Rozza et al., 2012), HSNF (Hierarchical SNF) (Liu and Shang, 2018) designed a hierarchical processing by applying the SNF method to different feature subsets multiple times. This method aims to reduce the noise and redundant information of high-dimensional data, thereby improving the quality of the fused similarity network. Although HSNF performs better than SNF on multiple datasets, it has a higher computational cost due to the iteration of SNF. Affinity Network Fusion (ANF) (Ma and Zhang, 2017) used affinity matrices to represent the degree of association between networks from different data sources and reduced the computational cost of SNF by simplifying the iterative integration process into a more straightforward one-step random walk approach. Considering the redundancy and noise problems in multi-similarity networks, several methods have been proposed to improve SNF. For example, similarity selection step is adopted to remove network noise in several integration methods (Olayan et al., 2018; Thafar et al., 2020). The Similarity Kernel Fusion algorithm (SKF) (Jiang et al., 2019) used the kernel functions to construct the kernel matrix of each similarity network and adjusted its weight according to the contribution of each kernel matrix to the target task, thereby increasing the weight of the similarity kernel with lower noise and improving the model’s performance. The association-signal-annotation boosted similarity network fusion (ab-SNF) method (Ruan et al., 2019) introduced the concept of associated signals and aimed to improve SNF by using a weighted distance measurement to emphasize important signal features while minimizing the impact of noisy data. The weight was measured using the paired t-test method, which calculates the weight ratio by comparing the negative sample with the adjacent normal sample at the feature.
Some studies employed joint matrix decomposition to differentiate shared information from network-specific information across various datasets and identify the consistency of multiple networks (Žitnik et al., 2015; Žitnik et al., 2013; Zheng et al., 2013). Recently, Cho et al. proposed a method for multi-similarity networks integration, named Mashup (MU) (Cho et al., 2015; 2016; Wang et al., 2015). This method combines random walk with multi-view factorization and provides a fruitful integration framework. Zhang et al. (2022b) developed a multi-similarity integration method, EnMUGR, that incorporates graph regularization. EnMUGR can effectively address noise and redundancy in multi-similarity networks.
In addition to using similarity information as feature representations of drugs and diseases, drug repositioning methods can also use the associations between drugs and other related biomedical entities (such as genes, diseases, and pathways) to learn feature representations, thereby more accurately predicting potential drug-disease association information (Zhang et al., 2023; Zhang et al., 2024). By constructing a knowledge graph that contains drugs and other related entities, feature representations of drugs and diseases can be learned, which include the relationships and contextual information between these entities. Domingo-Fernández et al. (2022) proposed a knowledge graph causal reasoning model (RPath) for drug discovery, which uses drug perturbation and disease-specific transcriptome features to help identify potential drug candidates for specific diseases by reasoning on causal paths in a knowledge graph (KG). Zhang et al. (2022a) combined drug chemical structures and biomedical knowledge graphs (KGs) to propose a meta-path-based graph representation learning model for drug-disease association (DDA) prediction, namely, RLFDDA. This model constructs a heterogeneous network by integrating DDA, disease-protein associations, and drug-protein associations, and adopts a meta-path random walk strategy to learn the latent representations of drugs and diseases. Han et al. (2023) proposed a multi-channel feature fusion model for multi-typed DDIs prediction, which employs a multi-channel feature fusion module to fuse drug chemical structure features, drug pairs’ extra label features, and KG features of drugs. This approach effectively alleviates the problem of feature redundancy and noise from KG.
In light of the above discussion, we proposed a novel computational framework for drug repositioning based on graph regularized integration and knowledge graph embedding. First, in order to address the problem of incomplete entity information caused by using only one source of data, we employ a graph regularized integration method with a denoised diffusion module to fuse multiple similarity information of drugs and diseases, thereby calculating the common attribute feature representation of drugs and diseases. Then we utilize knowledge graph embedding methods to learn global topological feature representations of drug and disease entities. Finally, we fuse these two learned feature representations by iAFF and feed them into a graph convolutional network prediction model to identify potential therapeutic indications for drugs.
The major contributions of this study are summarized as follows.
• This study proposed a novel framework KGRDR, which integrates a fusion algorithm based on graph regularization and knowledge graph embedding to identify potential indications for existing drugs, providing valuable insights to promote drug repositioning.
• The KGRDR framework utilized a graph regularized method to effectively address noise and redundancy in multi-similarity networks.
• An iterative attention feature fusion method is utilized to combine similarity feature information with the structural feature information derived from knowledge graph learning.
2 Materials and methods
2.1 Notations and brief review of KGRDR
Similarity matrices, denoted by
As illustrated in Figure 1, the proposed framework KGRDR mainly consists of four steps, including multi-similarity integration based on graph regularization, feature extraction based on KG, feature fusion based on iAFF, and drug-disease interaction prediction based on GCN. In the first step, a graph regularized integration method is used to fuse and compute common attribute feature representation
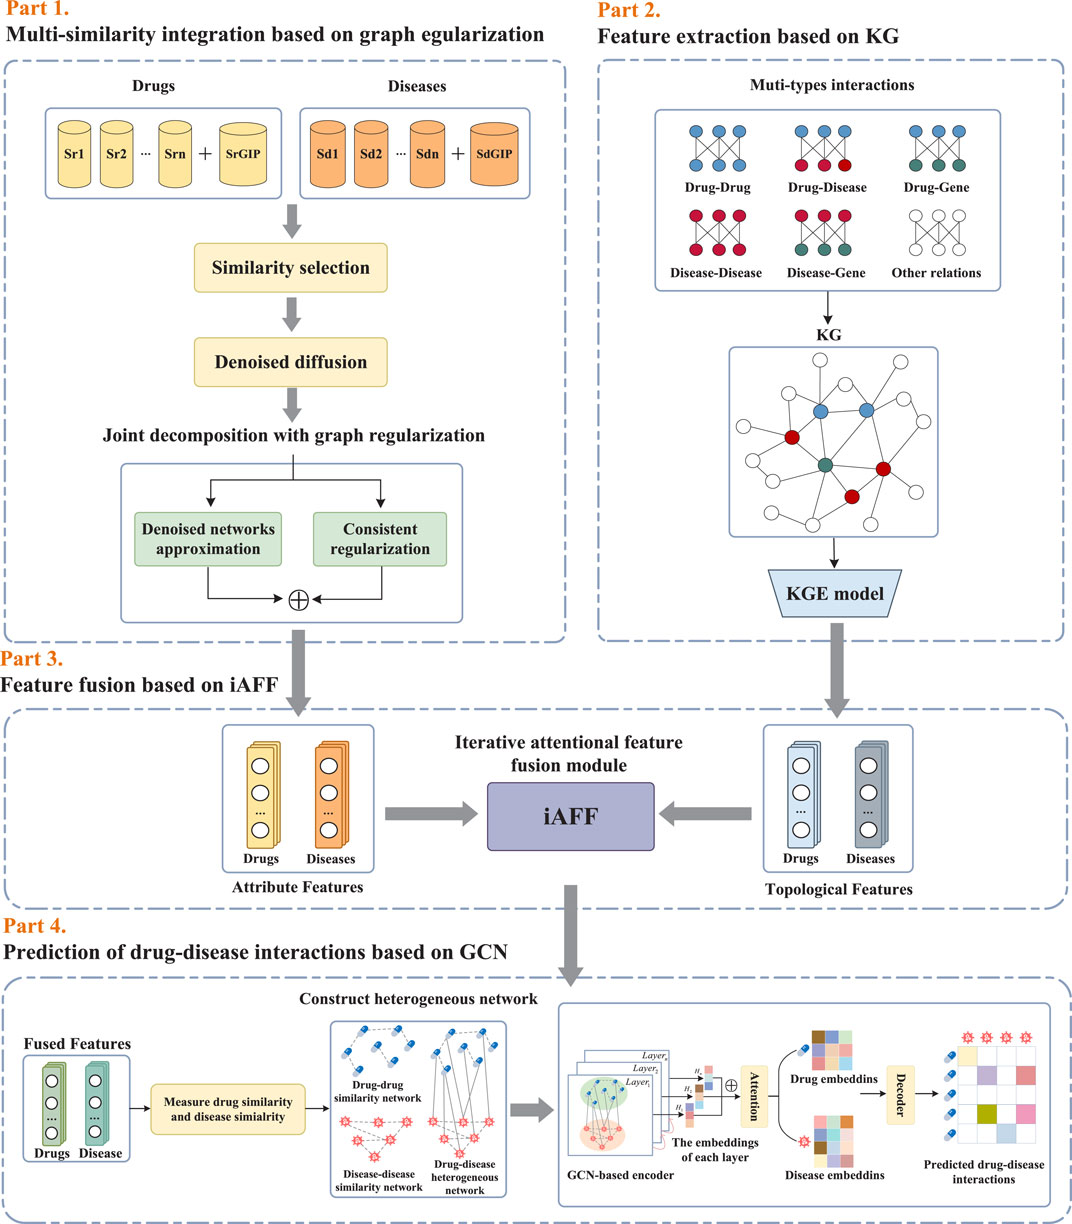
Figure 1. The workflow of the proposed KGRDR.
2.2 Multi-similarity integration based on graph regularization
Considering that noise and redundant information in the multi-similarity networks significantly affect the model’s prediction performance, a graph regularized integration approach (Zhang et al., 2022b) is used to denoise and fuse the multi-similarity information of drugs and diseases. This method primarily consists of denoised diffusion and joint decomposition. The denoised diffusion module is used to denoise multiple similarity networks, while the joint decomposition module fuses the denoised networks. Additionally, to eliminate similarity networks with minimal information and excessive redundancy, a similarity selection operation is employed to pre-screen the similarity matrices before the graph regularized integration step.
2.2.1 Drug and disease similarity data
The pairwise similarity data of drug-related and disease-related entities used in this study are obtained from SND (Jarada et al., 2021) and SCMFDD_S (Zhang et al., 2018) datasets. SND includes ten drug-related similarity data, fourteen disease-related similarity data, and drug-disease interaction data. SCMFDD_S contains five drug-related similarity data, one disease-related similarity data, and drug-disease interaction data. The pairwise similarity values between drugs and diseases range from 0 to 1.
In addition to the above similarity data, we also calculate Gaussian interaction profile kernel similarity of drugs and diseases based on known drug-disease interaction information Van Laarhoven et al. (2011). Drug
where the parameter
2.2.2 Similarity selection
The quality, richness and correlation of drug-related and disease-related similarity matrices vary considerably (Jarada et al., 2021). Data inconsistency and redundancy can introduce noise. This study adopted an effective method, introduced by Olayan et al. (2018), to select the most informative and less redundant drug and disease similarity subset. The heuristic similarity selection process consists of four parts: calculating the average entropy of similarity matrices, ranking the matrices according to their average entropy values, calculating the similarity measure between similarity matrices from different data sources, and eliminating redundant similarity matrices.
In this study, we use the calculated profile similarity and similarities from SND and SCMFDD_S datasets to perform the similarity selection. The similarity selection step extracts a subset
2.2.3 Diffusion to denoise matrices
Some noise may still exist in the extracted similarity matrices. To address this problem, we apply denoised diffusion (Wang et al., 2018) to further reduce the noise in the similarity matrices
where
2.2.4 Joint decomposition with graph regularization
In order to fuse the denoised similarity matrices in
The joint decomposition method can analyze multiple networks uniformly, capture the inconsistencies between networks, and explore the correlations between networks. Specifically, for the denoised similarity subset
in which
Moreover, to ensure that the common feature
in which
The objective function is described as Equation 6.
where
2.3 Feature extraction based on KG
In this study, we used the Drug Repurposing Knowledge Graph (DRKG) (Ioannidis et al., 2020) to learn topological features of drugs and diseases. DRKG is specifically designed for drug repurposing and includes entities such as drugs, diseases, and genes, along with their relationships. Knowledge graph embedding maps these entities and relationships into a low-dimensional vector space, preserving both structural and semantic information. In this study, we applied the ComplEx knowledge graph (KG) embedding method (Trouillon et al., 2016) to learn embedding representations.
2.3.1 Knowledge graph construction
DRKG included 97,238 entities belonging to 13 entity types and 5,874,261 triples belonging to 107 edge types. The types of entities and relationships included in the knowledge graph are as follows.
• Entities: drugs, diseases, genes, compounds, etc.
• Relations: drug-target, gene-disease, drug-disease, etc.
DRKG is composed of entity-relation-entity triples. For example, the triple (DB00512, Compound:Disease, C0157749) indicates that drug DB00512 interacts with disease C0157749. In the knowledge graph, entities are represented as nodes, and relations are represented as edges from the subject entity node to the object entity node. We removed all the triples of drug-disease relationship in DRKG that were not present in the benchmark dataset (Jarada et al., 2021; Zhang et al., 2018), added new triples of drug-disease relationship that existed in dataset to DRKG, and regarded the obtained triples in DRKG as the KG dataset.
2.3.2 Knowledge graph embedding
As shown in Figure 1, we employed the widely adopted KGE method, ComplEx (Trouillon et al., 2016), to derive KG-based feature representations for each entity and relationship in the DRKG. ComplEx models entities and relations by embedding them into complex domains, which can capture the asymmetric relationship between triples (drug-disease-relationship) while preserving the vector representation, thereby more effectively handling the drug-disease interaction prediction problem. The process is as follows.
• Embedding Initialization: The dataset contains
• Predicting drug-disease interaction scores: A scoring function is used to measure the interaction strength between the learned complex embedding vectors of drugs and diseases, thereby predicting potential drug-disease interactions. The scoring function is a core component of the ComplEx embedding method. By training and optimizing the scoring function, the embedding vectors of drugs and diseases are adjusted and refined. The scoring function for the triple is described as Equation 7.
where
• Model training and optimization: In order to learn appropriate embedding representations of drugs and diseases, the ComplEx model optimizes the embedding representation through negative sampling and loss function. The goal of the loss function is to maximize the prediction score of the true drug-disease interaction pair while minimizing the score of the negative sample pair. The loss function of the model is defined as Equation 9.
where
• Extracting features: Using the trained model, the embedding vectors of drug and disease entities are extracted as their global topological feature representation
2.4 Feature fusion based on iAFF
In this study, we used the iterative attention feature fusion (iAFF) method (Dai et al., 2021) to fuse the attribute feature
where
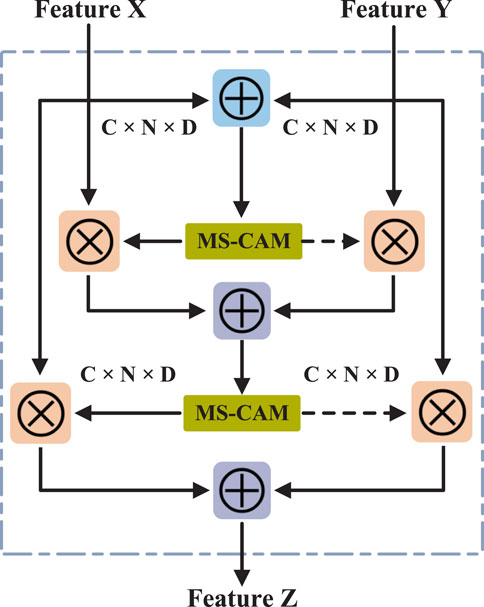
Figure 2. The structure of iterative attention feature fusion.
Finally, the attention-fused feature
2.5 Prediction of drug-disease interactions based on GCN
Recently, graph convolutional networks (GCNs) (Kipf and Welling, 2016) have attracted increasing attention and have been widely applied to various drug repositioning prediction tasks in an end-to-end manner (Peng et al., 2022). In this study, the drug and disease feature vectors obtained through feature fusion, along with known drug-disease interactions, are fed into a graph convolutional neural network (Cai et al., 2021) to predict candidate drug-disease interactions.
2.5.1 Construction of the drug–disease heterogeneous network
Using the fused drug and disease feature matrix, the similarity matrix
The drug–drug similarity matrix is denoted as a graph
2.5.2 Feature extraction based on GCN
GCN is a multilayer connected neural network architecture and is used to learn low-dimensional representations of nodes from graph-structured data. In this study, we employed a heterogeneous information fusion graph convolutional network model (Cai et al., 2021) to predict drug-disease associations. The strategy of fusing intra-domain features and extra-domain features is used by this method to improve the prediction performance. Specifically, the intra-domain embeddings of drugs and diseases are first extracted using the drug-drug similarity network and the disease-disease similarity network. Then, the inter-domain embeddings of drugs and diseases are extracted using the drug-disease association network. Finally, the inter-domain embeddings and intra-domain embeddings are fused to obtain the final embedding representations of drugs and diseases.
First, we initialize the embeddings of drugs and diseases as Equation 12.
Second, the intra-domain feature extraction module is defined as Equation 13.
where
where
The inter-domain feature extraction module for message passing between drugs and diseases is composed of a bilinear aggregator (BA) and a traditional GCN aggregator (AGG). Specifically, for a drug
where
Finally, the intra-domain features and inter-domain features are merged as Equation 16.
where
Next, layer attention is introduced into the network architecture to adaptively combine embeddings at different graph convolution layers with an attention mechanism to further improve the prediction performance. Specifically, we paid different attention to convolution layers to integrate embeddings and obtained the final embeddings of drugs and diseases as Equation 17.
where
2.5.3 Drug-disease interaction prediction
To reconstruct the associations between drugs and diseases, the decoder
where
The parameters are learned by minimizing the weighted binary cross entropy loss as Equation 19.
where N denotes the number of drug nodes, M denotes the number of disease nodes,
Finally, the model is optimized using the Adam optimizer (Diederik, 2014) and the weights are initialized as described in Glorot and Bengio (2010).
3 Results and discussion
3.1 Datasets
Two benchmark datasets containing drug-related information similarity, disease-related information similarity, and drug-disease interaction are used in this study. The detailed information of the two datasets is shown in Table 1.
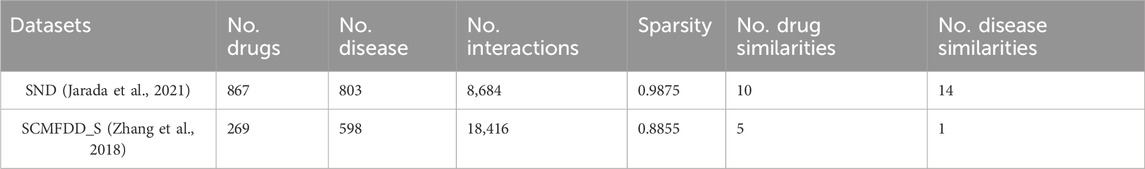
Table 1. Detailed information of benchmark datasets.
3.1.1 SND dataset
The SND benchmark dataset was assembled from various biological and biomedical data sources. Drug-disease interaction data was collected from two widely used data sources, namely, DrugBank (Wishart et al., 2018) and repoDB (Brown and Patel, 2017). The dataset contains 867 FDA-approved drugs, 803 diseases, and 8,684 clinically reported and/or experimentally validated drug-disease interactions with 98.75% sparsity.
SND contains ten drug similarity data: (1) target interaction similarity, (2) side effect similarity, (3) chemical structure similarity, (4) GO molecular function similarity, (5) GO biological process similarity, (6) GO cellular component similarity, (7) metabolism enzyme similarity, (8) protein sequence similarity, (9) ATC code similarity and (10) drug interaction similarity.
Moreover, the dataset contains fourteen disease similarity (1) curated gene similarity, (2) HPO gene similarity, (3) literature gene similarity, (4) curated variant similarity, (5) literature variant similarity, (6) microRNA similarity, (7) lncRNA similarity, (8) HPO phenotype similarity, (9) IS-A taxonomy similarity (10) information-theoretic similarity, (11) GO term similarity (12) implicit semantic similarity, (13) semantic
3.1.2 SCMFDD_S dataset
The SCMFDD_S benchmark dataset are collected from the literature (Zhang et al., 2018). The drug-disease interaction data include 18,416 known drug-disease interactions between 269 drugs and 598 diseases from CTD (Davis et al., 2017), with a sparsity of 88.55%.
SCMFDD_S contains five drug similarity data: (1) target interaction similarity, (2) metabolism enzyme similarity, (3) drug interaction similarity, (4) pathway similarity, and (5) chemical substructure similarity. Information on drug targets, enzymes, and related aspects is sourced from DrugBank (Wang et al., 2010).
Disease similarity data based on the MeSH descriptor is contained in SCMFDD_S. The MeSH descriptors of the disease can be represented as a hierarchical directed acyclic graph (DAG), and the DAG structure can be used to calculate the similarity between two diseases (Meng et al., 2022).
3.2 Method comparisons
To validate the effectiveness of our approach in predicting drug-disease associations, we compared KGRDR with six state-of-the-art drug repositioning methods based on recommender systems and GCNs, including LAGCN (Yu et al., 2021), DRHGCN (Cai et al., 2021), DRWBNCF (Meng et al., 2022), GCNAT (Sun et al., 2022), SMGCL (Gao et al., 2023), and DRAGNN (Meng et al., 2024). These methods are described in detail as follows.
• LAGCN is a layered attention graph convolutional network, which is used for the drug–disease associations prediction.
• DRHGCN uses GCN to extract inter-domain and intra-domain feature information of drugs and diseases, thereby finding new drug indications based on different network topology information of drugs and diseases in different domains.
• DRWBNCF is a neural collaborative filtering method that proposes a new weighted bilinear graph convolution operation to integrate the information of the known drug–disease association, drug’s and disease’s neighborhood, and neighborhood interaction into a unified representation to infer novel potential drug–disease associations.
• GCNAT is a deep learning algorithm that combines graph convolutional networks (GCN) and graph attention networks (GAT). After building a heterogeneous network, this approach combines the embeddings of multiple convolutional layers using a graph attention layer on a constructed heterogeneous network and assigns different weights to predict new metabolite-disease associations.
• SMGCL is a graph contrastive learning method based on similarity measurement. It introduces graph contrastive learning methods and jointly trains node representations to maximize consistency, thereby overcoming the problem of sparse supervision signals in traditional graph neural network methods and enhancing the predictive ability of drug-disease associations.
• DRAGNN is a local information weighted enhancement method that improves the effectiveness of target node information collection by combining the attention mechanism and omitting self-node information aggregation, thereby improving the prediction performance of the model.
These competing methods with the optimal parameters suggested in the original papers are compared with KGRDR using 10-fold cross-validation. Furthermore, we conducted parameter analysis and selected the best parameters for KGRDR.
3.3 Parameter settings
There are multiple parameters in KGRDR which can impact the model performance. According to the literature (Zhang et al., 2022b), the number of neighbors K in the graph regularization integration module is set to 20, the surfing parameter
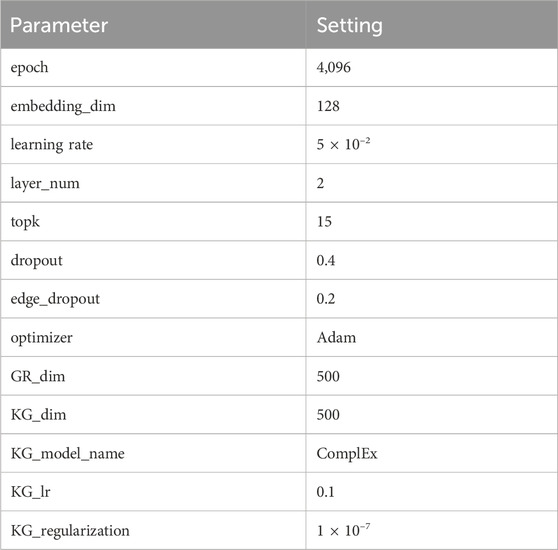
Table 2. Hyperparameter settings.
3.4 Performance evaluation
In this study, we conducted 10-fold cross-validation on two benchmark datasets to evaluate the performance of KGRDR. During the 10-fold cross-validation, we randomly selected 10% of the known drug-disease associations and 10% of the unknown associations in the dataset as the testing set; the remaining 90% of clinically reported drug-disease association and unknown drug-disease associations pairs were used to train the prediction model. The area under the receiver operating characteristic curve (AUROC) and the area under the precision–recall curve (AUPR) has been widely used in bioinformatics research (Zhang et al., 2020a; Zhang et al., 2020b). We adopt these two metrics to evaluate the overall performance of KGRDR and compare it with six state-of-the-art association prediction methods.
As shown in Table 3, on the SND dataset, KGRDR finally achieved an AUROC of 0.9864, which is 2.09% higher than the second-ranked DRHGCN; KGRDR achieved an AUPR of 0.7915, which is 11.69% higher than the second-ranked DRHGCN. It is worth noting that KGRDR also achieved the highest AUROC and AUPR on the SCMFDD_S dataset. The benchmark comparison results of the two datasets show that KGRDR outperforms six state-of-the-art prediction models. In particular, the results of each 10-fold cross-validation are basically consistent, which shows that our model shows convincing performance and high robustness.
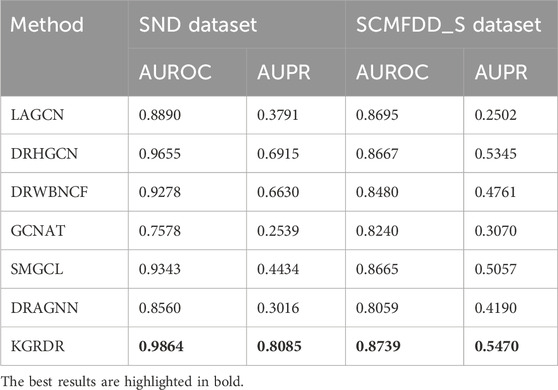
Table 3. Comparison of KGRDR with the state-of-the-art methods.
The excellent prediction performance of KGRDR can be attributed to learn the feature representations of drugs and diseases from different perspectives and fuse these features to improve the prediction performance. First, KGRDR considers14 the information of drugs and diseases from multiple similarity perspectives, and uses a graph regularized integration method to fuse the different similarity information of drugs and diseases, which can obtain more comprehensive common attribute feature information. Then, KGRDR uses the existing drug-disease interaction data and combines all related entities in KG to enrich the global topological representation of drugs and diseases. Finally, the attention feature fusion method is used to fuse these two features of information, which can more effectively represent the entity characteristics of drugs and diseases, thereby further improving the performance of the drug-disease interaction prediction model.
3.5 Parameter sensitivity analysis
To further analyze KGRDR, we studied the impact of some parameters on model performance. The dimension of embedding directly affects the representation ability of the fused feature vector and the knowledge graph embedding vector. Increasing the embedding dimension can effectively encode more feature information. However, exceeding a certain range will lead to overfitting, which will reduce the model performance. The channel scaling ratio reflects the compression of channel information. Reducing the channel scaling ratio makes the number of channels of the feature map larger, which means that the model can retain more feature information. However, having an excessive number of channels can lead to overfitting, which will affect the model performance. Therefore, we conducted parameter sensitivity analysis on the two parameters to select the optimal parameters for KGRDR. All the following studies were conducted using 10-fold cross validation experiments on the SND benchmark dataset in Table 1.
3.5.1 Effect of the dimension of embedding
As shown in Figure 3, we selected the embedding dimensions of {100, 200, 300, 400, 500, 600} to adjust the graph regularized integration module and the KG embedding representation module, and evaluated them through the AUROC and AUPR indicators. The result shows that when the embedding dimension is 500, the performance of the model reaches optimal. Specifically, as the embedding dimension increases from 100 to 500, the model prediction performance improves significantly. However, when further increasing the embedding dimension to 600, the model performance decreases. This shows that within a certain range, increasing the embedding dimension can effectively encode more feature information, thereby improving model performance. However, exceeding the optimal embedding dimension can lead to overfitting and thus degrade prediction performance.
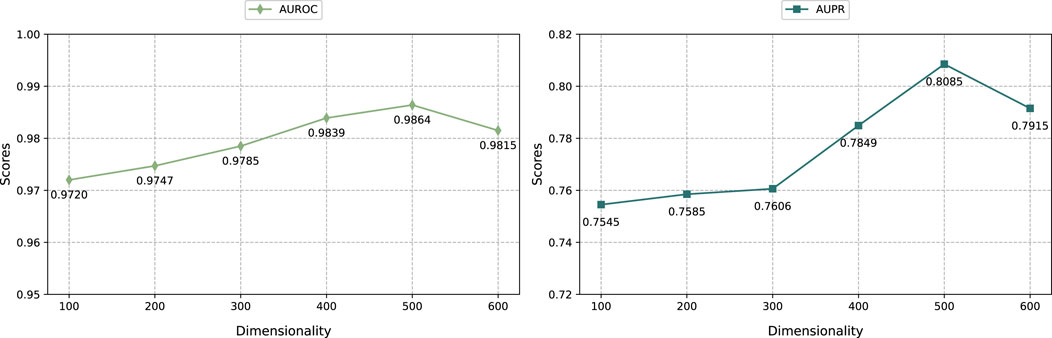
Figure 3. The impact of different embedding dimensions.
3.5.2 Effect of the parameter channel scaling ratio
As shown in Figure 4, we evaluated the impact of different channel scaling ratios on the iterative attention feature fusion module effect of drug and disease feature. We changed the channel scaling ratio in the range of {2, 4, 8, 16, 32, 64} and analyzed its impact on the model performance.
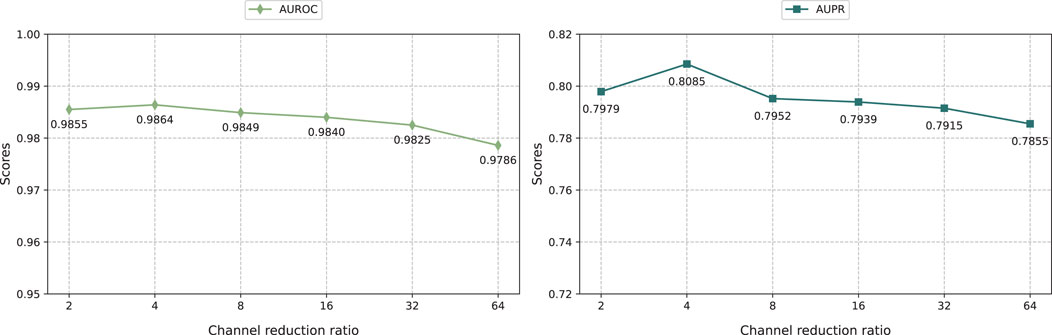
Figure 4. The impact of different channel scaling ratios.
The result shows that KGRDR performs best when the channel scaling ratio is set to 4. The smaller the channel scaling ratio, the more channels the intermediate feature map has, which means the model can retain more feature information. Specifically, as the channel scaling ratio increases from 2 to 4, the model prediction performance improves significantly. However, when further increasing the channel scaling ratio to 64, the model performance decreases. This shows that within a certain range, decreasing the channel scaling ratio can effectively encode more feature information, thereby improving model performance. However, exceeding the optimal channel scaling ratio can lead to overfitting, which may degrade prediction performance.
3.6 Comparison with the other multi-similarity fusion methods
To further demonstrate the performance of KGRDR in multi-similarity network fusion, we compare it with four methods: SNF-H (Olayan et al., 2018), SNF-NN (Jarada et al., 2021), DeFusion (Wang et al., 2021) and EnMuGR (Zhang et al., 2022b). Among them, SNF-H, DeFusion, and EnMuGR used the same network prediction model (DRHGCN). They were compared with KGRDR on the SND dataset in Table 1. The SNF-NN first compiled and used a large number of drug and disease similarity datasets (SND). The optimal network model (NN) provided by the publication (Jarada et al., 2021) was compared with KGRDR on the SND dataset. The results are as follows.
As shown in Figure 5, when using the same dataset and prediction model, KGRDR achieves the highest AUROC and AUPR values compared to SNF-H, DeFusion, EnMuGR and SNF-NN, indicating that the proposed method better integrates multiple similarity networks, thereby improving the prediction model’ performance.
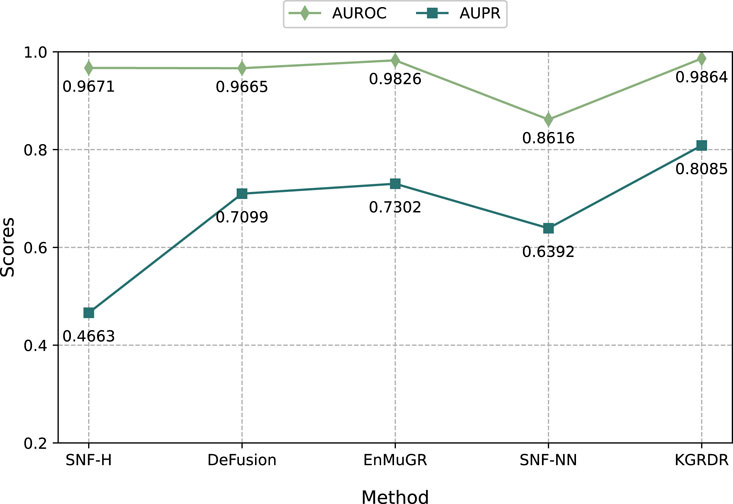
Figure 5. Comparison of multiple similarity network fusion methods.
3.7 Ablation study
According to Figure 1, KGRDR mainly consists of four parts: graph regularized integration module, knowledge graph extraction module, iterative attention feature fusion module and graph convolutional network prediction module. In KGRDR, we learned multi-similarity integrated feature representation and knowledge graph-based feature representation. To verify the impact of these two feature representations on model performance, we designed three KGRDR variants and compared them on the SND dataset. The model variants are outlined as follows:
The model variants are summarized as follows.
•
•
•
Table 4 shows the performance of KGRDR and various variants on the SND dataset. In the 10-fold cross validation, the performance of the combined graph regularized integration module with the knowledge graph extraction module is better than that of using only a single module. This result shows that the weighted attention fusion of the attribute feature information obtained by graph regularized integration and the global topological feature information obtained by knowledge graph extraction helps to improve the prediction performance of KGRDR. Additionally, we validated the predictive ability of KGRDR in drug-disease interactions using the graph regularized integration module and the knowledge graph extraction module separately through local exclusion cross-validation. The experimental result shows that both variants have better predictive performance than the original graph convolutional network model, which indicates that both the graph regularized integration process and the knowledge graph-based feature extraction operation can improve the predictive performance of drug-disease interactions.

Table 4. Detailed information of benchmark datasets.
3.8 Case study
To further verify the reliability of KGRDR, the proposed method KGRDR was applied on the SND dataset to learn feature embeddings of drugs and diseases. The learned embeddings were used to predict interaction scores for the unknown drug-disease associations.
In this study, we predicted candidate drugs for two neurodegenerative diseases including Alzheimer’s disease and Parkinson’s disease having a large patient population, high incidence, and no definitive cure. Extensive research has been conducted on the two diseases.
For AD, we focused on the top 10 potential drugs predicted by KGRDR (Table 5) and searched for literature evidence supporting the predictions in the biomedical literature to check the predicted drug-disease associations. The results showed that all 10 candidate drugs (100% success rate) were validated by clinical trials from reliable sources. For example, Escitalopram was originally used to treat major depressive disorder (MDD), generalized anxiety disorder (GAD), and other specific psychiatric disorders such as obsessive-compulsive disorder (OCD). A previous study reported that Escitalopram can improve tau hyperphosphorylation in vitro, and inhibition of tau hyperphosphorylation is one of the most promising therapeutic targets for the development of drugs to alleviate Alzheimer’s disease (AD). This was confirmed by an experiment using Escitalopram to alleviate Tau pathological changes in elderly P301L Tau transgenic mice with AD (Wang et al., 2020). The pathogenesis of Alzheimer’s disease (AD) is a complex process, in which the protein toxicity of amyloid
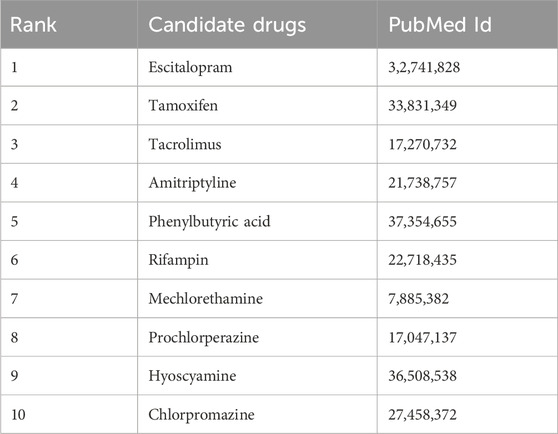
Table 5. The top 10 KGRDR-predicted candidate drugs for AD.
For PD, we focused on analyzing the top 10 candidate drugs predicted by KGRDR. As shown in Table 6, we found that 9 out of 10 drugs (90% success rate) have been verified by the reliable sources and clinical trials. For example, KGRDR predicted that Biperiden affects both the central and peripheral nervous systems. It has been approved for the treatment of arteriosclerosis, idiopathic and post-encephalitic Parkinson’s syndrome. This drug-disease association has also been recorded in DrugBank (Wishart et al., 2018). Therefore, Biperiden is the first potential drug predicted in this article to treat Parkinson’s disease. In addition, Orphenadrine predicted by KGRDR as an adjuvant drug for relieving musculoskeletal pain and discomfort symptoms has also been shown to be useful for the treatment of drug-induced Parkinson’s syndrome and the relief of pain caused by muscle spasms. This prediction is also supported by DrugBank and PubChem.
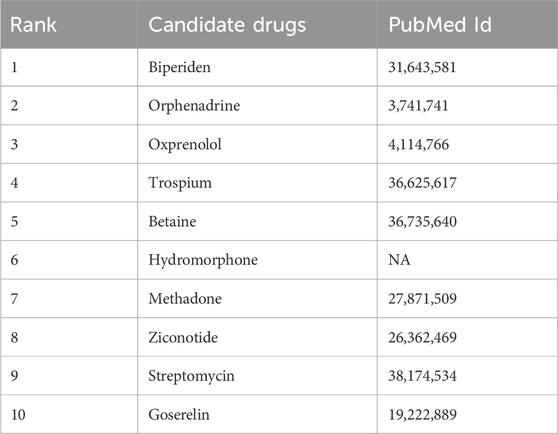
Table 6. The top 10 KGRDR-predicted candidate drugs for PD.
To sum up, most of our predictions can be verified by reliable sources and clinical trials. The case study results further demonstrate the effectiveness of KGRDR in predicting novel drug–disease associations.
4 Conclusion
In this study, we proposed a new framework for drug-disease interaction prediction by combining graph regularized integration and knowledge graph embedding, named KGRDR. Firstly, in order to alleviate the data quality problem caused by using single feature information of drugs and diseases, the graph regularized integration method is applied to fuse the drug and disease similarities from multiple data sources to build a more comprehensive heterogeneous network with multiple relationship types to improve the prediction performance of the model. Secondly, most of the current studies on drug-disease interaction prediction only consider drug and disease entities, ignoring the association between drugs or diseases and other entities during the drug’s efficacy. Therefore, we introduce the knowledge graph embedding module to obtain the global topological feature representation of drug and disease entities by constructing the association between drugs and diseases and multiple medical entities. Finally, the attention feature fusion method is used to fuse the feature information of the graph regularized integration module and the knowledge graph embedding module, and feed the fused features into the graph convolutional network prediction model to identify the potential therapeutic indications of drugs. The results of extensive experiments demonstrated that KGRDR outperformed other drug–disease association prediction methods and various variants of KGRDR.
In summary, KGRDR integrates multiple similarity information between drugs and diseases, and obtains various topological associations in drug-disease heterogeneous networks based on knowledge graphs, which can significantly improve the performance of drug-disease interaction prediction models. It can help pharmacologists or biologists effectively narrow down the search space of candidate drugs. It may further guide them to conduct wet-lab experiments and thus reduce costs and time. In future work, more biomedical information can be integrated to learn drug and disease features, and efficient fusion strategies can be designed to obtain more comprehensive feature information.
Data availability statement
The original contributions presented in the study are included in the article/supplementary material, further inquiries can be directed to the corresponding author.
Author contributions
HL: Writing–review and editing, Funding acquisition, Resources, Supervision, Validation. HY: Writing–original draft, Conceptualization, Data curation, Investigation, Methodology, Validation, Visualization. GZ: Conceptualization, Formal Analysis, Writing–review and editing. JW: Methodology, Software, Writing–review and editing. JL: Investigation, Supervision, Writing–review and editing. CY: Formal Analysis, Methodology, Writing–review and editing, Funding acquisition.
Funding
The author(s) declare that financial support was received for the research, authorship, and/or publication of this article. This work was supported by the National Natural Science Foundation of China (Grant No. 61802113), and the Science and Technology Development Plan Project of Henan Province (Grant No. 242102211062).
Acknowledgments
HL conceived and designed the algorithm and analysis. HL and HY gathered all the data, designed the study, conduct experiments, and draft manuscripts. HL, HY, JW and GZ contributed to results analysis and discussions, and gave the final approval of the version to be published. JL and CY supervised the study, revised the manuscript. And we thank LetPub (www.letpub.com) for its linguistic assistance during the preparation of this manuscript.
Conflict of interest
The authors declare that the research was conducted in the absence of any commercial or financial relationships that could be construed as a potential conflict of interest.
Generative AI statement
The author(s) declare that no Generative AI was used in the creation of this manuscript.
Publisher’s note
All claims expressed in this article are solely those of the authors and do not necessarily represent those of their affiliated organizations, or those of the publisher, the editors and the reviewers. Any product that may be evaluated in this article, or claim that may be made by its manufacturer, is not guaranteed or endorsed by the publisher.
References
Baumanns, S., Muehlemeyer, F., Miesbauer, L. C., Baake, J., Roloff, E. M., Beis, D. M., et al. (2023). 4-phenylbutyric acid attenuates amyloid-β proteotoxicity through activation of hsf-1 in an alzheimer’s disease model of the nematode caenorhabditis elegans. Biochem. Biophysical Res. Commun. 673, 16–22. doi:10.1016/j.bbrc.2023.06.064
Brown, A. S., and Patel, C. J. (2017). A standard database for drug repositioning. Sci. data 4, 170029–170037. doi:10.1038/sdata.2017.29
Cai, L., Lu, C., Xu, J., Meng, Y., Wang, P., Fu, X., et al. (2021). Drug repositioning based on the heterogeneous information fusion graph convolutional network. Briefings Bioinforma. 22, bbab319. doi:10.1093/bib/bbab319
Chan, H. S., Shan, H., Dahoun, T., Vogel, H., and Yuan, S. (2019). Advancing drug discovery via artificial intelligence. Trends Pharmacol. Sci. 40, 592–604. doi:10.1016/j.tips.2019.06.004
Cho, H., Berger, B., and Peng, J. (2015). “Diffusion component analysis: unraveling functional topology in biological networks,” in International conference on research in computational molecular biology (Springer), 62–64.
Cho, H., Berger, B., and Peng, J. (2016). Compact integration of multi-network topology for functional analysis of genes. Cell Syst. 3, 540–548.e5. doi:10.1016/j.cels.2016.10.017
Chong, C. R., and Sullivan, D. J. (2007). New uses for old drugs. Nature 448, 645–646. doi:10.1038/448645a
Dai, Y., Gieseke, F., Oehmcke, S., Wu, Y., and Barnard, K. (2021). “Attentional feature fusion,” in Proceedings of the IEEE/CVF winter conference on applications of computer vision, Waikoloa, HI, USA, 03-08 January 2021, 3560–3569.
Davis, A. P., Grondin, C. J., Johnson, R. J., Sciaky, D., King, B. L., McMorran, R., et al. (2017). The comparative toxicogenomics database: update 2017. Nucleic acids Res. 45, D972–D978. doi:10.1093/nar/gkw838
Ding, Y., Tang, J., and Guo, F. (2020). Identification of drug–target interactions via dual laplacian regularized least squares with multiple kernel fusion. Knowledge-Based Syst. 204, 106254. doi:10.1016/j.knosys.2020.106254
Domingo-Fernández, D., Gadiya, Y., Patel, A., Mubeen, S., Rivas-Barragan, D., Diana, C. W., et al. (2022). Causal reasoning over knowledge graphs leveraging drug-perturbed and disease-specific transcriptomic signatures for drug discovery. PLoS Comput. Biol. 18, e1009909. doi:10.1371/journal.pcbi.1009909
Gao, Z., Ma, H., Zhang, X., Wang, Y., and Wu, Z. (2023). Similarity measures-based graph co-contrastive learning for drug–disease association prediction. Bioinformatics 39, btad357. doi:10.1093/bioinformatics/btad357
Glorot, X., and Bengio, Y. (2010). “Understanding the difficulty of training deep feedforward neural networks,” in Proceedings of the thirteenth international conference on artificial intelligence and statistics (Cambridge, MA: JMLR Workshop and Conference Proceedings), 249–256.
Han, C.-D., Wang, C.-C., Huang, L., and Chen, X. (2023). Mcff-mtddi: multi-channel feature fusion for multi-typed drug–drug interaction prediction. Briefings Bioinforma. 24, bbad215. doi:10.1093/bib/bbad215
Huang, L., Luo, H., Li, S., Wu, F.-X., and Wang, J. (2021). Drug–drug similarity measure and its applications. Briefings Bioinforma. 22, bbaa265. doi:10.1093/bib/bbaa265
Ioannidis, V. N., Song, X., Manchanda, S., Li, M., Pan, X., Zheng, D., et al. (2020). Drkg-drug repurposing knowledge graph for covid-19. arXiv Prepr. arXiv:2010. Available at: https://github.com/gnn4dr/DRKG/.
Jarada, T. N., Rokne, J. G., and Alhajj, R. (2021). Snf-nn: computational method to predict drug-disease interactions using similarity network fusion and neural networks. BMC Bioinforma. 22, 28–20. doi:10.1186/s12859-020-03950-3
Jiang, L., Xiao, Y., Ding, Y., Tang, J., and Guo, F. (2019). Discovering cancer subtypes via an accurate fusion strategy on multiple profile data. Front. Genet. 10, 20. doi:10.3389/fgene.2019.00020
Kipf, T. N., and Welling, M. (2016). Semi-supervised classification with graph convolutional networks. arXiv Prepr. arXiv:1609.02907. Available at: 10.48550/arXiv.1609.02907.
Li, Y. Y., and Jones, S. J. (2012). Drug repositioning for personalized medicine. Genome Med. 4, 27–14. doi:10.1186/gm326
Liu, B., and Tsoumakas, G. (2021). Optimizing area under the curve measures via matrix factorization for predicting drug-target interaction with multiple similarities. arXiv Prepr. arXiv:2105.01545. doi:10.48550/arXiv.2105.01545
Liu, B., Wang, J., Sun, K., and Tsoumakas, G. (2023). Fine-grained selective similarity integration for drug–target interaction prediction. Briefings Bioinforma. 24, bbad085. doi:10.1093/bib/bbad085
Liu, S., and Shang, X. (2018). “Hierarchical similarity network fusion for discovering cancer subtypes,” in Bioinformatics Research and Applications: 14th International Symposium, ISBRA 2018, Beijing, China, June 8-11, 2018 (Springer), 125–136.
Lotfi Shahreza, M., Ghadiri, N., Mousavi, S. R., Varshosaz, J., and Green, J. R. (2018). A review of network-based approaches to drug repositioning. Briefings Bioinforma. 19, 878–892. doi:10.1093/bib/bbx017
Luo, H., Li, M., Yang, M., Wu, F.-X., Li, Y., and Wang, J. (2021). Biomedical data and computational models for drug repositioning: a comprehensive review. Briefings Bioinforma. 22, 1604–1619. doi:10.1093/bib/bbz176
Luo, H., Wang, J., Li, M., Luo, J., Ni, P., Zhao, K., et al. (2018). Computational drug repositioning with random walk on a heterogeneous network. IEEE/ACM Trans. Comput. Biol. Bioinforma. 16, 1890–1900. doi:10.1109/TCBB.2018.2832078
Ma, T., and Zhang, A. (2017). “Integrate multi-omic data using affinity network fusion (anf) for cancer patient clustering,” in 2017 IEEE International Conference on Bioinformatics and Biomedicine (BIBM) (IEEE), Kansas City, MO, USA, 13-16 November 2017, 398–403. doi:10.1109/bibm.2017.8217682
Meng, Y., Lu, C., Jin, M., Xu, J., Zeng, X., and Yang, J. (2022). A weighted bilinear neural collaborative filtering approach for drug repositioning. Briefings Bioinforma. 23, bbab581. doi:10.1093/bib/bbab581
Meng, Y., Wang, Y., Xu, J., Lu, C., Tang, X., Peng, T., et al. (2024). Drug repositioning based on weighted local information augmented graph neural network. Briefings Bioinforma. 25, bbad431. doi:10.1093/bib/bbad431
Nair, V., and Hinton, G. E. (2010). “Rectified linear units improve restricted Boltzmann machines,” in Proceedings of the 27th international conference on machine learning (ICML-10) (Madison, Wisconsin: Omnipress), 807–814.
Nascimento, A. C., Prudêncio, R. B., and Costa, I. G. (2016). A multiple kernel learning algorithm for drug-target interaction prediction. BMC Bioinforma. 17, 46–16. doi:10.1186/s12859-016-0890-3
Novac, N. (2013). Challenges and opportunities of drug repositioning. Trends Pharmacol. Sci. 34, 267–272. doi:10.1016/j.tips.2013.03.004
Olayan, R. S., Ashoor, H., and Bajic, V. B. (2018). Ddr: efficient computational method to predict drug–target interactions using graph mining and machine learning approaches. Bioinformatics 34, 3779–1173. doi:10.1093/bioinformatics/bty417
Peng, W., Chen, T., and Dai, W. (2021). Predicting drug response based on multi-omics fusion and graph convolution. IEEE J. Biomed. Health Inf. 26, 1384–1393. doi:10.1109/JBHI.2021.3102186
Peng, W., Liu, H., Dai, W., Yu, N., and Wang, J. (2022). Predicting cancer drug response using parallel heterogeneous graph convolutional networks with neighborhood interactions. Bioinformatics 38, 4546–4553. doi:10.1093/bioinformatics/btac574
Pushpakom, S., Iorio, F., Eyers, P. A., Escott, K. J., Hopper, S., Wells, A., et al. (2019). Drug repurposing: progress, challenges and recommendations. Nat. Rev. Drug Discov. 18, 41–58. doi:10.1038/nrd.2018.168
Rozza, A., Lombardi, G., Casiraghi, E., and Campadelli, P. (2012). Novel Fisher discriminant classifiers. Pattern Recognit. 45, 3725–3737. doi:10.1016/j.patcog.2012.03.021
Ruan, P., Wang, Y., Shen, R., and Wang, S. (2019). Using association signal annotations to boost similarity network fusion. Bioinformatics 35, 3718–3726. doi:10.1093/bioinformatics/btz124
Setoain, J., Franch, M., Martínez, M., Tabas-Madrid, D., Sorzano, C. O., Bakker, A., et al. (2015). Nffinder: an online bioinformatics tool for searching similar transcriptomics experiments in the context of drug repositioning. Nucleic acids Res. 43, W193–W199. doi:10.1093/nar/gkv445
Sun, F., Sun, J., and Zhao, Q. (2022). A deep learning method for predicting metabolite–disease associations via graph neural network. Briefings Bioinforma. 23, bbac266. doi:10.1093/bib/bbac266
Thafar, M. A., Olayan, R. S., Ashoor, H., Albaradei, S., Bajic, V. B., Gao, X., et al. (2020). Dtigems+: drug–target interaction prediction using graph embedding, graph mining, and similarity-based techniques. J. Cheminformatics 12, 44–17. doi:10.1186/s13321-020-00447-2
Trouillon, T., Welbl, J., Riedel, S., Gaussier, É., and Bouchard, G. (2016). “Complex embeddings for simple link prediction,” in International conference on machine learning (PMLR), 2071–2080.
Van Laarhoven, T., Nabuurs, S. B., and Marchiori, E. (2011). Gaussian interaction profile kernels for predicting drug–target interaction. Bioinformatics 27, 3036–3043. doi:10.1093/bioinformatics/btr500
Wang, B., Mezlini, A. M., Demir, F., Fiume, M., Tu, Z., Brudno, M., et al. (2014). Similarity network fusion for aggregating data types on a genomic scale. Nat. methods 11, 333–337. doi:10.1038/nmeth.2810
Wang, B., Pourshafeie, A., Zitnik, M., Zhu, J., Bustamante, C. D., Batzoglou, S., et al. (2018). Network enhancement as a general method to denoise weighted biological networks. Nat. Commun. 9, 3108. doi:10.1038/s41467-018-05469-x
Wang, D., Wang, J., Lu, M., Song, F., and Cui, Q. (2010). Inferring the human microrna functional similarity and functional network based on microrna-associated diseases. Bioinformatics 26, 1644–1650. doi:10.1093/bioinformatics/btq241
Wang, S., Cho, H., Zhai, C., Berger, B., and Peng, J. (2015). Exploiting ontology graph for predicting sparsely annotated gene function. Bioinformatics 31, i357–i364. doi:10.1093/bioinformatics/btv260
Wang, T., Yi, H.-C., You, Z.-H., Li, L.-P., Wang, Y.-B., Hu, L., et al. (2019). “A gated recurrent unit model for drug repositioning by combining comprehensive similarity measures and Gaussian interaction profile kernel,” in Intelligent computing theories and application: 15th international conference, ICIC 2019, nanchang, China, august 3–6, 2019, proceedings, Part II 15 (Springer), 344–353.
Wang, W., Zhang, X., and Dai, D.-Q. (2021). Defusion: a denoised network regularization framework for multi-omics integration. Briefings Bioinforma. 22, bbab057. doi:10.1093/bib/bbab057
Wang, X., Cheng, Y., Yang, Y., Yu, Y., Li, F., and Peng, S. (2023). Multitask joint strategies of self-supervised representation learning on biomedical networks for drug discovery. Nat. Mach. Intell. 5, 445–456. doi:10.1038/s42256-023-00640-6
Wang, Y.-J., Gong, W.-G., Ren, Q.-G., and Zhang, Z.-J. (2020). Escitalopram alleviates alzheimer’s disease-type tau pathologies in the aged p301l tau transgenic mice. J. Alzheimer’s Dis. 77, 807–819. doi:10.3233/JAD-200401
Wishart, D. S., Feunang, Y. D., Guo, A. C., Lo, E. J., Marcu, A., Grant, J. R., et al. (2018). Drugbank 5.0: a major update to the drugbank database for 2018. Nucleic acids Res. 46, D1074–D1082. doi:10.1093/nar/gkx1037
Ye, H., Liu, Q., and Wei, J. (2014). Construction of drug network based on side effects and its application for drug repositioning. PloS one 9, e87864. doi:10.1371/journal.pone.0087864
Younis, W., Thangamani, S., and N Seleem, M. (2015). Repurposing non-antimicrobial drugs and clinical molecules to treat bacterial infections. Curr. Pharm. Des. 21, 4106–4111. doi:10.2174/1381612821666150506154434
Yu, Z., Huang, F., Zhao, X., Xiao, W., and Zhang, W. (2021). Predicting drug–disease associations through layer attention graph convolutional network. Briefings Bioinforma. 22, bbaa243. doi:10.1093/bib/bbaa243
Zhang, C., Zang, T., and Zhao, T. (2024). Kge-unit: toward the unification of molecular interactions prediction based on knowledge graph and multi-task learning on drug discovery. Briefings Bioinforma. 25, bbae043. doi:10.1093/bib/bbae043
Zhang, G., Gao, Z., Yan, C., Wang, J., Liang, W., Luo, J., et al. (2023). Kgansynergy: knowledge graph attention network for drug synergy prediction. Briefings Bioinforma. 24, bbad167. doi:10.1093/bib/bbad167
Zhang, M.-L., Zhao, B.-W., Su, X.-R., He, Y.-Z., Yang, Y., and Hu, L. (2022a). Rlfdda: a meta-path based graph representation learning model for drug–disease association prediction. BMC Bioinforma. 23, 516. doi:10.1186/s12859-022-05069-z
Zhang, W., Yue, X., Huang, F., Liu, R., Chen, Y., and Ruan, C. (2018). Predicting drug-disease associations and their therapeutic function based on the drug-disease association bipartite network. Methods 145, 51–59. doi:10.1016/j.ymeth.2018.06.001
Zhang, X., Wang, W., Ren, C.-X., and Dai, D.-Q. (2022b). Learning representation for multiple biological networks via a robust graph regularized integration approach. Briefings Bioinforma. 23, bbab409. doi:10.1093/bib/bbab409
Zhang, Y., Chen, M., Cheng, X., and Wei, H. (2020a). Msfsp: a novel mirna–disease association prediction model by federating multiple-similarities fusion and space projection. Front. Genet. 11, 389. doi:10.3389/fgene.2020.00389
Zhang, Y., Chen, M., Li, A., Cheng, X., Jin, H., and Liu, Y. (2020b). Ldai-isps: lncrna–disease associations inference based on integrated space projection scores. Int. J. Mol. Sci. 21, 1508. doi:10.3390/ijms21041508
Zheng, X., Ding, H., Mamitsuka, H., and Zhu, S. (2013). “Collaborative matrix factorization with multiple similarities for predicting drug-target interactions,” in Proceedings of the 19th ACM SIGKDD international conference on Knowledge discovery and data mining, 1025–1033.
Žitnik, M., Janjić, V., Larminie, C., Zupan, B., and Pržulj, N. (2013). Discovering disease-disease associations by fusing systems-level molecular data. Sci. Rep. 3, 3202. doi:10.1038/srep03202
Keywords: drug repositioning, drug-disease interaction prediction, multi-similarity fusion, biomedical knowledge graph, feature fusion
Citation: Luo H, Yang H, Zhang G, Wang J, Luo J and Yan C (2025) KGRDR: a deep learning model based on knowledge graph and graph regularized integration for drug repositioning. Front. Pharmacol. 16:1525029. doi: 10.3389/fphar.2025.1525029
Received: 08 November 2024; Accepted: 13 January 2025;
Published: 11 February 2025.
Edited by:
Chong Xu, China Pharmaceutical University, ChinaReviewed by:
Ju Xiang, Changsha University of Science and Technology, ChinaWei Peng, Kunming University of Science and Technology, China
Copyright © 2025 Luo, Yang, Zhang, Wang, Luo and Yan. This is an open-access article distributed under the terms of the Creative Commons Attribution License (CC BY). The use, distribution or reproduction in other forums is permitted, provided the original author(s) and the copyright owner(s) are credited and that the original publication in this journal is cited, in accordance with accepted academic practice. No use, distribution or reproduction is permitted which does not comply with these terms.
*Correspondence: Chaokun Yan, Y2t5YW5AaGVudS5lZHUuY24=