 Xiwei Ji
 Yimin Cui
94% of researchers rate our articles as excellent or good
Learn more about the work of our research integrity team to safeguard the quality of each article we publish.
Find out more
ORIGINAL RESEARCH article
Front. Pharmacol. , 04 March 2025
Sec. Drug Metabolism and Transport
Volume 16 - 2025 | https://doi.org/10.3389/fphar.2025.1477607
Introduction: TDI01 is a novel and highly selective ROCK2 inhibitor, which provides a potential valuable candidate for the treatment of ALI/ARDS due to COVID-19.
Methods: The objective of this study was to develop Pop-PK models to characterize the PK properties of TDI, and to guide the choice of suitable clinical dosage regimens via model-based simulation.
Results: The completed clinical study suggested a double peak phenomenon, which could be observed after single administration of TDI01. Thus, a one-compartment model with dosage effect and hepato-enteral circulation were developed to describe the PK profiles of TDI01 in vivo. Results from the simulation show that the drug accumulation observed after multiple doses would not affect the safety of TID01 usage under the tested dosage regimen.
Discussion: The established model and simulation provide a useful approach to maximize the clinical medication safety and therapeutic efficacy of TDI01.
TDI01 is a novel ROCK2 inhibitor that has been tested in clinical trials for the treatment of idiopathic pulmonary fibrosis and silicosis. The study results suggested that TDI01 protected against inflammation and vascular leakage in LPS-induced acute lung injury/acute respiratory distress syndrome (ALI/ARDS) caused by mild, moderate to severe coronavirus disease 2019 (COVID-19) (Hu, Guo, Zhou and Shi, 2021). Additionally, TDI01 can rescue endothelial dysfunction by reducing the expression of VCAM1 and ICAM1, weakening inflammatory cell adhesion and attenuating permeability (Deng et al., 2023).
Model-informed drug development (MIDD) is considered as an important component of modern drug development, which applies various models derived from preclinical and clinical data sources to address drug development or promote decision-making process (Marshall et al., 2016; Venkatakrishnan et al., 2015; Wilkins et al., 2017). In this study, the MIDD approaches are utilized with the aim to optimize benefit–risk and improving TDI01 development efficiency.
The purpose of this study was to develop Pop-PK models to characterize the PK properties of TDI, and to guide the choice of clinical dosage regimens by model-based simulation. Ultimately, the PK modeling and simulation may provide a feasible approach to assure the clinical medication safety.
PK data from the clinical phase I study (clinical trial approval of TDI01 was obtained from Beijing Tide Pharmaceutical Co., Ltd. Study participants received single-dose or multiple-dose oral administration of TDI01. The single-dose regimens included: 400 mg QD, 800 mg QD, and 1200 mg QD; the multiple-dose regimens included: 200 mg QD, 7 days and 400 mg QD, 7 days. Blood samples in single dose groups were collected prior to drug administration (0 h) and at 1, 2, 3, 3.5, 4, 5, 6, 8, 10, 12, 24, 36, 48, and 72 h post administration. Blood samples in multiple dose groups were collected at 0, 1, 2, 3, 3.5, 4, 5, 6, 8, 10, 12, 24, 48, 72, 96, 120, 144, 145, 146, 147, 147.5, 148, 149, 150, 152, 154, 156, 168, 180, 192, and 216 h.
Conventional compartmental PK models were tested sequentially. Model selection was based on changes in the Akaike information criterion (AIC), the precision of parameter estimates (relative standard errors, RSE) and standard goodness-of-fit (GoF) plots (Lindbom, Pihlgren and Jonsson, 2005).
One-compartment, two-compartment and hepato-enteral circulation models were investigated. After comparing the AIC and the model-fitting degree, optimal model was utilized as the structural model. The covariates known with significant impact were also included in the structural model firstly. The First-order conditional estimation with interaction (FOCEI) was used to fit the parameters in this analysis.
The random effects model included inter-individual random effects and residual random effects. An exponential model (Equation 1) was used to describe inter-individual variation, shown as follows:
where Pi is the PK parameter of each individual,
where,
The final PK model was evaluated graphically on GoF plots, including observed values versus individual prediction or population prediction, conditional weighted residuals (CWRES) versus TIME, absolute individual weighted residuals (|IWRES|) versus individual predictions, and the normality test of CWRES.
Bootstrap was performed to internally validate the final model. The original dataset was used to simulate 1,000 additional datasets, each of which was used to re-estimate the parameters with the final model. Median values and 95% confidence intervals (CI) were calculated and compared with the final model parameter estimates to assess the robustness of the final model.
Visual predictive checks (VPCs) were used to evaluate the predictive power of the final model. One thousand simulations were implemented and the 2.5th, 50th and 97.5th percentiles of the observed versus simulated data were compared.
Analyte concentrations that were below the lower limit of quantification (LLOQ) were reported as data below the quantification limit (BQL). If the proportion of BQL data was larger than 10%, the likelihood-based approach (such as the M1 method) along with Laplacian estimation was used (Ahn et al., 2008; Beal, 2001). Observations corresponded to absolute conditional weighted residuals of more than 5 (|CWRES| > 5) were regarded as outliers and omitted from the model-building process. These omitted points were re-introduced into the dataset and model evaluation at a later stage (sensitivity analysis) was performed to assess their impact on parameter estimates.
The population PK model was performed using NONMEM (version 7.5, ICON Development Solutions, Ellicott City, MD, United States). First order conditional estimation with interaction (FOCEI) method was used for parameter estimation (Keizer et al., 2013). R (version 3.5.3) was used for data preparation, graphical analysis, model diagnostics, and statistical summaries. Xpose® (Jonsson and Karlsson, 1999) and Pearl Speaks NONMEM (PsN®, version 4.8.0) (Lindbom, et al., 2005; Lindbom et al., 2004) were used for model diagnostics and to facilitate other model development tasks.
In this study, the proportion of BQL data in the overall data is 1.3% (10/786). A total of 776 blood drug concentrations from 39 subjects was included in the data set. As shown in Figure 1, the double peak phenomenon observed after single dosing indicated hepato-enteral circulation model should be included in the final model, and the starting and ending time of hepato-enteral circulation was set as 8–10 h.
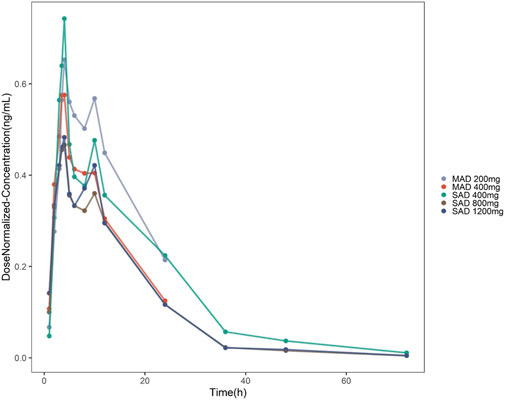
Figure 1. Concentration–time profiles of TDI01 after dose normalization in single-dose and multiple-dose clinical trials (single-dose regimens: 400 mg QD, 800 mg QD and 1,200 mg QD; multiple-dose regimens: 200 mg QD, 7 days and 400 mg QD, 7 days).
The PK properties of TID01 were described by a one-compartment model with dosage effect and hepato-enteral circulation (Figure 2), which was described by the equations (Equations 3–5) as follows:
where K20 is the clearance rate constant of central compartment; Ka represents first-order absorption rate constant; K2G represents rate constants for TDI01 from the central compartment to the gallbladder compartment; KG1 represents rate constants for TDI01 from the gallbladder compartment to the absorption compartment. A, A (1) and A (2) represent absorption, central and gallbladder compartments, respectively. FLAG means the time switch of hepato-enteral circulation.
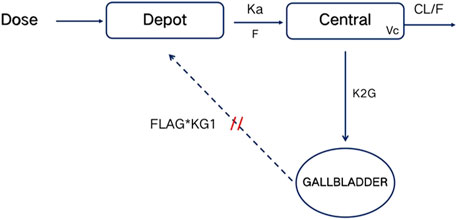
Figure 2. Schematic diagram of PK model. Depot, Central and GALLBLADDER designate the absorption, central and gallbladder compartments, respectively. CL represents clearance rate. Ka represents first-order absorption rate constant; K2G represents rate constants for TDI01 from the central compartment to the gallbladder compartment; KG1 represents rate constants for TDI01 from the gallbladder compartment to the absorption compartment. FLAG means the time switch of hepato-enteral circulation.
The established model reasonably fit the time courses of TDI01 in the circulatory system with clearance (CL/F) of 95 L/h, volume of distribution (Vc/F) of 1400 L and the absorption rate constant (ka/F) of 0.345 h−1, respectively (Table 1). As shown in the table, all the model parameters were precisely estimated with relative standard error below 20%. Bootstrap results suggested that the estimated values of the final model parameters were close to the median and within the 95% CI from the non-parametric bootstrap. The goodness-of-fit plots for the developed models are shown in Figure 3. The observed values versus the population and individual predicted values were closely distributed around the line of identity. The conditional weighted residuals were randomly and homogenously distributed around 0. One thousand simulations were implemented and the 2.5th, 50th, and 97.5th percentiles of the observed versus simulated data were compared, as shown in the VPCs of single-ascending doses and multiple-ascending doses (Figures 4, 5). The VPC results for the Pop-PK model indicated that the established models were able to adequately describe the observed plasma concentrations, where most observed plasma concentrations fell within the 95% prediction intervals.
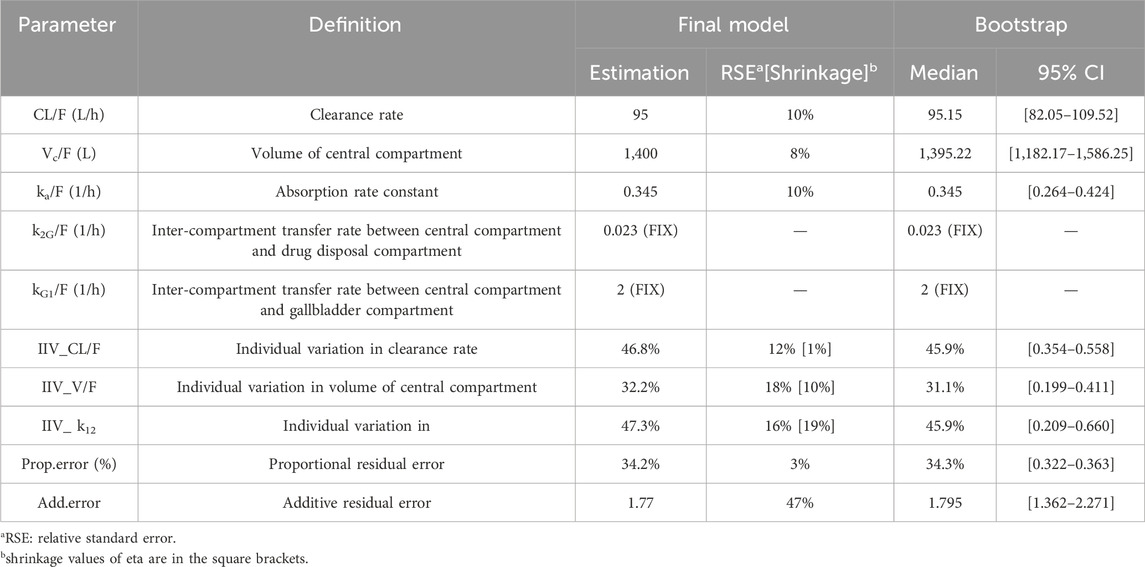
Table 1. PK parameter and bootstrap of TDI01 final Pop-PK models.
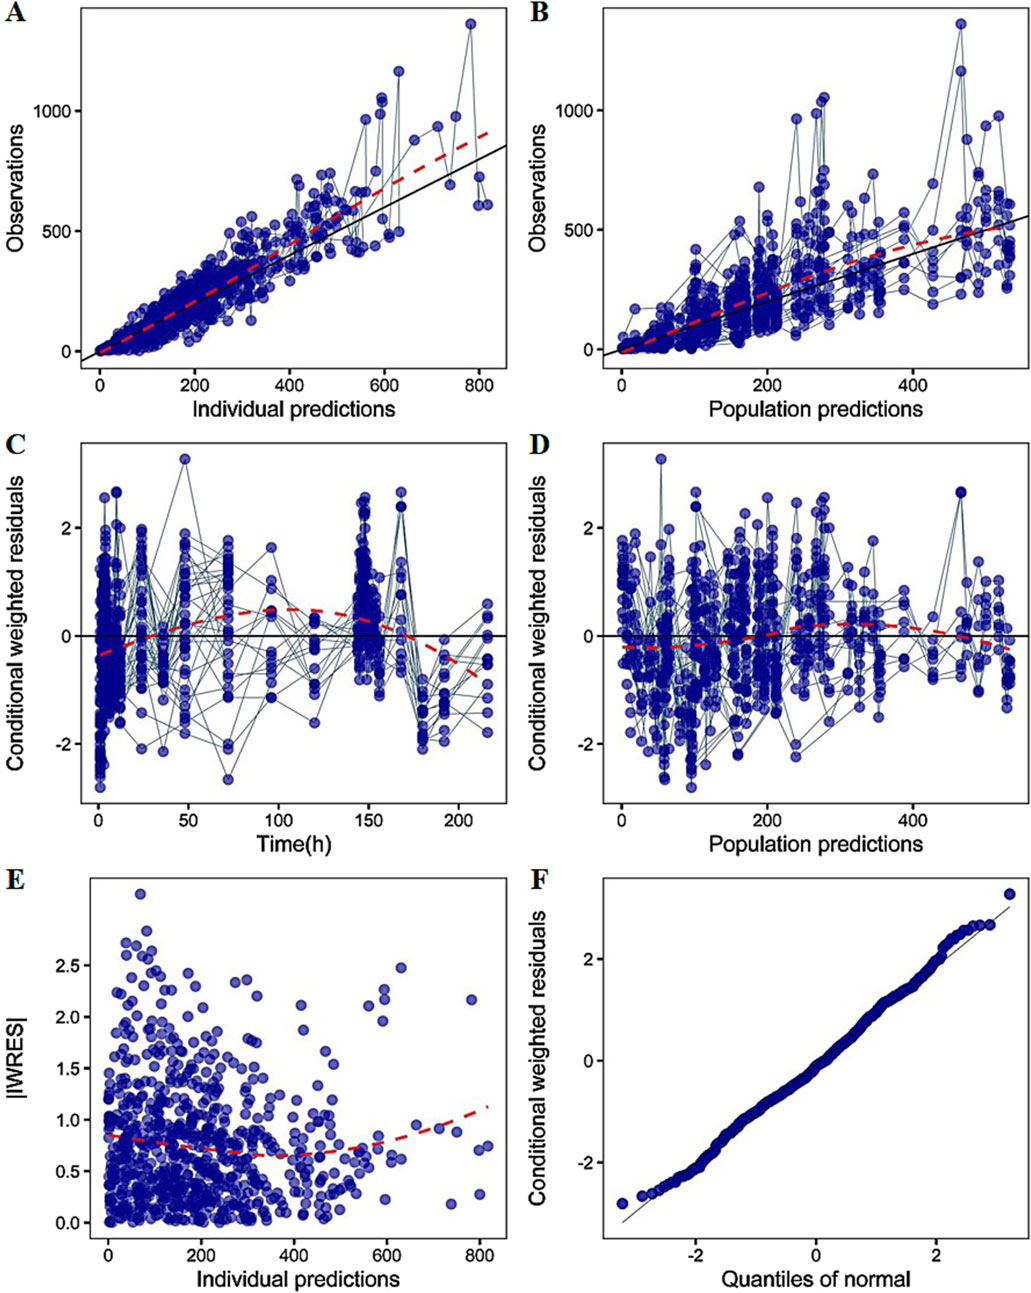
Figure 3. The goodness-of-fit plots of PK model (A) Relationship between observed versus IPRED of PK (B) Relationship between observed versus PRED of PK (C) CWRES at different time points (D) CWRES at different PRED (E) |IWRES| at different IPRED (F) Quantile–quantile (Q–Q) plot of WRES. CWRES: conditional weighted residuals; WRES: weighted residuals; |IWRES|: absolute individual weighted residuals; PRED: predicted value; IPRED: individual predicted value. The solid lines represent the x = y lines. The dotted lines are the trend lines.
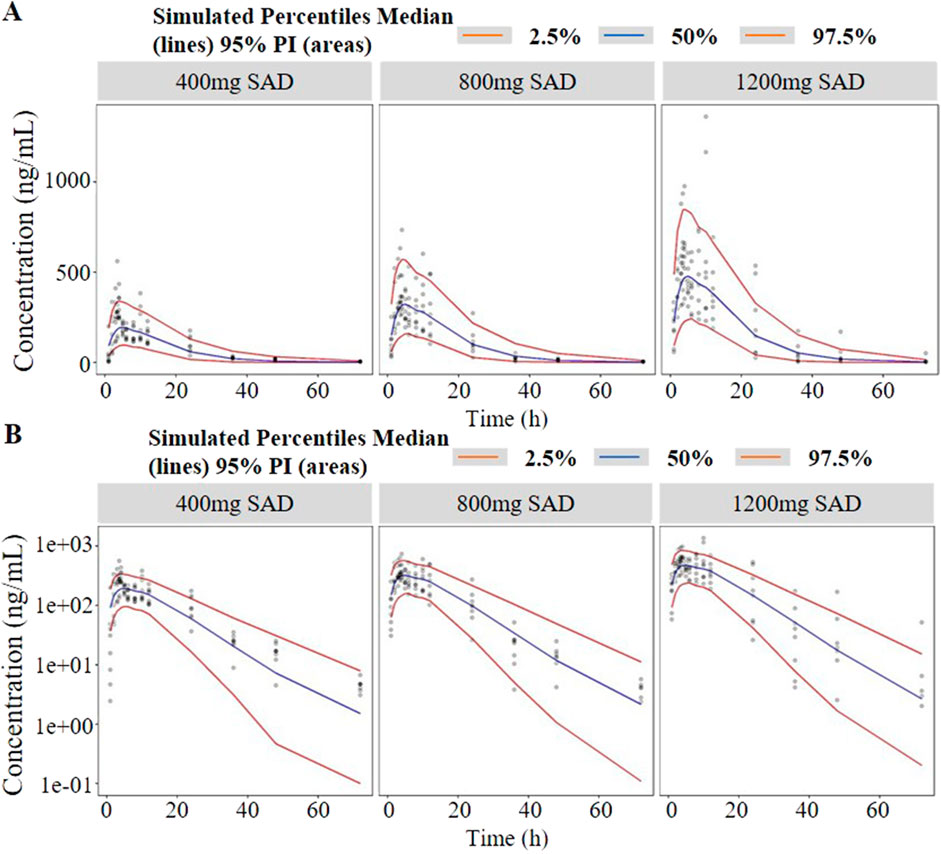
Figure 4. Visual predictive check (VPC) of single-ascending doses ((A) in arithmetic scale; (B) in logarithmic scale). The red lines represent the 2.5th and 97.5th percentiles of the observed versus simulated data. The range between the red lines depicts the 95th percentile intervals. The blue lines represent the medians of simulated data. Circles represent the observed data.
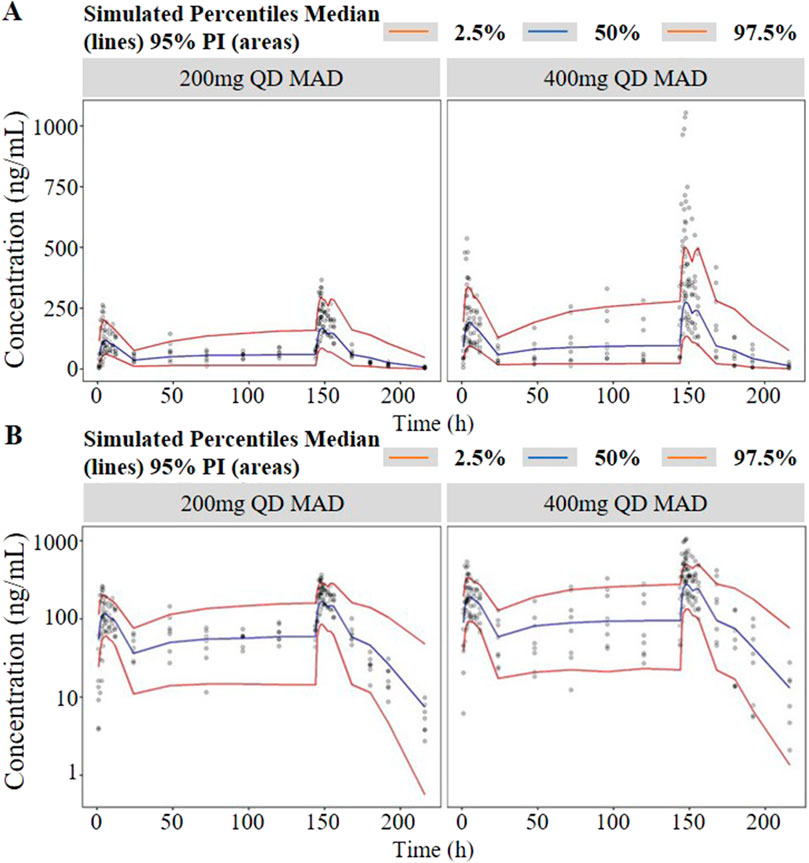
Figure 5. Visual predictive check (VPC) of multiple-ascending doses ((A) in arithmetic scale; (B) in logarithmic scale). The red lines represent the 2.5th and 97.5th percentiles of the observed versus simulated data. The range between the red lines depicts the 95th percentile intervals. The blue lines represent the medians of simulated data. Circles represent the observed data.
The simulated concentration-time profiles of TID01 under the designed dose regimens are shown in Figure 6. The regimens are listed in Table 2. The simulated PK parameters are listed in Table 3, which indicated that the Cmax and AUC values at steady state of 200 mg BID (tested dose regimen) were higher than those of 400 mg QD (dose regimen used in clinical trials), but the differences were less than 25%. As shown in Figure 6, the simulated concentrations of TID01 in blood under the dosages of 200 mg BID, 7 days and 400 mg QD, 7 days are less than the Cmax of 1,391 ng/mL under the highest single dose (1,200 mg) in clinical trial. The simulation results demonstrated the drug accumulation caused by hepato-enteral circulation would not affect the safety of TID01 usage under the tested multiple dosage regimen.
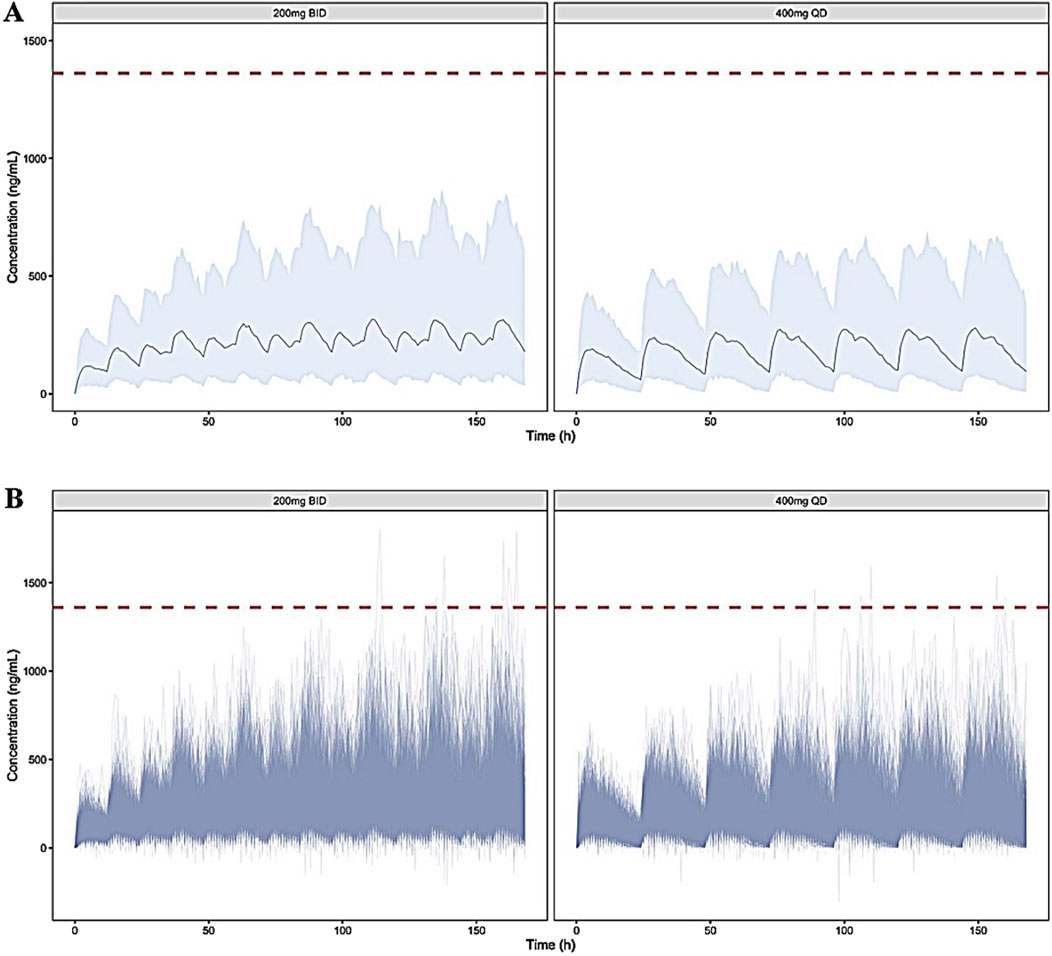
Figure 6. Simulated blood concentration-time profiles of TDI01 under the dosages of 200 mg BID, 7 days and 400 mg QD, 7 days ((A) distribution of mean values; (B) distribution of individual values). The gray area depicts the 95th percentile intervals. The red dashed lines represent the Cmax of 1,391 ng/mL under the highest single dose (1,200 mg) in clinical trial.
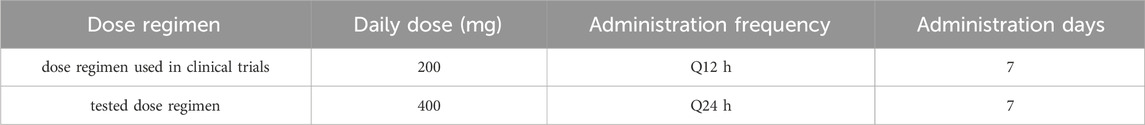
Table 2. The regimens of TDI01 used in Monte Carlo simulation.
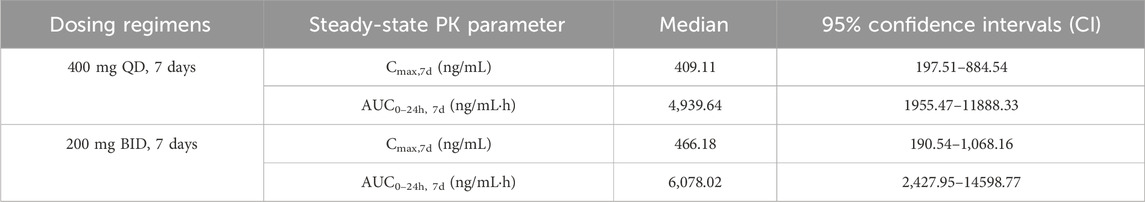
Table 3. Simulation of TDI01 PK parameters.
As shown in the previous clinical study, the double peak phenomenon could be observed after single administration of TDI01. The simulation results suggested blood concentrations after continuous administration of TID01 are less than the Cmax of 1,391 ng/mL under the highest single dose (1,200 mg) in clinical trial, which indicated the drug accumulation caused by hepato-enteral circulation would not affect the safety of TID01 usage under the tested multiple dosage regimens. The characteristic of multiple releases with time-dependent effects after a single dose indicated that hepato-enteral circulation model should be included in the PK model of TDI01 to describe its process in vivo.
As shown in Figure 1, the analysis results of blood drug concentration after dose normalization suggested that bioavailability in low dose groups (200 mg and 400 mg) was higher than that in high dose groups (800 mg and 1,200 mg), which need more clinical evidence to support this conclusion. The results of external validation indicated that the established models exert acceptable prediction capability on the plasma concentration-time profiles of TDI01 after single- and multiple-dose, but there are some bias in predicting the high concentrations (Figures 4, 5).
Our study has several limitations. The data used to develop the Pop-PK models were derived from 39 healthy subjects. The restricted sample size and homogeneous demographic profile may not represent the broader patient population, and potentially overlooked critical covariates affecting PK characters. Therefore, further empirical evidence is necessary to validate the proposed PK models. Patient studies, particularly the patients suffering different severities of ALI/ARDS, and multi-center trials may be used to address the limitations of the current work.
The covariate model was not developed in this study for the following reasons: (1) The PK data was obtained from healthy subjects, and their demographic and physiological characteristics were similar, so it is difficult to select significant covariates; (2) The purpose of this study was to evaluate the in vivo exposure level of TDI01 in the subjects after single- and multiple-dose through simulation.
In summary, the proposed Pop-PK model allowed a thorough interpretation of the pharmacokinetic character of TDI01. Additionally, the established hepato-enteral circulation model can be used to fit the double peak phenomenon induced by the hepato-enteral circulation. Furthermore, the model-based simulation may be helpful in guiding the choice of dosage regimens for TDI01, eventually assist in assuring the clinical medication safety and maximizing therapeutic efficacy.
The raw data supporting the conclusions of this article will be made available by the authors, without undue reservation.
The studies involving humans were approved by People’s Liberation Army General Hospital Medical Ethical Committee. The studies were conducted in accordance with the local legislation and institutional requirements. The participants provided their written informed consent to participate in this study.
XJ: Conceptualization, Data curation, Formal Analysis, Funding acquisition, Investigation, Methodology, Project administration, Software, Writing–original draft. YC: Conceptualization, Formal Analysis, Investigation, Supervision, Validation, Writing–review and editing.
The author(s) declare that financial support was received for the research, authorship, and/or publication of this article. This work was supported by National Key Research and Development Program of China [grant number 2022YFC0868800].
The authors declare that the research was conducted in the absence of any commercial or financial relationships that could be construed as a potential conflict of interest.
The author(s) declare that no Generative AI was used in the creation of this manuscript.
All claims expressed in this article are solely those of the authors and do not necessarily represent those of their affiliated organizations, or those of the publisher, the editors and the reviewers. Any product that may be evaluated in this article, or claim that may be made by its manufacturer, is not guaranteed or endorsed by the publisher.
NONMEM, nonlinear mixed-effect modeling; Pop-PK, Population pharmacokinetic; VPC, visual predictive check; CWRES, Conditional weighted residuals; FOCEI, first-order conditional estimation with interaction; OFV, Objective function value; AIC, Akaike information criterion.
Ahn, J. E., Karlsson, M. O., Dunne, A., and Ludden, T. M. (2008). Likelihood based approaches to handling data below the quantification limit using NONMEM VI. J. Pharmacokinet. Pharmacodyn. 35, 401–421. doi:10.1007/s10928-008-9094-4
Beal, S. L. (2001). Ways to fit a PK model with some data below the quantification limit. J. Pharmacokinet. Pharmacodyn. 28, 481–504. doi:10.1023/a:1012299115260
Deng, Y., Huang, X., Hu, Y., Zhong, W., Zhang, H., Mo, C., et al. (2023). Deficiency of endothelial FGFR1 signaling via upregulation of ROCK2 activity aggravated ALI/ARDS. Front. Immunol. 14, 1041533. doi:10.3389/fimmu.2023.1041533
Hu, B., Guo, H., Zhou, P., and Shi, Z. L. (2021). Characteristics of SARS-CoV-2 and COVID-19. Nat. Rev. Microbiol. 19, 141–154. doi:10.1038/s41579-020-00459-7
Jonsson, E. N., and Karlsson, M. O. (1999). Xpose--an S-PLUS based population pharmacokinetic/pharmacodynamic model building aid for NONMEM. Comput. Methods Programs Biomed. 58, 51–64. doi:10.1016/s0169-2607(98)00067-4
Keizer, R. J., Karlsson, M. O., and Hooker, A. (2013). Modeling and simulation workbench for NONMEM: tutorial on pirana, PsN, and xpose. CPT Pharmacometrics Syst. Pharmacol. 2, e50. doi:10.1038/psp.2013.24
Lindbom, L., Pihlgren, P., and Jonsson, E. N. (2005). PsN-Toolkit--a collection of computer intensive statistical methods for non-linear mixed effect modeling using NONMEM. Comput. Methods Programs Biomed. 79, 241–257. doi:10.1016/j.cmpb.2005.04.005
Lindbom, L., Ribbing, J., and Jonsson, E. N. (2004). Perl-speaks-NONMEM (PsN)--a Perl module for NONMEM related programming. Comput. Methods Programs Biomed. 75, 85–94. doi:10.1016/j.cmpb.2003.11.003
Marshall, S. F., Burghaus, R., Cosson, V., Cheung, S. Y. A., Chenel, M., DellaPasqua, O., et al. (2016). Good practices in model-informed drug discovery and development: practice, application, and documentation. CPT Pharmacometrics and Syst. Pharmacol. 5, 93–122. doi:10.1002/psp4.12049
Venkatakrishnan, K., Friberg, L. E., Ouellet, D., Mettetal, J. T., Stein, A., Trocóniz, I. F., et al. (2015). Optimizing oncology therapeutics through quantitative translational and clinical pharmacology: challenges and opportunities. Clin. Pharmacol. and Ther. 97, 37–54. doi:10.1002/cpt.7
Wilkins, J. J., Chan, P. L. S., Chard, J., Smith, G., Smith, M. K., Beer, M., et al. (2017). Thoughtflow: standards and tools for provenance capture and workflow definition to support model-informed drug discovery and development. CPT Pharmacometrics and Syst. Pharmacol. 6, 285–292. doi:10.1002/psp4.12171
Keywords: Pop-PK, TDI01, hepato-enteral circulation, model-informed drug development, simulation
Citation: Ji X and Cui Y (2025) Model-informed drug development of novel ROCK2 inhibitor TDI01: population pharmacokinetic study and simulation. Front. Pharmacol. 16:1477607. doi: 10.3389/fphar.2025.1477607
Received: 14 November 2024; Accepted: 10 February 2025;
Published: 04 March 2025.
Edited by:
Jiangxin Wang, Shenzhen University, ChinaCopyright © 2025 Ji and Cui. This is an open-access article distributed under the terms of the Creative Commons Attribution License (CC BY). The use, distribution or reproduction in other forums is permitted, provided the original author(s) and the copyright owner(s) are credited and that the original publication in this journal is cited, in accordance with accepted academic practice. No use, distribution or reproduction is permitted which does not comply with these terms.
*Correspondence: Yimin Cui, Y3VpLnBoYXJtQHBrdWZoLmNvbQ==
Disclaimer: All claims expressed in this article are solely those of the authors and do not necessarily represent those of their affiliated organizations, or those of the publisher, the editors and the reviewers. Any product that may be evaluated in this article or claim that may be made by its manufacturer is not guaranteed or endorsed by the publisher.
Research integrity at Frontiers
Learn more about the work of our research integrity team to safeguard the quality of each article we publish.