- 1Michael Smith Laboratories, University of British Columbia, Vancouver, BC, Canada
- 2Vancouver Prostate Centre, Vancouver General Hospital, Vancouver, BC, Canada
- 3Centre for Blood Research, University of British Columbia, Vancouver, BC, Canada
- 4Department of Microbiology and Immunology, University of British Columbia, Vancouver, BC, Canada
- 5Centre for Lymphoid Cancer, British Columbia Cancer Research Institute, Vancouver, BC, Canada
- 6Lymphoid Cancer Research, British Columbia Cancer Research Institute, Vancouver, BC, Canada
- 7Department of Pathology and Laboratory Medicine, University of British Columbia, Vancouver, BC, Canada
- 8Djavad Mowafaghian Centre for Brain Health, University of British Columbia, Vancouver, BC, Canada
- 9Department of Medical Genetics, University of British Columbia, Vancouver, BC, Canada
- 10Department of Urological Sciences, University of British Columbia, Vancouver, BC, Canada
- 11Department of Zoology, University of British Columbia, Vancouver, BC, Canada
Cell surface calcium (Ca2+) channels permit Ca2+ ion influx, with Ca2+ taking part in cellular functions such as proliferation, survival, and activation. The expression of voltage-dependent Ca2+ (CaV) channels may modulate the growth of hematologic cancers. Profile analysis of Ca2+ channels, with a focus on the Ca2+ release-activated Ca2+ (CRAC) and L-type CaV channels, was performed on RNA sequencing data from lymphoma cell lines and samples derived from patients with diffuse large B cell lymphoma (DLBCL). CaV1.2 expression was found to be elevated in classical Hodgkin lymphoma (CHL) cell lines when compared to other B cell lymphoma cell lines. In contrast, CHL exhibited reduced expression of ORAI2 and STIM2. In our differential expression analysis comparing activated B cell-like DLBCL (ABC-DLBCL) and germinal centre B cell-like DLBCL (GCB-DLBCL) patient samples, ABC-DLBCL revealed stronger expression of CaV1.3, whereas CaV1.1, CaV1.2, and CaV1.4 showed greater expression levels in GCB-DLBCL. Interestingly, no differences in ORAI/STIM expression were noted in the patient samples. As Ca2+ is known to bind to calmodulin, leading to calcineurin activation and the passage of nuclear factor of activated T cells (NFAT) to the cell nucleus, pathways for calcineurin, calmodulin, NFAT, and Ca2+ signaling were also analyzed by gene set enrichment analysis. The NFAT and Ca2+ signaling pathways were found to be upregulated in the CHL cell lines relative to other B cell lymphoma cell lines. Furthermore, the calmodulin and Ca2+ signaling pathways were shown to be downregulated in the ABC-DLBCL patient samples. The findings of this study suggest that L-type CaV channels and Ca2+-related pathways could serve as differentiating components for biologic therapies in targeted lymphoma treatments.
Introduction
Hodgkin lymphoma, non-Hodgkin lymphoma (NHL), and leukemia collectively constitute 5.7% of all new cases of cancer (Sung et al., 2021). The ability to conduct expression profiling of genes has greatly contributed to knowledge pertaining to leukemia and lymphoma in terms of categorization of subtypes (Hoefnagel et al., 2005; Bobée et al., 2020), disease aggressiveness (Glas et al., 2005), and relapse (Yeoh et al., 2002). Differences in the expression of subunits of ion channels, including potassium (K+) channels, sodium (Na+) channels, and calcium (Ca2+) channels, have been noted in relapsed follicular lymphoma compared to counterparts who have not relapsed (Magi et al., 2019). The Ca2+ release-activated Ca2+ (CRAC) channel, a well-characterized example of a Ca2+ channel, consists of stromal interacting molecule (STIM) and ORAI proteins (Putney, 2018). Orai3 expression has been shown to be elevated in leukemia/multiple myeloma cell lines sensitive to tipifarnib when compared to a resistant myeloma cell line (Yanamandra et al., 2011). Furthermore, upregulation and downregulation of voltage-dependent Ca2+ (CaV) channel expression have been established for leukemia and lymphoma, along with many additional kinds of cancer (by publicly accessible data from microarrays), suggesting that the channels are engaged in the development of cancer (Wang et al., 2015; Phan et al., 2017).
Ca2+ channels are known to be positioned at the plasma membrane of the cell (Omilusik et al., 2013). Once Ca2+ is in the cell, it can guide proliferation, homeostasis, differentiation, survival, and activation by taking part in intracellular pathways (Omilusik et al., 2013). In T lymphocytes, for example, Ca2+ can bind to calmodulin, enabling the latter to activate the enzyme calcineurin once bound (Omilusik et al., 2013). Nuclear factor of activated T cells (NFAT) is dephosphorylated by calcineurin, leading to NFAT moving into the cell nucleus (Omilusik et al., 2013). NFAT has long been known to bind to the interleukin-2 (IL-2) promoter with activating protein-1 (AP-1) (Rao et al., 1997). Several other “transcriptional partners” of NFAT include T-bet at the 5’ enhancer for interferon (IFN)-γ and IFN-regulatory factor 4 (IRF4) at the promoter for interleukin-4 (IL-4) (Macian, 2005).
Considering the involvement of Ca2+ in lymphocyte processes, it would be useful to study Ca2+ channel expression more thoroughly in lymphoma. In order to accomplish this objective, patient samples and cell lines were assessed in the current study. This investigation focuses on diagnostic tissue from patients with diffuse large B cell lymphoma (DLBCL) and cell lines representing diverse types of lymphoma. Expanding on the calmodulin/calcineurin/NFAT signaling pathway, several pathways from BioCarta and the Kyoto Encyclopedia of Genes and Genomes (KEGG) were also examined. Here, we present expression profiles relating to Ca2+ channels - the CRAC and CaV channels in particular - and these pathways. This characterization of expression may aid in cultivating a comprehensive understanding of the molecular basis of lymphoma.
Materials and Methods
RNA Sequencing Data
RNA sequencing data were generated at the British Columbia Cancer Research Centre (BC Cancer) from 44 lymphoma cell lines representing multiple pathologies. These datasets were generated at multiple time points and were consolidated for analysis in this study (Table 1).
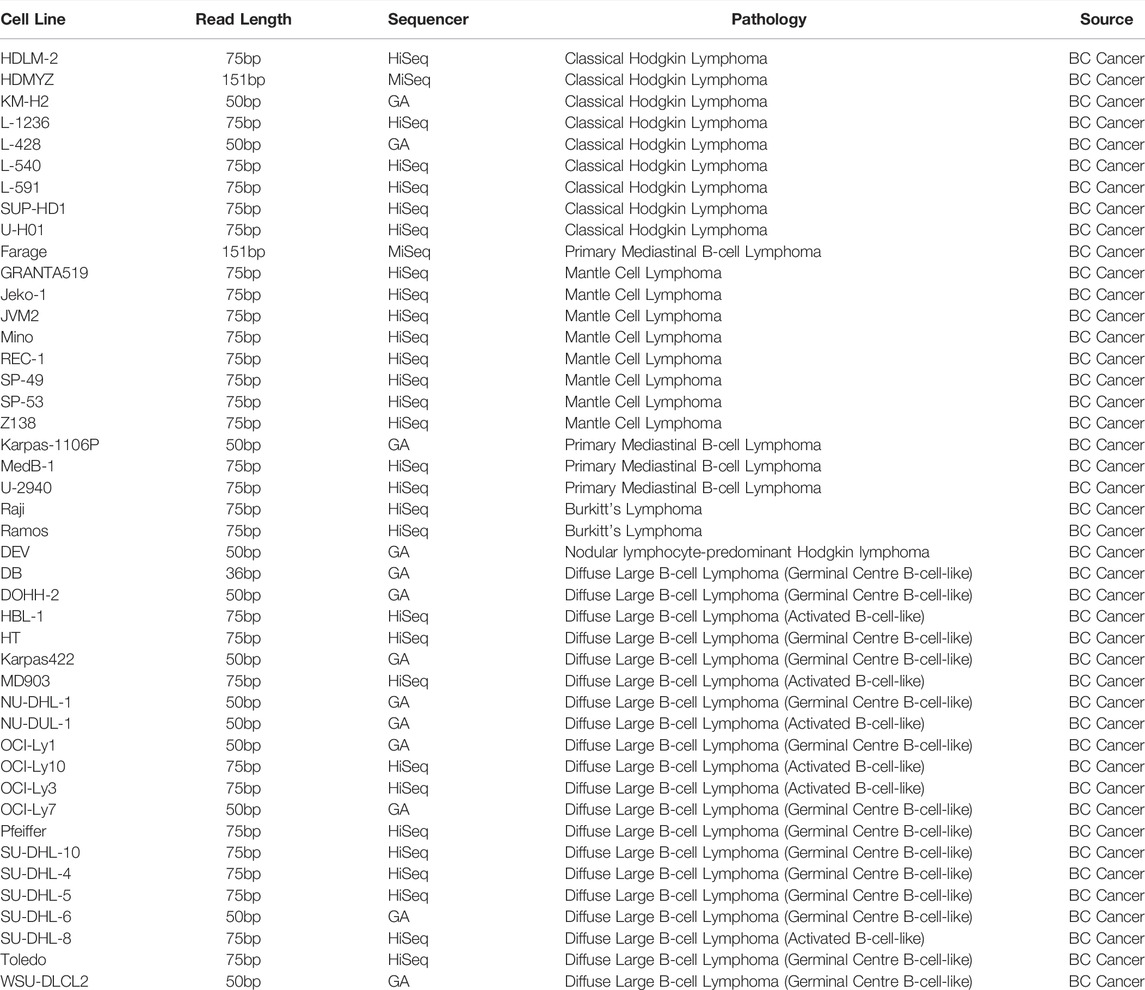
TABLE 1. Sequencing conditions used for RNA sequencing of lymphoma cell lines. Cell lines of various pathologies were included for analysis.
RNA sequencing reads from each cell line were aligned to the hg19 reference using the STAR aligner (v2.5.2a), which also generated per-gene counts with HTSeq.
RNA sequencing data from a previously published cohort of DLBCL patients were also analyzed (Ennishi et al., 2019). Patients whose tumours were successfully assigned to a subtype by the Lymph2Cx assay (Scott et al., 2014) were retained for analysis (N = 301). This included tumours classified as germinal centre B cell-like (GCB-DLBCL; N = 171), activated B cell-like (ABC-DLBCL; N = 96), or unclassified (N = 34). Sequencing data were re-aligned to the hg19 reference to generate counts using the same method as the cell lines.
Comparison of Ca2+ Channel Gene Expression
To compare the expression of the Ca2+ channel genes between different pathological groups, RNA sequencing counts from all samples were analyzed in R (v3.6.1) using the DESeq2 package (v1.26.0).
For cell lines, counts from all samples were read into a merged DESeqDataSet object, and lowly expressed genes (1 or fewer counts across all samples) were removed. The count data were then normalized using a variance-stabilizing transformation (vst function). Pairwise t-tests were used to compare normalized counts of numerous genes, such as Ca2+ channel genes of interest, between each combination of pathologies. For specific comparisons of interest, differential expression was also performed between pathological pairs (DESeq function), and the results for the Ca2+ channel genes (p value, adjusted p value (q value), and log2 fold change) were assessed. The same process was performed merging count data from all DLBCL patients and comparing groups by DLBCL subtype.
Gene Set Enrichment Analysis
In order to identify Ca2+ channel pathways that were potentially enriched in certain pathological comparisons, the differential expression results were used to perform gene set enrichment using the GSEA tool (v4.1.0). The GSEAPreranked module was used, ranking genes by their differential expression log2 fold change and investigating specific pathways of interest (Table 2).
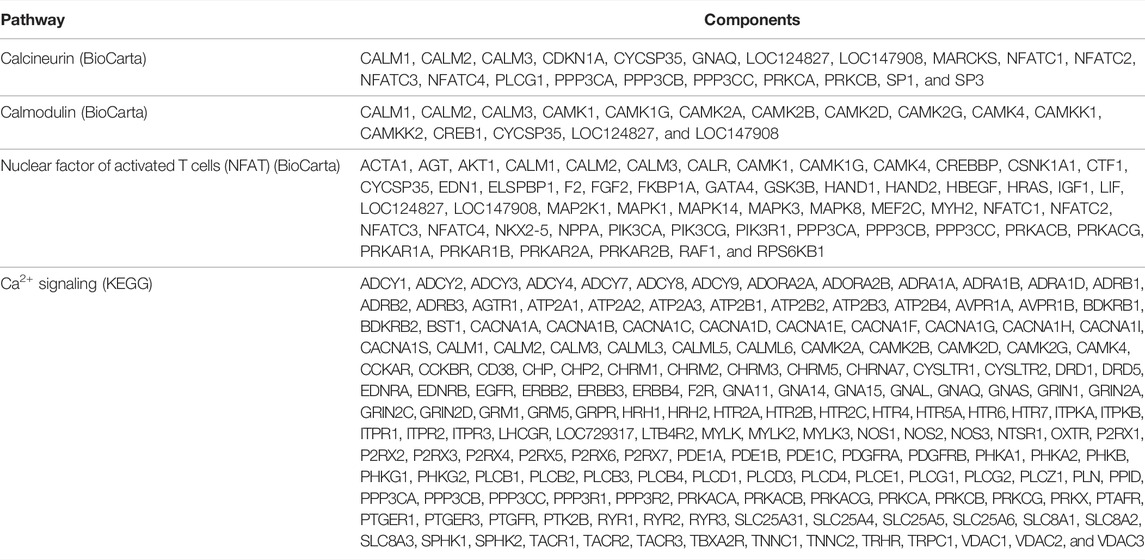
TABLE 2. BioCarta and KEGG pathways. Components of the calcineurin, calmodulin, NFAT, and Ca2+ signaling pathways are listed.
Results
ORAI Expression Varies Among Lymphoma Cell Lines
The included cell line categories consisted of classical Hodgkin lymphoma (CHL), primary mediastinal B cell lymphoma (PMBCL), nodular lymphocyte-predominant Hodgkin lymphoma (NLPHL), GCB-DLBCL, ABC-DLBCL, Burkitt’s lymphoma, and mantle cell lymphoma (MCL) (Figure 1A). Engagement at the T cell receptor leads to Ca2+ release from stores, such as the endoplasmic reticulum (ER), and Ca2+ entry at the plasma membrane in a process known as store-operated Ca2+ entry (SOCE) (Omilusik et al., 2013). STIM1 and STIM2 act as ER Ca2+ sensors, whereas ORAI1 (as well as ORAI2 and ORAI3) is a pore-forming molecule at the cell surface (Omilusik et al., 2013). RNA sequencing data were used to perform pairwise expression comparisons between the different cell line pathologies for multiple genes of interest, including those belonging to the ORAI/STIM family. In the current study, MCL cell lines exhibited greater ORAI1 expression when compared to those representing GCB-DLBCL (adjusted p value = 0.028) (Supplementary Table S1). As increased expression of cyclin D1 is a feature of MCL (Vogt et al., 2017), and cyclin D1 has been linked to Ca2+ signaling (Kahl and Means, 2004), the high ORAI1 expression in MCL was expected. Moreover, ORAI2 showed increased expression in ABC-DLBCL cell lines relative to CHL cell lines (adjusted p value = 0.046) (Supplementary Table S1). Interestingly, the pairwise cell line analysis did not indicate any significant differences in expression level for STIM1/2 (Supplementary Table S1), suggesting that ER Ca2+ sensing might not vary to a great extent across different types of lymphoma, although this would require further investigation.
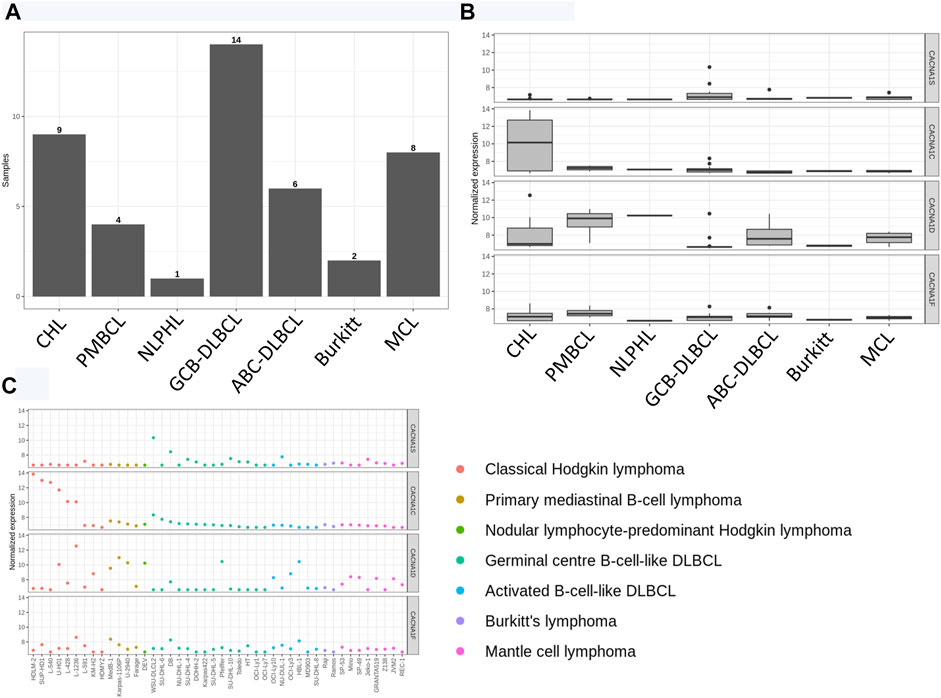
FIGURE 1. CaV1 channel expression in lymphoma cell lines. (A) Cell lines were classified according to pathology. (B) Expression (normalized and log-transformed counts) of the CaV1 channels (CACNA1S, CaV1.1; CACNA1C, CaV1.2; CACNA1D, CaV1.3; CACNA1F, CaV1.4). The boxes signify the interquartile range. The vertical lines correspond to the largest value that is no further than 1.5 times the interquartile range. The dots designate outliers. (C) CaV1 channel expression is shown for each cell line.
Although ORAI and STIM play important roles, other Ca2+ channels have been shown to be involved in lymphocyte function as well. We have previously provided evidence of voltage-dependent Ca2+ channel expression in the Jurkat cell line and peripheral blood T cells (Kotturi et al., 2003). Furthermore, we have previously characterized the role of CaV1.4 in lymphocytes, particularly T cells, highlighting its importance in SOCE and lymphocyte immune responses (Omilusik et al., 2011). In terms of B cells, increased CaV1.2 expression has been recorded for B cell childhood acute lymphoblastic leukemia and marginal zone B cell lymphoma (Wang et al., 2015). Given this, we investigated the CaV1 family in the current study to assess differences in expression among various lymphoma cell lines, with the normalized expression of the four CaV1 channels shown in Figures 1B,C. No statistically significant differences in CaV1 channel expression were observed for the comparisons listed in Table 3. As these comparisons already had the lowest q values (Table 3), differences in expression for other comparisons were also deemed not significant.

TABLE 3. Comparisons of L-type Ca2+ channel expression in cell lines. Statistical analysis is presented in the form of p values and q values.
CHL Exhibits Reduced CaV1.1 and Higher CaV1.2 Expression Levels Relative to Other Kinds of B Cell Lymphoma
The cell lines of the CHL category were of interest for further study due to the relatively high expression of CaV1.2 (Figure 1B). Differential expression was performed between the CHL cell lines and the other B cell lymphoma cell lines to assess the expression of the L-type Ca2+ channels (Figure 2A). Expression of CaV1.1 was significantly lower in CHL (adjusted p value = 0.004), and the expression of the CaV1.2 channel was significantly greater in CHL (adjusted p value = 1.8 × 10⁻¹⁶). Differential expression also showed that the expression levels of ORAI2 (adjusted p value = 0.00034) and STIM2 (adjusted p value = 0.0016) were lower in the CHL cell lines. In order to determine whether pathways related to Ca2+ were affected in CHL, three pathways from BioCarta and one from the KEGG were evaluated. Although no significant enrichment was detected between CHL and other B cell lymphomas for the calcineurin and calmodulin pathways, the NFAT (nominal p value <0.001; FDR q value <0.001; FWER p value <0.001) and KEGG Ca2+ signaling (nominal p value <0.001; FDR q value <0.001; FWER p value <0.001) pathways were found to be significantly upregulated in CHL (Figures 2B–E).
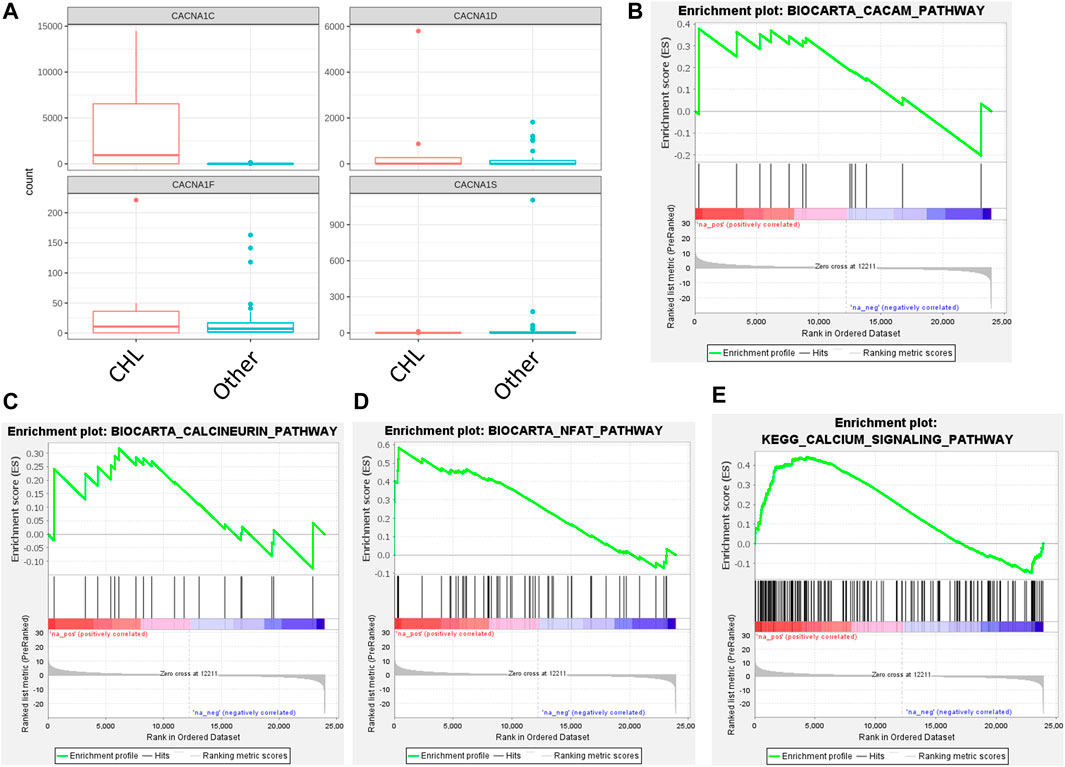
FIGURE 2. CaV1 channel expression and BioCarta/KEGG pathways in CHL cell lines. (A) CaV1 channel expression (CACNA1S, CaV1.1; CACNA1C, CaV1.2; CACNA1D, CaV1.3; CACNA1F, CaV1.4) in CHL and other B cell lymphomas. (B–E) Pathways for (B) calmodulin (BioCarta), (C) calcineurin (BioCarta), (D) NFAT (BioCarta), and (E) Ca2+ signaling (KEGG) were assessed for enrichment in the CHL cell lines relative to other varieties of B cell lymphoma.
Another category of cell lines that underwent more assessment was PMBCL due to the CaV1.3 channel showing relatively elevated expression (Figure 1B). However, differential expression analysis of the CaV1 channels found no significant differences when comparing PMBCL to other B cell lymphoma cell lines (data not shown). Similarly, differential expression did not show any differences in ORAI/STIM expression (data not shown). In PMBCL, none of the four pathways showed significant upregulation or downregulation according to GSEA (data not shown).
Expression Profile of CaV1.3 is Distinct From the Profiles of the Other CaV1 Channels in DLBCL Patient Samples
Aside from cell lines, the study of samples from patients with DLBCL was also conducted. Cell of origin was defined for patient samples, assigning each to ABC-DLBCL, GCB-DLBCL, or unclassified DLBCL (Figure 3). Numerous genes were evaluated for their expression levels with the use of RNA sequencing data, including the ORAI/STIM family. No differences in ORAI/STIM expression were observed from the pairwise comparisons (Table 4). To further assess the differences associated with DLBCL cell of origin, differential expression analysis was performed between ABC-DLBCL and GCB-DLBCL patient samples and used to assess the four CaV1 channels (Figure 4A). GCB-DLBCL demonstrated higher expression of CaV1.1 (adjusted p value = 2.2 × 10⁻¹⁰), CaV1.2 (adjusted p value = 2.5 × 10⁻⁶), and CaV1.4 (adjusted p value = 0.0013). In contrast, ABC-DLBCL displayed greater expression of CaV1.3 (adjusted p value = 0.0016). Differential expression analysis of the patient samples did not indicate any significant differences in ORAI/STIM expression between ABC-DLBCL and GCB-DLBCL (data not shown). For pathways associated with Ca2+, the calcineurin and NFAT pathways were unchanged between GCB-DLBCL and ABC-DLBCL (Figures 4C,D). However, the calmodulin (nominal p value = 0.037; FDR q value = 0.037; FWER p value = 0.032) and KEGG (nominal p value = 0.04; FDR q value = 0.04; FWER p value = 0.04) pathways were both downregulated in ABC-DLBCL (Figures 4B,E).
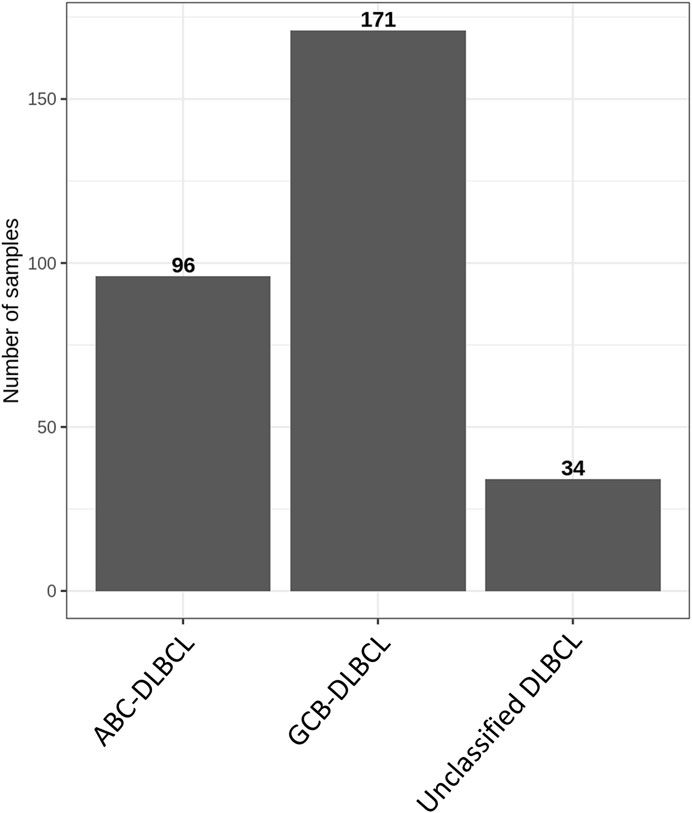
FIGURE 3. DLBCL patient cohort by cell of origin subtype. DLBCL patient samples (N = 301) were categorized as ABC-DLBCL (N = 96), GCB-DLBCL (N = 171), or unclassified DLBCL (N = 34) according to the Lymph2Cx assay.
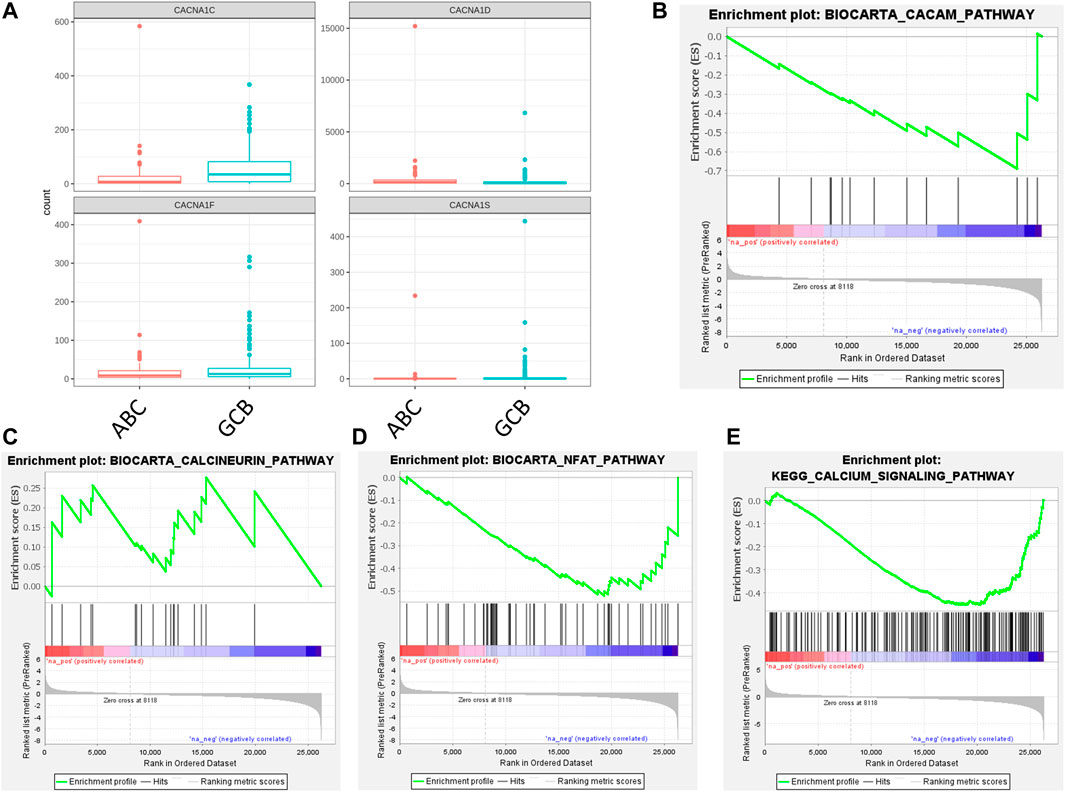
FIGURE 4. CaV1 channel expression and BioCarta/KEGG pathways in ABC-DLBCL and GCB-DLBCL patient samples. (A) CaV1 channel expression (CACNA1S, CaV1.1; CACNA1C, CaV1.2; CACNA1D, CaV1.3; CACNA1F, CaV1.4) in ABC-DLBCL and GCB-DLBCL. (B–E) Differential expression results were assessed for pathway enrichment of (B) calmodulin (BioCarta), (C) calcineurin (BioCarta), (D) NFAT (BioCarta), and (E) Ca2+ signaling (KEGG).
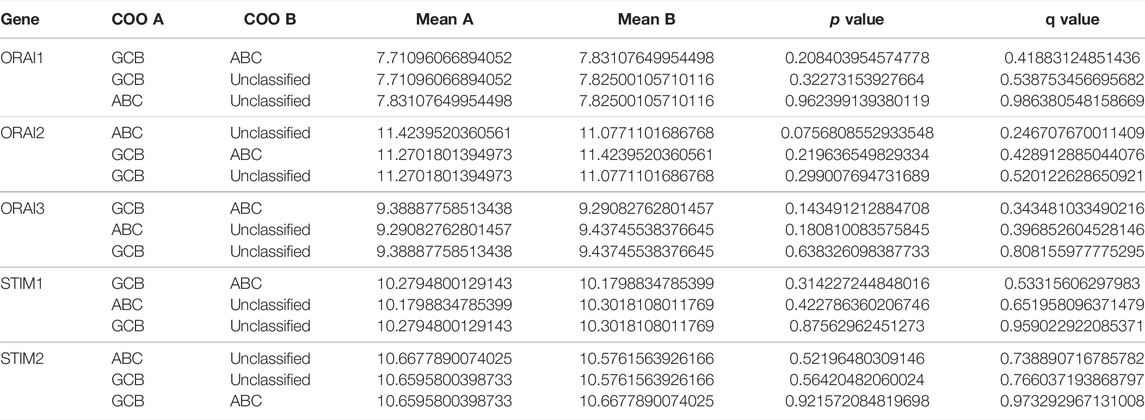
TABLE 4. Comparisons of ORAI/STIM expression in DLBCL patient samples. The p value and q value for each comparison are shown.
Discussion
As a range of lymphocyte functions are affiliated with Ca2+, such as proliferation and activation (Omilusik et al., 2013), a study of Ca2+ channel expression and signaling pathway expression was conducted in an attempt to disentangle some of the complexities of lymphoma. The results presented here refer to cell lines and DLBCL patient samples, with a discussion regarding each of these groups being provided below. Methods have been used previously (Aoki et al., 2020) to reaffirm the expression pattern of certain genes; however, a notable limitation of the current study is that no such validation has been completed.
The CHL cell lines included in this study consisted of the HDLM-2, HDMYZ, KM-H2, L-1236, L-428, L-540, L-591, SUP-HD1, and U-H01 cell lines (Table 1). Differential expression analysis revealed that CaV1.2 was more highly expressed in CHL cell lines relative to cell lines belonging to other types of B cell lymphoma. CaV1.2 has been linked to interleukin-13 (IL-13) in the context of T helper 2 (TH2) cells in that IL-13 levels drop in response to CaV1.2 knockdown (Robert et al., 2014). IL-13 has been shown to be expressed by cell lines of Hodgkin lymphoma (Kapp et al., 1999). Furthermore, in a study published soon afterward (Skinnider et al., 2001), it was shown that most CHL patients exhibited expression of IL-13, whereas this trait was either observed in none or fewer than 50% of patients with other forms of lymphoma, such as DLBCL. Signal transducer and activator of transcription 6 (STAT6), which is activated by IL-13, was found to be phosphorylated in cell lines of Hodgkin lymphoma (Skinnider et al., 2002). Therefore, CaV1.2 could possibly be playing a role in the regulation of IL-13 and STAT6 in CHL. Since the NFAT and KEGG Ca2+ signaling pathways (Table 2) were shown to be upregulated in the CHL cell lines, it is also possible that CaV1.2 influences the components of these pathways. In contrast to CaV1.2, reduced expression of ORAI2 and STIM2 was noted in the CHL cell lines via differential expression analysis. Given that STIM1 is known to activate ORAI channels and hinder CaV1.2 (Wang et al., 2010), it was surprising that the differential expression analysis in the current study did not show a significant reduction in STIM1 expression in the CHL cell lines. As STIM1 and STIM2 differ in their expression profiles (at least in T cells) and the ER Ca2+ concentration to which they respond (Shaw and Feske, 2012), this could potentially explain why only one of them, STIM2, showed a change in expression between CHL and other B cell lymphomas.
Among the GCB-DLBCL and ABC-DLBCL patients, the expression of the CaV1.3 channel was found to be higher in ABC-DLBCL by differential expression. It is known that L-type CaV channel constraint leads to reduced function of the transcription factor nuclear factor kappa B (NF-κB) (Lilienbaum and Israël, 2003). Within the promoter for the bcl-2 gene, which encodes the B cell leukemia/lymphoma-2 (Bcl-2) “anti-apoptosis” protein, there exists at least one binding site for NF-κB (Catz and Johnson, 2001). BCL2, as part of a network of genes, was deemed to be upregulated in ABC-DLBCL (Blenk et al., 2007). Another component of this network that was ascertained as being upregulated in the ABC kind of DLBCL was IRF4 (Blenk et al., 2007), and the promoter for this gene is known to have NF-κB binding sites as well (Sharma et al., 2002). Future studies could potentially further characterize these components in terms of how they might functionally relate to the CaV1.3 Ca2+ channel in the specific context of DLBCL, particularly since no differences in ORAI/STIM expression were detected in the patient samples in our study. This latter finding suggests that ORAI channels might not be contributing to differences in DLBCL phenotype in patients and that other Ca2+ channels, such as CaV1.3, could be playing this role instead. Furthermore, the calmodulin and KEGG Ca2+ signaling pathways (Table 2) were downregulated in ABC-DLBCL relative to GCB-DLBCL, suggesting that these pathways could also be linked to differences in DLBCL phenotype. The DLBCL patient sample RNA sequencing did not cover control B cells due to a lack of normal matches at the time. Investigation of CaV channels from this perspective would potentially be valuable as well. In order to validate these suggested mechanisms linked to Ca2+, follow-up experiments would need to be conducted.
To conclude, the L-type CaV channels represent a potential target class in the field of anti-lymphoma therapeutics. By targeting specific CaV1 channels and, by extension, the mechanisms associated with each channel, this could lead to updated strategies to treat lymphoma.
Data Availability Statement
RNA sequencing data for the lymphoma cell lines generated at BC Cancer are available via controlled access through GEO (accession number GSE189927). Data for the DLBCL patients were previously reported, and information on the accession is available in the original article (Ennishi et al., 2019).
Ethics Statement
Human studies were reviewed and approved by the University of British Columbia - BC Cancer Research Ethics Board (H14-02304: Biomarkers in Lymphoid Cancer), in accordance with the Declaration of Helsinki. We obtained written informed consent from the patients or informed consent was waived for the samples used in this retrospective study.
Author Contributions
WJ conceived of the project; WJ, SS, and LC wrote the manuscript; WJ, SS, CS, and LC edited the manuscript; SS and LC prepared tables; LC conducted analyses (including statistical analysis) and produced images for figures; SS and LC discussed analyses and points of interest to investigate; CS provided access to datasets; WJ and CS supervised the research.
Funding
SS was supported by the John Richard Turner Fellowship in Microbiology. This work was supported by a Canadian Institutes of Health Research (CIHR) Operating grant to WJ (MOP-102698) and by donations to the Sullivan Urology Foundation at Vancouver General Hospital.
Conflict of Interest
The authors declare that the research was conducted in the absence of any commercial or financial relationships that could be construed as a potential conflict of interest.
Publisher’s Note
All claims expressed in this article are solely those of the authors and do not necessarily represent those of their affiliated organizations, or those of the publisher, the editors and the reviewers. Any product that may be evaluated in this article, or claim that may be made by its manufacturer, is not guaranteed or endorsed by the publisher.
Acknowledgments
The authors would like to thank the patients whose samples were invaluable to this study.
Supplementary Material
The Supplementary Material for this article can be found online at: https://www.frontiersin.org/articles/10.3389/fphar.2022.795176/full#supplementary-material
References
Aoki, T., Chong, L. C., Takata, K., Milne, K., Hav, M., Colombo, A., et al. (2020). Single-Cell Transcriptome Analysis Reveals Disease-Defining T-Cell Subsets in the Tumor Microenvironment of Classic Hodgkin Lymphoma. Cancer Discov. 10, 406–421. doi:10.1158/2159-8290.CD-19-0680
Blenk, S., Engelmann, J., Weniger, M., Schultz, J., Dittrich, M., Rosenwald, A., et al. (2007). Germinal center B Cell-like (GCB) and Activated B Cell-like (ABC) Type of Diffuse Large B Cell Lymphoma (DLBCL): Analysis of Molecular Predictors, Signatures, Cell Cycle State and Patient Survival. Cancer Inform. 3, 399–420. doi:10.1177/117693510700300004
Bobée, V., Drieux, F., Marchand, V., Sater, V., Veresezan, L., Picquenot, J. M., et al. (2020). Combining Gene Expression Profiling and Machine Learning to Diagnose B-Cell Non-hodgkin Lymphoma. Blood Cancer J. 10, 59. doi:10.1038/s41408-020-0322-5
Catz, S. D., and Johnson, J. L. (2001). Transcriptional Regulation of Bcl-2 by Nuclear Factor Kappa B and its Significance in Prostate Cancer. Oncogene 20, 7342–7351. doi:10.1038/sj.onc.1204926
Ennishi, D., Jiang, A., Boyle, M., Collinge, B., Grande, B. M., Ben-Neriah, S., et al. (2019). Double-hit Gene Expression Signature Defines a Distinct Subgroup of Germinal center B-cell-like Diffuse Large B-Cell Lymphoma. J. Clin. Oncol. 37, 190–201. doi:10.1200/JCO.18.01583
Glas, A. M., Kersten, M. J., Delahaye, L. J., Witteveen, A. T., Kibbelaar, R. E., Velds, A., et al. (2005). Gene Expression Profiling in Follicular Lymphoma to Assess Clinical Aggressiveness and to Guide the Choice of Treatment. Blood 105, 301–307. doi:10.1182/blood-2004-06-2298
Hoefnagel, J. J., Dijkman, R., Basso, K., Jansen, P. M., Hallermann, C., Willemze, R., et al. (2005). Distinct Types of Primary Cutaneous Large B-Cell Lymphoma Identified by Gene Expression Profiling. Blood 105, 3671–3678. doi:10.1182/blood-2004-04-1594
Kahl, C. R., and Means, A. R. (2004). Regulation of Cyclin D1/Cdk4 Complexes by Calcium/calmodulin-dependent Protein Kinase I. J. Biol. Chem. 279, 15411–15419. doi:10.1074/jbc.M312543200
Kapp, U., Yeh, W. C., Patterson, B., Elia, A. J., Kägi, D., Ho, A., et al. (1999). Interleukin 13 Is Secreted by and Stimulates the Growth of Hodgkin and Reed-Sternberg Cells. J. Exp. Med. 189, 1939–1946. doi:10.1084/jem.189.12.1939
Kotturi, M. F., Carlow, D. A., Lee, J. C., Ziltener, H. J., and Jefferies, W. A. (2003). Identification and Functional Characterization of Voltage-dependent Calcium Channels in T Lymphocytes. J. Biol. Chem. 278, 46949–46960. doi:10.1074/jbc.M309268200
Lilienbaum, A., and Israël, A. (2003). From Calcium to NF-Kappa B Signaling Pathways in Neurons. Mol. Cel Biol. 23, 2680–2698. doi:10.1128/MCB.23.8.2680-2698.2003
Macian, F. (2005). NFAT Proteins: Key Regulators of T-Cell Development and Function. Nat. Rev. Immunol. 5, 472–484. doi:10.1038/nri1632
Magi, A., Masselli, M., Sala, C., Guerriero, A., Laise, P., Puccini, B., et al. (2019). The Ion Channels and Transporters Gene Expression Profile Indicates a Shift in Excitability and Metabolisms during Malignant Progression of Follicular Lymphoma. Sci. Rep. 9, 8586. doi:10.1038/s41598-019-44661-x
Omilusik, K., Priatel, J. J., Chen, X., Wang, Y. T., Xu, H., Choi, K. B., et al. (2011). The Ca(v)1.4 Calcium Channel Is a Critical Regulator of T Cell Receptor Signaling and Naive T Cell Homeostasis. Immunity 35, 349–360. doi:10.1016/j.immuni.2011.07.011
Omilusik, K. D., Nohara, L. L., Stanwood, S., and Jefferies, W. A. (2013). Weft, Warp, and Weave: the Intricate Tapestry of Calcium Channels Regulating T Lymphocyte Function. Front. Immunol. 4, 164. doi:10.3389/fimmu.2013.00164
Phan, N. N., Wang, C. Y., Chen, C. F., Sun, Z., Lai, M. D., and Lin, Y. C. (2017). Voltage-gated Calcium Channels: Novel Targets for Cancer Therapy. Oncol. Lett. 14, 2059–2074. doi:10.3892/ol.2017.6457
Putney, J. W. (2018). Forms and Functions of Store-Operated Calcium Entry Mediators, STIM and Orai. Adv. Biol. Regul. 68, 88–96. doi:10.1016/j.jbior.2017.11.006
Rao, A., Luo, C., and Hogan, P. G. (1997). Transcription Factors of the NFAT Family: Regulation and Function. Annu. Rev. Immunol. 15, 707–747. doi:10.1146/annurev.immunol.15.1.707
Robert, V., Triffaux, E., Paulet, P. E., Guéry, J. C., Pelletier, L., and Savignac, M. (2014). Protein Kinase C-dependent Activation of CaV1.2 Channels Selectively Controls Human TH2-Lymphocyte Functions. J. Allergy Clin. Immunol. 133, 1175–1183. doi:10.1016/j.jaci.2013.10.038
Scott, D. W., Wright, G. W., Williams, P. M., Lih, C. J., Walsh, W., Jaffe, E. S., et al. (2014). Determining Cell-Of-Origin Subtypes of Diffuse Large B-Cell Lymphoma Using Gene Expression in Formalin-Fixed Paraffin-Embedded Tissue. Blood 123, 1214–1217. doi:10.1182/blood-2013-11-536433
Sharma, S., Grandvaux, N., Mamane, Y., Genin, P., Azimi, N., Waldmann, T., et al. (2002). Regulation of IFN Regulatory Factor 4 Expression in Human T Cell Leukemia Virus-I-Transformed T Cells. J. Immunol. 169, 3120–3130. doi:10.4049/jimmunol.169.6.3120
Shaw, P. J., and Feske, S. (2012). Regulation of Lymphocyte Function by ORAI and STIM Proteins in Infection and Autoimmunity. J. Physiol. 590, 4157–4167. doi:10.1113/jphysiol.2012.233221
Skinnider, B. F., Elia, A. J., Gascoyne, R. D., Patterson, B., Trumper, L., Kapp, U., et al. (2002). Signal Transducer and Activator of Transcription 6 Is Frequently Activated in Hodgkin and Reed-Sternberg Cells of Hodgkin Lymphoma. Blood 99, 618–626. doi:10.1182/blood.v99.2.618
Skinnider, B. F., Elia, A. J., Gascoyne, R. D., Trümper, L. H., von Bonin, F., Kapp, U., et al. (2001). Interleukin 13 and Interleukin 13 Receptor Are Frequently Expressed by Hodgkin and Reed-Sternberg Cells of Hodgkin Lymphoma. Blood 97, 250–255. doi:10.1182/blood.v97.1.250
Sung, H., Ferlay, J., Siegel, R. L., Laversanne, M., Soerjomataram, I., Jemal, A., et al. (2021). Global Cancer Statistics 2020: GLOBOCAN Estimates of Incidence and Mortality Worldwide for 36 Cancers in 185 Countries. CA Cancer J. Clin. 71, 209–249. doi:10.3322/caac.21660
Vogt, N., Dai, B., Erdmann, T., Berdel, W. E., and Lenz, G. (2017). The Molecular Pathogenesis of Mantle Cell Lymphoma. Leuk. Lymphoma 58, 1530–1537. doi:10.1080/10428194.2016.1248965
Wang, C. Y., Lai, M. D., Phan, N. N., Sun, Z., and Lin, Y. C. (2015). Meta-Analysis of Public Microarray Datasets Reveals Voltage-Gated Calcium Gene Signatures in Clinical Cancer Patients. PLoS One 10, e0125766. doi:10.1371/journal.pone.0125766
Wang, Y., Deng, X., Mancarella, S., Hendron, E., Eguchi, S., Soboloff, J., et al. (2010). The Calcium Store Sensor, STIM1, Reciprocally Controls Orai and CaV1.2 Channels. Science 330, 105–109. doi:10.1126/science.1191086
Yanamandra, N., Buzzeo, R. W., Gabriel, M., Hazlehurst, L. A., Mari, Y., Beaupre, D. M., et al. (2011). Tipifarnib-induced Apoptosis in Acute Myeloid Leukemia and Multiple Myeloma Cells Depends on Ca2+ Influx through Plasma Membrane Ca2+ Channels. J. Pharmacol. Exp. Ther. 337, 636–643. doi:10.1124/jpet.110.172809
Keywords: calcium channel, lymphoma, leukaemia, signaling pathway, sequencing
Citation: Stanwood SR, Chong LC, Steidl C and Jefferies WA (2022) Distinct Gene Expression Patterns of Calcium Channels and Related Signaling Pathways Discovered in Lymphomas. Front. Pharmacol. 13:795176. doi: 10.3389/fphar.2022.795176
Received: 14 October 2021; Accepted: 24 March 2022;
Published: 24 May 2022.
Edited by:
Heike Wulff, University of California, Davis, United StatesReviewed by:
Isaac Jardin, University of Extremadura, SpainIndu Ambudkar, National Institute of Dental and Craniofacial Research (NIH), United States
Copyright © 2022 Stanwood, Chong, Steidl and Jefferies. This is an open-access article distributed under the terms of the Creative Commons Attribution License (CC BY). The use, distribution or reproduction in other forums is permitted, provided the original author(s) and the copyright owner(s) are credited and that the original publication in this journal is cited, in accordance with accepted academic practice. No use, distribution or reproduction is permitted which does not comply with these terms.
*Correspondence: Wilfred A. Jefferies, wilf@msl.ubc.ca
 Shawna R. Stanwood