 Yewei Chen1
 Li Sun2Hong Xu2Min Dong3,4
 Tomoyuki Mizuno3,4
 Alexander A. Vinks3,4Hermine I. Brunner4,5Yifan Li2
 Zhiping Li1*
- 1Department of Pharmacy, Children’s Hospital of Fudan University, Shanghai, China
- 2Division of Rheumatology, Children’s Hospital of Fudan University, Shanghai, China
- 3Division of Clinical Pharmacology, Cincinnati Children’s Hospital Medical Center, Cincinnati, OH, United States
- 4Department of Pediatrics, University of Cincinnati, Cincinnati, OH, United States
- 5Division of Rheumatology, Cincinnati Children’s Hospital Medical Center, Cincinnati, OH, United States
Objectives: To evaluate the mycophenolic acid [MPA, the active form of mycophenolate mofetil (MMF)] pharmacokinetic parameters in relation to clinical response to identify target exposure ranges in pediatric patients with systemic lupus erythematosus (SLE).
Methods: This was a retrospective study using pharmacokinetic data collected in 67 pediatric patients aged 4–18 years with SLE. Target MPA exposures for effective inhibition of SLE activity (as measured by SLE disease Activity Index (SLEDAI), active SLE was defined as a SLEDAI score of ≥6, and a controlled disease was defined as a SLEDAI score of ≤4) were assessed by receiver operating characteristic (ROC) curve and logistic regression. Exposure-response models were developed to quantitatively describe the relationship between SLEDAI score and AUC0–12 or Ctrough, respectively.
Results: The MPA AUC0-12 in patients with active SLE was significantly lower than that in patients with inactive SLE. ROC analysis revealed that an AUC0–12 threshold of 39 μg h/ml or a Ctrough of 1.01 μg/ml was associated with the lowest risk of active SLE. Logistic regression analysis revealed that an AUC0–12 of less than 34 μg h/ml or a Ctrough of less than 1.2 μg/ml probably is associated with active SLE. The results of the exposure-response modeling also indicated that an AUC0-12 less than 32 μg h/ml or a Ctrough less than 1.1 μg/ml was associated with suboptimal clinical outcome. An AUC0-12 above 50 μg h/ml or a Ctrough above 1.7 ug/ml was associated with disease control.
Conclusion: Both AUC0–12 and Ctrough of MPA are predictive of the likelihood of active SLE in pediatric patients receiving MMF. An individualized dosing regimen of MMF, with a target AUC0–12 or Ctrough, should be considered for SLE patients.
Introduction
Systemic lupus erythematosus (SLE) is a systemic autoimmune disease characterized by the presence of autoantibodies. These antibodies can circulate in the body or form immune complexes that deposit in different organs leading to complement consumption and the production of inflammation cytokines, which leads to local inflammation and organ damage (Tsokos, 2011). Multiple drugs with immunomodulating properties have been used to treat patients with SLE: hydroxychloroquine, corticosteroids, methotrexate, azathioprine and mycophenolate mofetil (MMF) (Tunnicliffe et al., 2015).
MMF is the ester prodrug of mycophenolic acid (MPA). MPA is a potent immunosuppressant that inhibits the de novo synthesis pathway of guanosine nucleotides, which triggers a potent cytostatic effect on T and B lymphocytes, thereby inhibiting proliferative response (Allison and Eugui, 2005). With an improved efficacy and safety profile, MPA is being increasingly used in the treatment of SLE. However, a large inter-individual variability in the pharmacokinetics (PK) of MPA has been observed in children with SLE (Zahr et al., 2010; Sherwin et al., 2012). The absorption characteristics of MPA differ on both inter- and intra-patient levels, probably because of the different dosage forms, gastrointestinal tract status and serum albumin level (Tett et al., 2011). The processes of intrinsic clearance and drug transport can also contribute to the variability of MPA PK. MPA is almost entirely metabolized by glucuronidation to its inactive metabolite, MPA-glucuronide (MPAG) (Staatz and Tett, 2014). MPA glucuronides are excreted unchanged in the urine, but also undergo subsequent enterohepatic recirculation (EHR) to convert back to MPA (Villarroel et al., 2009). Individual variation in the rates of metabolism and EHR process lead to significant variability.
To date, several MPA population PK studies have been published (de Winter et al., 2008; Zeng et al., 2010; Sagcal-Gironella et al., 2011; Sherwin et al., 2012; Dong et al., 2014; Woillard et al., 2014; Yoshimura et al., 2018). The majority of studies have focused on the renal transplant population, with only few studies conducted in patients with SLE (Dong et al., 2014). In MMF-treated renal transplant recipients, it has been demonstrated that the area under the zero to 12 h concentration-time curve (AUC0-12) is the PK parameter best associated with clinical outcome, with a target range of 30–60 μg h/ml (van Gelder et al., 2006). Therapeutic MPA AUC0-12 monitoring has been shown to achieve the target range more quickly than trough monitoring, and significantly reduces the risk of acute rejection in renal transplant patients (Le Meur et al., 2007; Saint-Marcoux et al., 2011). This positive experience in transplantation has led many clinicians to think about the use of MPA therapeutic drug management (TDM) in the context of SLE. Several studies in adult or pediatric patients suffering from autoimmune diseases have shown that TDM using AUC is feasible and that plasma MPA AUCs are likely correlated with disease status (Zahr et al., 2010; Woillard et al., 2014). However, the relationship between MPA exposure and response has not been established in SLE patients. Among the tools to determine the AUC, Bayesian estimators are recognized as the most reliable (Tett et al., 2011). Briefly, a Bayesian estimator allows the calculation of an individual patient's AUC, based on a limited number of blood samples and using a PK model, to provide an individualized dose to achieve the target AUC. In the present study, we 1) evaluated AUC0-12 estimation using a Bayesian estimator and a limited sampling strategy in pediatric patients with SLE, 2) explored the relationships between MPA exposure and SLE disease activity in a young patient population.
Methods
Patients
Data of patients followed in the Division of Rheumatology of Children's Hospital of Fudan University between December 2015 and December 2017 were included in this study. Patients were enrolled if they fulfilled the following criteria: concentration data for AUC estimation available, diagnosis of SLE according to the American College of Rheumatology classification criteria (Tan et al., 1982; Hochberg, 1997); treatment with MMF at an initial dosage of 20–40 mg/kg/d twice daily, with a maximum of 1.5 g/d, in addition to prednisolone and hydroxychloroquine (HCQ); treatment with MMF (mycophenolate mofetil capsules (Cellcept®, Roche Pharmaceuticals, Inc, Palo Alto) or mycophenolate mofetil dispersible tablets (Saikeping, Hangzhou Zhongmei Huadong Pharmaceutical Co., Ltd.)) at a stable dose for at least 10 weeks. Patients were excluded if they were treated with drugs known to effect clinical response, such as cyclosporine, tacrolimus, or methotrexate. Patients' data such as demographics and SLE disease activities were collected at the time of PK evaluation. Only a single time data from each patient were included. The study protocol was approved by the Fudan Children's ethics committee.
Laboratory Analysis
Blood samples for MPA measurement were drawn as part of standard of care at 30 min before administration of MMF and at 20 min, 1 and 3 h after administration (Prémaud et al., 2005). Plasma concentrations were determined by an enzyme-multiplied immunoassay method with the Viva-E System (ver. 2.014; Siemens Healthcare Diagnostics, Eschborn, Germany). The linear range for the assay was 0.1–15 μg/ml, and the lower limit of quantification was 0.1 μg/ml.
Pharmacokinetic/Pharmacodynamic Analysis
The MPA AUC0-12 was determined using Bayesian estimation with MW/Pharm++ clinical software (Ver. 1.6.1.128; Mediware, Prague, Czech Republic). A published MMF PK model in pediatric patients with SLE was used as the Bayesian prior (Woillard et al., 2014). All MMF doses, times of administration, and serum concentrations were entered into the appropriate sections of the MW/Pharm++ software for the Bayesian estimation. The predictive performance of the model was evaluated as described in Supplementary materials (Supplementary Figures S1, S2; Supplementary Tables S1‒S3). SLE status was assessed using the SLE disease Activity Index (SLEDAI, range: 0–105) (Gladman et al., 2002), active SLE was defined as a SLEDAI score of ≥6, and a controlled disease was defined as a SLEDAI score of ≤4 (Costedoat-Chalumeau et al., 2006).
To evaluate parameters that may have influenced SLE activity on the day of sampling, we conducted a binary logistic regression analysis including statistically (univariate analysis p-value < 0.5) and clinically significant parameters. If the p-value was less than 0.05 and the odds ratio (OR) was above or below 1.0, then the variables were considered as parameters significantly associated with SLE activity. Parameters significantly associated with AUC0-12 or Ctrough were determined using a multiple linear regression.
A receiver operating characteristic (ROC) curve (a plot of sensitivity vs. 100 minus specificity) was constructed to determine the target MPA AUC and Ctrough associated with the lowest risk of active SLE, as defined by the SLEDAI score of ≥6.
In addition, logistic regression was used to describe the MPA exposure in association with the likelihood of active SLE. The resulting sigmoid relationships described Eq. 1, 2 provide the proportional probability of active SLE.
where β0, β0’, β1 and β1’ were the parameters to be estimated. The function represents the fraction of the probability of active SLE at a specific MPA exposure (AUC, Ctrough). “Efficacy” means effective control of SLE activity less than 6.
Exposure-response (E-R) models were developed to describe the relationship between AUC, Ctrough and SLEDAI score, respectively. Sigmoid Emax models were tested to explore the E-R relationships (Eq. 3, 4). A non-parametric bootstrap was conducted, and the median values and the 95 percent confidence intervals were compared with the final parameter estimates (Ette et al., 2003). A visual predictive check using a total of 1,000 simulated datasets was performed (Holford, 2005).
where E represents the pharmacologic effect, E0 represents the baseline of SLEDAI, Emax represents the maximum SLEDAI, EC50 represents the AUC or Ctrough that produces 50% maximal SLEDAI, γ describes the steepness of the relationship.
Results
Patient Characteristics
This was a retrospective study that evaluated PK/pharmacodynamic (PD) data of 67 patients. Based on the SLEDAI score, 25 patients had active SLE and 42 patients had inactive SLE on the day of PK sampling (Table 1). In active patients whose diseases were not well controlled during the 10 weeks prior to PK evaluations, dose changes of co-medication could be made based on physicians’ judgment. However, 94% of patients had been on stable dosing of co-medication. Among the patients with active SLE, the mean ± standard deviation (SD) SLEDAI score was 13.4 ± 5.2, and among the patients with inactive SLE, the mean SLEDAI score was 2.6 ± 1.9 (p < 0.0001). The active and inactive SLE groups were similar in terms of mean age, mean weight, mean daily dose of MMF, mean daily dose of HCQ and creatinine clearance; but there were significant differences in gender ratio, mean daily dose of steroids and albumin. Individual MPA concentration-time profiles are shown in Figure 1. The comparison of PK profiles and AUC results of different dosage forms is shown in Figures 2, 3, respectively.
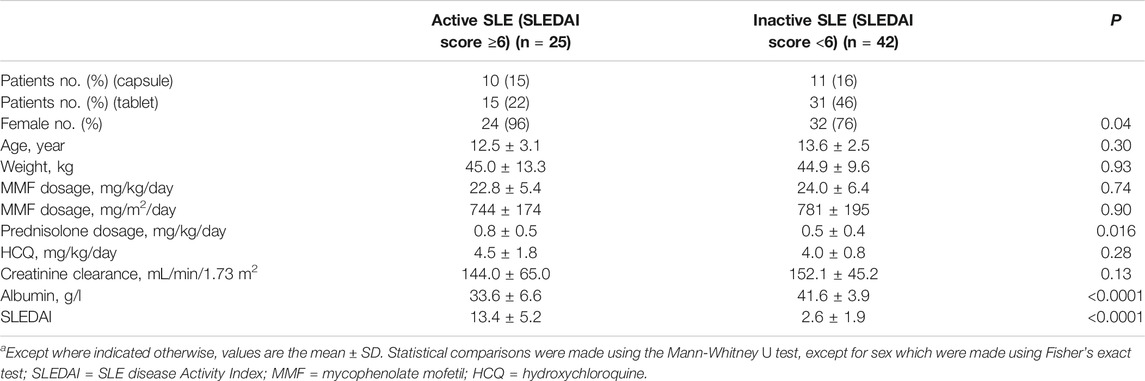
TABLE 1. Characteristics of the patients with active and inactive SLE, as defined using the SLEDAI score.
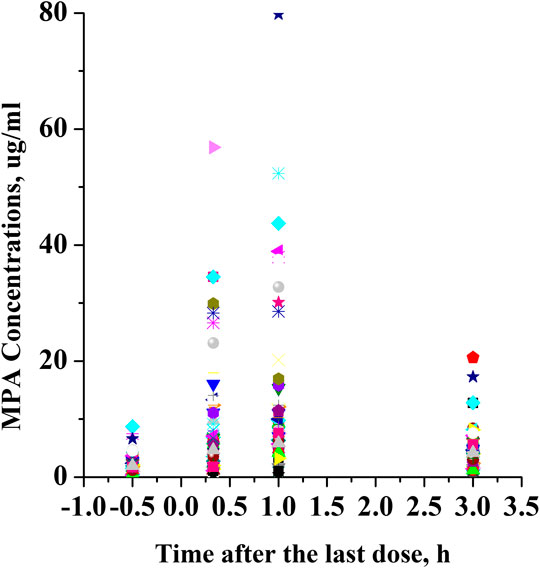
FIGURE 1. Individual MPA concentration-time profiles.
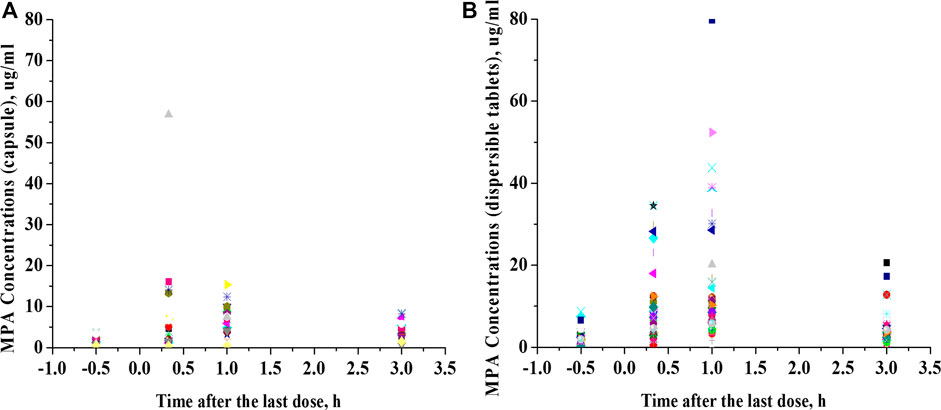
FIGURE 2. Comparison of PK profiles of different dosage forms. (A), Mycophenolate mofetil capsules. (B), Mycophenolate mofetil dispersible tablets.
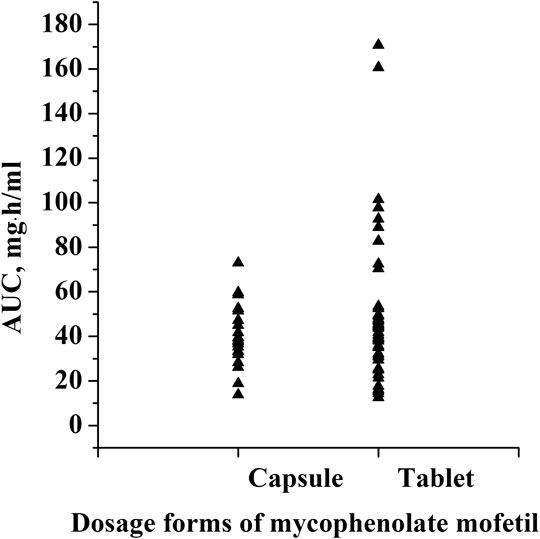
FIGURE 3. Comparison of AUC results of different dosage forms.
Association of MPA Exposure Measures With SLE Activity
MPA AUC0-12 displayed wide variability, with a median estimate of 40.6 μg h/ml and a range of 12.6–170.8 μg h/ml. The mean ± SD MPA AUC0–12 of the group with active SLE was significantly lower than that of the group with controlled SLE (32.4 ± 14.8 μg h/ml vs. 55.7 ± 31.1 μg h/ml, p < 0.0001) (Figure 4A). MPA AUC0-12 was associated with the SLEDAI score in a nonlinear fashion (Figure 4B). Similarly, the mean ± SD Ctrough of the group with active SLE was significantly lower than that of the group with inactive SLE (1.3 ± 1.0 μg/ml vs. 2.5 ± 1.7 μg/ml, p < 0.0001) (Figures 4C,D).
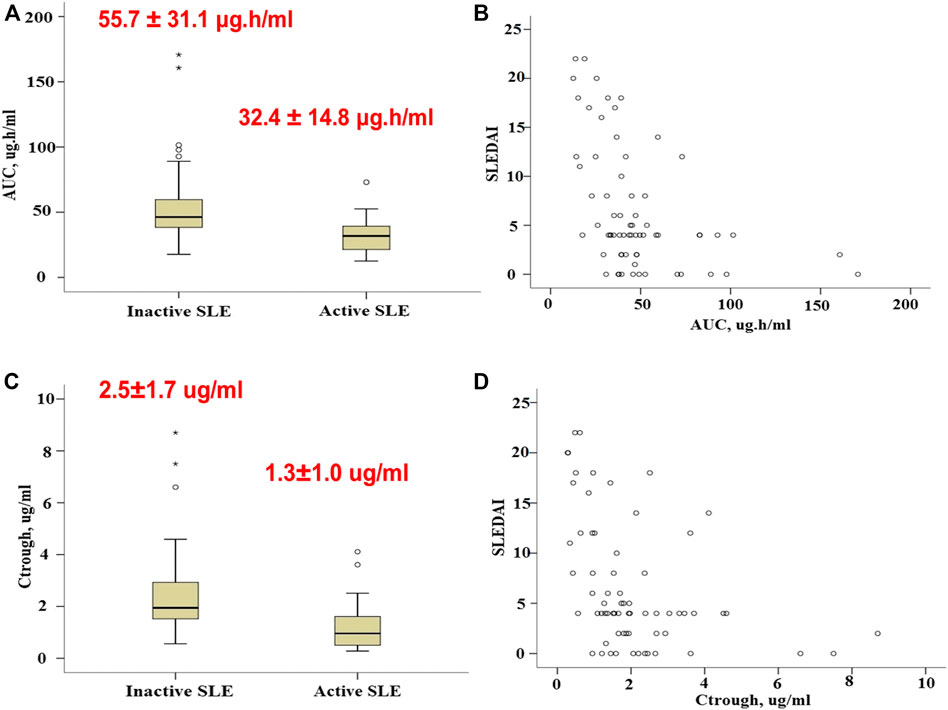
FIGURE 4. Association of MPA exposure measures with SLE activity. (A), Boxplots of MPA AUC0–12 in patients with active and inactive SLE. (B), Association of MPA AUC0–12 with the SLEDAI score. (C), Boxplots of Ctrough in patients with active and inactive SLE. (D), Association of Ctrough with the SLEDAI score. Each box represents the 25th to 75th percentiles. Lines outside the boxes represent the 10th and the 90th percentiles. Lines inside the boxes represent the median.
MPA AUC0–12 or Ctrough Is a Major Parameter Influencing SLE Activity
In the simple logistic regression analysis, gender, age, daily dose of HCQ, creatinine clearance and MPA AUC0–12h or Ctrough were evaluated as independent parameters. MPA AUC0–12h and Ctrough were identified as the significant independent parameters associated with SLE activity (Table 2).
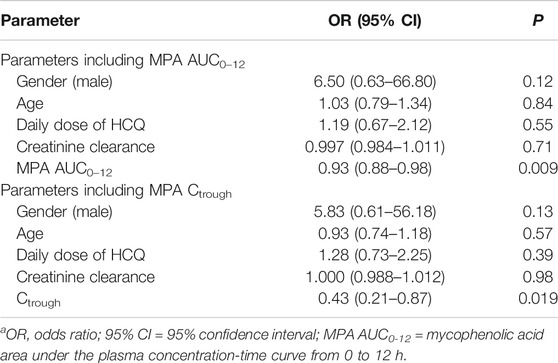
TABLE 2. Binary logistic regression analysis of parameters potentially influencing SLE activity in patients treated with MMF including MPA AUC0–12 or Ctrough.
To assess parameters that may influence MPA AUC0–12h or Ctrough, we constructed a multiple linear regression model including daily dose of MMF, daily dose of steroids, albumin and creatinine clearance. Daily dose of MMF (p = 0.005), daily dose of prednisolone (p = 0.047), and serum albumin level (p = 0.009) were the 3 parameters independently associated with AUC0–12h. The linear regression with Ctrough also indicated that daily dose of MMF (p = 0.031), daily dose of prednisolone (p = 0.014), and serum albumin level (p = 0.041) influenced Ctrough.
From the ROC analysis, a threshold AUC value of 39 μg h/ml provided the best tradeoff between sensitivity (76%) and specificity (71%) (Figures 5A,B). For Ctrough, a threshold value of 1.01 μg/ml was associated with a sensitivity of 60% and a specificity of 95.2%. After AUC of 39 μg h/ml or Ctrough of 1.01 μg/ml, the curve plateaued.
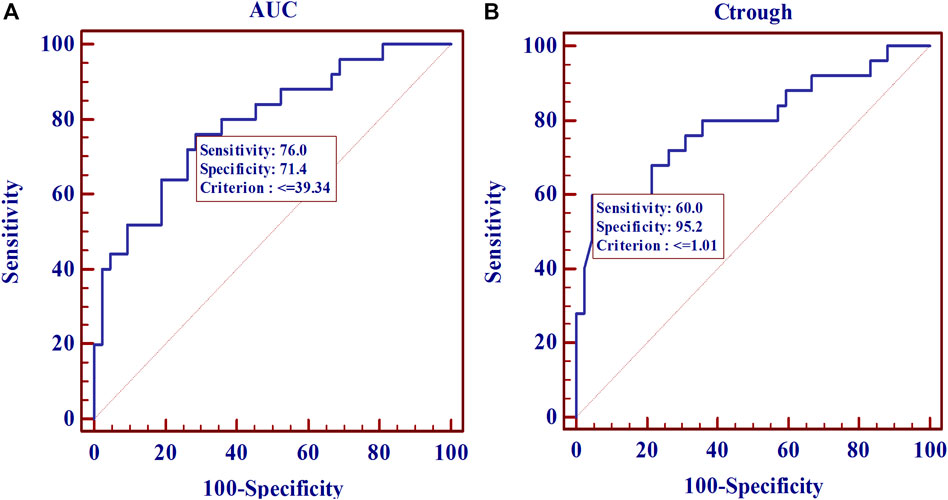
FIGURE 5. Receiver operating characteristic (ROC) curve estimates for the 67 SLE patients. (A), for MPA AUC (AUCROC: 0.790; p < 0.0001). (B), for Ctrough (AUCROC: 0.792; p < 0.0001).
The 2-parameter logistic regression yielded a PK-pharmacodynamic (PD) relationship that was highly statistically significant (p < 0.0001). The logistic regression coefficients were 2.48 and −0.074 for β0 and β1, yielding the sigmoidal curve shown in Figure 6A. This curve illustrates the reduction in probability of active SLE as MPA AUC increases, with 50% of maximal efficacy occurring at an AUC of 34 μg h/ml (Table 3). The logistic regression with Ctrough was also statistically significant (p < 0.0001). The logistic regression coefficients from the fit were 1.30 and −1.05 for β0 and β1, respectively (Figure 6B). This Ctrough associated with 50% of maximal efficacy is 1.24 μg/ml (Table 3).
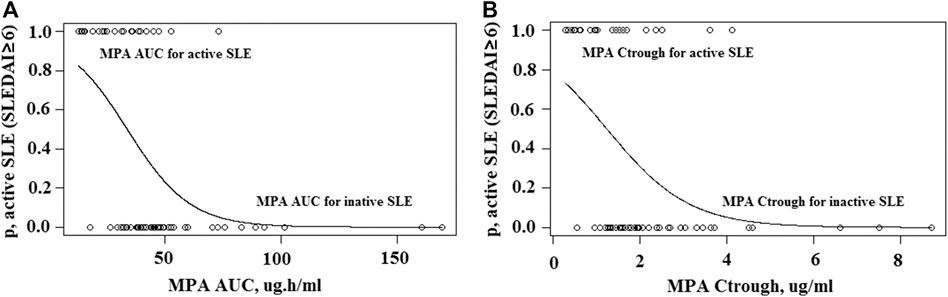
FIGURE 6. Two-parameter logistic regression. (A), Sigmoid logistic regression relationship for MPA AUC and likelihood of active SLE. (B), Sigmoid logistic regression relationship for MPA Ctrough and likelihood of active SLE.
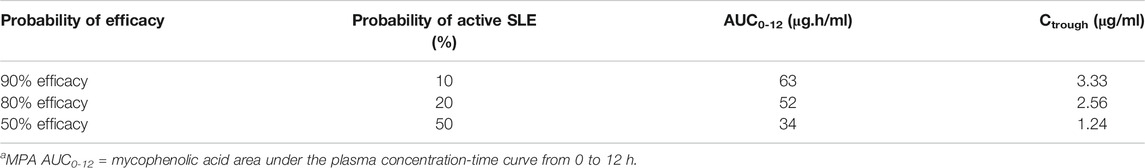
TABLE 3. MPA exposure attaining different probability of efficacy.
For exposure-response modeling, an inhibitory Emax model with AUC was established. Due to the lack of patients with severe SLE activity (SLEDAI score >22), E0 was fixed to 105. According to the theory, if the maximum effect is total inhibition of the baseline response, then Emax and E0 will have the same value. Therefore, Emax was also fixed to 105. There was no improvement when γ (hill coefficient) was included in the model. Parameter estimates of the MPA AUC-response model are summarized in Table 4. Bootstrap 95% CIS for exposure-response model parameters were successfully estimated and all final parameter estimates were within those intervals, indicating a stable model (995 successful). Visual predictive check results also showed appropriate predictive performance of the model in that 95% CI of actual observations lay within the simulated 95% CI (Figure 7A). Besides, most of the observations are within 95% CI of actual observations. The result of the final model including AUC showed that the AUC should be 32 μg h/ml or higher to keep control SLE activity less than 6, and the AUC above 50 μg h/ml probably would result in disease control of SLE activity less than 4. Similarly, an Emax model of the relationship between Ctrough and response described the data well. Parameter estimates of MPA Ctrough-response model are summarized in Table 4. Both bootstrap (991 successful) and visual predictive check supported the prediction of the Ctrough-response model (Figure 7B). The results indicated that a minimum MPA concentration of 1.1 ug/ml is needed (SLEDAI score <6) with concentration of 1.7 ug/ml associated with good reponse (SLEDAI score <4).
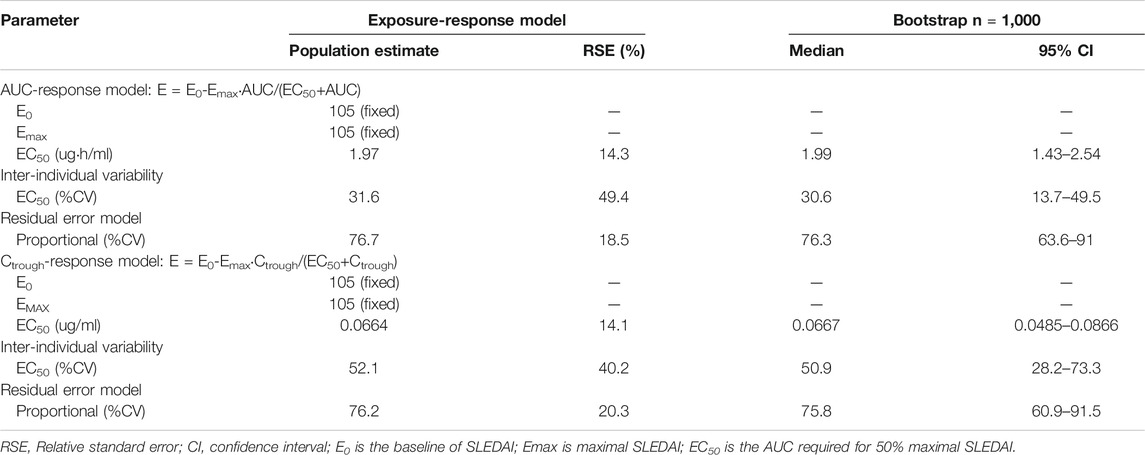
TABLE 4. Parameter estimates of the mycophenolic acid exposure-response model and bootstrap validation.
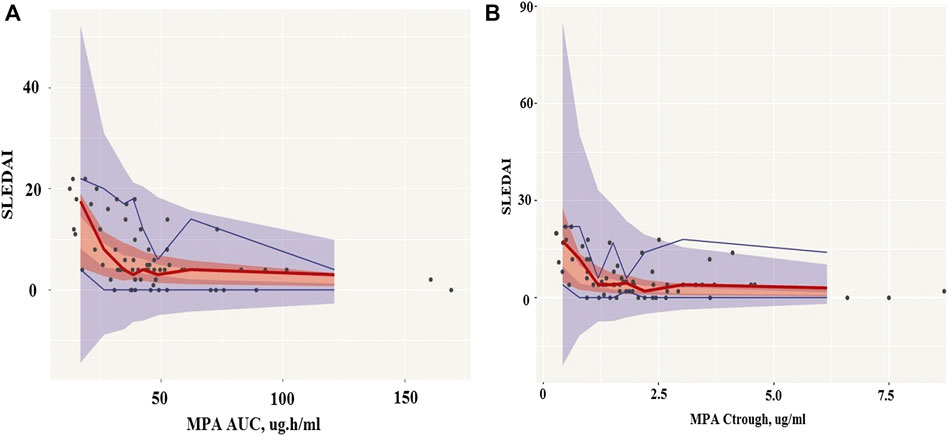
FIGURE 7. Visual predictive check (VPC) of mycophenolic acid models. (A), The AUC-response model. (B), The Ctrough-response model. Circles represent the observed blood concentrations; Lines represent the median, 5 and 95th percentiles of simulations (n = 1,000).
Discussion
In the present study, Bayesian estimation was employed to estimate MPA AUC0-12 in pediatric patients with SLE using the limited sampling strategy. To our knowledge, only two studies developed PK models for MPA when used in children with SLE. Sherwin et al. developed a six-compartment model including a gallbladder compartment for enterohepatic recycling and bile release time related to meal times, with first order absorption and a single series of transit compartments (Sherwin et al., 2012). Woillard JB et al. developed a double gamma absorption model from rich PK profiles which allowed the absorption profiles of MPA to be described very accurately (Woillard et al., 2014). Due to the limited sampling strategy, we have chosen the model developed by Woillard et al. to estimate MPA AUC0-12 in pediatric patients with SLE on the basis of four samples. We feel confident that this model can be used to estimate individual AUC0-12 with fairly good accuracy and therefore allows for better dose optimization in children with SLE.
This study explored the association between MPA exposure and disease activity. In this population of 67 pediatric patients with SLE, we observed that both MPA AUC0-12 and Ctrough were related to disease activity as assessed by SLEDAI at the time of AUC determination. Previous studies also have found a correlation between MPA AUC0-12 and SLE activity. In adult patients, Zahr et al. demonstrated that MPA AUC0-12 was significantly lower in patients with active SLE than in those with inactive disease (Zahr et al., 2010). In a population of 36 children with SLE, Woillard et al. also observed that AUC0-12 were related to disease activity (Woillard et al., 2014). However, the association between Ctrough and SLEDAI was unclear. Neumann et al. reported that in 12 patients with SLE and 26 patients with ANCA-associated vasculitis receiving MMF for remission maintenance therapy, higher MPA trough levels provided better protection from recurrence of active disease (Neumann et al., 2008). Controversially in the previously mentioned study undertaken by Woillard et al., the logistic regression analysis revealed no association between Ctrough and SLEDAI. In the current study, the data suggest that the association between Ctrough and disease activity is not worse than for MPA AUC0-12.
Cattaneo et al. reported an impact of glucocorticoids on MPA exposure in kidney transplant recipients. Dose-normalized MPA AUC0-12 was lower during the first month (high doses of steroids) than at month six post-surgery (low maintenance dose of steroids) (Cattaneo et al., 2002). But neither the prednisolone AUC0-12 nor daily doses of prednisone were correlated with MPA PK parameters in the study by Zahr et al. (Zahr et al., 2008). The involvement of steroids in PK of MPA is still not conclusive. In the present study, we investigated the possible interactions between prednisolone and MPA by multiple linear regression analysis. Daily doses of prednisolone was found to be related with MPA PK parameters. MPA AUC0-12 was significantly lower in pediatric SLE patients with high doses of prednisolone. However, additional confounding factors such as daily dose of MMF and albumin concentration interfered with MPA exposure. Furthermore, since we could not withdraw corticosteroids in patients with SLE, we cannot determine whether there was a possible interaction between corticosteroids and MMF.
The therapeutic target for MPA AUC0-12 of 30–60 μg h/ml has been firmly established in MMF-treated renal transplant recipients. In patients with SLE, the data is limited. Several studies have shown that an MPA AUC0-12 of 30–60 μg h/ml (Alexander et al., 2014) or 45–60 μg h/ml (Zabotti et al., 2015) were correlated with a better outcome in adult SLE patients. In a population of 71 adult patients with SLE, Zahr et al. found MPA AUC0-12 was the only parameter associated with SLE activity and proposed a target AUC0-12 threshold of 35 μg h/ml (Zahr et al., 2010). In 19 pediatric patients with lupus nephritis or discoid lupus, Sagcal-Gironella et al. reported that an MPA AUC0-12 of 30 μg h/ml or higher was associated with improved disease control, whereas MPA AUC0-12 lower than that were not (Sagcal-Gironella et al., 2011). An MPA AUC0-12 > 45 μg h/ml was proposed to significantly associated with therapeutic response in childhood-onset lupus nephritis in the study by Godron-Dubrasquet et al (Godron-Dubrasquet et al., 2020). In the present study, an MPA AUC0-12 of 39 μg h/ml or a Ctrough of 1.01 μg/ml was found as the target threshold for SLE in pediatric patients by ROC analysis, which is higher than the target MPA AUC0-12 thresholds proposed by Zahr et al (Zahr et al., 2010) and Sagcal-Gironella et al (Sagcal-Gironella et al., 2011), but lower than the AUC0-12 threshold reported by Godron-Dubrasquet et al (Godron-Dubrasquet et al., 2020). In general, the target MPA AUC0-12 threshold for SLE patients proposed by our team is consistent with that reports by other previous studies. This small discrepancy may be due to the different severity of disease activity of the included patients, different concentration measurement methods, and different statistical methods. A logistic regression model was used to represent the relationship between MPA AUC0-12 and likelihood of active SLE as measured by the SLEDAI. An MPA AUC0-12 of 34 μg h/ml was found to predict an effective control of SLE activity less than six in 50% of the patients, whereas 52 and 63 μg h/ml would yield effective control in 80% and 90 of the patients, respectively. Similarly, a Ctrough of 1.24 mg/L would be expected to yield in 50% of the patients an effective control, whereas 2.56 and 3.33 mg/L are associated a SLE activity less than six in 80% and 90 of the patients, respectively. Although this finding will require further validation before it can be implemented clinically, an MPA AUC0-12 level of 34 μg h/ml and Ctrough level of 1.24 mg/L or higher were associated with disease control of SLE activity less than 6, whereas MPA AUC0-12 or Ctrough levels lower than that were not. In order to further explore the relationship between MPA exposure and disease activity, we herein first developed sigmoidal exposure-response models, which predict the probability of outcomes themselves rather than particular outcomes (0, 1) by logistic regression. The results were consistent with the logistic regression, and an MPA AUC0-12 of 32 μg h/ml and Ctrough level of 1.1 mg/L or higher would keep effective control of SLE activity less than 6. An AUC0-12 above 50 μg h/ml or a Ctrough above 1.7 ug/ml were identified to be associated with disease control of SLE activity less than 4. The accuracy and predictive performance of the final model were satisfactory, which implied that the use of AUC0–12h or Ctrough as an exposure variable was acceptable.
Although a fixed-dose regimen is still the current convention in MPA dosing, we observed a large variability of MPA PK/PD. Model-informed precison dosing appears particularly important in our SLE patients, and the target AUC0-12 and Ctrough thresholds associated with active disease have been identified, although an upper limit cannot be defined because of the lack of toxicity in this cohort. Some limitations of this study should be considered. First, two forms of mycophenolate mofetil were used. As our study indicated, clinically relevant differences in PKs of these two formulation exist. However, the major findings of this study which show the exposure cut-offs associated with clinical outcomes, are not affected by formulations. Second, this is a retrospective cross-sectional study. Prospective longitudinal studies are clearly needed to propose a possible therapeutic target range for MPA AUC0-12 or trough concentrations. Yet, the results from this study presented herein may be seen as a valuable addition to the current knowledge of MMF PK in SLE. In addition, it would be preferred to characterize MPA PK using free drug concentrations. As albumin concentration in patients with active SLE may be subnormal, this factor will affect drug exposure. Lastly, MPA concentrations were measured by an immunoassay which is commonly used in clinical labs. Due to possible cross-reactions, it may give higher results compared to other assays such as high performance liquid chromatography (HPLC) test. However, in areas/countries of low-resource, HPLC and LC-MS/MS technologies may not be readily available in the clinical settings. Therefore, our results may provide “real-world” values to guide TDM of MMF in patients with SLE.
Conclusion
A published population PK model was successfully used as prior information to estimate MPA AUC0-12 in our pediatric patients with SLE. Both AUC0-12 and Ctrough were correlated with SLE activity. An AUC0-12 above 50 μg h/ml or a Ctrough above 1.7 ug/ml were recommended to provide a good clinic improvement.
Data Availability Statement
The original contributions presented in the study are included in the article/Supplementary Material, further inquiries can be directed to the corresponding author.
Ethics Statement
The studies involving human participants were reviewed and approved by Fudan Children’s ethics committee. Written informed consent to participate in this study was provided by the participants' legal guardian/next of kin.
Author Contributions
YC performed the research, analyzed data and wrote the manuscript; ZL designed the research; LS and YL collected data; MD and TM gave good suggestions and revised the manuscript; HX, AV, and HB provided valuable edits and comments.
Conflict of Interest
The authors declare that the research was conducted in the absence of any commercial or financial relationships that could be construed as a potential conflict of interest.
Supplementary Material
The Supplementary Material for this article can be found online at: https://www.frontiersin.org/articles/10.3389/fphar.2020.605060/full#supplementary-material.
References
Alexander, S., Denise, H., Mathew, B. S., Varughese, S., Jeyaseelan, V., Tamilarasi, V., et al. (2014). Pharmacokinetics of concentration-controlled mycophenolate mofetil in proliferative lupus nephritis: an observational cohort study. Ther. Drug Monit. 36, 423–432. doi:10.1097/FTD.0000000000000031
Allison, A. C., and Eugui, E. M. (2005). Mechanisms of action of mycophenolate mofetil in preventing acute and chronic allograft rejection. Transplantation 80 (Suppl. 1), S181–S190. doi:10.1191/0961203305lu2109oa
Cattaneo, D., Perico, N., Gaspari, F., Gotti, E., and Remuzzi, G. (2002). Glucocorticoids interfere with mycophenolate mofetil bioavailability in kidney transplantation. Kidney Int. 62, 1060–1067. doi:10.1046/j.1523-1755.2002.00531.x
Costedoat-Chalumeau, N., Amoura, Z., Hulot, J. S., Hammoud, H. A., Aymard, G., Cacoub, P., et al. (2006). Low blood concentration of hydroxychloroquine is a marker for and predictor of disease exacerbations in patients with systemic lupus erythematosus. Arthritis Rheum. 54, 3284–3290. doi:10.1002/art.22156
de Winter, B. C., van Gelder, T., Glander, P., Cattaneo, D., Tedesco-Silva, H., Neumann, I., et al. (2008). Population pharmacokinetics of mycophenolic acid: a comparison between enteric-coated mycophenolate sodium and mycophenolate mofetil in renal transplant recipients. Clin. Pharmacokinet. 47, 827–838. doi:10.2165/0003088-200847120-00007
Dong, M., Fukuda, T., and Vinks, A. A. (2014). Optimization of mycophenolic acid therapy using clinical pharmacometrics. Drug Metabol. Pharmacokinet. 29, 4–11. doi:10.2133/dmpk.dmpk-13-rv-112
Dong, M., Fukuda, T., Cox, S., de Vries, M. T., Hooper, D. K., Goebel, J., et al. (2014). Population pharmacokinetic-pharmacodynamic modelling of mycophenolic acid in paediatric renal transplant recipients in the early post-transplant period. Br. J. Clin. Pharmacol. 78, 1102–1112. doi:10.1111/bcp.12426
Ette, E. I., Williams, P. J., Kim, Y. H., Lane, J. R., Liu, M. J., and Capparelli, E. V. (2003). Model appropriateness and population pharmacokinetic modeling. J. Clin. Pharmacol. 43, 610–623.
Gladman, D. D., Ibañez, D., and Urowitz, M. B. (2002). Systemic lupus erythematosus disease activity index 2000. J. Rheumatol. 29, 288–291.
Godron-Dubrasquet, A., Woillard, J.-B., Decramer, S., Fila, M., Guigonis, V., Tellier, S., et al. (2020). Mycophenolic acid area under the concentration-time curve is associated with therapeutic response in childhood-onset lupus nephritis. Pediatr. Nephrol. [Epub ahead of print]. doi:10.1007/s00467-020-04733-x
Hochberg, M. C. (1997). Updating the American college of rheumatology revised criteria for the classification of systemic lupus erythematosus. Arthritis Rheum. 40, 1725. doi:10.1002/1529-0131(199709)40:9<1725:AID-ART29>3.0.CO;2-Y
Holford, N. (2005). The visual predictive check-superiority to standard diagnostic (Rorschach) plots. Abstract of the Annual Meeting of the Population Approach Group in Europe. Abstr 738.
Le Meur, Y., Büchler, M., Thierry, A., Caillard, S., Villemain, F., Lavaud, S., et al. (2007). Individualized mycophenolate mofetil dosing based on drug exposure significantly improves patient outcomes after renal transplantation. Am. J. Transplant. 7, 2496–2503. doi:10.1111/j.1600-6143.2007.01983.x
Neumann, I., Fuhrmann, H., Fang, I. F., Jaeger, A., Bayer, P., and Kovarik, J. (2008). Association between mycophenolic acid 12-h trough levels and clinical endpoints in patients with autoimmune disease on mycophenolate mofetil. Nephrol. Dial. Transplant. 23, 3514–3520. doi:10.1093/ndt/gfn360
Prémaud, A., Le Meur, Y., Debord, J., Szelag, J. C., Rousseau, A., Hoizey, G., et al. (2005). Maximum a posteriori bayesian estimation of mycophenolic acid pharmacokinetics in renal transplant recipients at different postgrafting periods. Ther. Drug Monit. 27, 354–361. doi:10.1097/01.ftd.0000162231.90811.38
Sagcal-Gironella, A. C., Fukuda, T., Wiers, K., Cox, S., Nelson, S., Dina, B., et al. (2011). Pharmacokinetics and pharmacodynamics of mycophenolic acid and their relation to response to therapy of childhood-onset systemic lupus erythematosus. Semin. Arthritis Rheum. 40, 307–313. doi:10.1016/j.semarthrit.2010.05.007
Saint-Marcoux, F., Vandierdonck, S., Prémaud, A., Debord, J., Rousseau, A., and Marquet, P. (2011). Large scale analysis of routine dose adjustments of mycophenolate mofetil based on global exposure in renal transplant patients. Ther. Drug Monit. 33, 285–294. doi:10.1097/FTD.0b013e31821633a6
Sherwin, C. M., Sagcal-Gironella, A. C., Fukuda, T., Brunner, H. I., and Vinks, A. A. (2012). Development of population PK model with enterohepatic circulation for mycophenolic acid in patients with childhood-onset systemic lupus erythematosus. Br. J. Clin. Pharmacol. 73, 727–740. doi:10.1111/j.1365-2125.2011.04140.x
Staatz, C. E., and Tett, S. E. (2014). Pharmacology and toxicology of mycophenolate in organ transplant recipients: an update. Arch. Toxicol. 88, 1351–1389. doi:10.1007/s00204-014-1247-1
Tan, E. M., Cohen, A. S., Fries, J. F., Masi, A. T., McShane, D. J., Rothfield, N. F., et al. (1982). The 1982 revised criteria for the classification of systemic lupus erythematosus. Arthritis Rheum. 25, 1271–1277. doi:10.1002/art.1780251101
Tett, S. E., Saint-Marcoux, F., Staatz, C. E., Brunet, M., Vinks, A. A., Miura, M., et al. (2011). Mycophenolate, clinical pharmacokinetics, formulations, and methods for assessing drug exposure. Transplant. Rev. 25, 47–57. doi:10.1016/j.trre.2010.06.001
Tett, S. E., Saint-Marcoux, F., Staatz, C. E., Brunet, M., Vinks, A. A., Miura, M., et al. (2011). Mycophenolate, clinical pharmacokinetics, formulations, and methods for assessing drug exposure. Transplant. Rev. 25, 47–57. doi:10.1016/j.trre.2010.06.001
Tsokos, G. C. (2011). Systemic lupus erythematosus. N. Engl. J. Med. 365, 2110–2121. doi:10.1056/NEJMra1100359
Tunnicliffe, D. J., Singh-Grewal, D., Kim, S., Craig, J. C., and Tong, A. (2015). Diagnosis, monitoring, and treatment of systemic lupus erythematosus: a systematic review of clinical practice guidelines. Arthritis Care Res. 67, 1440–1452.
van Gelder, T., Le Meur, Y., Shaw, L. M., Oellerich, M., DeNofrio, D., Holt, C., et al. (2006). Therapeutic drug monitoring of mycophenolate mofetil in transplantation. Ther. Drug Monit. 28, 145–154. doi:10.1097/01.ftd.0000199358.80013.bd
Villarroel, M. C., Hidalgo, M., and Jimeno, A. (2009). Mycophenolate mofetil: an update. Drugs Today 45, 521–532. doi:10.1358/dot.2009.45.7.1384878
Woillard, J. B., Bader-Meunier, B., Salomon, R., Ranchin, B., Decramer, S., Fischbach, M., et al. (2014). Pharmacokinetics of mycophenolate mofetil in children with lupus and clinical findings in favour of therapeutic drug monitoring. Br. J. Clin. Pharmacol. 78, 867–876. doi:10.1111/bcp.12392
Yoshimura, K., Yano, I., Yamamoto, T., Kawanishi, M., Isomoto, Y., Yonezawa, A., et al. (2018). Population pharmacokinetics and pharmacodynamics of mycophenolic acid using the prospective data in patients undergoing hematopoietic stem cell transplantation. Bone Marrow Transplant. 53, 44–51. doi:10.1038/bmt.2017.213
Zabotti, A., Baraldo, M., Quartuccio, L., Sacco, S., De Marchi, G., and De Vita, S. (2015). Optimizing the dose of mycophenolate mofetil for the maintenance treatment of lupus nephritis by therapeutic drug monitoring. Clin. Rheumatol. 34, 171–174. doi:10.1007/s10067-014-2786-9
Zahr, N., Amoura, Z., Debord, J., Hulot, J. S., Saint-Marcoux, F., Marquet, P., et al. (2008). Pharmacokinetic study of mycophenolate mofetil in patients with systemic lupus erythematosus and design of Bayesian estimator using limited sampling strategies. Clin. Pharmacokinet. 47, 277–284. doi:10.2165/00003088-200847040-00005
Zahr, N., Arnaud, L., Marquet, P., Haroche, J., Costedoat-Chalumeau, N., Hulot, J. S., et al. (2010). Mycophenolic acid area under the curve correlates with disease activity in lupus patients treated with mycophenolate mofetil. Arthritis Rheum. 62, 2047–2054. doi:10.1002/art.27495
Zeng, L., Blair, E. Y., Nath, C. E., Shaw, P. J., Earl, J. W., Stephen, K., et al. (2010). Population pharmacokinetics of mycophenolic acid in children and young people undergoing blood or marrow and solid organ transplantation. Br. J. Clin. Pharmacol. 70, 567–579. doi:10.1111/j.1365-2125.2010.03734.x
Keywords: mycophenolic acid, pharmacokinetic/pharmacodynamic, children, systemic lupus erythematosus, precision dosing
Citation: Chen Y, Sun L, Xu H, Dong M, Mizuno T, Vinks AA, Brunner HI, Li Y and Li Z (2020) PK/PD Study of Mycophenolate Mofetil in Children With Systemic Lupus Erythematosus to Inform Model-Based Precision Dosing. Front. Pharmacol. 11:605060. doi: 10.3389/fphar.2020.605060
Received: 11 September 2020; Accepted: 27 November 2020;
Published: 18 December 2020.
Edited by:
Ileana Mardare, Carol Davila University of Medicine and Pharmacy, RomaniaReviewed by:
Eva Nüsken, University Hospital of Cologne, GermanyTomasz Pawinski, Medical University of Warsaw, Poland
Copyright © 2020 Chen, Sun, Xu, Dong, Mizuno, Vinks, Brunner, Li and Li. This is an open-access article distributed under the terms of the Creative Commons Attribution License (CC BY). The use, distribution or reproduction in other forums is permitted, provided the original author(s) and the copyright owner(s) are credited and that the original publication in this journal is cited, in accordance with accepted academic practice. No use, distribution or reproduction is permitted which does not comply with these terms.
*Correspondence: Zhiping Li, enBsaUBmdWRhbi5lZHUuY24=