- 1Hospital of Stomatology, Sun Yat-sen University, Guangzhou, China
- 2Guangdong Provincial Key Laboratory of Stomatology, Guangzhou, China
- 3Guanghua School of Stomatology, Sun Yat-sen University, Guangzhou, China
Backgrounds: Immunotherapy is effective in a subset of head and neck squamous cell carcinoma (HNSCC). However, the unfavorable response rate and inadequate biomarkers for stratifying patients have primarily limited its clinical application. Considering transcriptional factors (TFs) play essential roles in regulating immune activity during HNSCC progression, we comprehensively analyzed the expression alterations of TFs and their prognostic values.
Methods: Gene expression datasets and clinical information of HNSCC were obtained from The Cancer Genome Atlas (TCGA) and Gene Expression Omnibus (GEO) repository. Then, Brain abundant membrane attached signal protein 1 (BASP1) was screened out of differentially expressed TFs by univariate and multivariate survival analysis. Tumor immune dysfunction and exclusion (TIDE) was applied to analyze the response to immunotherapy of BASP1high/low patients. Meanwhile, GO, KEGG and GSEA analyses were used to enrich the pathways between the BASP1high and BASP1low groups. Single-sample gene set enrichment analysis (ssGSEA), CIBERSORT, EPIC and quanTiseq algorithms were applied to explore immune infiltrations. Also, immune cycle analysis was conducted by ssGSEA. Additionally, lipid peroxidation, glutathione and reactive oxygen species were performed to detect the ferroptosis alternations.
Results: BASP1 was upregulated and associated with poor survival in HNSCC patients. BASP1high patients exhibited better response rates to anti-PD-1 immunotherapy and higher expressions of immune checkpoint inhibitors. GO, KEGG and GSEA analyses indicated that the expression of BASP1 was related to several immune-related pathways and immunogenic ferroptosis signature. The infiltration of activated CD8+ T cells was authenticated to be decreased in BASP1high patients. Furthermore, BASP1 was identified to be positively correlated with T cell dysfunction and immune escape. Moreover, silencing BASP1 triggered ferroptosis in HNSCC cells, representing as increased LDH, lipid peroxidation and ROS levels, and reduced glutathione synthesis
Conclusions: We demonstrated that BASP1 suppressed immunogenic ferroptosis to induce immunosuppressive tumor microenvironment. BASP1 plays a critical role in immune response, and might be a promising classifier for selecting HNSCC patients who benefit from current immunotherapy.
Introduction
Head and neck squamous cell carcinoma (HNSCC) is the 7th most common malignant tumor worldwide with high mortality (1). Immune checkpoint inhibitors (ICIs) therapies that recover T cell cytotoxicity effect towards tumor cells have achieved remarkable progress in multiple cancers (2–4). The programmed cell death 1 (PD-1) antibodies, pembrolizumab and nivolumab, have been approved for the first-line treatment of recurrent/metastatic HNSCC patients since 2019. Although the responses seem to be durable to those who benefit from these agents, only a subset of HNSCC patients is expected to respond to ICIs for the lack of reliable predictive biomarkers (5, 6). Hence, the importance of developing reliable predictive biomarkers for immunotherapy and ideal therapeutic strategies for personalized clinical management of HNSCC patients has been highlighted (7).
HNSCC tumors exhibit high heterogeneity of tumor microenvironment (TME) and evade immune surveillance by a number of different mechanisms (8). The immune cells in the TME consist of tumor-infiltrating lymphocytes (TILs), including natural killer (NK) cells, T cells and B cells, and myeloid-lineage cells, including dendritic cells, neutrophils, and macrophages. The effector CD8+ T cells and NK cells are the main components of immune killing and tumor cell elimination, while Treg cells and M2 macrophages are responsible for immune suppression and tumor progression. Molecular signatures and biomarkers have been constructed as classifiers to identify immune phenotypes of HNSCC tumors for predicting ICIs therapy response, including epithelial-mesenchymal transition (EMT), ferroptosis, etc. (9, 10). However, HNSCC patients who might respond to ICIs therapy have not yet been identified.
Transcription factors (TFs) play a leading role in the initiation of cancer progression via regulating the expressions of cancer hallmarks genes (11), such as DNA damage and repair, EMT, and immune response, and are potential prognostic biomarkers and therapeutic targets for developing anticancer drugs (12). Our study has demonstrated that SPDEF could transcriptionally activate NR4A1 to suppress the HNSCC progression (13). Additionally, a recent study has mentioned that TYRO3 is a predictive biomarker for patient stratification in breast cancers to suppress immune therapeutic outcomes by limiting tumoral ferroptosis (14). TCF7 has been recognized as a practical marker to predict positive clinical outcomes in patients treated with anti-PD-1 therapy (15). However, the prognostic prediction values and biological functions of TFs in HNSCC remain unclear.
In this study, we comprehensively explored the aberrantly expressed TFs in HNSCC and their correlation with the survival of HNSCC patients. We identified that BASP1 was upregulated with poor prognosis, and correlated with positive response to ICIs therapy. We then performed functional enrichment and immune cell infiltration analyses between the BASP1high and BASP1low patients. Our results indicated that BASP1 was associated with immune cell infiltration and ferroptosis in HNSCC and could predict prognosis and anti-PD-1 therapeutic response, which might offer a novel therapeutic strategy for HNSCC patients.
Materials and methods
Datasets and data preprocessing
RNA sequencing (RNA-seq, count and TPM values) and clinical data were downloaded from the HNSC dataset of The Cancer Genome Atlas (TCGA) database and calculated using TCGAbiolinks R package (16). Transcripts per kilobase million (TPM) values of RNA-seq data were used to compare the differences in gene expression between normal (n=44) and tumor (n=502) samples (17). Cases with insufficient or missing data were deleted from subsequent data processing. GSE30784, GSE103322, GSE41613 and GSE65858 were downloaded from the Gene Expression Omnibus (GEO) repository with GEOquery R package (18–22). GSE30784 and GSE103322 were used to analyze differential expression genes, while GSE41613 and GSE65858 were used to validate survival analyses. Furthermore, The TFs list was collected from AnimalTFDB 3.0 (http://bioinfo.life.hust.edu.cn/AnimalTFDB/) (23). Genes encoding immunomodulators and chemokines and gene signatures of TILs were obtained from TISIDB (http://cis.hku.hk/TISIDB). Ferroptosis scores referred to previous study (24).
Differential expression analysis of TFs
To obtain genes differentially expressed between tumor and normal tissue, differentially expressed genes (DEGs, adjusted P-value < 0.05, |log2FC| > 1) were screened by DEseq2 package with the raw count data of HNSCC samples. The limma package was used to analyze the differentially expressed TFs (DE-TFs) in GSE30784 and GSE103322 with the threshold set at false discovery rate (FDR) < 0.05 & |log2FC| >1 and FDR < 0.05 & |log2FC| > 0.4, respectively. The intersection of three DE-TFs sets was achieved and the Venn plot was drawn with Venngram package.
Prognosis analysis
Univariate Cox regression and the Kaplan-Meier method were used to assess the prognostic role of DE-TFs in the overall survival (OS) of HNSCC patients. The continuous variable of DE-TFs TPM data was used in the univariate Cox regression. Then, candidates with p < 0.05 were entered into stepwise multivariate Cox proportional hazard regression models. High and low groups based on BASP1 expression (BASP1high and BASP1low) were applied to perform Kaplan–Meier curves analysis, employing survminer and survival packages. The best cut-off points were evaluated by the “surv-cutpoint” function in the survminer R package. The log-rank P-value and hazard ratio (HR) with 95% confidence intervals were calculated and the survival analysis outcomes were presented as forest plots, tables and Kaplan-Meier plots, respectively.
Gene function analysis
DEGs (adjusted P-value < 0.05) between low- and high- BASP1 expression groups were identified by the DESeq2 package. Then, DEGs with a significant correlation with BASP1 (p < 0.05, |r| > 0.2) were included in the Gene Ontology (GO), Kyoto Encyclopedia of Genes and Genomes (KEGG) and Gene set enrichment analysis (GSEA) analyses using ClusterProfiler package (25). The adjusted p < 0.05 was set in GO and KEGG analysis, and bubble plot and bar plot were applied to show the outcomes. Furthermore, the “gmt” file of the hallmark gene set (h.all.v7.5.1.entrez.gmt) was obtained from Molecular Signatures Database (MSigDB, https://www.gsea-msigdb.org/gsea/index.jsp). FDR < 0.05, and normalized enrichment score (|NES|) > 1 were considered significantly different and shown by enrichplot package.
Immune features analysis
The Tumor Immune Dysfunction and Exclusion (TIDE, http://tide.dfci.harvard.edu/) (26) algorithm was employed to evaluate the exclusion of CTLs. And the evaluation of BASP1 as a biomarker was obtained from the TIDE website. Additionally, ssGSEA was used to assess the cancer immunity cycle based on the gene expression of each sample (27).
Estimation of tumor microenvironment
We used multiple methods to infer the tumor microenvironment based on the transcriptional profiles. The cibersort and cibersort-abs (https://cibersort.stanford.edu/) method and LM22 gene signature, including 22 immune cell types, were used to quantify the proportions of immune cells in HNSCC samples. Additionally, quanTiseq, MCPcounter, EPIC, and ssGSEA which were integrated into immunedeconv package and GSVA package (28), were also used to evaluate the immune cell infiltration of tumor samples. All immune-related scores were separated into BASP1high and BASP1low groups.
Cell culture
The HNSCC cell lines purchased from the American Type Culture Collection (ATCC, Manassas, VA, USA) and the Japanese Collection of Research Bioresources (JCRB, Tokyo, Japan) were maintained in our laboratory. HSC3 and HSC4 cells were cultured in DMEM/F12 medium (DMEM and F12 were 1:1 mixed) and MEM medium (Gibco, Grand Island, NY, USA), respectively, supplemented with 10% fetal bovine serum (FBS, BI, Kibbutz Beit Haemek, Israel). Cells were cultured in 5% CO2 at 37°C. The cells proved to be free from mycoplasma or cell cross-contamination.
Transfection of small interfering RNA
The BASP1-siRNAs were bought from GenePharma (Shanghai, China). The sequences were as follows: NC: 5’-UUCUCCGAACGUGUCACGUTT-3’, 5’-UUCUCCGAACGUGUCACGUTT-3’; si-1: 5’-GAGGCAAGCUCAGCAAGAATT-3’, 5’-UUCUUGCUGAGCUUGCCUCTT-3’; si-2: 5’-GAGAAAGCCAAGGAGAAAGTT-3’, 5’-CUUUCUCCUUGGCUUUCUCTT-3’. For siRNA transfection, HSC3 and HSC4 cells were seeded at 2.5 × 10⁵ cells per well on 6-well plates and transfected with siRNA and Lipofectamine 3000 (Invitrogen, Waltham, MA, USA) reagent when close to 60% concentration, following the recommended instructions. After 24 hours, the transfected cells were harvested for further study.
Cytotoxicity assays
Cytotoxicity was measured by the Cytotoxicity Detection Kit (LDH) (Roche, Mannheim, Germany) according to the manufacturer’s instructions. Briefly, the transfected cells were seeded in black 96-well plates (Corning, NY, USA) at 2,000 - 3,000 cells per well for 24 hours. Cell supernatant was collected and centrifuged at 400g for 5 min and discarded cell precipitation. 100 μl cell supernatant per well was added to a black 96-well plate. Then, 100 μl LDH Reaction Mixture was added to the supernatant. The mixture was incubated at room temperature away from light for 30 min. The absorbance (490 nm) was measured with a multifunctional microplate reader (BioTek, USA). The BCA quantitative method was performed to normalize the number of cells per well.
Western blot
Cells were washed with icy phosphate-buffered saline (PBS, Pleasanton, CA, USA) and lysed with lysis buffer (CWBIO, Beijing, China) containing 1% protease inhibitor Cocktail (CWBIO) and 1% phosphatase inhibitors (CWBIO). All protein lysates were centrifuged with 10000g at 4°C for 15 min to remove cell precipitates. Protein concentration was measured using the BCA Protein Assay Kit (Thermo Fisher Scientific, Waltham, MA, USA). Then, loading buffer was added to the proteins and cooked at 99°C for denaturation. Proteins were loaded on a 10% SDS PAGE Gel and transferred onto a PVDF membrane (Millipore, Boston, MA, USA). After being blocked with milk, the membranes were incubated with indicated primary antibody at 4°C overnight. The primary antibodies were listed as follows: BASP1 (Bioss, Beijing, China, 1:1000) and GAPDH (Proteintech, Rosemont, IL, USA, 1:2000). The HRP-linked secondary antibody (CST, Danvers, MA, USA 1:3000) was incubated at room temperature for one hour. The chemiluminescence signals were detected by ChemiDoc Touch Imaging System (Bio-Rad, Berkeley, CA, USA).
Quantitative RT-PCR
Following the manufacturer’s instructions, total RNA was extracted by the RNeasy kit Mini Kit (Qiagen, Dusseldorf, Germany). Briefly, 2μg RNA was transformed into cDNA by reverse transcription reaction with random primers (Vazyme, Nanjing, China). The qPCR was performed on cDNA using TransStart® SYBR Green qPCR SuperMix (TransGen, Beijing, China) on a StepOnePlus™ Real-Time PCR System (Thermo Fisher Scientific). The primers were listed as follows: BASP1 forward: 5’-GCCCAGGAGACCAAAAGTGA-3’, BASP1 reverse: 5’-CCTTGGGTGTGGAACTAGGC-3’; GAPDH forward: 5’-CTCCTCCTGTTCGACAGTCAGC-3’, GAPDH reverse: 5’-CCCAATACGACCAAATCCGTT-3’. GAPDH was used as the endogenous control. The ΔΔCt was used to calculate the relative mRNA expression.
Lipid peroxidation
Cells were stained with 5μM BODIPY C11 (Invitrogen) at 37°C for 10 min. Then, cells were washed with PBS to remove the dye, digested with trypsin and resuspended in 500μl PBS. After that, cells were passed through a 40μm cell strainer (Corning) and analyzed using the 488 nm laser of a flow cytometer (Beckman, Indianapolis, IN, USA) and analyzed by FlowJo V10 software (BD, Franklin Lakes, NJ, USA).
Glutathione quantification
The 5×10⁴ cells per well were seeded in a 96-well plate and harvested for measurement of glutathione using the GSH and GSSG Assay Kit (Beyotime, Shanghai, China) according to the manufacturer’s protocol. The Glutathione (GSH) and Oxidized Glutathione (GSSG) concentrations were calculated using a standard curve. The calculation formula is as follows: GSH = Total Glutathione - GSSG × 2.
Reactive oxygen species detection
Cytosolic ROS (cROS) was detected by the Reactive Oxygen Species Assay Kit (Beyotime). Cells were seeded in a 6-well cell culture plate and incubated with PBS containing 10μM DCFH-DA at 37°C for 30min in darkness when the cell concentration reached 80%. Staining cells were collected and washed with PBS. DCFH-DA was detected at the wavelengths of 488nm using flow cytometer.
Statistical analysis
All the statistical analysis was executed by R software (version 4.2.0) and GraphPad Prism software (version 8.0.1). If the data followed Gaussian distribution, the parametric test (unpaired student’s test, one-way ANOVA, or Pearson correlation) was conducted. Otherwise, the nonparametric test (Wilcoxon rank test or Spearman correlation) was performed. All data was presented as the mean ± s.d. P < 0.05 was considered statistically significant.
Results
High BASP1 is related to poor survival of HNSCC patients
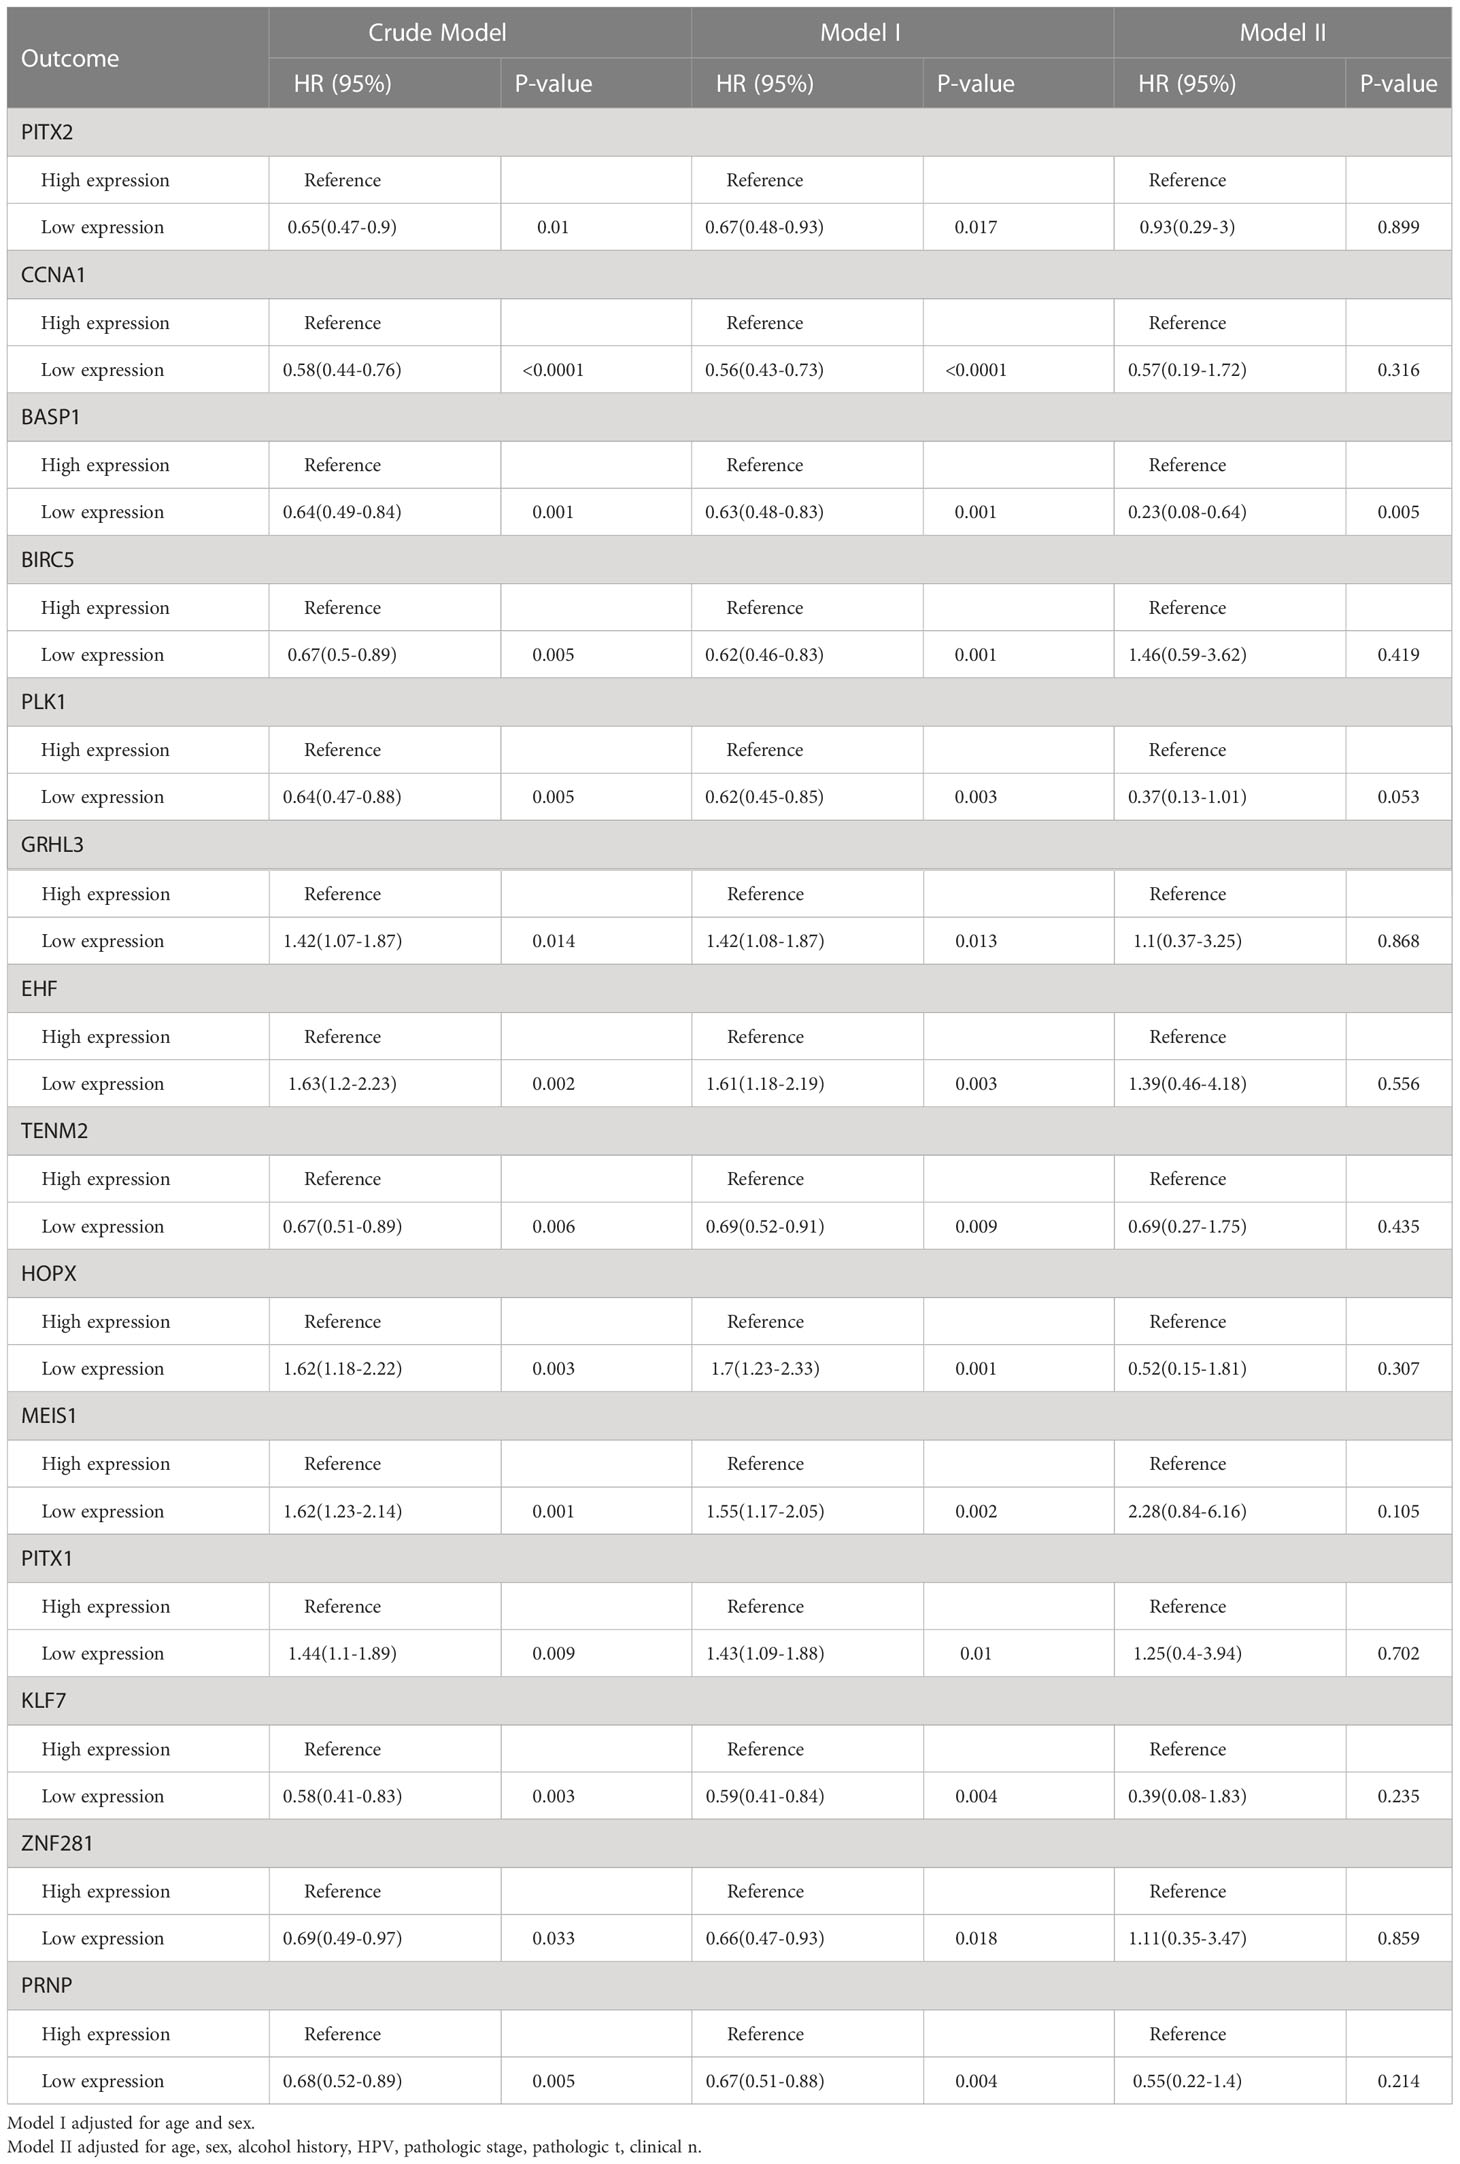
The differentially expressed TFs between normal and HNSCC tissues were screened out following the workflow shown in Figure 1A. Totally, 45 differentially expressed TFs were identified in HNSCC tissues in TCGA-HNSC, GSE103322 and GSE30784 datasets (Figures 1B, C). Univariate Cox regression analysis identified 14 differentially expressed TFs, which were correlated with the overall survival of HNSCC patients (Figure 1D). The multivariate Cox regression analysis showed that only BASP1 was associated with patients’ overall survival in either the crude model or the adjusted Model I/II models, indicating that BASP1 was an independent risk factor of HNSCC (Table 1).
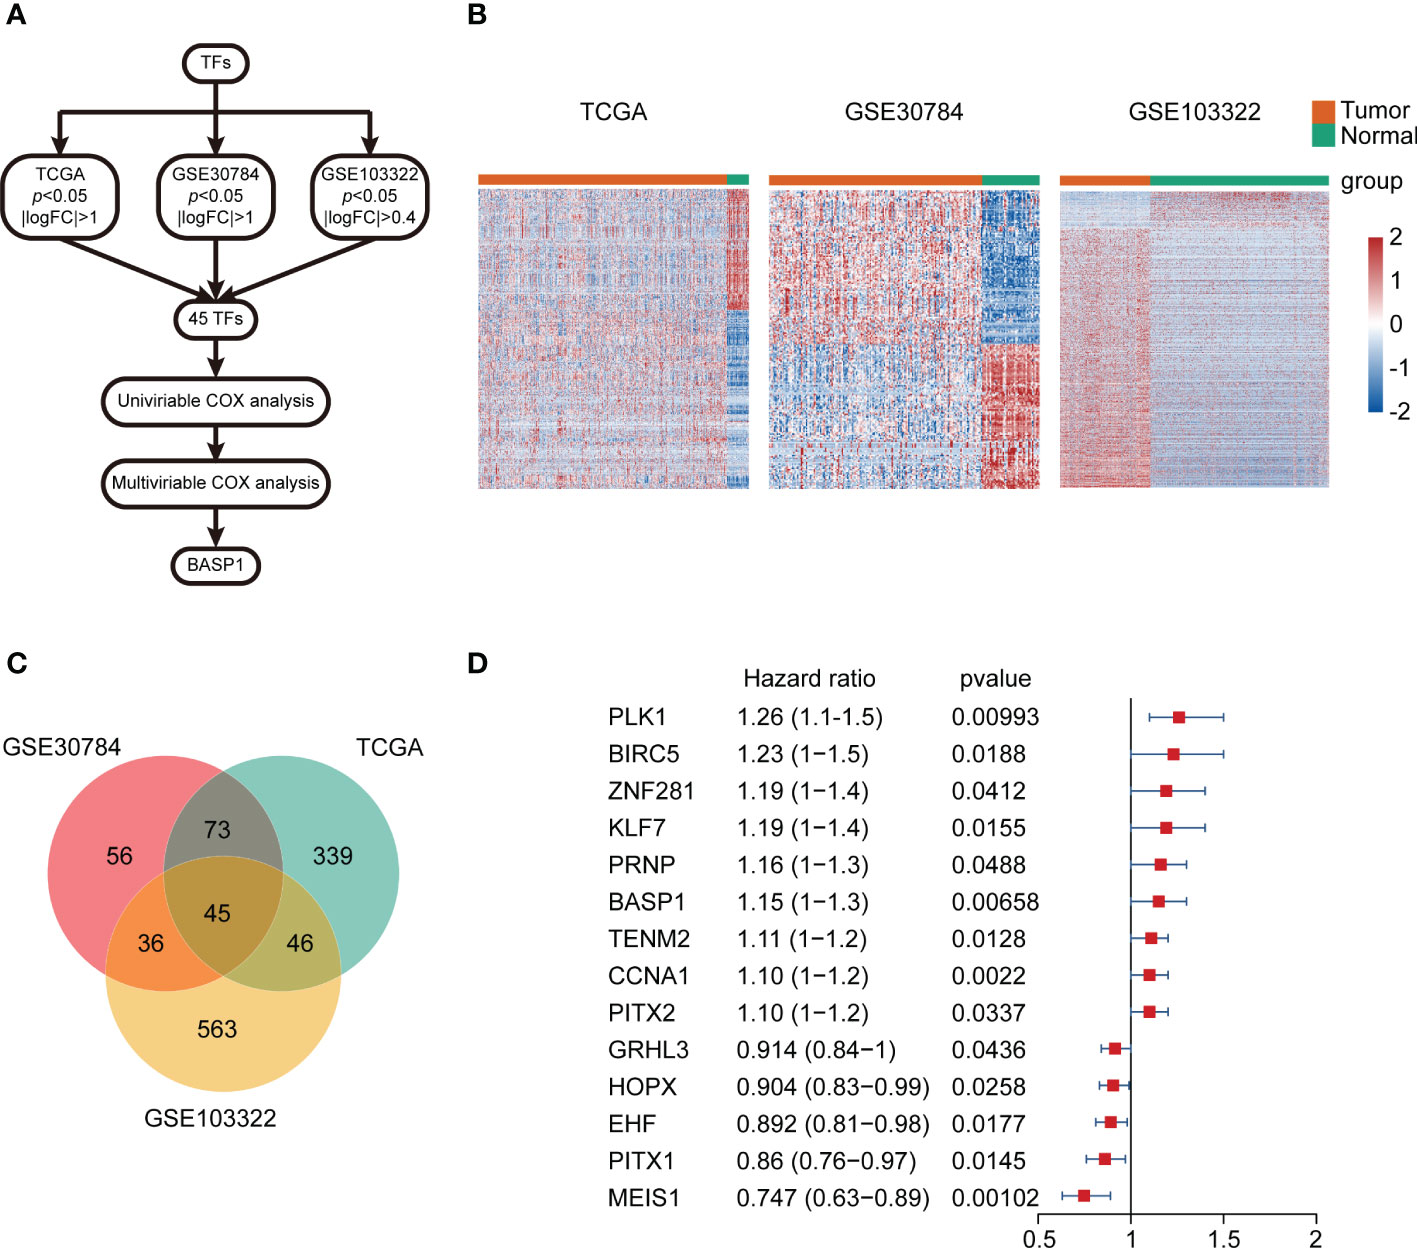
Figure 1 The expressions and prognostic values of TFs in HNSCC. (A) Workflow of identifying BASP1 in HNSCC. (B) Heatmap of differentially expressed TFs between normal controls and HNSCC tissues in the TCGA database, GSE103322 and GSE30784. (C) Venn plot of the intersection of three cohorts of differentially expressed TFs. (D) The forest plot of 14 TFs correlated with HNSCC overall survival in the univariate Cox regression model.
In contrast to the normal tissues, the expressions of BASP1 were higher in both unpaired and paired HNSCC specimens (Figure 2A). We examined the mRNA levels of BASP1 in human oral keratinocytes cell line (HOK) and HNSCC cell lines using qPCR, and confirmed that BASP1 was upregulated in HNSCC cell lines (Figure 2B). The Kaplan-Meier survival analysis illustrated those patients with high BASP1 expression levels were associated with poorer overall survival than those with low expression levels in TCGA, GSE41613 and GSE65858 (Figures 2C–E). Meanwhile, BASP1low group had a better prognosis in disease specific survival (DSS) (Supplementary Figure S1). Thus, these results demonstrated that BASP1 upregulation was correlated with unfavorable survival in HNSCC patients.
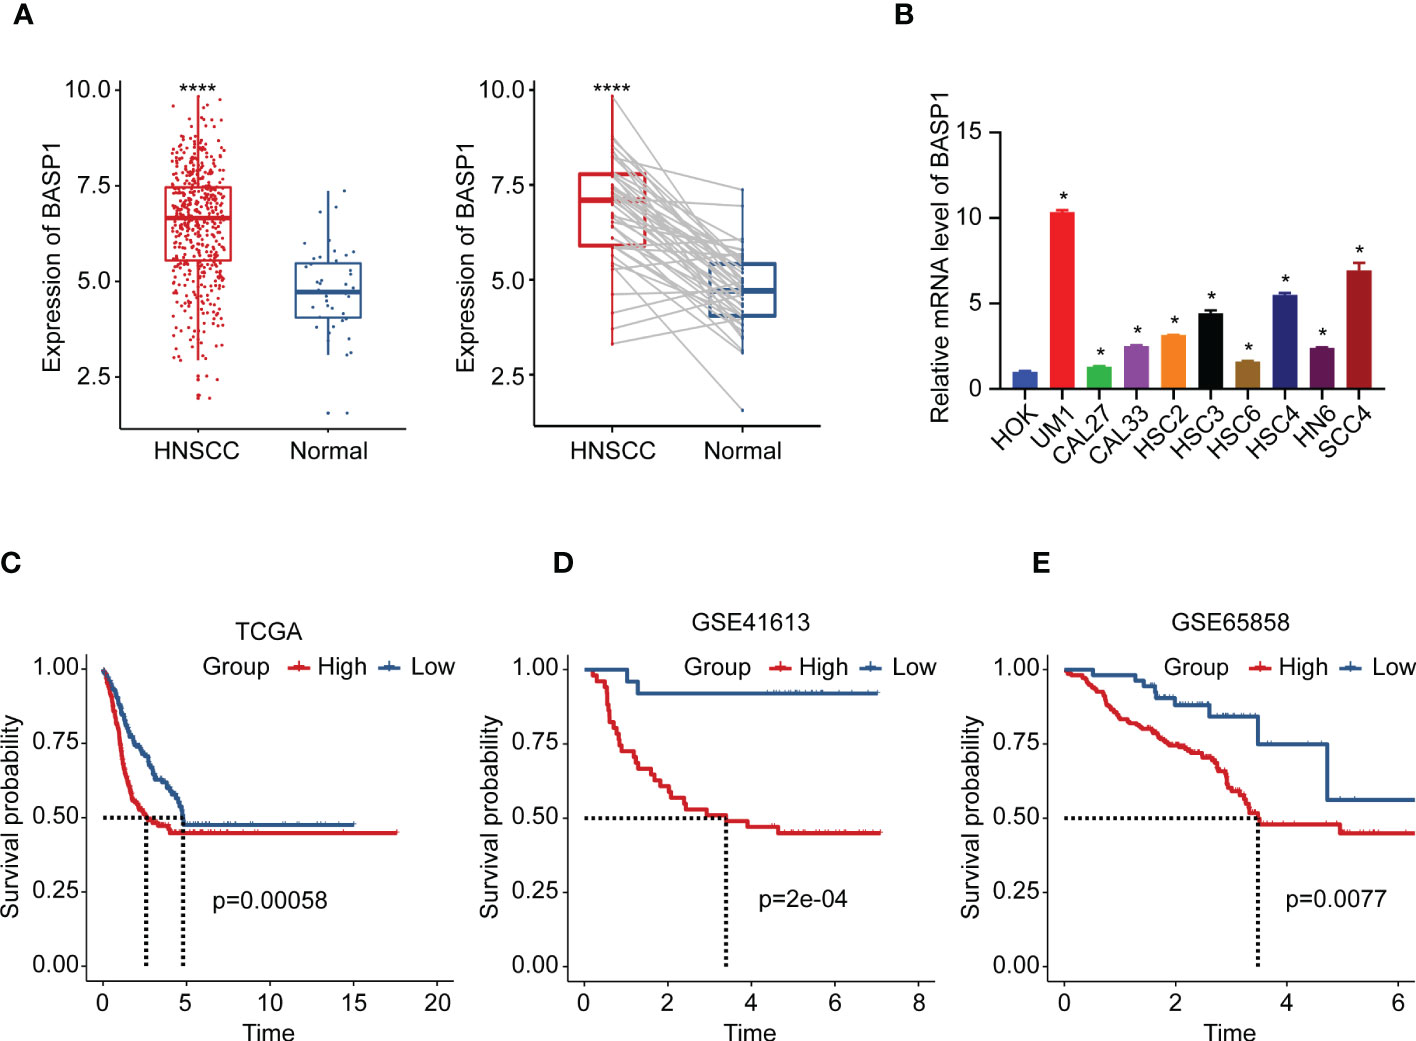
Figure 2 The expression and prognosis of BASP1 in HNSCC. (A) The box plot of BASP1 expressions between normal tissues and paired/unpaired HNSCC tissues. (B) The mRNA levels of BASP1 in HOK and HNSCC cell lines (UM1, CAL27, CAL33, HSC2, HSC3, HSC6, HSC4, HN6, and SCC4). (C-E) Kaplan-Meier survival curve of BASP1 in HNSCC from TCGA HNSC (C), GSE41613 (D), and GSE65858 (E). * p < 0.05; **** p < 0.0001.
High BASP1 level exhibits better response to anti-PD-1 immunotherapy
Then, we wondered whether BASP1 expression was associated with immunotherapy response. The TIDE algorithm was performed to predict the response rate to immunotherapy, which demonstrated that patients with high BASP1 had a better prognosis in anti-PD-1 therapy in melanoma (Figure 3A). The TIDE biomarker evaluation modular showed that BASP1 was potential to stratify immunotherapy patients for precision therapy compared to other indicators (Figures 3B, C). Furthermore, the immunoinhibitors (CD276, CD274, CSF1R, HAVCR2, IL10, KDR, PDCD1LG2, TGFB1 and TGFBR1) were high expressed, while the immunostimulators (CD40LG, HHLA2, KLRK1, TNFRSF13B, TNFRSF13C, TNFRSF17, TNFRSF18, and TNFSF18) were low expressed in BASP1high HNSCC patients (Figure 3D). Therefore, these results demonstrated that BASP1 was correlated with immune activity, and patients with high BASP1 levels exhibited favorable immunotherapy response rates.
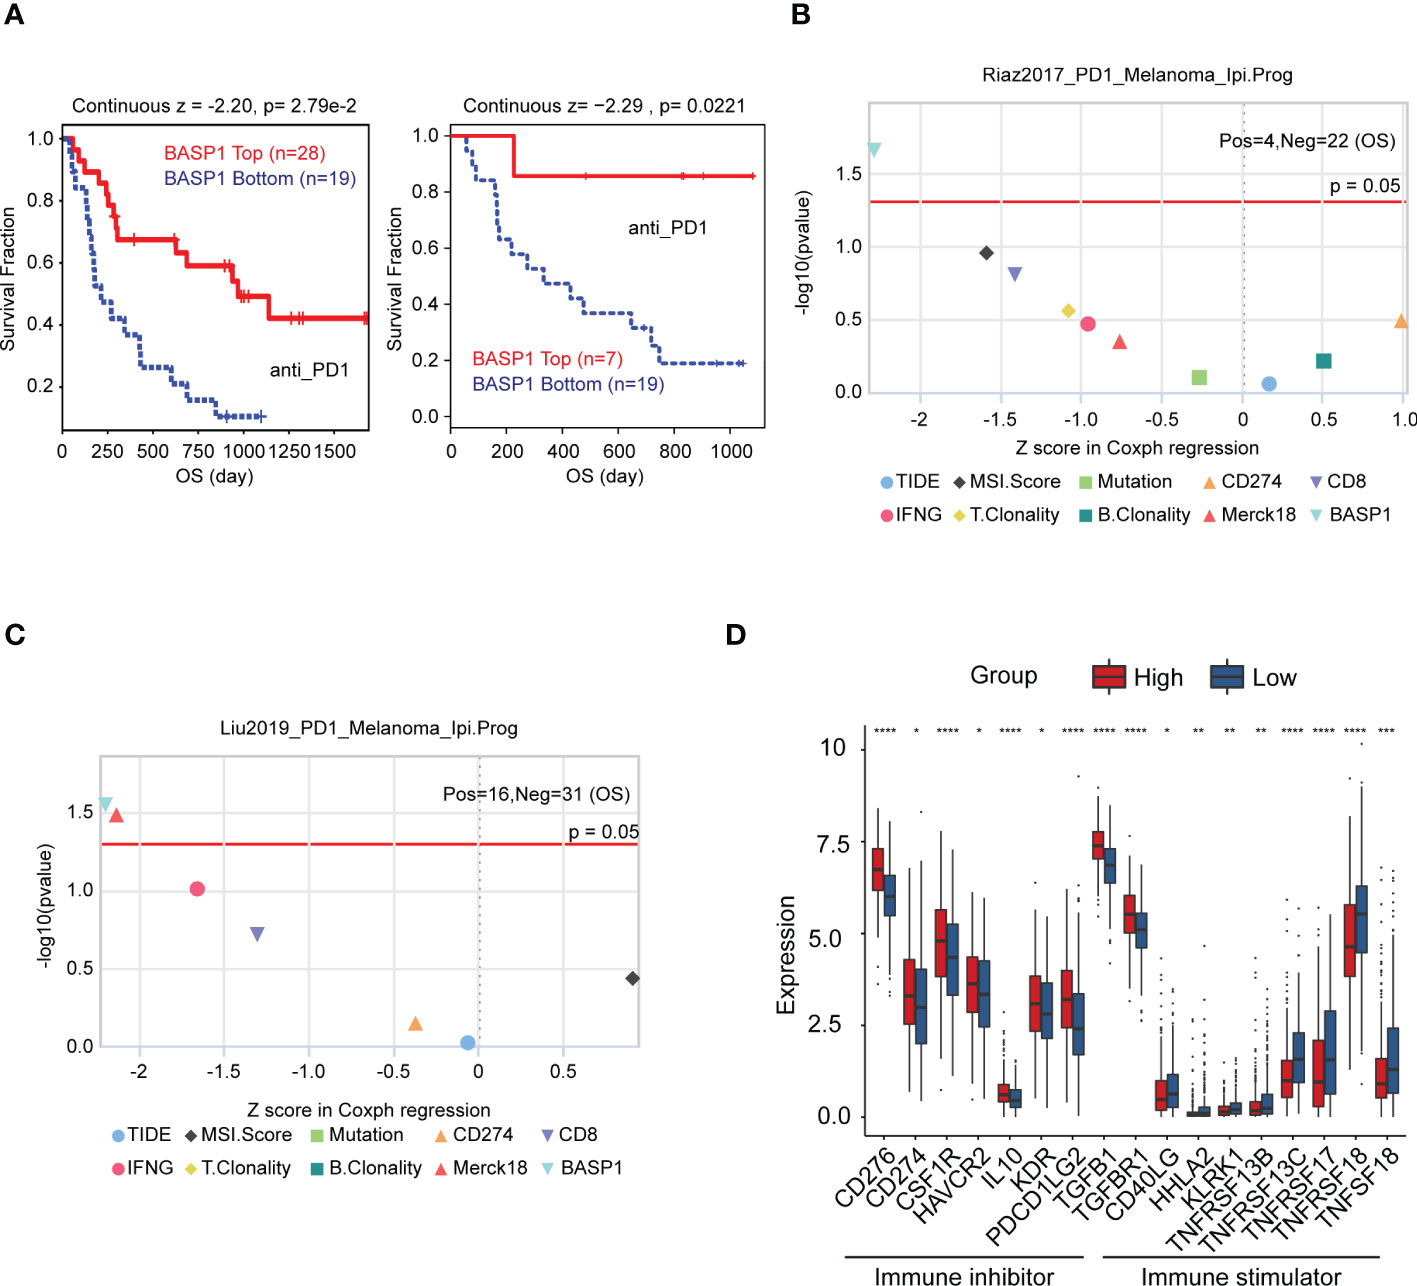
Figure 3 The relationship between BASP1 expression and immunotherapy. (A) Overall survival of BASP1high group and BASP1low group in melanoma patients that accepted anti-PD1 therapy. (B, C) The evaluation of immunotherapy biomarkers in TIDE. (D) Boxplot of the immune molecules expressions in BASP1high and BASP1low HNSCC patients. * p < 0.05; ** p < 0.01; *** p < 0.001; **** p < 0.0001.
BASP1 reduced the CD8+ T cells infiltration into the tumor microenvironment of HNSCC
To elucidate the roles of BASP1 in HNSCC progression and the mechanism of enhancing immunotherapy response, we detected the differentially expressed genes between BASP1high and BASP1low groups. The GO, KEGG and GSEA analyses were performed to examine the different pathways enrolled in the two subtypes. GO and KEGG analysis showed that differentially expressed genes were enriched in several oncogenic signaling pathways, such as Wnt and MAPK signaling pathways, and immune-related signals, such as leukocyte migration, macrophage differentiation, and monopolar cell polarity (Figures 4A–C). Besides, GSEA demonstrated that BASP1 was positively correlated with angiogenesis, KRAS, EMT, hypoxia, complement and inflammatory response (Figure 4D).
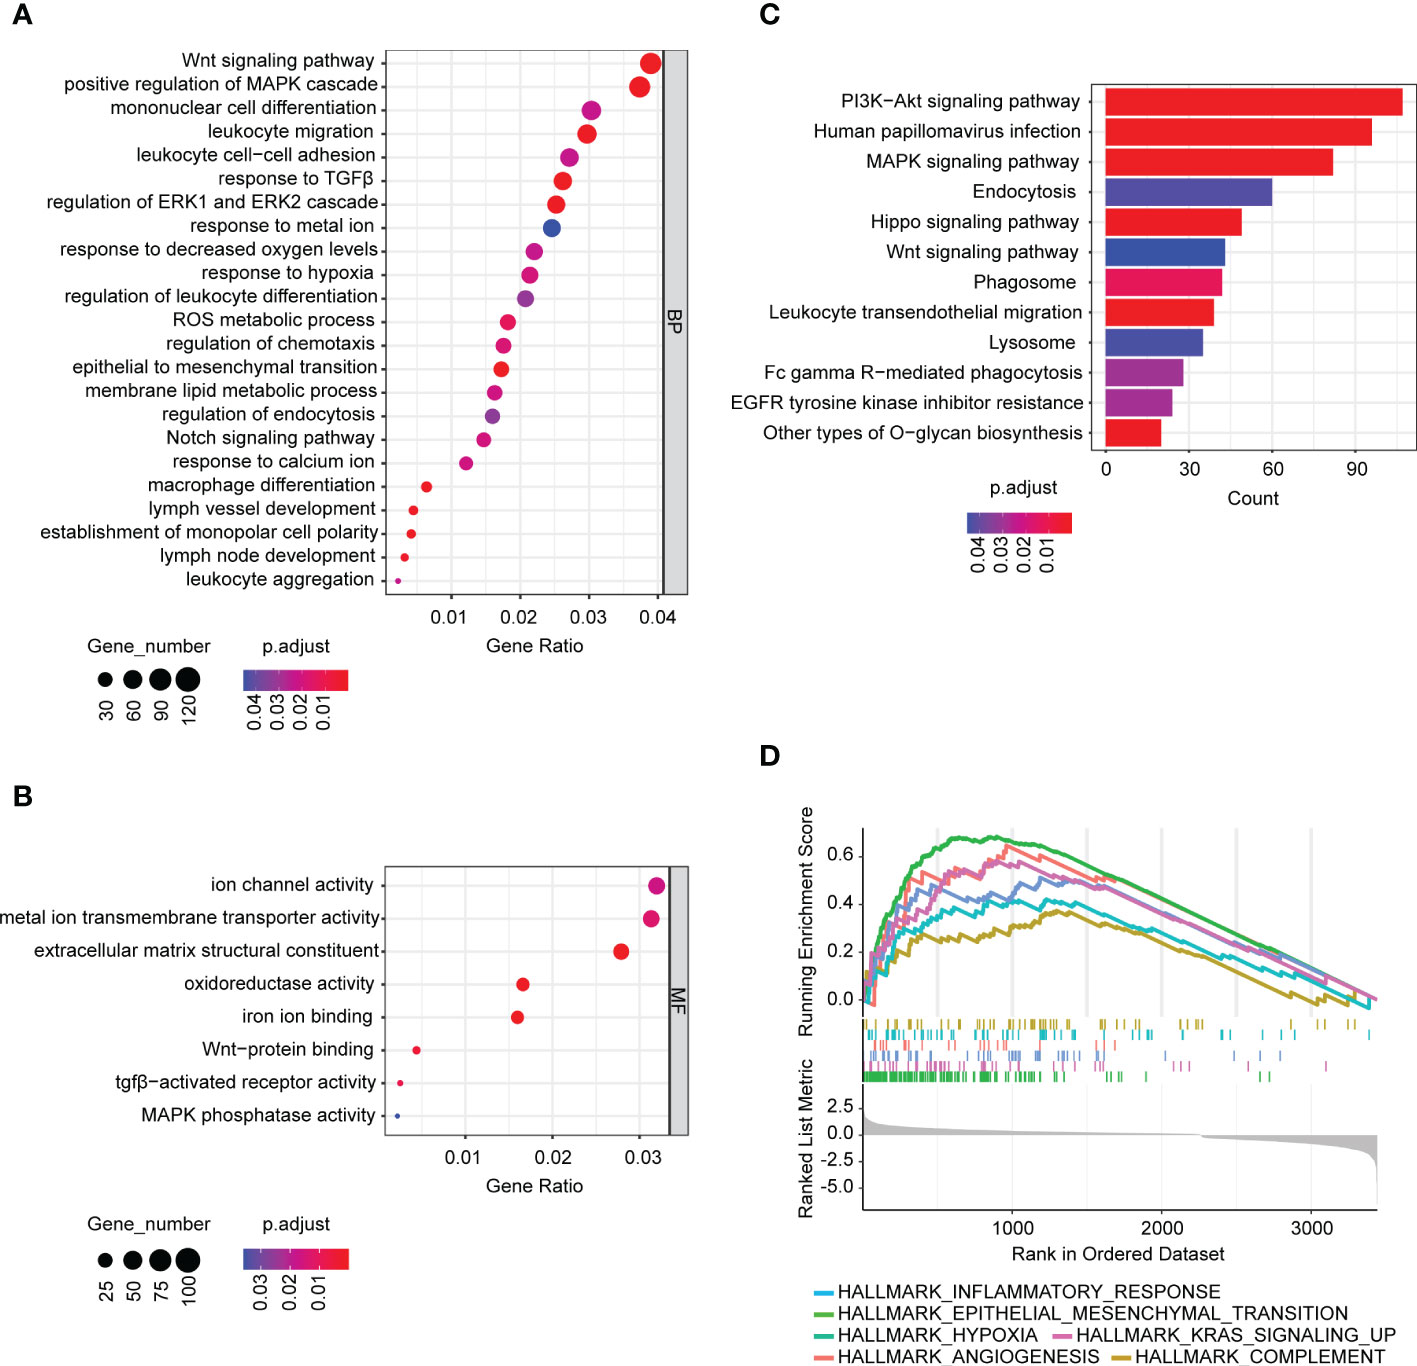
Figure 4 The signaling pathways associated with BASP1 expressions. (A, B) Bubble plot of GO analysis of differentially expressed genes between BASP1high and BASP1low group, including biological processes (A) and molecular functions (B). (C, D) KEGG (C) and GSEA (D) analysis of differentially expressed genes between BASP1high and BASP1low group.
TME plays a fundamental role in tumor progression and immunotherapy response. To explore the correlation between BASP1 expression and TME, we firstly determined the difference in HNSCC TME cell infiltration components between BASP1 subtypes. ESTIMATE analysis showed that the stromal and estimate scores of the BASP1high group were higher than the BASP1low group, yet the immune score was not statistically significant, indicating no difference in total immune cells infiltration between BASP1high and BASP1low patients (Figure 5A). Then, we calculated the differences of subgroups of immune cells according to BASP1 expressions using ssGSEA analysis, which clarified that the activated CD8+ T cells were reduced in BASP1high group though most immune cells were increased in BASP1high group (Figure 5B). CIBERSORT also confirmed that the proportion of CD8+ T cells was obviously downregulated in BASP1high group (Figure 5C). Furthermore, the expression of BASP1 was negatively correlated with CD8+ T cells infiltration (Figure 5D). Given that CD8+ T cell is the critical mediator of cytotoxic effector in killing tumor cells (29), to further illustrate the killing power of BASP1high tumor, the quenTiseq, EPIC, and Cibersort-ABS were applied to assess the infiltration of activated CD8+ T cells. Similarly, all the algorithms clarified that the activated CD8+ T cells were lower in the BASP1high group (Figure 5E). In addition, cancer-associated fibroblasts (CAFs), which act as stromal cell clusters and promote the recruitment and activation of immunosuppressive cells (30), were substantially elevated in BASP1high tumors (Figure 5F). Collectively, these results indicated that BASP1high patients had decreased activated CD8+ T cells infiltration and immunosuppressive TME in HNSCC.
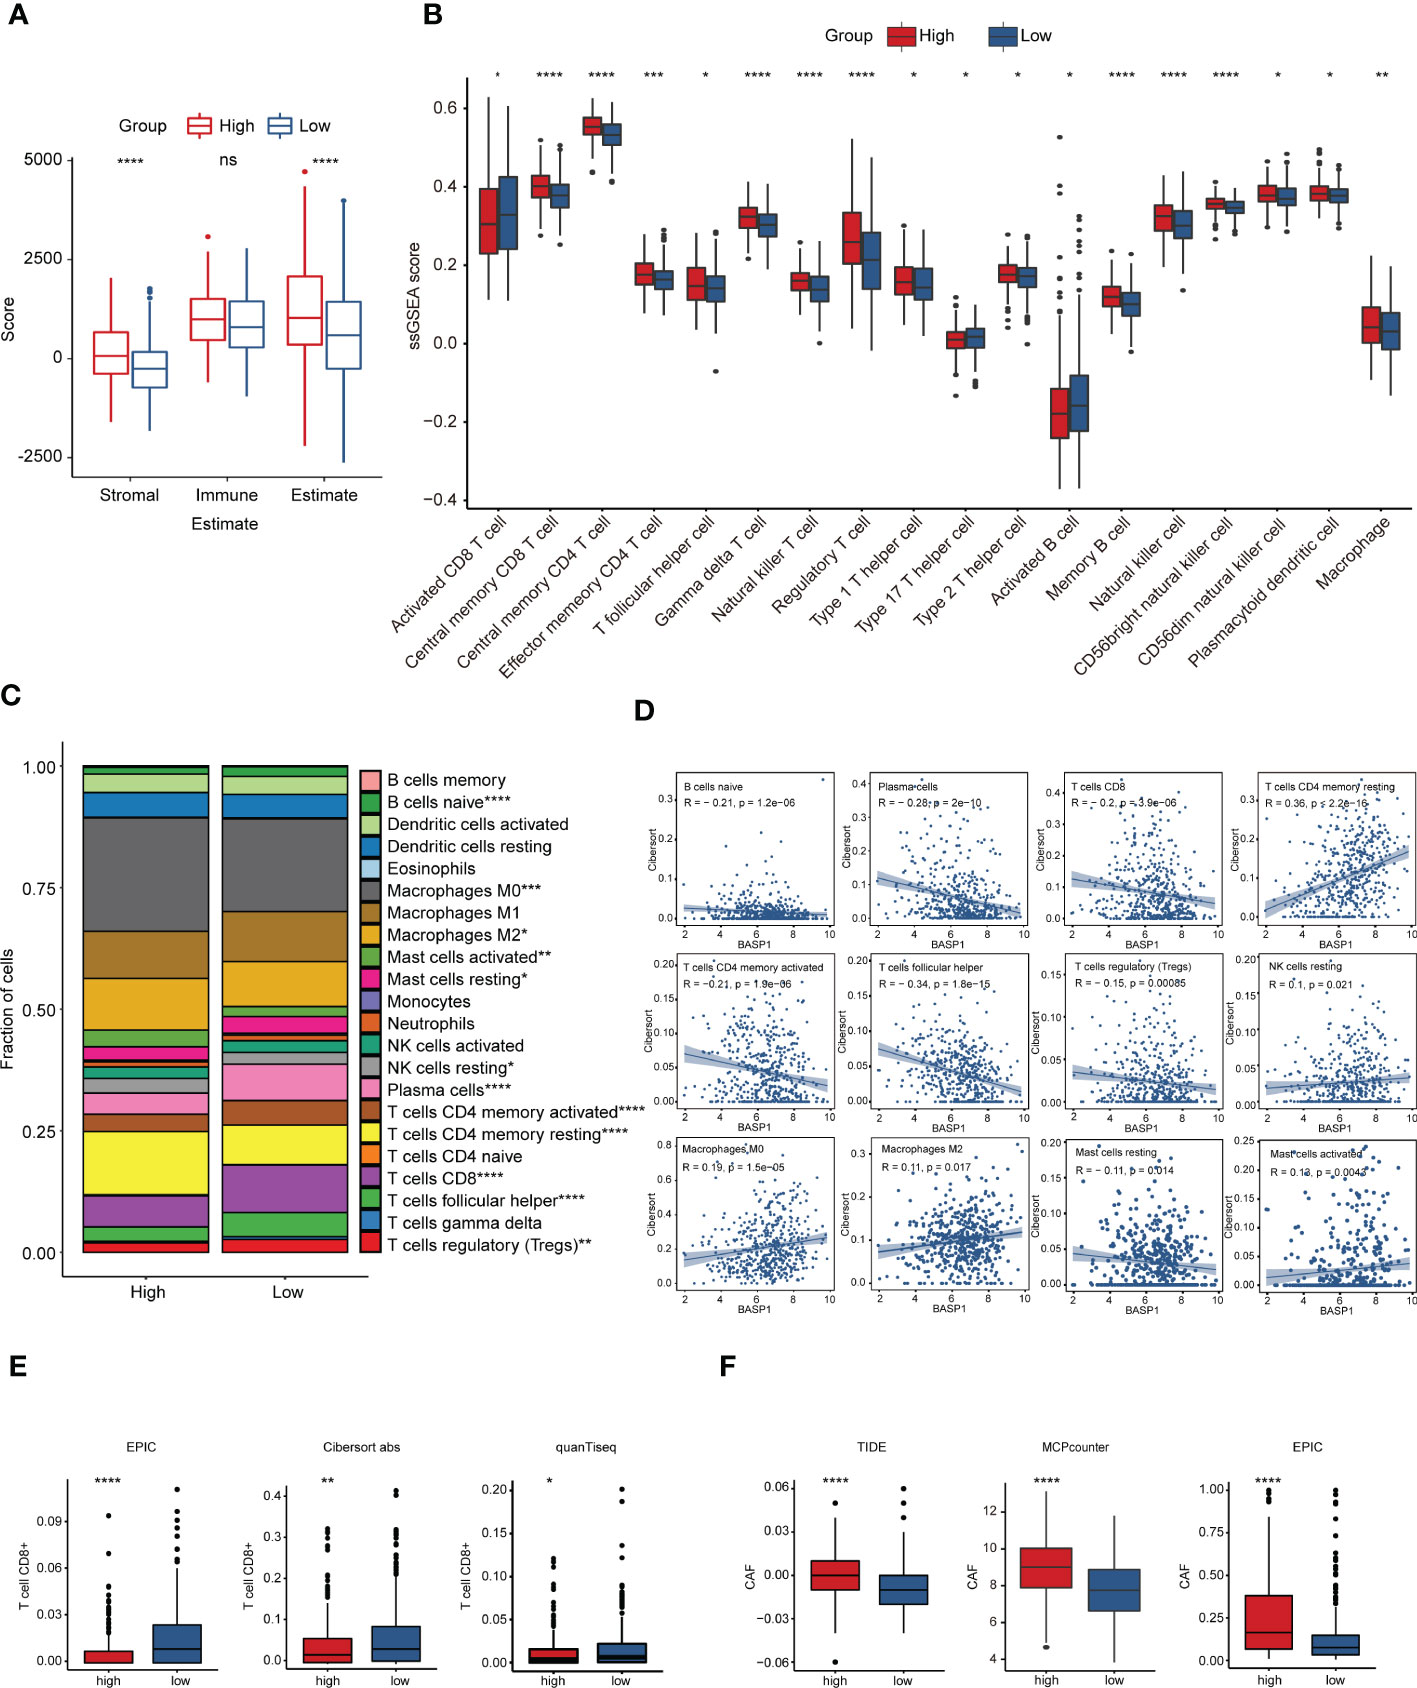
Figure 5 Immune characteristics in different subtypes based on BASP1 expression in HNSCC. (A) The immune score and stromal score in BASP1high group and BASP1low group determined using ESTIMATE. (B) Boxplot of immune cells infiltration with ssGSEA score in BASP1high group and BASP1low group. (C) The fractions of immune cells in BASP1high group and BASP1low group. (D) The correlations between BASP1 expressions and cell proportions. (E) Boxplot of the CD8+ T cells infiltration evaluated by EPIC, CIBERSORT-ABS and quanTiseq. (F) The stromal cell fractions in TME with TIDE, MCPcounter and EPIC. * p < 0.05; ** p < 0.01; *** p < 0.001; **** p < 0.0001.
BASP1 inhibited the priming and activation of CD8+ T cells
Generally speaking, immune cells kill tumor cells in a process with seven steps, including the cancer cell antigens releasement (step 1), cancer antigen presentation (step 2), priming and activation (step 3), trafficking of immune cells to tumors (step 4), infiltration of immune cells into tumors (step 5), recognition of cancer cells by T cells (step 6), and killing of cancer cells (step 7) (31). To explore why activated CD8+ T cells were reduced in the BASP1high group, we investigated which step in the immune cycle was disrupted. The ssGSEA was applied to score each step of the immune circulation. As the results showed, although the release of cancer antigens (step1) and cancer antigen presentation (step2) were enhanced in BASP1high patients, there was no significant difference in the priming and activation (step 3) was identified between these two groups, indicating that the reduced CD8+ T cells infiltration was due to a dysfunction of immune cell priming and activation activity in BASP1high patients (Figure 6A). At the same time, a series of major histocompatibility complex (MHC) molecules and chemokines and their receptors were enhanced in the BASP1high group, which excluded the possible interruption of other steps (Figures 6B–D). Moreover, TIDE analysis of the T cell’s functional changes in TME showed a positive correlation between exclusion score and BASP1 expressions, indicating that the cytotoxic function of T cells was abnormal. The ability of tumor cells evading from immune cells was enhanced in BASP1high patients (Figure 6E). Thus, these outcomes demonstrated that high expression of BASP1 was correlated with T cell dysfunction and immune escape.
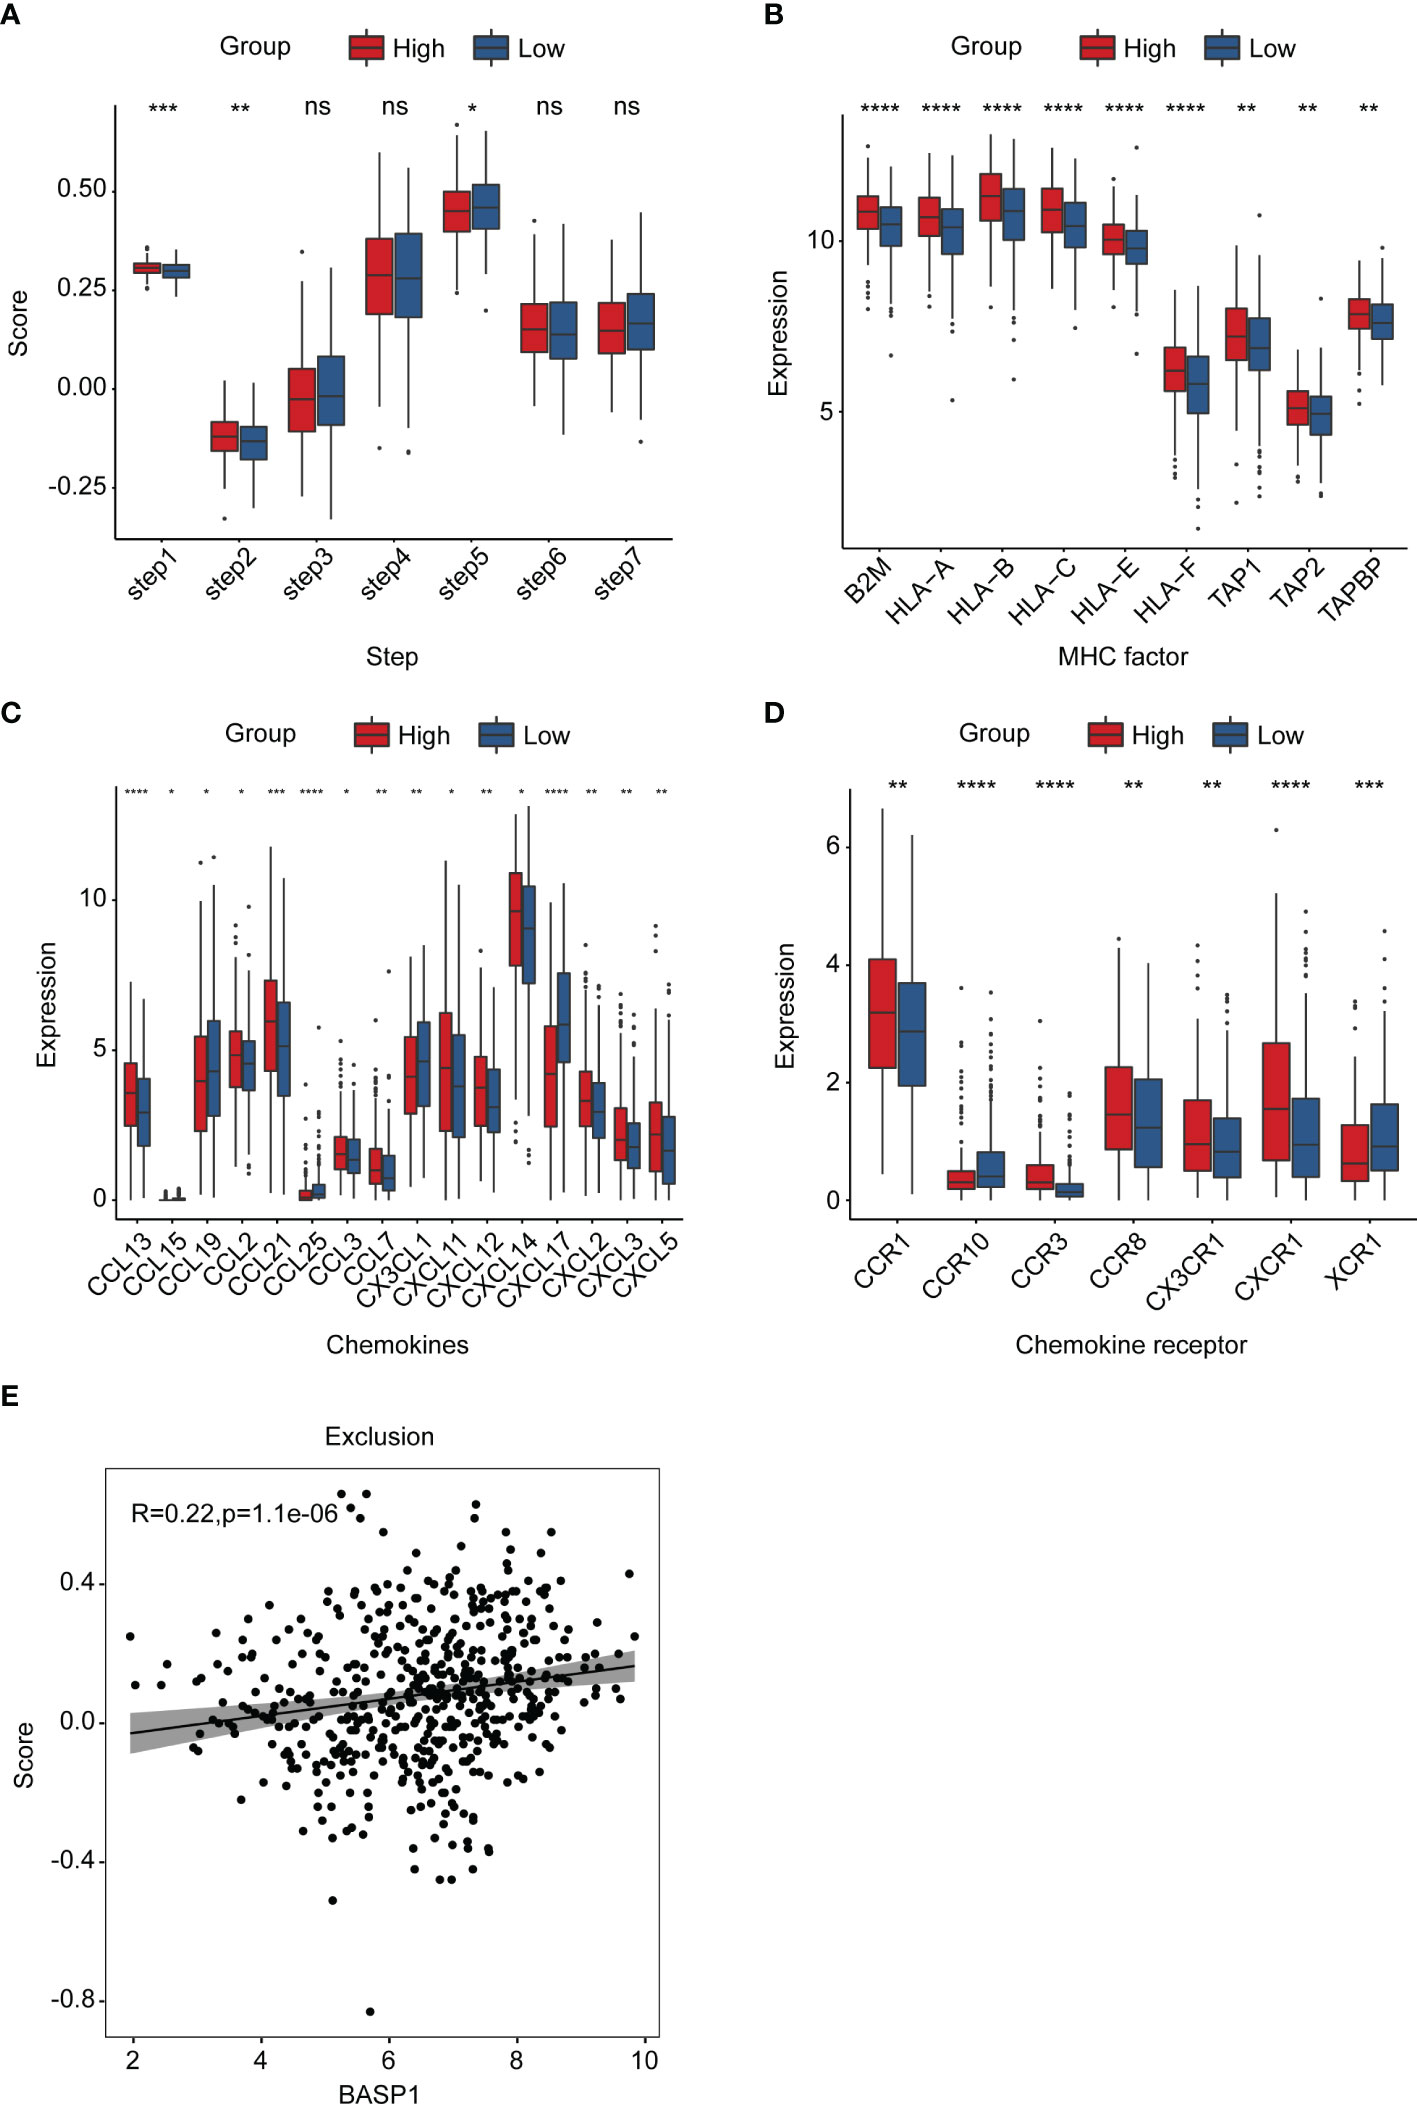
Figure 6 The landscape of BASP1 in the immunity cycle. (A) Characteristics of immune microcirculation in BASP1high group and BASP1low group. (B-D) Boxplot of the antigen-presenting molecule MHC (B), chemokine (C) and chemokine receptor (D). (E) The relationship between BASP1 expression and immune escape. * p < 0.05; ** p < 0.01; *** p < 0.001; **** p < 0.0001. ns, means no significance.
The immunosuppressive effect of BASP1 is associated with its repression effect on ferroptosis in HNSCC
The GO enrichment analysis indicated that the differentially expressed genes between BASP1high and BASP1low tumors were correlated with response to lipid metabolism, hypoxia, metal ion, ROS metabolism and oxidoreductase activity (Figure 2A), which are the features of ferroptosis. Considering the critical role of ferroptosis in immune responses (32–34), we wondered whether BASP1 regulated the TME via ferroptosis in HNSCC. The ferroptosis score showed a negative correlation with BASP1 expression (Figure 7A). HNSCC patients with higher ferroptosis scores had better prognosis (Figure 7B). Then, we examined the effect of BASP1 on ferroptosis in HNSCC cells. We transiently knocked down BASP1 in HSC3 and HSC4 cell lines using siRNAs according to the mRNA expression of BASP1 (Figures 7C, D). LDH assays indicated that silencing BASP1 increased cell death in HNSCC cells (Figure 7E). The ROS contents detected by fluorescent dyes DCFH-DA were obviously elevated in the si-BASP1 groups (Figure 7F). Meanwhile, knocking down BASP1 inhibited GSH synthesis (Figure 7G). Lipid peroxidation detected by C11-BODIPY staining was substantially increased in the si-BASP1 group compared to the control group (Figure 7H). Additionally, we analyzed the relationships between BASP1 and ferroptosis signature genes. We found that BASP1 was positively correlated to ACSF2, ACSL3, FTH1 and CD44, which have been reported to inhibit ferroptosis, and negatively correlated to ALOX12, ALOX15, GLS2, PEBP1 and GOT1, which could enhance ferroptosis (Supplementary Figure S2). Hence, these data illustrated that BASP1 inhibited ferroptosis in HNSCC cells.
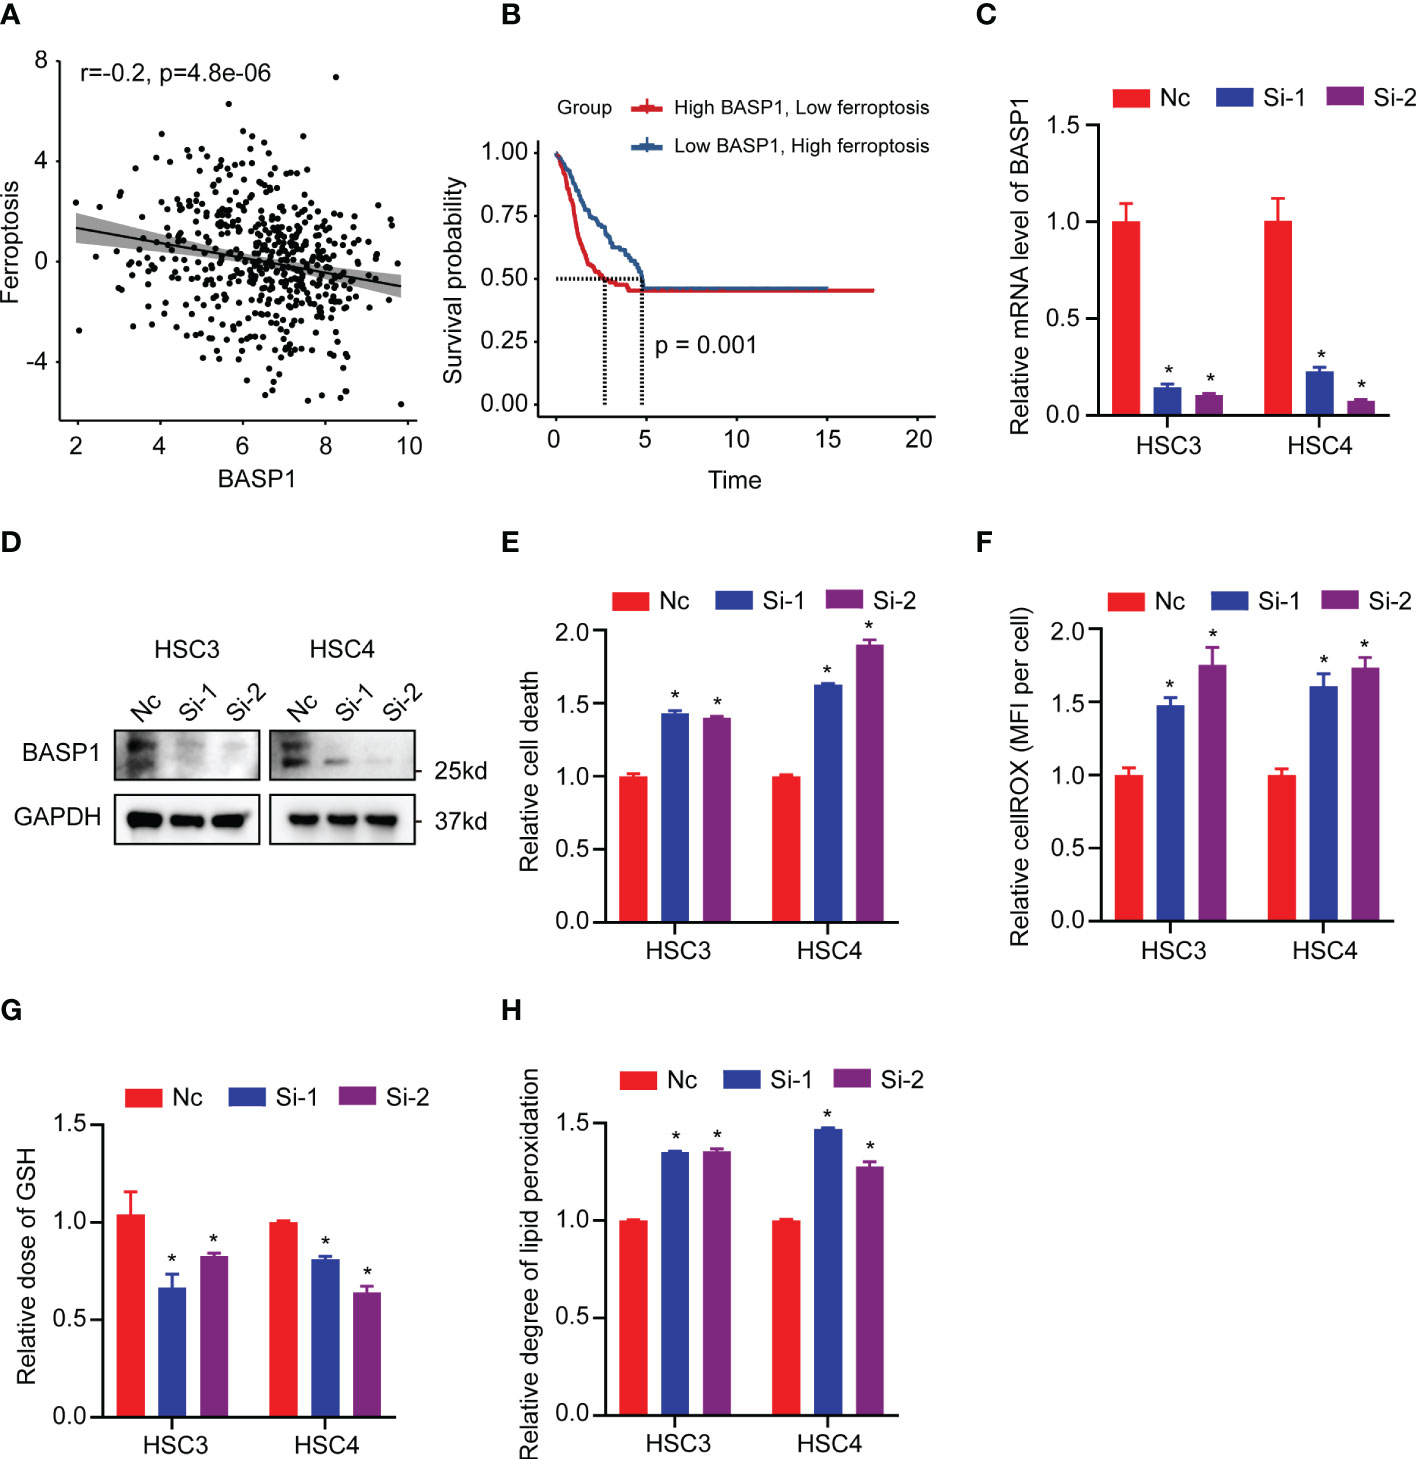
Figure 7 Relationship between BASP1 and ferroptosis. (A) The correlation between ferroptosis score and BASP1 expression. (B) Survival curves of ferroptosis scores in BASP1high group and BASP1low group. (C, D) The mRNA (C) and protein (D) levels of BASP1 in HSC3 and HSC4 cells transfected with BASP1 siRNAs. (E–H) Relative LDH (E), cROS (F), GSH (G) and lipid peroxidation (H) of HSC3 and HSC4 cells transfected with BASP1 siRNAs. * p < 0.05.
Discussion
In the present study, through comprehensively examining the abnormal expressions of TFs and their correlations with HNSCC patients’ clinical outcomes, we identified BASP1 played critical roles in HNSCC. Patients with high BASP1 expression levels were associated with poor prognosis and favorable anti-PD-1 therapy responses. Mechanistically, BASP1high tumors were along with weakened priming and activation of CD8+ T cells in TME and low ferroptosis signature. Together, our results demonstrated that BASP1 could suppress tumor cell ferroptosis and induce an alteration of immune TME, which might be a predictive biomarker for antitumor immunotherapy.
BASP1 was initially identified as a plasma membrane-bound, cytoplasmic and cytoskeleton-associated protein from brain extracts, which is recognized to be essential in axon regeneration and neuronal plasticity (35). It is also widely expressed in other tissues and could translocate into the nucleus to interact with other TFs to drive cell differentiation processes (36). Recently, BASP1 was found to be aberrantly expressed in different cancers and implicated in regulating cell proliferation, metastasis, apoptosis and angiogenesis and acted as either a tumor suppressor or oncogene (37–40). For instance, BASP1 hypermethylation and downregulation in hepatocellular carcinoma were considered as a biomarker for early detection (41). In breast cancer, BASP1 could enhance the anticancer effects of tamoxifen treatment, and patients with high BASP1 were associated with better prognosis (42). Besides, BASP1 upregulation was considered as a high-risk factor in lung adenocarcinoma, cervical cancer, as well as in HNSCC (38, 43). Nevertheless, the biological roles and mechanism of BASP1 in regulating HNSCC progression remain unclear. In this study, we identified that BASP1 was upregulated in HNSCC patients. Higher BASP1 level was correlated with poorer survival and better anti-PD-1 immunotherapy response rate.
TME is a vital factor for clinicians choosing immunotherapy strategies. Most HNSCC tumors exhibit highly immunosuppressive3TME, where immunosuppressive factors promote immunosuppressive cell recruitment and inhibit the antitumor effects of immune-activated cells (8). Increased infiltration of CD8+ T cells and NK cells has been recognized to be associated with improved survival, whereas elevated infiltration of Treg cells, M2 macrophages and neutrophils are related to advanced disease and poor clinical outcomes (44). Upregulation of immune checkpoint inhibitors (e.g., PD-1/PD-L1) attenuates the cytolytic activity of CD8+ T cells in HNSCC (45). Here, we found that, although there was no significant difference in the total immune score between BASP1high and BASP1low tumors, BASP1high ones exhibited reduced and exhausted cytotoxic CD8+ T cells, which have critical influence on immune checkpoint blockade therapy efficacy (46). Furthermore, the increased immune checkpoint inhibitors and reduced immune checkpoint stimulators in the BASP1high group also indicated an exhausted environment (47). Moreover, step3 in the cancer-immunity cycle revealed a blockage of T cell activation in BASP1high tumors. Thus, high BASP1 expression might negatively influence the activity of immune cells.
The immunosuppressive TME of HNSCC is governed by multiple immune regulatory pathways, which provide the rationale for combinatorial strategies in patients with HNSCC (45). Previous studies mentioned that tumor cells could trigger antitumor immunity by inducing immunogenic cell death, including ferroptosis, necroptosis and pyroptosis. ICIs coordinated with immunogenic cell death could achieve better outcomes even in ICI-resistant tumors (48). We clarified that BASP1high tumors exhibited suppressed ferroptosis signature. Silencing BASP1 could substantially induce ferroptotic tumor cells in HNSCC. Ferroptotic cancer cells can release several immune-stimulating signals, allowing immune cells to infiltrate tumors (49). Furthermore, the increased immunogenicity of ferroptotic cancer cells has been reported to induce tumor-specific immune responses, enhancing the efficacy of anti-PD-1/PD-L1 therapy (50). Thus, we proposed that it could be possible to utilize BASP1 as a therapeutic target or biomarker for stratification in HNSCC immunotherapy, which needs further elucidation.
However, there are several limitations existed in this study. For example, the prediction effect of BASP1 on the response rate to immunotherapy was performed in melanoma, which need to be further studied in HNSCC patients in the future. The mechanism of BASP1 suppressing ferroptosis to influence TME in vitro and in vivo need to be further validated.
Conclusion
In conclusion, we identified BASP1 as a poor prognostic biomarker for HNSCC, revealed its potentiality in predicting immunotherapy response, and offered a novel candidate for stratifying patients in immunotherapy of HNSCC. We pointed out that combining BASP1 inhibition induced ferroptosis might be a potential therapeutic method for overcoming immunotherapy resistance.
Data availability statement
The datasets presented in this study can be found in online repositories. The names of the repository/repositories and accession number(s) can be found in the article/Supplementary Material.
Author contributions
XR, JX and BC were responsible for conception and design and supervised the project. XP and XX performed the bioinformatics analysis. XP and LW conducted the experiments. SZ, RY, YC, XC participated in collecting data and helped to draft the manuscript. All authors contributed to the article and approved the submitted version.
Funding
This work was supported by grants from the Natural Science Foundation of Guangdong Province (2019A1515010679); the Guangdong Basic and Applied Basic Research Foundation (2021A1515111020); the Science and Technology Projects in Guangzhou (202206080009); the Guangdong Financial Fund for High-Caliber Hospital Construction (174-2018-XMZC-0001-03-0125/C-08). The funders had no role in the study design, data collection, analysis, decision to publish, or manuscript preparation.
Conflict of interest
The authors declare that the research was conducted in the absence of any commercial or financial relationships that could be construed as a potential conflict of interest.
Publisher’s note
All claims expressed in this article are solely those of the authors and do not necessarily represent those of their affiliated organizations, or those of the publisher, the editors and the reviewers. Any product that may be evaluated in this article, or claim that may be made by its manufacturer, is not guaranteed or endorsed by the publisher.
Supplementary material
The Supplementary Material for this article can be found online at: https://www.frontiersin.org/articles/10.3389/fonc.2023.1021262/full#supplementary-material
References
1. Bray F, Ferlay J, Soerjomataram I, Siegel RL, Torre LA, Jemal A. Global cancer statistics 2018: Globocan estimates of incidence and mortality worldwide for 36 cancers in 185 countries. CA Cancer J Clin (2018) 68(6):394–424. doi: 10.3322/caac.21492
2. Motzer RJ, Escudier B, McDermott DF, George S, Hammers HJ, Srinivas S, et al. Nivolumab versus everolimus in advanced renal-cell carcinoma. N Engl J Med (2015) 373(19):1803–13. doi: 10.1056/NEJMoa1510665
3. Larkin J, Chiarion-Sileni V, Gonzalez R, Grob JJ, Cowey CL, Lao CD, et al. Combined nivolumab and ipilimumab or monotherapy in untreated melanoma. N Engl J Med (2015) 373(1):23–34. doi: 10.1056/NEJMoa1504030
4. Bellmunt J, de Wit R, Vaughn DJ, Fradet Y, Lee JL, Fong L, et al. Pembrolizumab as second-line therapy for advanced urothelial carcinoma. N Engl J Med (2017) 376(11):1015–26. doi: 10.1056/NEJMoa1613683
5. Hanna GJ, Lizotte P, Cavanaugh M, Kuo FC, Shivdasani P, Frieden A, et al. Frameshift events predict anti-Pd-1/L1 response in head and neck cancer. JCI Insight (2018) 3(4):e98811. doi: 10.1172/jci.insight.98811
6. Ferris RL, Blumenschein G Jr., Fayette J, Guigay J, Colevas AD, Licitra L, et al. Nivolumab for recurrent squamous-cell carcinoma of the head and neck. N Engl J Med (2016) 375(19):1856–67. doi: 10.1056/NEJMoa1602252
7. Cohen EEW, Bell RB, Bifulco CB, Burtness B, Gillison ML, Harrington KJ, et al. The society for immunotherapy of cancer consensus statement on immunotherapy for the treatment of squamous cell carcinoma of the head and neck (Hnscc). J Immunother Cancer (2019) 7(1):184. doi: 10.1186/s40425-019-0662-5
8. Bhat AA, Yousuf P, Wani NA, Rizwan A, Chauhan SS, Siddiqi MA, et al. Tumor microenvironment: An evil nexus promoting aggressive head and neck squamous cell carcinoma and avenue for targeted therapy. Signal Transduct Target Ther (2021) 6(1):12. doi: 10.1038/s41392-020-00419-w
9. Zhang SY, Ren XY, Wang CY, Chen XJ, Cao RY, Liu Q, et al. Comprehensive characterization of immune landscape based on epithelial-mesenchymal transition signature in oscc: Implication for prognosis and immunotherapy. Front Oncol (2021) 11:587862. doi: 10.3389/fonc.2021.587862
10. Chen X, Kang R, Kroemer G, Tang D. Broadening horizons: The role of ferroptosis in cancer. Nat Rev Clin Oncol (2021) 18(5):280–96. doi: 10.1038/s41571-020-00462-0
11. Ren X, Yang X, Cheng B, Chen X, Zhang T, He Q, et al. Hopx hypermethylation promotes metastasis Via activating snail transcription in nasopharyngeal carcinoma. Nat Commun (2017) 8:14053. doi: 10.1038/ncomms14053
12. Bushweller JH. Targeting transcription factors in cancer - from undruggable to reality. Nat Rev Cancer (2019) 19(11):611–24. doi: 10.1038/s41568-019-0196-7
13. Wang Y, Ren X, Li W, Cao R, Liu S, Jiang L, et al. Spdef suppresses head and neck squamous cell carcinoma progression by transcriptionally activating Nr4a1. Int J Oral Sci (2021) 13(1):33. doi: 10.1038/s41368-021-00138-0
14. Jiang Z, Lim SO, Yan M, Hsu JL, Yao J, Wei Y, et al. Tyro3 induces anti-Pd-1/Pd-L1 therapy resistance by limiting innate immunity and tumoral ferroptosis. J Clin Invest (2021) 131(8):e139434. doi: 10.1172/jci139434
15. Sade-Feldman M, Yizhak K, Bjorgaard SL, Ray JP, de Boer CG, Jenkins RW, et al. Defining T cell states associated with response to checkpoint immunotherapy in melanoma. Cell (2018) 175(4):998–1013.e20. doi: 10.1016/j.cell.2018.10.038
16. Colaprico A, Silva TC, Olsen C, Garofano L, Cava C, Garolini D, et al. Tcgabiolinks: An R/Bioconductor package for integrative analysis of tcga data. Nucleic Acids Res (2016) 44(8):e71. doi: 10.1093/nar/gkv1507
17. Wagner GP, Kin K, Lynch VJ. Measurement of mrna abundance using rna-seq data: Rpkm measure is inconsistent among samples. Theory Biosci (2012) 131(4):281–5. doi: 10.1007/s12064-012-0162-3
18. Puram SV, Tirosh I, Parikh AS, Patel AP, Yizhak K, Gillespie S, et al. Single-cell transcriptomic analysis of primary and metastatic tumor ecosystems in head and neck cancer. Cell (2017) 171(7):1611–24.e24. doi: 10.1016/j.cell.2017.10.044
19. Wichmann G, Rosolowski M, Krohn K, Kreuz M, Boehm A, Reiche A, et al. The role of hpv rna transcription, immune response-related gene expression and disruptive Tp53 mutations in diagnostic and prognostic profiling of head and neck cancer. Int J Cancer (2015) 137(12):2846–57. doi: 10.1002/ijc.29649
20. Lohavanichbutr P, Méndez E, Holsinger FC, Rue TC, Zhang Y, Houck J, et al. A 13-gene signature prognostic of hpv-negative oscc: Discovery and external validation. Clin Cancer Res (2013) 19(5):1197–203. doi: 10.1158/1078-0432.Ccr-12-2647
21. Chen C, Méndez E, Houck J, Fan W, Lohavanichbutr P, Doody D, et al. Gene expression profiling identifies genes predictive of oral squamous cell carcinoma. Cancer Epidemiol Biomarkers Prev (2008) 17(8):2152–62. doi: 10.1158/1055-9965.Epi-07-2893
22. Davis S, Meltzer PS. Geoquery: A bridge between the gene expression omnibus (Geo) and bioconductor. Bioinformatics (2007) 23(14):1846–7. doi: 10.1093/bioinformatics/btm254
23. Hu H, Miao YR, Jia LH, Yu QY, Zhang Q, Guo AY. Animaltfdb 3.0: A comprehensive resource for annotation and prediction of animal transcription factors. Nucleic Acids Res (2019) 47(D1):D33–d8. doi: 10.1093/nar/gky822
24. Chen L, Niu X, Qiao X, Liu S, Ma H, Shi X, et al. Characterization of interplay between autophagy and ferroptosis and their synergistical roles on manipulating immunological tumor microenvironment in squamous cell carcinomas. Front Immunol (2021) 12:739039. doi: 10.3389/fimmu.2021.739039
25. Wu TZ, Hu EQ, Xu SB, Chen MJ, Guo PF, Dai ZH, et al. Clusterprofiler 4.0: A universal enrichment tool for interpreting omics data. Innovation (2021) 2(3):100141. doi: 10.1016/j.xinn.2021.100141
26. Jiang P, Gu S, Pan D, Fu J, Sahu A, Hu X, et al. Signatures of T cell dysfunction and exclusion predict cancer immunotherapy response. Nat Med (2018) 24(10):1550–8. doi: 10.1038/s41591-018-0136-1
27. Kim JM, Chen DS. Immune escape to pd-L1/Pd-1 blockade: Seven steps to success (or failure). Ann Oncol (2016) 27(8):1492–504. doi: 10.1093/annonc/mdw217
28. Hänzelmann S, Castelo R, Guinney J. Gsva: Gene set variation analysis for microarray and rna-seq data. BMC Bioinf (2013) 14:7. doi: 10.1186/1471-2105-14-7
29. St Paul M, Ohashi PS. The roles of Cd8(+) T cell subsets in antitumor immunity. Trends Cell Biol (2020) 30(9):695–704. doi: 10.1016/j.tcb.2020.06.003
30. Mao X, Xu J, Wang W, Liang C, Hua J, Liu J, et al. Crosstalk between cancer-associated fibroblasts and immune cells in the tumor microenvironment: New findings and future perspectives. Mol Cancer (2021) 20(1):131. doi: 10.1186/s12943-021-01428-1
31. Chen DS, Mellman I. Oncology meets immunology: The cancer-immunity cycle. Immunity (2013) 39(1):1–10. doi: 10.1016/j.immuni.2013.07.012
32. Lang X, Green MD, Wang W, Yu J, Choi JE, Jiang L, et al. Radiotherapy and immunotherapy promote tumoral lipid oxidation and ferroptosis Via synergistic repression of Slc7a11. Cancer Discovery (2019) 9(12):1673–85. doi: 10.1158/2159-8290.Cd-19-0338
33. Wang W, Green M, Choi JE, Gijón M, Kennedy PD, Johnson JK, et al. Cd8(+) T cells regulate tumour ferroptosis during cancer immunotherapy. Nature (2019) 569(7755):270–4. doi: 10.1038/s41586-019-1170-y
34. Park E, Chung SW. Ros-mediated autophagy increases intracellular iron levels and ferroptosis by ferritin and transferrin receptor regulation. Cell Death Dis (2019) 10(11):822. doi: 10.1038/s41419-019-2064-5
35. Chung D, Shum A, Caraveo G. Gap-43 and Basp1 in axon regeneration: Implications for the treatment of neurodegenerative diseases. Front Cell Dev Biol (2020) 8:567537. doi: 10.3389/fcell.2020.567537
36. Hartl M, Puglisi K, Nist A, Raffeiner P, Bister K. The brain acid-soluble protein 1 (Basp1) interferes with the oncogenic capacity of myc and its binding to calmodulin. Mol Oncol (2020) 14(3):625–44. doi: 10.1002/1878-0261.12636
37. Khajavi M, Zhou Y, Schiffer AJ, Bazinet L, Birsner AE, Zon L, et al. Identification of Basp1 as a novel angiogenesis-regulating gene by multi-model system studies. FASEB J (2021) 35(5):e21404. doi: 10.1096/fj.202001936RRR
38. Lin CC, Huang YK, Cho CF, Lin YS, Lo CC, Kuo TT, et al. Targeting positive feedback between Basp1 and egfr as a therapeutic strategy for lung cancer progression. Theranostics (2020) 10(24):10925–39. doi: 10.7150/thno.49425
39. Li Y, Wu T, Jiao Z, Yang A. Basp1 is up-regulated in tongue squamous cell carcinoma and associated with a poor prognosis. Asian J Surg (2022) 45(5):1101–6. doi: 10.1016/j.asjsur.2021.08.015
40. Zhou Q, Andersson R, Hu D, Bauden M, Kristl T, Sasor A, et al. Quantitative proteomics identifies brain acid soluble protein 1 (Basp1) as a prognostic biomarker candidate in pancreatic cancer tissue. EBioMedicine (2019) 43:282–94. doi: 10.1016/j.ebiom.2019.04.008
41. Tsunedomi R, Ogawa Y, Iizuka N, Sakamoto K, Tamesa T, Moribe T, et al. The assessment of methylated Basp1 and Srd5a2 levels in the detection of early hepatocellular carcinoma. Int J Oncol (2010) 36(1):205–12. doi: 10.3892/ijo_00000491
42. Marsh LA, Carrera S, Shandilya J, Heesom KJ, Davidson AD, Medler KF, et al. Basp1 interacts with oestrogen receptor A and modifies the tamoxifen response. Cell Death Dis (2017) 8(5):e2771. doi: 10.1038/cddis.2017.179
43. Liu J, Lu J, Li W. Transcriptome analysis reveals the prognostic and immune infiltration characteristics of glycolysis and hypoxia in head and neck squamous cell carcinoma. BMC Cancer (2022) 22(1):352. doi: 10.1186/s12885-022-09449-9
44. Xie Z, Li X, He Y, Wu S, Wang S, Sun J, et al. Immune cell confrontation in the papillary thyroid carcinoma microenvironment. Front Endocrinol (Lausanne) (2020) 11:570604. doi: 10.3389/fendo.2020.570604
45. Vathiotis IA, Johnson JM, Argiris A. Enhancing programmed cell death protein 1 axis inhibition in head and neck squamous cell carcinoma: Combination immunotherapy. Cancer Treat Rev (2021) 97:102192. doi: 10.1016/j.ctrv.2021.102192
46. Wang D, Fang J, Wen S, Li Q, Wang J, Yang L, et al. A comprehensive profile of Tcf1(+) progenitor and Tcf1(-) terminally exhausted pd-1(+)Cd8(+) T cells in head and neck squamous cell carcinoma: Implications for prognosis and immunotherapy. Int J Oral Sci (2022) 14(1):8. doi: 10.1038/s41368-022-00160-w
47. Blank CU, Haining WN, Held W, Hogan PG, Kallies A, Lugli E, et al. Defining 'T cell exhaustion'. Nat Rev Immunol (2019) 19(11):665–74. doi: 10.1038/s41577-019-0221-9
48. Tang R, Xu J, Zhang B, Liu J, Liang C, Hua J, et al. Ferroptosis, necroptosis, and pyroptosis in anticancer immunity. J Hematol Oncol (2020) 13(1):110. doi: 10.1186/s13045-020-00946-7
49. Friedmann Angeli JP, Krysko DV, Conrad M. Ferroptosis at the crossroads of cancer-acquired drug resistance and immune evasion. Nat Rev Cancer (2019) 19(7):405–14. doi: 10.1038/s41568-019-0149-1
Keywords: HNSCC, BASP1, immunotherapy, CD8+ T cells, ferroptosis
Citation: Pan X, Xu X, Wang L, Zhang S, Chen Y, Yang R, Chen X, Cheng B, Xia J and Ren X (2023) BASP1 is a prognostic biomarker associated with immunotherapeutic response in head and neck squamous cell carcinoma. Front. Oncol. 13:1021262. doi: 10.3389/fonc.2023.1021262
Received: 17 August 2022; Accepted: 16 January 2023;
Published: 27 January 2023.
Edited by:
Panagiota Economopoulou, University General Hospital Attikon, GreeceReviewed by:
Maria Anastasiou, University General Hospital Attikon, GreeceZhong-Yi Dong, Southern Medical University, China
Bohua Kuang, Huazhong University of Science and Technology, China
Copyright © 2023 Pan, Xu, Wang, Zhang, Chen, Yang, Chen, Cheng, Xia and Ren. This is an open-access article distributed under the terms of the Creative Commons Attribution License (CC BY). The use, distribution or reproduction in other forums is permitted, provided the original author(s) and the copyright owner(s) are credited and that the original publication in this journal is cited, in accordance with accepted academic practice. No use, distribution or reproduction is permitted which does not comply with these terms.
*Correspondence: Xianyue Ren, cmVueHk3QG1haWwuc3lzdS5lZHUuY24=; Juan Xia, eGlhanVhbkBtYWlsLnN5c3UuZWR1LmNu; Bin Cheng, Y2hlbmdiaW5AbWFpbC5zeXN1LmVkdS5jbg==
†These authors have contributed equally to this work
 Xue Pan
 Xun Xu
 Lixuan Wang
 Siyuan Zhang1,2,3
 Xijuan Chen
 Bin Cheng
 Juan Xia
 Xianyue Ren