 Qing-Hua Du1
 Jian Li1
 Yi-Xiu Gan1
 Hui-Jun Zhu1Hai-Ying Yue1Xiang-De Li1Xue Ou1Qiu-Lu Zhong1Dan-Jing Luo1Yi-Ting Xie1Qian-Fu Liang1
 Ren-Sheng Wang2*
 Wen-Qi Liu1*
- 1Department of Radiation Oncology, Second Affiliated Hospital of Guangxi Medical University, Nanning, China
- 2Department of Radiation Oncology, First Affiliated Hospital of Guangxi Medical University, Nanning, China
Purpose: To study the impact of dose distribution on volume-effect parameter and predictive ability of equivalent uniform dose (EUD) model, and to explore the improvements.
Methods and Materials: The brains of 103 nasopharyngeal carcinoma patients treated with IMRT were segmented according to dose distribution (brain and left/right half-brain for similar distributions but different sizes; VD with different D for different distributions). Predictive ability of EUDVD (EUD of VD) for radiation-induced brain injury was assessed by receiver operating characteristics curve (ROC) and area under the curve (AUC). The optimal volume-effect parameter a of EUD was selected when AUC was maximal (mAUC). Correlations between mAUC, a and D were analyzed by Pearson correlation analysis. Both mAUC and a in brain and half-brain were compared by using paired samples t-tests. The optimal DV and VD points were selected for a simple comparison.
Results: The mAUC of brain/half-brain EUD was 0.819/0.821 and the optimal a value was 21.5/22. When D increased, mAUC of EUDVD increased, while a decreased. The mAUC reached the maximum value when D was 50–55 Gy, and a was always 1 when D ≥55 Gy. The difference of mAUC/a between brain and half-brain was not significant. If a was in range of 1 to 22, AUC of brain/half-brain EUDV55 Gy (0.857–0.830/0.845–0.830) was always larger than that of brain/half-brain EUD (0.681–0.819/0.691–0.821). The AUCs of optimal dose/volume points were 0.801 (brain D2.5 cc), 0.823 (brain V70 Gy), 0.818 (half-brain D1 cc), and 0.827 (half-brain V69 Gy), respectively. Mean dose (equal to EUDVD with a = 1) of high-dose volume (V50 Gy–V60 Gy) was superior to traditional EUD and dose/volume points.
Conclusion: Volume-effect parameter of EUD is variable and related to dose distribution. EUD with large low-dose volume may not be better than simple dose/volume points. Critical-dose-volume EUD could improve the predictive ability and has an invariant volume-effect parameter. Mean dose may be the case in which critical-dose-volume EUD has the best predictive ability.
Introduction
Dose/volume parameters are widely used to estimate the probability of normal tissue injury (1–4). However, these parameters are only part of the information contained in the dose volume histogram (DVH) curve. For instance, dose delivered to 1 cc (D1 cc) is only a discrete point on DVH. Some normal tissue complication probability (NTCP) models utilize all information of the DVH curve by compressing the entire curve into a single factor (5–7). However, most DVH reduction models are based on estimated complication probability under uniform irradiation (5), which could not be used for non-uniform dose distributions directly. To solve this problem, the equivalent uniform dose (EUD) is often introduced (8–10).
EUD is a simple power-law assumption that may not correspond to the weight changes of all doses. If the doses vary over a wide range, this uncertainty may increase and lead to a decrease in predictive ability—the fitting of power exponent (a or 1/n) should be more accurate in a small dose range than in a large dose range. Since both volume and dose are factors of EUD formula, the proportions of volume bins in different dose ranges should theoretically influence the volume-effect parameter. To increase the weight of critical dose, the power exponent might be larger in the case that the proportion of inessential low-dose volume becomes larger. In order to identify these potential defects and try to improve them, this study explored the impact of dose distribution on the EUD-based prediction model of radiation-induced brain injury (BI) for nasopharyngeal carcinoma (NPC) patients, taking into account the large enough low-dose volume and typical symmetrical objects including structure, field setup and location of injury.
Methods and Materials
Patient Selection and Radiation Therapy
A total of 103 NPC patients treated with intensity-modulated radiotherapy (IMRT) in 31 fractions and concurrent platinum-based chemotherapy were retrospectively reviewed from January 2009 to March 2015 (Table 1). All patients were followed every 3 months in the first 2 years and every 6 months during the next 3 years, and then annually thereafter. The median follow-up time was 69.2 months (range, 61.2–120.8 months). Full-course radiation planning was designed and optimized by inverse treatment planning system, 7 (18/103) or 9 (85/103) isocentric fields being set up. The prescribed dose was 68–72 Gy to the planning target volume (PTV) of gross tumor volume (GTV), 60–64 Gy to the PTV of high-risk clinical target volume (CTV), and 50–54 Gy to the PTV of low-risk CTV.
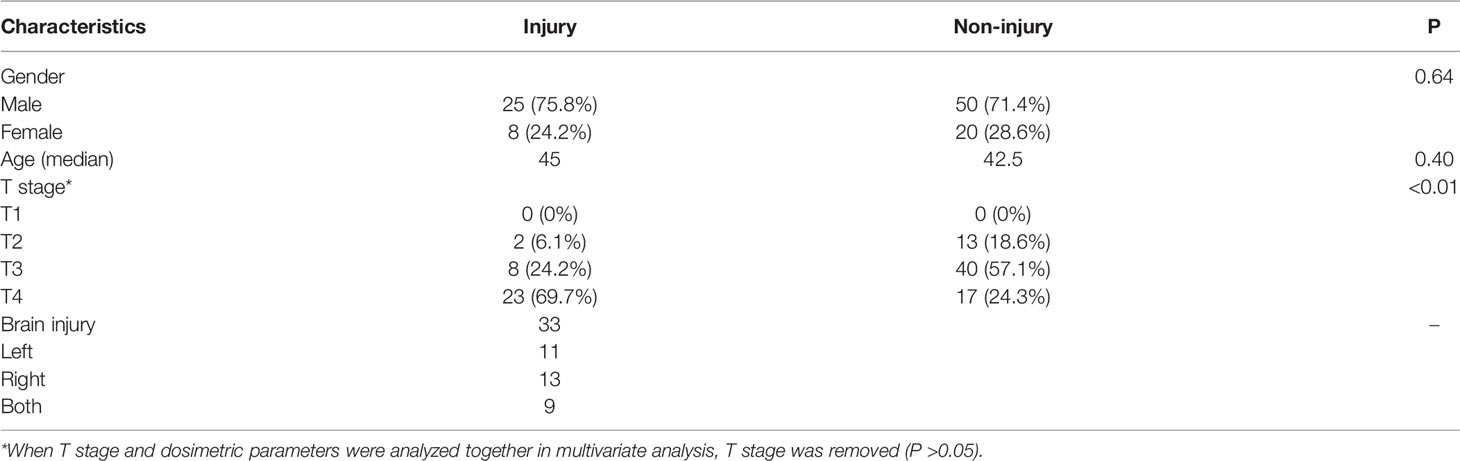
Table 1 Basic characteristics for 103 patients.
Toxicity Endpoints
The MRI images were reviewed by two radiologists and a radiation oncologist. Diagnostic criteria for BI were as follows (4): 1) solid lesions with small nodular enhancements on postcontrast T1-weighted sequence, or ring lesions with “Swiss cheese” or “soap bubble” patterns, featuring marginal enhancements and central necrosis; 2) focalized or extensive edema surrounding necrosis, typically presented on T2-weighted images as finger-like areas with hyperintensity; and 3) no evidence of intracranial NPC invasion. Patients who met all the criteria were diagnosed as BI.
Segmentation for Different Reference Volumes
The brain was contoured in each case as only the pure brain parenchyma was considered, excluding the cavernous sinuses, the brainstem, optic chiasm, optical tract, pituitary gland, mammillary bodies, and Meckel’s caves (11, 12). At the overall level, the dose distribution of left and right half-brain should be similar to that of whole brain (analyzed in results) because the isocentric fields were symmetrical, and the tumors were generally in the middle. In order to obtain reference volumes with similar dose distributions but different sizes, the brain was divided into left half-brain and right half-brain according to brain midline (13). Reference volumes with different dose distributions were obtained directly from DVH (V0 Gy to V70 Gy, per 5 Gy).
Dosimetric Parameters
EUD was calculated with the equation:
where Di is the ith dose bin (1 Gy/bin) of a DVH, vi is the relative volume of that bin and a is the volume-effect parameter (8). For comparison purposes, DV (dose delivered to volume V), VD(volume covered by doses ≥D) and EUDVD (EUD of VD) were calculated.
Statistical Analysis
SPSS 19.0 was used for statistical analysis. The VD proportions (relative volume) of whole-brain and half-brain were compared by using independent sample t-tests. Receiver operating characteristic curve (ROC) was used for screening dosimetric parameters to predict BI. The predictive ability was assessed by the area under the curve (AUC). The a value in EUD model was adjusted from 1 to 30. The optimal volume-effect parameter a of brain/half-brain was selected (or median when there were multiple optimal a values) when AUC of EUD model was maximal (mAUC). The correlations between mAUC, a and D were analyzed by Pearson correlation analysis. The mAUC/a in brain and half-brain were compared by using paired sample t-tests. The optimal simple dose/volume points were selected from DV (V ranged from 0 to 5 cc, per 0.5 cc) and VD (D ranged from 40 to 75 Gy, per 1 Gy) for a simple comparison.
Results
Analysis of Dose Distribution for Symmetrical Segmentation
Average-DVH curves of left half-brains, right half-brains and brains almost exactly overlapped (Figure 1). The VD proportions of reference volume points (V10 Gy, V20 Gy, V30 Gy, V40 Gy, V50 Gy, V60 Gy, and V70 Gy) of half-brain and whole-brain were enrolled for independent sample t-tests. All mean differences of VD proportions between half-brain and whole-brain were less than 0.01% (P >0.5 in each pair).
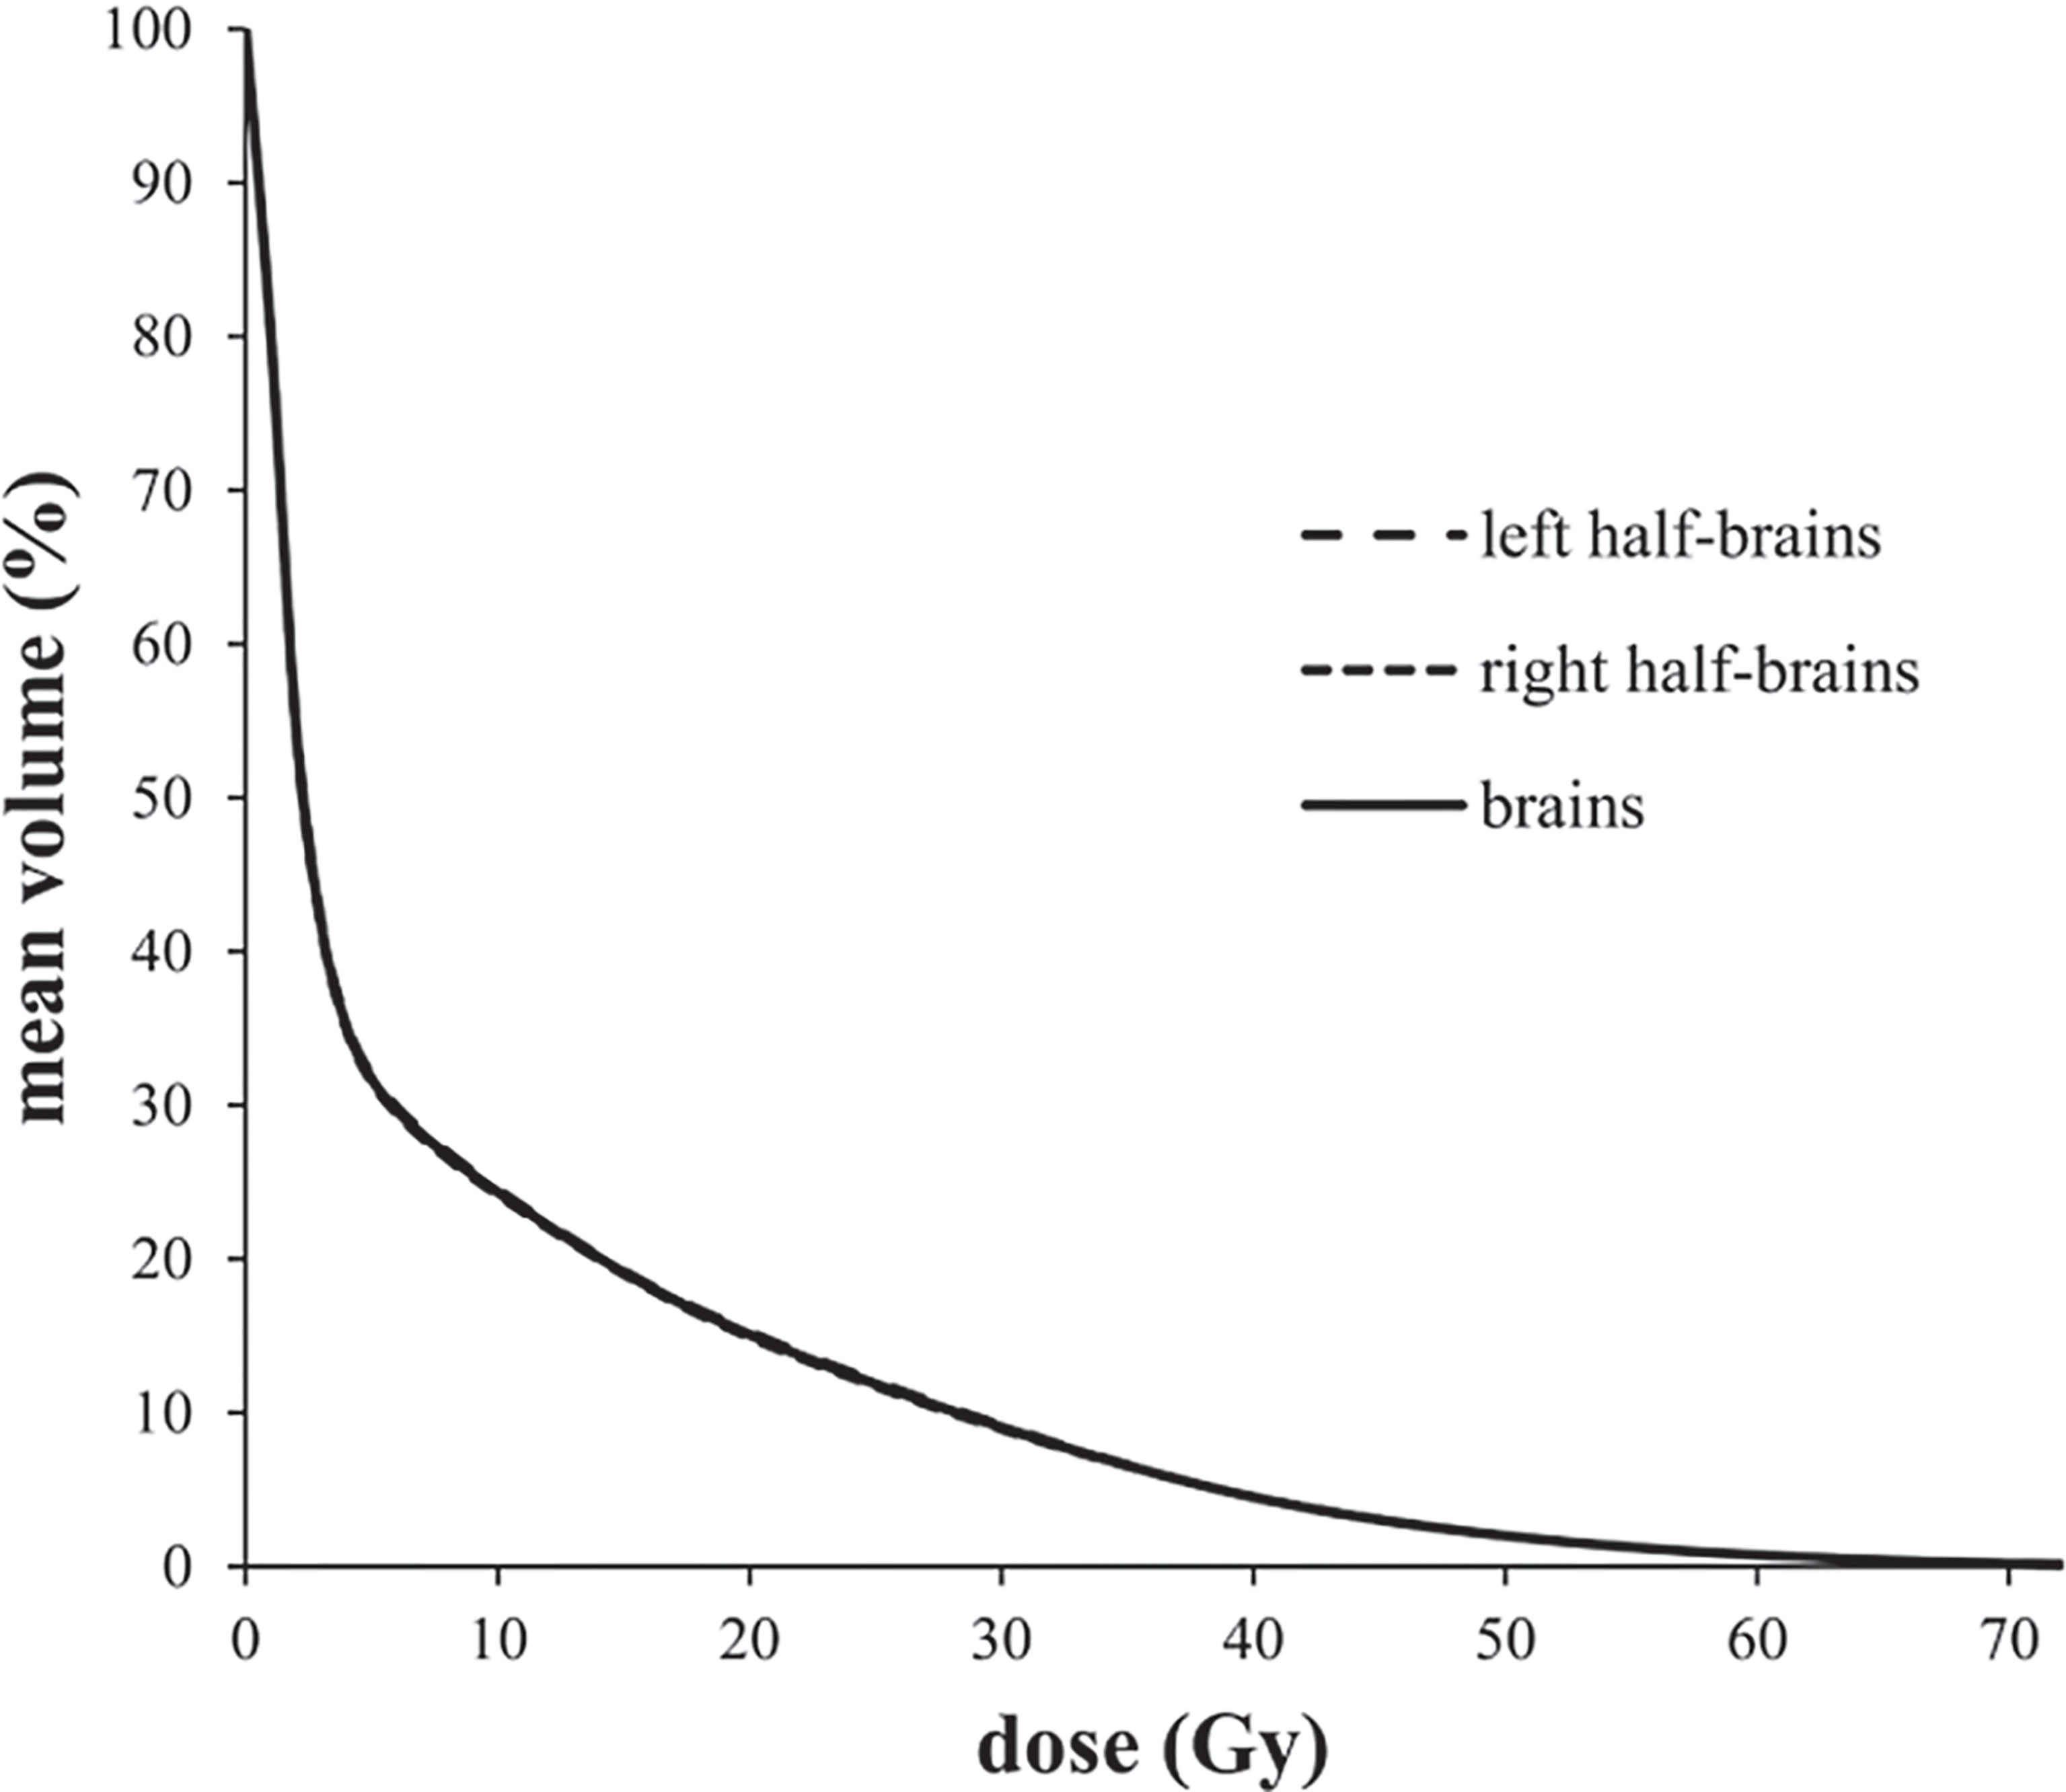
Figure 1 Average-DVH curves of left half-brains, right-half-brains and brains.
Changes of a Value and mAUC in Different Volumes
The mAUC of brain EUD was 0.819 and the optimal a value was 21.5. Similarly, the mAUC of half-brain EUD was 0.821 and the optimal a value was 22. As the specific dose D of VD increased from 0 to 70 Gy (per 5 Gy), the optimal a value of brain/half-brain EUDVD decreased and was always 1 when D ≥55 Gy, and the mAUC increased and reached the maximum value when D was 50–55 Gy (Figure 2). In this study, 55 Gy was selected as a critical dose of EUDVD model for BI.
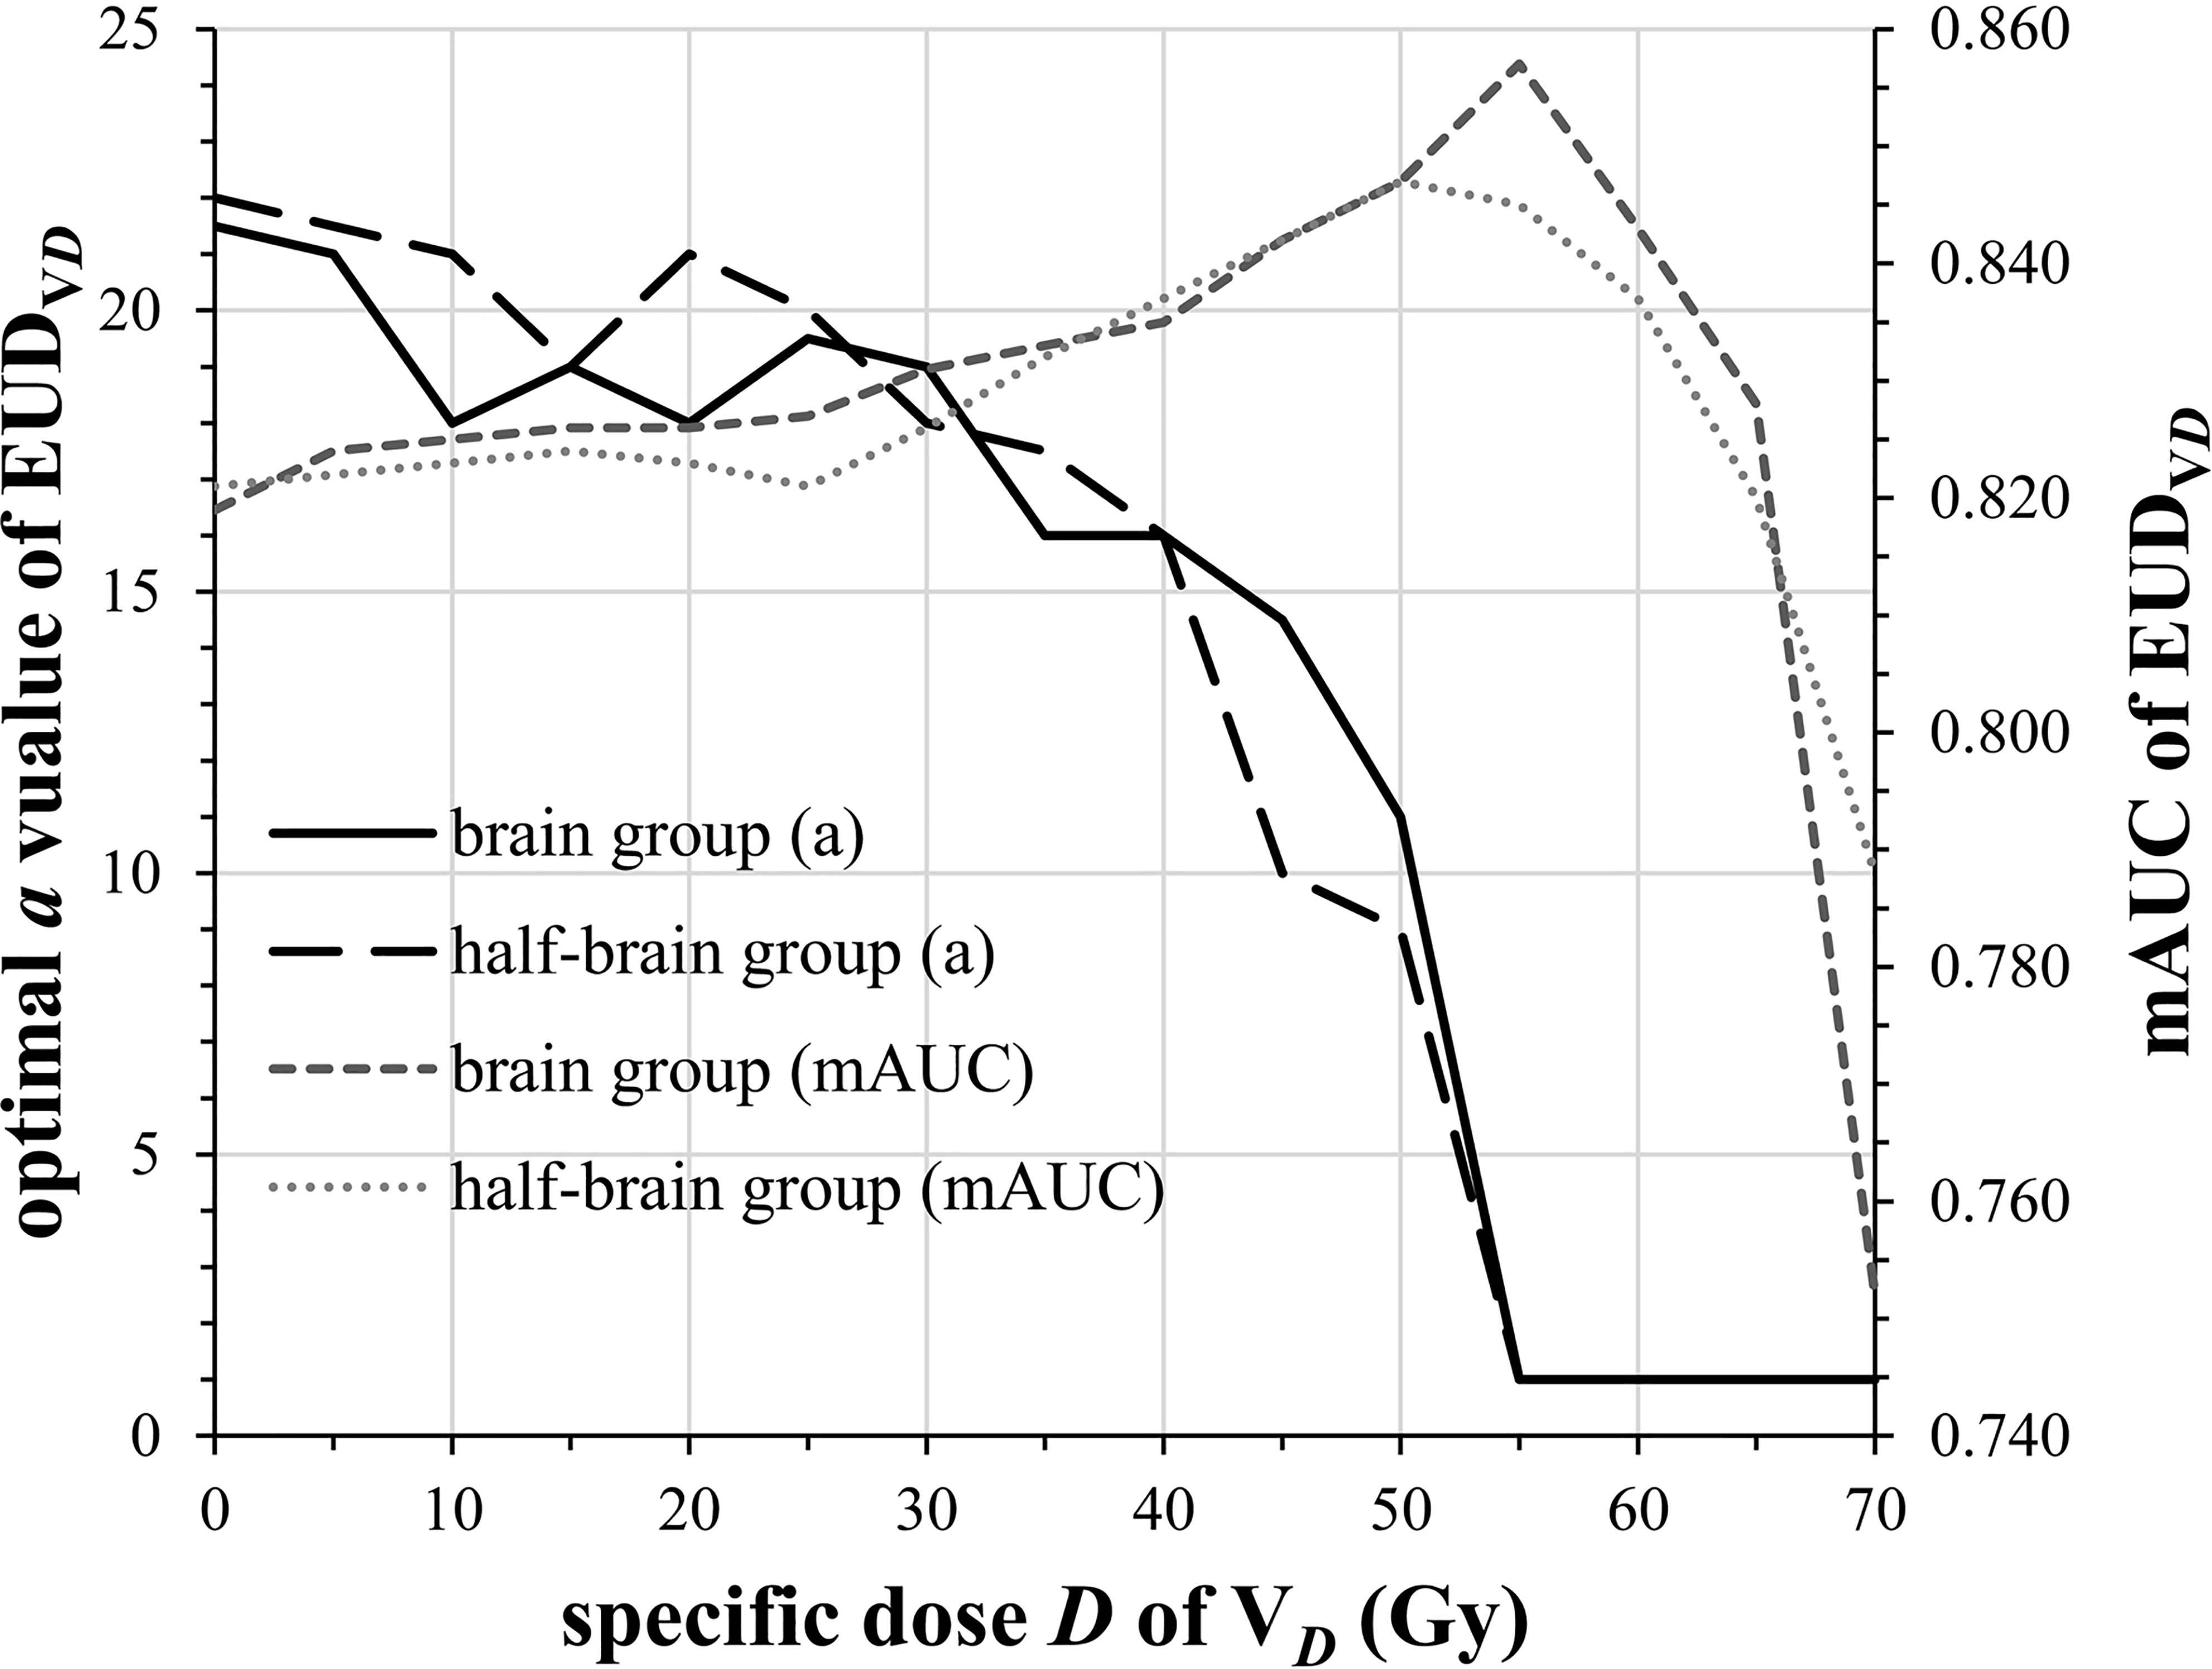
Figure 2 Changes of optimal a value and mAUC of EUDVD as the specific dose D changed.
Impact of Different Reference Volumes on mAUC and a Value
Volumes With Similar Dose Distributions But Different Sizes
The mAUCs of EUDVD(D = 0–70 Gy, per 5 Gy) in brain group and half-brain group were enrolled for paired samples t-tests. Again, the optimal a values of EUDVD in brain group and half-brain group were enrolled for paired sample t-tests. The differences of both AUCs and a values between brain group and half-brain group were not significant (P = 0.869/0.834).
Volume With Different Dose Distribution (D ≤55 Gy)
When D was less than or equal to 55 Gy, mAUC and optimal a value of EUDVD were correlated with D strongly (Table 2). In the range of a value from 1 to 22, AUC of brain EUDV55 Gy(0.830–0.857) was always larger than that of whole brain EUD (0.681–0.819), and similarly, AUC of half-brain EUDV55 Gy (0.830–0.845) was always larger than that of whole half-brain EUD (0.691–0.821) (paired sample t-tests, P <0.001).
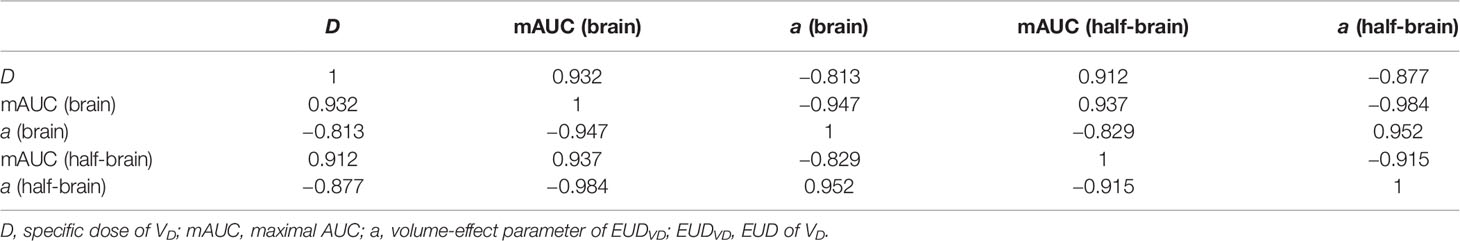
Table 2 Pearson correlation coefficients between D, mAUC, and a in EUDVD (P <0.01, 2-tailed).
Comparison of Dosimetric Parameter
The optimal dose/volume points for predicting BI in brain group were D2.5 cc and V70 Gy, and those in half-brain group were D1 cc and V69 Gy. For a simple comparison, AUCs, cutoffs, and Youden indices of optimal dosimetric parameters were calculated and listed (Table 3).
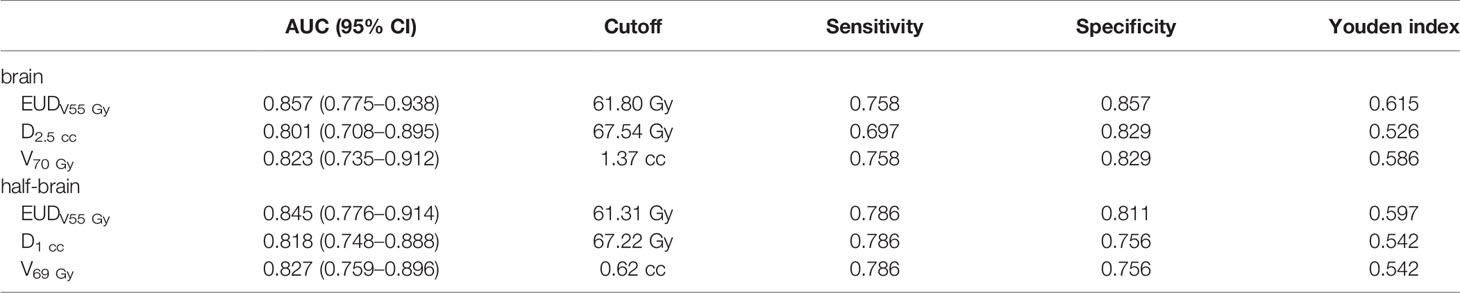
Table 3 Comparison of dosimetric parameters for brain injury prediction.
Feasible Volume of Mean Dose
The best volume-effect parameter might be 1 when reference volume was covered by doses not less than critical dose. When a value is equal to 1, EUD is equal to mean dose. Therefore, the feasible volume of mean dose was analyzed. The AUC of mean dose of VDwas not inferior to that of traditional EUD when D was 45–65 Gy, and it was not inferior to that of dose/volume points when D was 50–60 Gy (Figure 3).
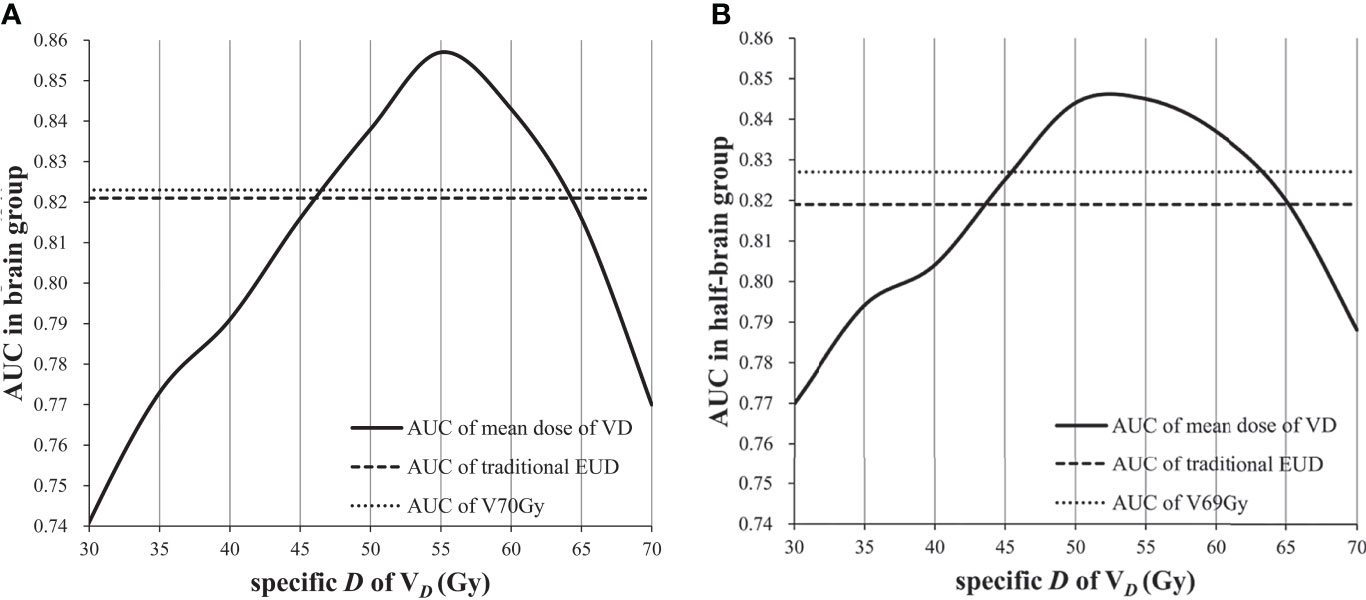
Figure 3 AUC of mean dose of VDas D changed: (A) AUC in brain group; (B) AUC in half-brain group.
Discussion
Modern radiotherapy techniques such as IMRT, volumetric arc radiotherapy (VMAT), and stereotactic body radiotherapy (SBRT) are able to spare normal tissue and reduce side effects (5), resulting in rather non-uniform dose distributions for normal tissue (14). To make sure the traditional NTCP models based on uniform dose still work, effective volume reduction scheme and effective dose reduction scheme have been proposed (15–17). Together, the EUD equation and the Lyman assumptions are often referred to as the Lyman–Kutcher–Burman (LKB) model which has been widely used (5). Other EUD-related models include Logit-EUD model, Schultheiss model (18), Poisson-EUD model, Källman model (19), and Parallel model (20). Regardless of which model is selected to fit clinical data, the intrinsic difference of dichotomous data is the basis of prediction accuracy. In the study Ospina, the six NTCP models above showed almost identical predictive ability for late bladder complications with similar ROC (21). EUD is essentially a redistribution function of dichotomous data. To improve its predictive power, EUD must be able to improve the AUC.
EUD-based optimization of radiation plan has been reported in some studies (22–24). However, there is no guarantee that the parameters are generic and stable in different radiotherapy techniques (such as IMRT and SBRT). As mentioned in the introduction, the volume-effect parameter might be influenced by the dose distribution. In this study, radiation-induced BI model for NPC patients was selected as the object due to its following advantages: 1) fewer setup errors and organ movements; 2) clear boundaries for delineation; 3) clear imaging findings; 4) clear dose–injury relationship with almost no effects of infection or other factors; 5) symmetrical structure and dose distribution for symmetrical segmentation; and 6) relatively concentrated high-dose region and relatively independent injury in temporal pole for asymmetric segmentation. In this study, average-DVH curves of left half-brain, right half-brain and brain overlapped almost exactly, and the differences were negligible, indicating that half-brain could be viewed as an independent structure with a dose distribution similar to that of brain. In addition, VD with different D could be viewed as reference volumes with different dose distributions.
The purpose of half-brain delineation was to study whether the a value and mAUC were influenced by volume size. In this study, both the optimal a values and their changes were similar in brain group and half-brain group, and also mAUC, indicating that volume size may not be a significant factor. Instead, the dose distribution may be an important factor. The results showed that the optimal a value of EUDVD was correlated with D strongly, and it gradually decreased to 1 with the increase of D, indicating that the optimal a value is variable if the dose distribution is uncertain. The variation of volume-effect parameter in different volumes may be due to the variation of dose distribution rather than to the variation of volume size itself.
An important role of EUD is to convert the doses of entire organ to suit the findings of Emami (25). However, modern radiotherapy techniques rarely involve one third, one half or entire organ being irradiated uniformly. The EUD conversion of entire organ doses may reduce the predictive efficacy, especially in a large organ with only a small volume exposed to high dose, since the low-dose volume may affect the role of crucial doses and increase the uncertainty of a value. The study of Heemsbergen showed that the local dose–effects were most pronounced in intermediate-high dose regions for late gastrointestinal toxicity (26). If the EUD was limited to a defined high-dose region, the a value would be more stable and the AUC should be larger. However, if the volume of critical dose was removed excessively, the AUC would decrease. In this study, the mAUC of EUDVD reached the maximum value when D was around 50–55 Gy, indicating that 50–55 Gy might be the critical low dose for BI. On the other hand, regardless of what a value was selected, AUC of EUDV55 Gy was always larger than that of traditional EUD, further supporting the removal of low-dose volume.
It looked like the brain tissue went from being a series organ to being a parallel organ when a value decreased from 21.5/22 to 1, which might not fit the original definition of volume-effect parameter. However, volume-effect parameter of series/parallel organ is essentially an indirect estimation for complication which depends on the location and extent of direct biological damage. In this study, volume-effect parameter of whole volume seemed to only play a role in reducing the interference of low-dose volume. If a novel radiotherapy technique leads to more/less low-dose volume, a larger/smaller a value may be needed. Therefore, a parallel/series organ should not be defined directly by the volume-effect parameter.
In this study, whole-volume EUD was not superior to all simple dose/volume points, while EUDV55 Gy could improve the predictive ability, although the difference may not be significant (with AUCs within the 95% CI of the others). However, an overwhelming predictor is almost impossible considering that the continuous variables are highly correlated (for example, D1 cc is never significantly superior to D1.01 cc), so the significant trend of AUC may also be important. Given a larger AUC and a more stable a value, EUDVDwith an optimal D should be a better choice which is less influenced by dose distribution. From the results, in order to fit the low-dose volume together, the best weight relationship of critical doses lost, which may be the reason why whole-volume EUD did not show an advantage.
Mean dose may be the case in which EUDVD has the best predictive ability, but the critical dose needs to be determined first. In this study, the optimal reference volume of EUD model for BI may be V50 Gy–V55 Gy (V46 Gy–V53 Gy for equivalent dose in 2 Gy per fraction). When the reference volume ranged from V45 Gy to V65 Gy, the AUC of mean dose was not inferior to traditional EUD, and when the reference volume ranged from V50 Gy to V60 Gy, the AUC of mean dose was better than traditional EUD and dose/volume points, indicating that even if there is some error in critical dose, the predictive ability is still advantageous in a certain dose range. In fact, it is easier and more reliable to find an optimal mean dose than to fit an unstable parameter. On the other hand, since the volume covered by 55 Gy is related to BI and contributes to the predictive ability, the sub-high dose volumes of brain should be fully delineated (not just temporal lobe) and enrolled in optimization plan to better protect brain tissue. EUDV55 Gy may be a suitable dose constraint index for brain.
It should be clarified that the fundamental purpose of different reference volumes is not to study a sub-structure EUD against traditional EUD, but to enlarge the potential errors (EUD with a large low-dose volume is not better than simple dose/volume points; volume-effect parameter is variable in different dose distribution) in a typical organ and try to improve them. In addition, the higher incidence of BI may be related to advanced T-stage and follow-up bias (symptomatic patients were more likely to complete follow-up). There are several limitations in this study. Firstly, the optimal a value was selected by simple calculation with limited accuracy, although the optimal EUDVD does not need an “accurate” a value other than 1. Secondly, the optimal a value of 1 is just an assumption that requires more evidence. Thirdly, the conclusions may not be applicable to other organs and more researches are needed. Finally, the division of reference volume is crude, and further studies and more accurate control groups are needed.
Conclusion
Volume-effect parameter of EUD is variable and related to dose distribution. Before referencing a EUD-based model, the similarity of dose distribution should be confirmed. EUD with large low-dose volume may not be better than simple dose/volume points. EUD of critical-dose volume could improve the predictive ability and has an invariant volume-effect parameter. No matter what a value is selected, critical-dose-volume EUD may always be better than whole-volume EUD. Mean dose may be the case in which critical-dose-volume EUD has the best predictive ability.
Data Availability Statement
The raw data supporting the conclusions of this article will be made available by the authors, without undue reservation.
Ethics Statement
The studies involving human participants were reviewed and approved by the Ethics committee of Second Affiliated Hospital of Guangxi Medical University. The patients/participants provided their written informed consent to participate in this study.
Author Contributions
W-QL and R-SW participated in the study concept and design. H-JZ, H-YY, X-DL, XO, Q-LZ, D-JL, Y-TX, and Q-FL participated in the acquisition of data. Q-HD and JL participated in the analysis and interpretation of data. Q-HD participated in the statistical analysis. Q-HD and Y-XG participated in the drafting of the manuscript. All authors contributed to the article and approved the submitted version.
Funding
This work was supported by the Science Foundation of Guangxi Zhuang Autonomous Region Health and Family Planning Commission [award Z20181010] and the Science Foundation of Second Affiliated Hospital of Guangxi Medical University [award EFYKY2020008].
Conflict of Interest
The authors declare that the research was conducted in the absence of any commercial or financial relationships that could be construed as a potential conflict of interest.
Publisher’s Note
All claims expressed in this article are solely those of the authors and do not necessarily represent those of their affiliated organizations, or those of the publisher, the editors and the reviewers. Any product that may be evaluated in this article, or claim that may be made by its manufacturer, is not guaranteed or endorsed by the publisher.
Acknowledgments
We thank all the members of the Department of Radiation Oncology of First/Second Affiliated Hospital of Guangxi Medical University for their support and discussions.
References
1. Lawrence YR, Li XA, el Naqa I, Hahn CA, Marks LB, Merchant TE, et al. Radiation Dose-Volume Effects in the Brain. Int J Radiat Oncol (2010) 76(3 Suppl):S20–7. doi: 10.1016/j.ijrobp.2009.02.091
2. Su SF, Huang Y, Xiao WW, Huang SM, Han F, Xie CM, et al. Clinical and Dosimetric Characteristics of Temporal Lobe Injury Following Intensity Modulated Radiotherapy of Nasopharyngeal Carcinoma. Radiother Oncol (2012) 104(3):312–6. doi: 10.1016/j.radonc.2012.06.012
3. Sun Y, Zhou GQ, Qi ZY, Zhang L, Huang SM, Liu LZ, et al. Radiation-Induced Temporal Lobe Injury After Intensity Modulated Radiotherapy in Nasopharyngeal Carcinoma Patients: A Dose-Volume-Outcome Analysis. BMC Cancer (2013) 13:397. doi: 10.1186/1471-2407-13-397
4. Zhou X, Ou XM, Xu TT, Wang XS, Shen CY, Ding JH, et al. Effect of Dosimetric Factors on Occurrence and Volume of Temporal Lobe Necrosis Following Intensity Modulated Radiation Therapy for Nasopharyngeal Carcinoma: A Case-Control Study. Int J Radiat Oncol (2014) 90(2):261–9. doi: 10.1016/j.ijrobp.2014.05.036
5. Marks LB, Yorke ED, Jackson A, Ten Haken RK, Constine LS, Eisbruch A, et al. Use of Normal Tissue Complication Probability Models in the Clinic. Int J Radiat Oncol (2010) 76(3):S10–S9. doi: 10.1016/j.ijrobp.2009.07.1754
6. Prayongrat A, Kobashi K, Ito YM, Katoh N, Tamura M, Dekura Y, et al. The Normal Tissue Complication Probability Model-Based Approach Considering Uncertainties for the Selective Use of Radiation Modality in Primary Liver Cancer Patients. Radiother Oncol (2019) 135:100–6. doi: 10.1016/j.radonc.2019.03.003
7. El Naqa I, Johansson A, Owen D, Cuneo K, Cao Y, Matuszak M, et al. Modeling of Normal Tissue Complications Using Imaging and Biomarkers After Radiation Therapy for Hepatocellular Carcinoma. Int J Radiat Oncol (2018) 100(2):335–43. doi: 10.1016/j.ijrobp.2017.10.005
8. Niemierko A. Reporting and Analyzing Dose Distributions: A Concept of Equivalent Uniform Dose. Med Phys (1997) 24(1):103–10. doi: 10.1118/1.598063
9. Pang HW, Sun XY, Yang B, Wu JB. A Quality Control Method for Intensity-Modulated Radiation Therapy Planning Based on Generalized Equivalent Uniform Dose. J Appl Clin Med Phys (2018) 19(3):276–82. doi: 10.1002/acm2.12331
10. Niyazi M, Karin I, Sohn M, Nachbichler SB, Lang P, Belka C, et al. Analysis of Equivalent Uniform Dose (EUD) and Conventional Radiation Treatment Parameters After Primary and Re-Irradiation of Malignant Glioma. Radiat Oncol (2013) 8:287. doi: 10.1186/1748-717x-8-287
11. Brouwer CL, Steenbakkers RJ, Bourhis J, Budach W, Grau C, Gregoire V, et al. CT-Based Delineation of Organs at Risk in the Head and Neck Region: DAHANCA, EORTC, GORTEC, HKNPCSG, NCIC CTG, NCRI, NRG Oncology and TROG Consensus Guidelines. Radiother Oncol (2015) 117(1):83–90. doi: 10.1016/j.radonc.2015.07.041
12. Niyazi M, Niemierko A, Paganetti H, Sohn M, Schapira E, Goldberg S, et al. Volumetric and Actuarial Analysis of Brain Necrosis in Proton Therapy Using a Novel Mixture Cure Model. Radiother Oncol (2020) 142:154–61. doi: 10.1016/j.radonc.2019.09.008
13. Du QH, Gan YX, Wang RS, Liu WQ, Li J, Liang FF, et al. Half-Brain Delineation for Prediction of Radiation-Induced Temporal Lobe Injury in Nasopharyngeal Carcinoma Receiving Intensity-Modulated Radiotherapy. Front Oncol (2021) 11:599942. doi: 10.3389/fonc.2021.599942
14. Eckert F, Clasen K, Kelbsch C, Tonagel F, Bender B, Tabatabai G, et al. Retrospective Analysis of Fractionated Intensity-Modulated Radiotherapy (IMRT) in the Interdisciplinary Management of Primary Optic Nerve Sheath Meningiomas. Radiat Oncol (2019) 14(1):240. doi: 10.1186/s13014-019-1438-2
15. Kutcher GJ, Burman C, Brewster L, Goitein M, Mohan R. Histogram Reduction Method for Calculating Complication Probabilities for Three-Dimensional Treatment Planning Evaluations. Int J Radiat Oncol (1991) 21(1):137–46. doi: 10.1016/0360-3016(91)90173-2
16. Kutcher GJ, Burman C. Calculation of Complication Probability Factors for Non-Uniform Normal Tissue Irradiation: The Effective Volume Method. Int J Radiat Oncol (1989) 16(6):1623–30. doi: 10.1016/0360-3016(89)90972-3
17. Lyman JT, Wolbarst AB. Optimization of Radiation Therapy, IV: A Dose-Volume Histogram Reduction Algorithm. Int J Radiat Oncol (1989) 17(2):433–6. doi: 10.1016/0360-3016(89)90462-8
18. Schultheiss TE, Orton CG, Peck RA. Models in Radiotherapy: Volume Effects. Med Phys (1983) 10(4):410–5. doi: 10.1118/1.595312
19. Källman P, Agren A, Brahme A. Tumour and Normal Tissue Responses to Fractionated Non-Uniform Dose Delivery. Int J Radiat Biol (1992) 62(2):249–62. doi: 10.1080/09553009214552071
20. Jackson A, Ten Haken RK, Robertson JM, Kessler ML, Kutcher GJ, Lawrence TS. Analysis of Clinical Complication Data for Radiation Hepatitis Using a Parallel Architecture Model. Int J Radiat Oncol (1995) 31(4):883–91. doi: 10.1016/0360-3016(94)00471-4
21. Ospina J, Zhu J, Prisé EL, Bossi A, Haigron P, Gnep K, et al. Random Forest are Strong Competitors of Published NTCP Models for Rectal and Bladder Toxicity Prediction. Int J Radiat Oncol (2012) 84(3):S387. doi: 10.1016/j.ijrobp.2012.07.1020
22. Senthilkumar K, Maria Das KJ, Balasubramanian K, Deka AC, Patil BR. Estimation of the Effects of Normal Tissue Sparing Using Equivalent Uniform Dose-Based Optimization. J Med Phys (2016) 41(2):123–8. doi: 10.4103/0971-6203.181631
23. Thomas E, Chapet O, Kessler ML, Lawrence TS, Ten Haken RK. Benefit of Using Biologic Parameters (EUD and NTCP) in IMRT Optimization for Treatment of Intrahepatic Tumors. Int J Radiat Oncol (2005) 62(2):571–8. doi: 10.1016/j.ijrobp.2005.02.033
24. Brüningk SC, Kamp F, Wilkens JJ. EUD-Based Biological Optimization for Carbon Ion Therapy. Med Phys (2015) 42(11):6248–57. doi: 10.1118/1.4932219
25. Emami B, Lyman J, Brown A, Coia L, Goitein M, Munzenrider JE, et al. Tolerance of Normal Tissue to Therapeutic Irradiation. Int J Radiat Oncol (1991) 21(1):109–22. doi: 10.1016/0360-3016(91)90171-y
Keywords: equivalent uniform dose, brain injury, predictive ability, volume-effect parameter, nasopharyngeal carcinoma
Citation: Du Q-H, Li J, Gan Y-X, Zhu H-J, Yue H-Y, Li X-D, Ou X, Zhong Q-L, Luo D-J, Xie Y-T, Liang Q-F, Wang R-S and Liu W-Q (2022) Potential Defects and Improvements of Equivalent Uniform Dose Prediction Model Based on the Analysis of Radiation-Induced Brain Injury. Front. Oncol. 11:743941. doi: 10.3389/fonc.2021.743941
Received: 20 July 2021; Accepted: 13 December 2021;
Published: 11 January 2022.
Edited by:
James Chow, University of Toronto, CanadaReviewed by:
Xiaowu Deng, Sun Yat-sen University Cancer Center (SYSUCC), ChinaWeihong Jiang, Central South University, China
Gang Wu, Huazhong University of Science and Technology, China
Copyright © 2022 Du, Li, Gan, Zhu, Yue, Li, Ou, Zhong, Luo, Xie, Liang, Wang and Liu. This is an open-access article distributed under the terms of the Creative Commons Attribution License (CC BY). The use, distribution or reproduction in other forums is permitted, provided the original author(s) and the copyright owner(s) are credited and that the original publication in this journal is cited, in accordance with accepted academic practice. No use, distribution or reproduction is permitted which does not comply with these terms.
*Correspondence: Wen-Qi Liu, bGl1d2VucWlneEAxNjMuY29t; Ren-Sheng Wang, MTM4MDc4MDYwMDhAMTYzLmNvbQ==