
95% of researchers rate our articles as excellent or good
Learn more about the work of our research integrity team to safeguard the quality of each article we publish.
Find out more
CLINICAL TRIAL article
Front. Oncol. , 30 August 2021
Sec. Neuro-Oncology and Neurosurgical Oncology
Volume 11 - 2021 | https://doi.org/10.3389/fonc.2021.732704
This article is part of the Research Topic Structural, Metabolic and Physiologic MR Imaging to Study Glioblastomas View all 13 articles
 Liqiang Zhang1†Rui Yao2†Jueni Gao1†Duo Tan2Xinyi Yang1Ming Wen1Jie Wang3Xiangxian Xie4Ruikun Liao5Yao Tang6*Shanxiong Chen2*Yongmei Li1*
Background: The effectiveness of conventional MRI (cMRI)-based radiomics in differentiating glioblastoma (GBM) from solitary brain metastases (SBM) is not satisfactory enough. Therefore, we aimed to develop an integrated radiomics model to improve the performance of differentiating GBM from SBM.
Methods: One hundred patients with solitary brain tumors (50 with GBM, 50 with SBM) were retrospectively enrolled and randomly assigned to the training set (n = 80) or validation set (n = 20). A total of 4,424 radiomic features were obtained from contrast-enhanced T1-weighted imaging (CE-T1WI) with the contrast-enhancing and peri-enhancing edema region, T2-weighted imaging (T2WI), diffusion-weighted imaging (DWI)-derived apparent diffusion coefficient (ADC), and 18F-fluorodeoxyglucose positron emission tomography (18F-FDG PET) images. The partial least squares (PLS) regression with fivefold cross-validation is used to analyze the correlation between different radiomic features and different modalities. The cross-validity analysis was performed to judge whether a new principal component or a new feature dimension can significantly improve the final prediction effect. The principal components with effective interpretation in all radiomic features were projected to a low-dimensional space (2D in this study). The effective features of the new projection mapping were then sent to the random forest classifier to predict the results. The performance of differentiating GBM from SBM was compared between the integrated radiomics model and other radiomics models or nonradiomics methods using the area under the receiver operating characteristics curve (AUC).
Results: Through the cross-validity analysis of partial least squares, hundreds of radiomic features were projected into a new two-dimensional space to complete the construction of radiomics model. Compared with the combined radiomics model using DWI + 18F-FDG PET (AUC = 0.93, p = 0.014), cMRI + DWI (AUC = 0.89, p = 0.011), cMRI + 8F-FDG PET (AUC = 0.91, p = 0.015), and single radiomics model using cMRI (AUC = 0.85, p = 0.018), DWI (AUC = 0.84, p = 0.017), and 18F-FDG PET (AUC = 0.85, p = 0.421), the integrated radiomics model (AUC = 0.98) showed more efficient diagnostic performance. The integrated radiomics model (AUC = 0.98) also showed significantly better performance than any single ADC, SUV, or TBR parameter (AUC = 0.57–0.71, p < 0.05). The integrated radiomics model showed better performance in the training (AUC = 0.98) and validation (AUC = 0.93) sets than any other models and methods, demonstrating robustness.
Conclusions: We developed an integrated radiomics model incorporating DWI and 18F-FDG PET, which improved the performance of differentiating GBM from SBM greatly.
As the most common malignant brain tumor in adults, metastasis is estimated to be at least 10 times more common than primary malignant central nervous system tumors (1). Glioblastoma (GBM) accounts for more than half of all primary brain malignancies (2). Differentiating GBM from solitary brain metastases (SBM) preoperatively is significantly critical for optimizing individualized therapeutic decision-making, as the medical staging, therapeutic strategies, and prognosis are different (3–5). En bloc resection is preferred for metastases, and stereotactic radiosurgery is also considered an effective strategy for metastases of less than 3–4 cm (6), and maximal resection of the tumor followed by radiotherapy and temozolomide chemotherapy should be considered for GBM (7). Generally speaking, metastasis usually presents as multiple nodular enhancing lesions with surrounding edema in the cortical gray-white matter junction, whereas GBM mostly has general characteristic image features, such as the invasion of the deep white matter and the presence of solitary ring-enhancing lesion (3, 8). In patients with multiple lesions and systemic cancer, brain metastasis identification may be easily performed using conventional MRI (cMRI). However, when metastasis presents with a solitary ring-enhancing lesion or an unknown clinical history, it is challenging to differentiate the two tumors due to their similar imaging features. Both GBM and SBM can present with irregular ring enhancement and intratumoral necrosis on contrast-enhanced T1-weighted imaging (CE-T1WI), surrounding edema on T2-WI and ring-hypermetabolic on 18F-fluorodeoxyglucose positron emission tomography (18F-FDG PET) images. Histopathology is the gold standard for the diagnosis of GBM or metastasis. Unfortunately, the present way for identifying GBM from SBM is to undertake a biopsy or open surgical resection invasively. However, when the tumors are located near eloquent areas or the patient is weak, biopsy or open surgical resection may risk morbidity and mortality. Therefore, an accurate noninvasive preoperative method would be preferable and sometimes necessary (9, 10).
It has been shown that infiltrating neoplastic cells have been found in surrounding edema of GBM, while peritumoral edema of metastasis consists essentially of vasogenic edema, indicating that there are some differences in cells, edema type, angiogenesis, etc. between the peri-enhancing edema regions of the two tumors. However, the surrounding edema of the two tumors showed no enhancement, hypometabolic, or no obvious diffusion limitation. Therefore, it is reasonable to assume that there are pathophysiological abnormalities in the peritumoral edema area that cannot be visually recognized besides the tumor enhancement area. We hope to find a new and more effective method to distinguish two tumors based on the difference between the metastatic vasogenic edema and GBM infiltrative edema containing tumor cells infiltrating the white matter.
With the rapid development of medical image analysis, radiomics has become a hot research topic. Radiomics can noninvasively extract quantitative features of lesions from magnetic resonance images, providing important reference information for tumor characterizations, treatment monitoring, and outcome prediction (11). Previous studies have established radiomics models based on cMRI sequences to differentiate GBM from SBM and achieved good results. Qian et al. (12) developed a CE-T1WI-based radiomics model to differentiate GBM from SBM, with a test AUC value of 0.90. A radiomics model based on T1WI, T2WI, and CE-T1WI trained by Dong et al. (13) has a test AUC value of 0.76. Artzi et al. (14) established a radiomics model based on postcontrast 3D-T1W gradient echo images, and the test mean accuracy was 0.85. The radiomics classifier based on CE-T1WI established by Su et al. (15) yielded good performance with AUC values of 0.82 and 0.81 in the training and validation cohorts to distinguish GBM from SBM. These results are barely satisfactory for having limited value in demonstrating heterogeneity, function, and tumor metabolism and still have room for improvement. Some studies have reported that the mean diffusivity and minimum apparent diffusion coefficient (ADC) values of peritumoral edema seem lower in GBM than in SBM (16–18). Even though some other studies denied this result (19–21), diffusion-weighted imaging (DWI) seems to have the potential to distinguish GBM from SBM. Compared with cMRI, DWI can evaluate brain tumor diffusion and hypercellularity. 18F-FDG PET imaging has been shown to be helpful for assessing surgery and radiotherapy as well as providing important imaging biomarkers for tumor metabolism evaluation (22–26). Therefore, DWI and 18F-FDG PET imaging may show great potential for differentiating GBM from SBM. However, no studies have been reported to build a radiomics model incorporating DWI and 18F-FDG PET imaging in differentiating GBM from SBM.
We hypothesized that a multivariate radiomics model incorporating DWI and 18F-FDG PET could differentiate GBM from SBM more precisely than any other radiomics models or nonradiomics approaches, which will be more useful for clinicians to optimize clinical management decision-making. Thus, the study aimed to develop and validate a radiomics model using DWI and 18F-FDG PET to improve the performance of differentiating GBM from SBM.
This retrospective study was approved by the local institutional review board, and the informed consent was obtained. The data and pathological information were obtained from The First Affiliated Hospital of Chongqing Medical University and the United Medical Imaging Center. We identified 128 consecutive patients who were pathologically confirmed with GBM or SBM on surgical resection or biopsy performed at the Department of Neurosurgery of our hospital. The inclusion criteria were as follows: (1) pathologically confirmed GBM or SBM; (2) all the lesions are solitary and limited to a single lobe, not across the lobes; (3) performed CE-T1WI, T2WI, DWI, and 18F-FDG PET/CT examinations; (4) the interval between MRI and 18F-FDG PET/CT examinations was less than 2 weeks; and (5) no history of preoperative radiotherapy or other medical treatments before surgery. A total of 28 patients were excluded according to the exclusion criteria (Figure 1). Finally, a total of 100 consecutive patients were included in the study. The patient selection process is presented in a flowchart in Figure 1 in detail.
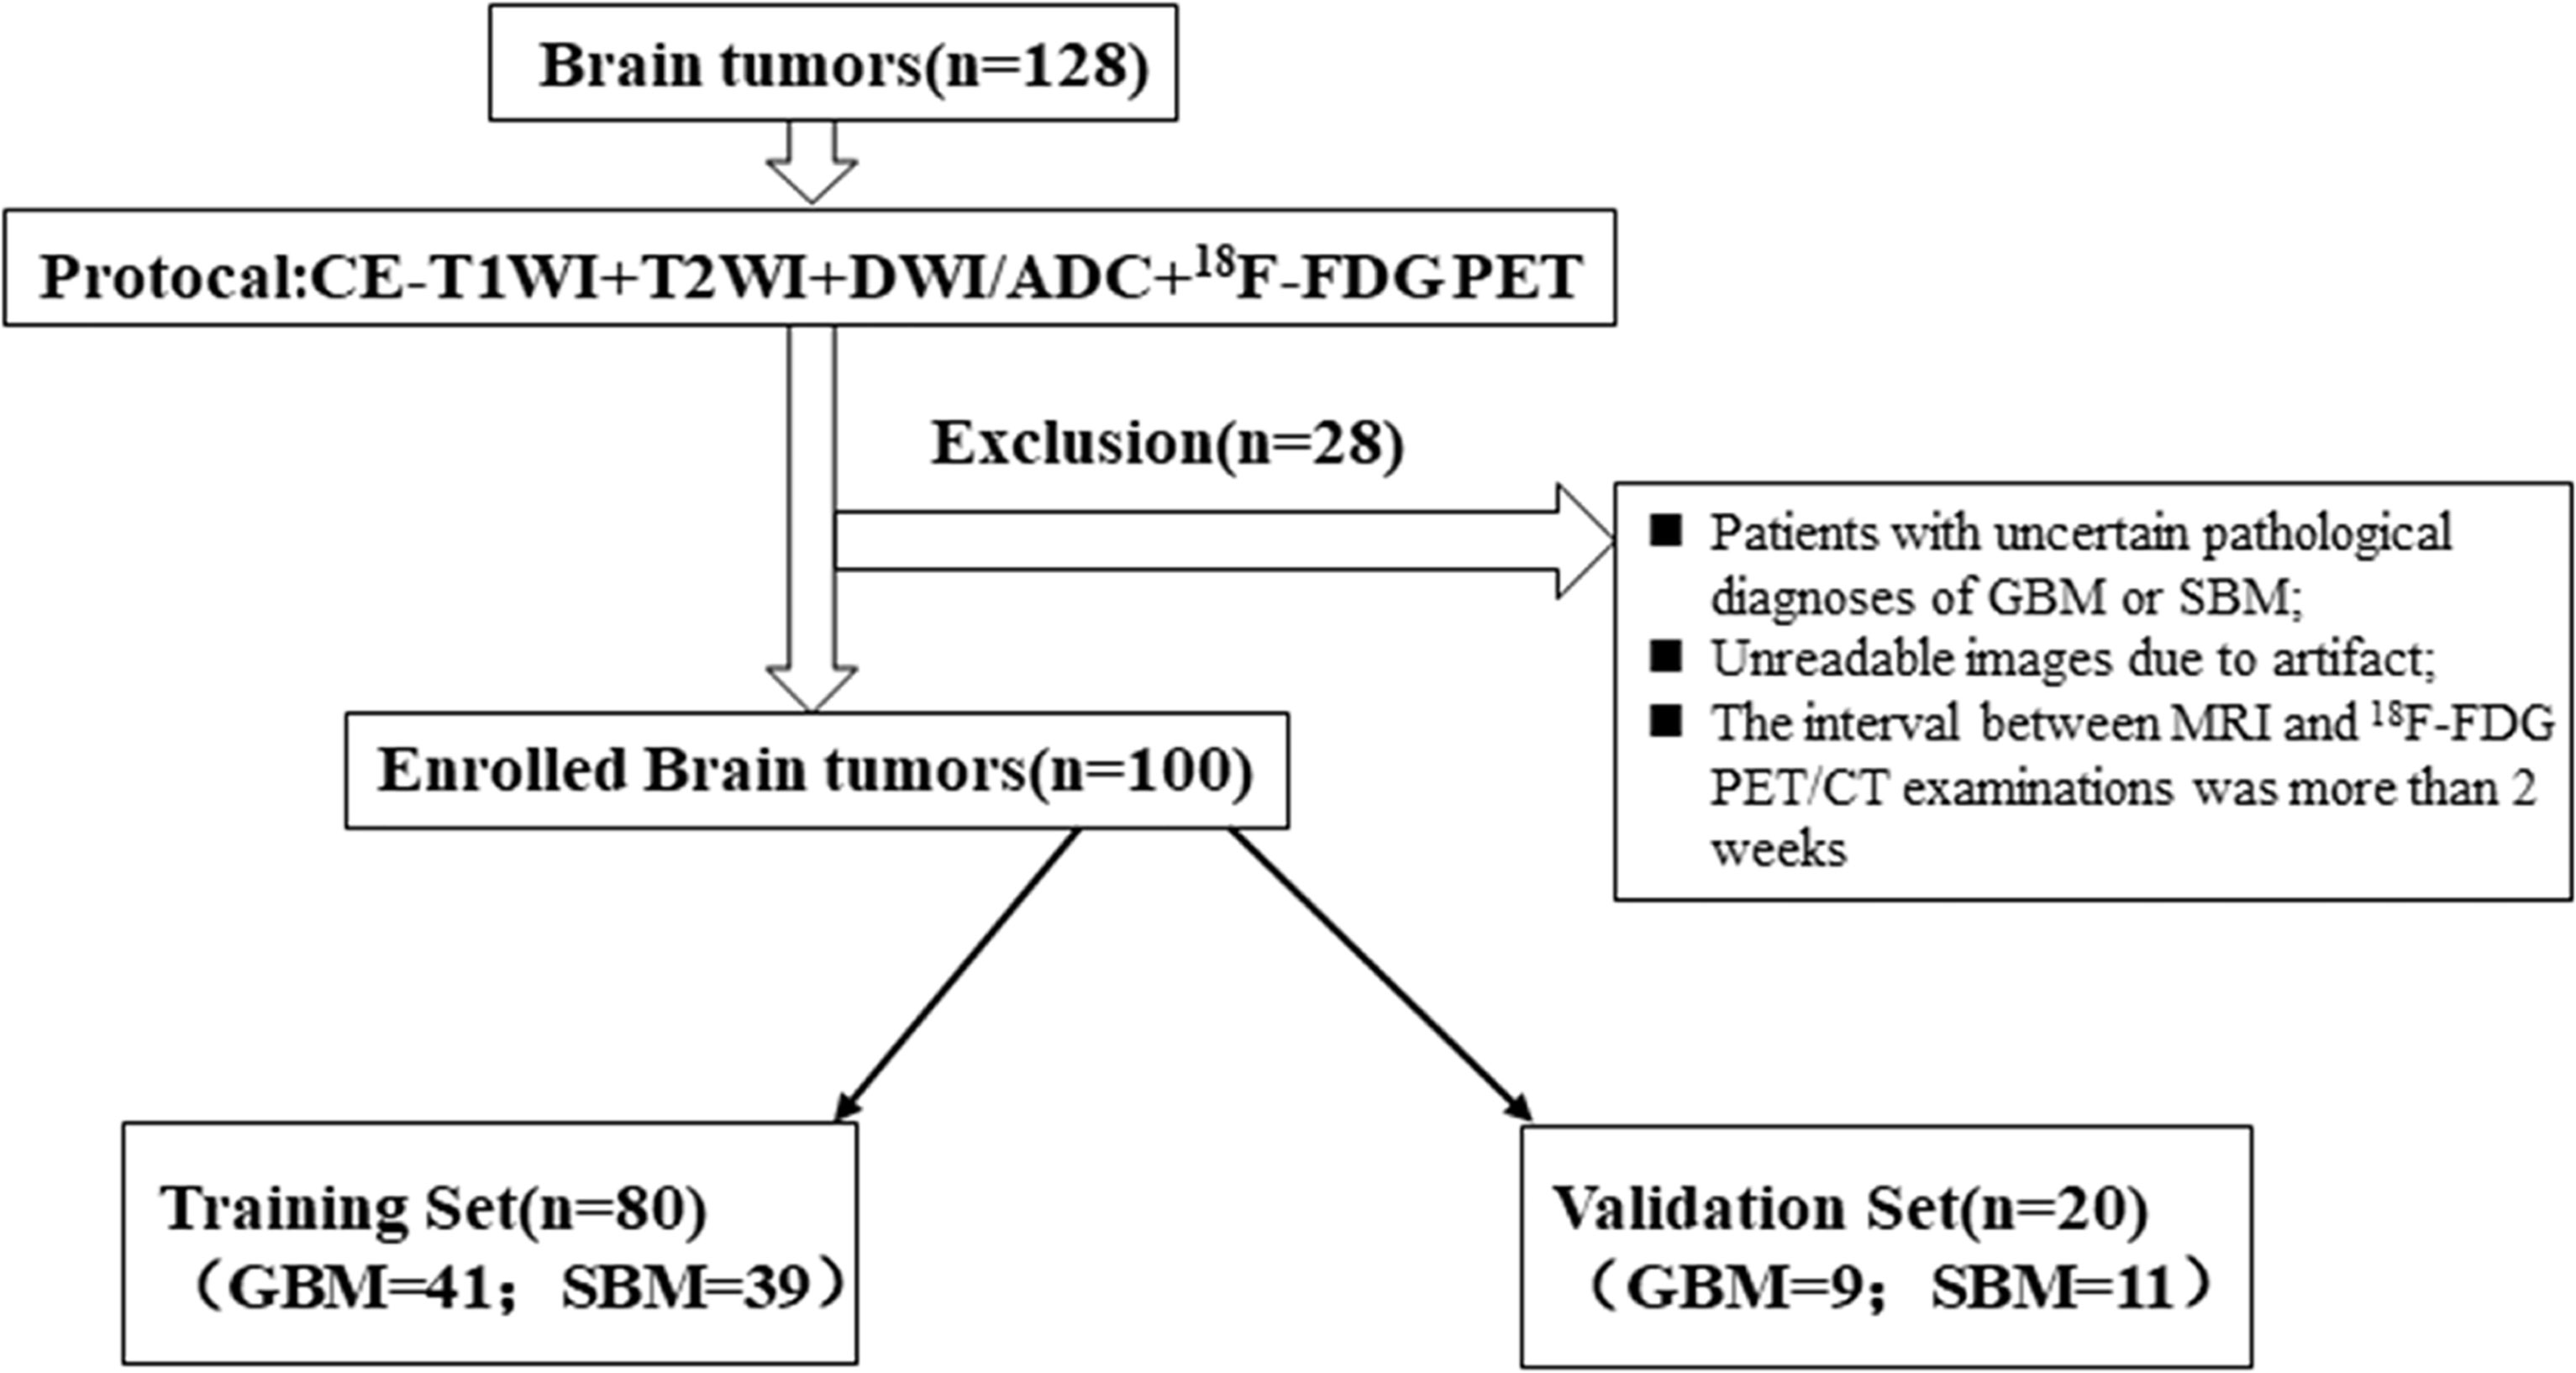
Figure 1 The flowchart of patient selection process.
The MRI protocol for both training and validation sets included CE-T1WI, T2WI, DWI, and 18F-FDG PET imaging.
MR images were obtained from the 3.0-T MRI system (Genesis Signa and Signa HDtx) with an eight-channel head coil (GE Medical Systems, Chicago, IL, USA). The main parameters of the T2WI sequence were as follows: repetition time/echo time (TR/TE) = 8,000/140 ms, flip angle = 90°, slice thickness = 5 mm, acquisition matrix = 256 × 256. The main parameters of the CE-T1WI sequence were as follows: TR/TE = 750/15 ms, slice thickness = 5 mm, acquisition matrix = 384 × 256. The main parameters of the DWI sequence were as follows: TR/TE = 6,379/70 ms; section thickness = 5 mm; intersection gap = 1.5 mm; matrix size = 128 × 128; FOV = 260 × 260 mm. The apparent diffusion coefficient (ADC) map (b = 1,000) was generated from DWI images.
18F-FDG PET data acquisition was carried out with a PET/CT scanner (Philips Gemini TF 64 PET/CT scanner). The participants fasted for at least 6 h before 18F-FDG administration and stopped any drugs that could affect brain metabolism for at least 12 h before the 18F-FDG PET acquisition. Blood glucose levels were determined in all patients before 18F-FDG administration, and blood glucose level was less than 8.0 mmol/L. PET/CT images of the head were acquired 60 min after intravenous injection of 370–555 MBq 18F-FDG (produced by Sumitomo accelerator of Japan with a radiochemical purity of >95%). PET images were acquired for one bed position (5 min/bed position), and a slice thickness of 2 mm. Low-dose CT images were obtained with a standardized protocol of 400 mAs, 120 Kv, matrix size of 512 × 512, and a slice thickness of 1 mm. The fusion images (a slice thickness of 2 mm) were obtained by computer iterative reconstruction and attenuation correction.
For the CE-T1WI and T2WI data, signal intensity normalization was performed to reduce the variance in the T1-based signal intensity of the brain. We used the hybrid white-stripe method (22) for intensity normalization using the ANTsR and White Stripe packages (27, 28) in R, which incorporates processes of the statistical principles of image normalization, preserves ranks among the tissues, and matches the intensity of the tissues without upsetting the natural balance of the tissue intensities (29).
Skull stripping and tumor segmentation were performed by the 3D-Slicer Software (version 4.3, https://www.slicer.org) (30), an open-source software widely used for image visualization and segmentation. The tumor and perifocal edema contours were manually segmented using the fast-grow cut tool based on the T2WI imaging by two radiologists with 10 and 5 years of diagnostic experience, respectively, who were blinded to the final pathological result. The final region of interest (ROI) was determined by the two radiologists. If the divergence between segmentations was less than 5%, the final ROI was determined as the overlapping region of the two ROIs, otherwise, it was determined by the two radiologists. The segmented tumor contour was finally overlaid with source CE-T1WI, T2WI, ADC, and 18F-FDG PET image.
The radiomic features were composed of five groups of features: 18 first-order features, 14 shape features, 73 texture features, 273 LoG-transformed features, and 728 wavelet-transformed features. All patients had undergone CE-T1WI, T2WI, DWI, and 18F-FDG PET, from which 1,106 radiomic features were derived, respectively. Finally, all radiomic features were extracted for group comparisons after z transformed. The entire feature extraction algorithm was fully automated, which yielded identical features regardless of the operators. The overall process of the radiomics pipeline is shown in Figure 2.
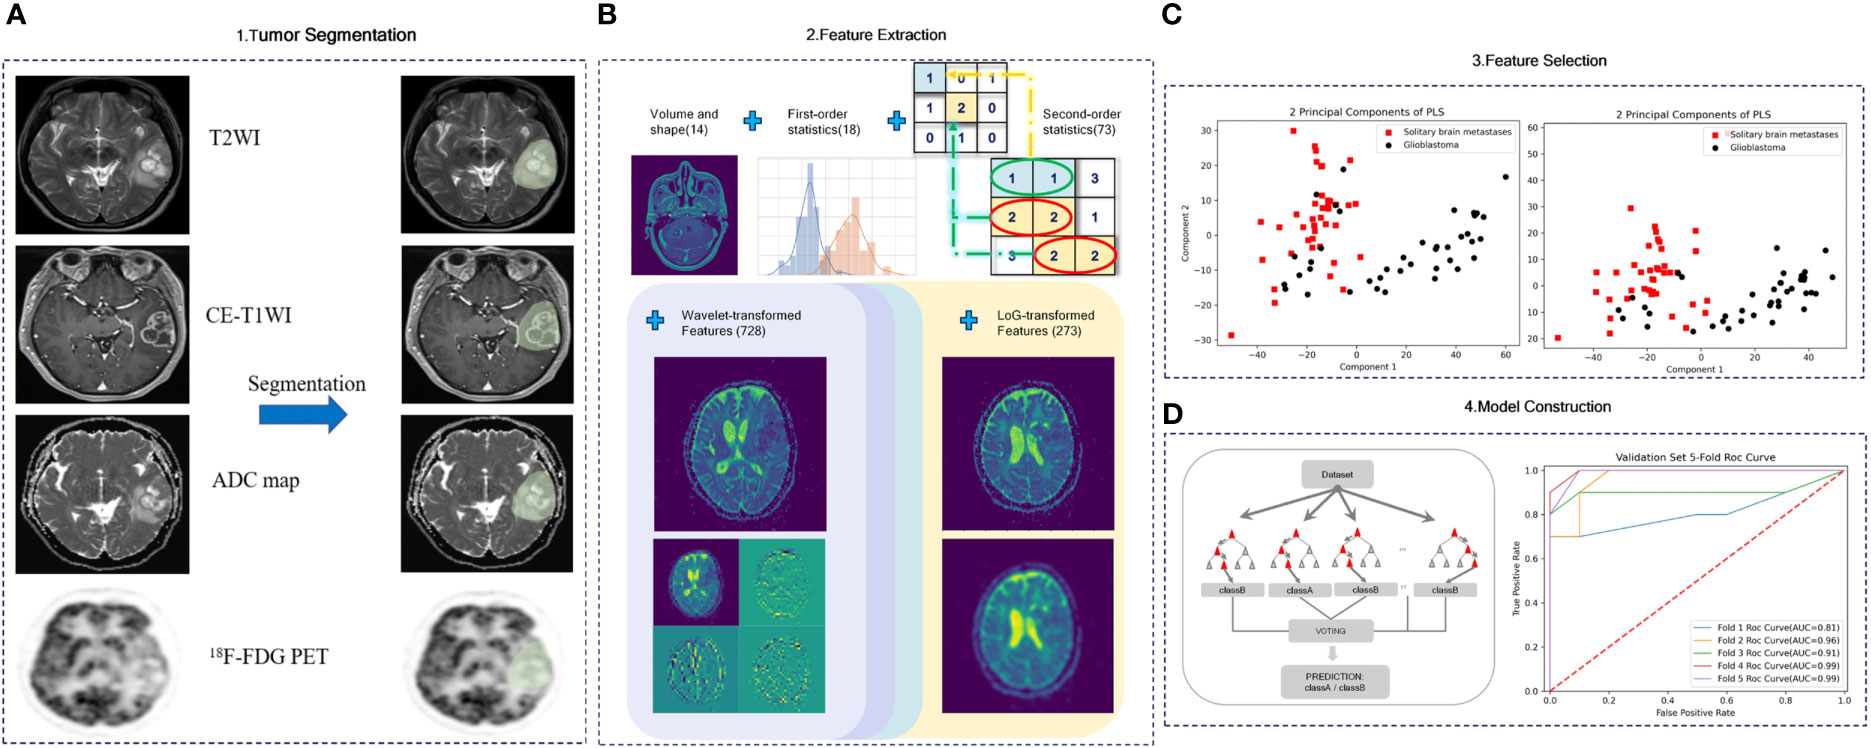
Figure 2 Radiomics worklist. (A) Part 1 includes image acquisition, registration, and segmentation. Signal intensity normalization is conducted for CE-T1WI and T2WI. (B) Part 2 includes the extraction of radiomics features. (C) Part 3 includes feature selection. (D) Part 4 includes model construction.
In this study, we first used a t-test to screen radiomics features with significant independence, then applied partial least squares (PLS) to complete the regression analysis of those high-dimensional radiomics features in the training set. PLS regression method was applied using principal component analysis to extract and compress multiple independent variables X and multiple dependent variables Y into corresponding principal components U and V, respectively. Then, under the guidance of the canonical correlation principle and the multiple linear regression principle, the relationship can be analyzed between X and U, Y and V, and X and V. Thus, the relationship between X and Y can be studied. The PLS regression can project the high-dimensional data to the appropriate low-dimensional space and complete the effective feature selection of the data, which was chosen because the extracted radiomics features have the following two characteristics: (1) The number of feature dimensions extracted is far more than the number of patients. (2) Radiomics features exist in multiple correlations. PLS performs well in studies with small sample and multicollinearity among independent variables (radiomics features) and can emphasize the role of independent variables in the interpretation and prediction of dependent variables (classification of patients) when selecting feature vectors to remove the influence of useless noise on regression and make the radiomics model contain the least number of variables. As a result, final prediction performance gets better.
To evaluate the robustness of the radiomics model and consider the number of data samples, we applied fivefold cross-validation. Cross-validity analysis was used to determine the final output dimension size of PLS regression; after that, all radiomics features with significant independence were projected to the new two-dimensional space through PLS regression. Then a variety of classical classifiers were used to predict the outcome using the selected effective features and the optimal random forest classifier is selected to construct the final radiomics model. Finally, the predictive efficiency of the radiomics model was compared under the different modality features combination.
The accuracy of differentiating GBM from SBM using the above methods was assessed with the receiver operating characteristic (ROC) curve and the AUC values in two sets. The optimal thresholds of the AUC values were determined by maximizing the sum of the sensitivity and specificity values calculated for differentiating GBM from SBM.
The performance of the integrated radiomics model was compared with that of the three combined radiomics models, three single radiomics models, and five single nonradiomics methods. Bonferroni correction was applied to adjust the p-values for multiple comparisons. A Bonferroni-corrected significance level of p < 0.008 was used to compare the integrated radiomics model and six other radiomics models, and a value of p < 0.01 was used to compare between the integrated radiomics model and the five nonradiomics methods.
Statistical analyses were performed using R software (version 3.3.3). Differences in clinical information between the training and validation sets were evaluated using Student’s t-test and Chi-square tests, and p < 0.05 was considered statistically significant. The Student’s t-test was used to assess differences in the imaging parameters between GBM and SBM in the training and validation sets.
All patients underwent biopsy or surgery, and their pathological examination results were assessed. Of the 80 enrolled patients in the training set, 41 (51.2%) were identified as GBM and 28 (36.8%) as SBM. Twenty patients in the validation set consisted of nine (45.0%) GBM and 11 (55.0%) SBM. The clinical characteristics of the training and validation sets are shown in Table 1. No significant differences were found between the patients with GBM and SBM regarding age and sex, which justified the applicability of the training and validation sets.
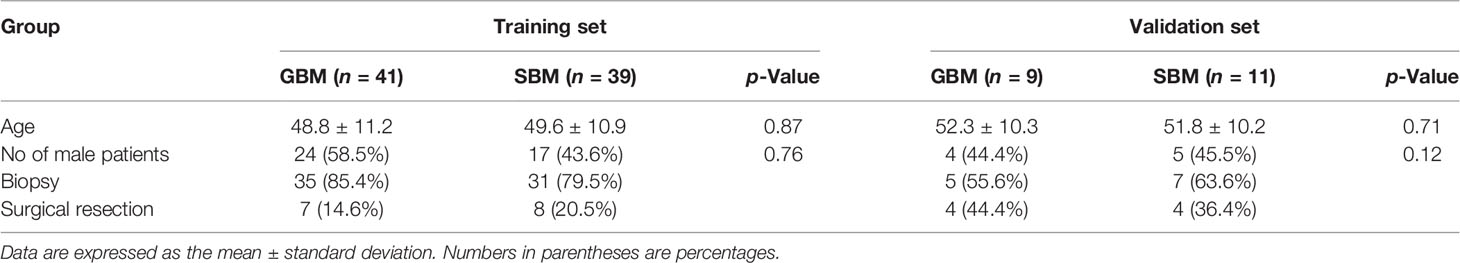
Table 1 Clinical characteristics of the patients.
In total, 4,424 radiomic features were extracted from the multiparametric MR data (1,106 features were derived from CE-T1WI, T2WI, ADC, and 18F-FDG PET). Partial least squares regression was used to find the correlation between radiomic features and patient classification. After cross-validity analysis, the top-m principal components of radiomic features with significant improvement for prediction results were selected by truncation method, so that hundreds of radiomic features were projected into a new m-dimensional space. Table 2 shows the corresponding numerical relationship between different modality combinations (columns) and the final projection mapping dimensions (rows). The table starts from the analysis with only one principal component and gradually increases the number of retained principal components until the cross-validity principle is no longer satisfied, to select the number of final effective feature dimensions. The specific performance is the corresponding Qh2 value less than 0.0975, indicating that adding a new principal component or feature dimension based on the previous number of principal components no longer has an obvious improvement on the final prediction effect and then ends the increase of the principal component number. It can be obtained from Table 2 that the effective principal components of almost all modality combinations are less than or equal to 3. At the same time, judging from the importance and cumulative proportion of each principal component to the outcome (Figure 3), even when there are only three principal components, the newly screened features can affect the final result by more than 50%. From this point of view, it is reasonable to use the partial least squares method to screen the effective features. Through the experimental test, the number of dimensions of the optimal result is 2.
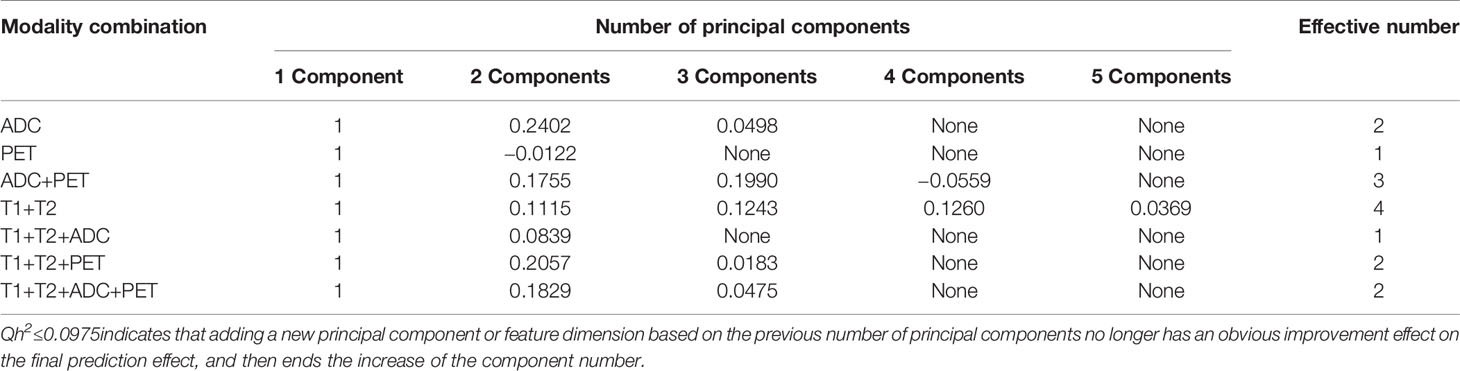
Table 2 Score of crossvalidity analysis (Qh2 score).

Figure 3 Principal component contribution histogram and cumulative contribution rate line chart.
In constructing a random forest model, not all the training data were used by each decision subtree, so these data can be used as test cases to measure the generalization performance of the model by calculating the classification error of out-of-bag estimation, which was 0.10 in the training cohort. The mean prediction accuracy of 84.00% (AUC = 0.9330) for fivefold cross-validation was achieved in the validation cohort (Figure 4). For a random forest classifier, the classification score matrix represents the possibility that the label comes from a specific category. As shown in Figure 5, the red line indicates the median, and in our radiomics classifier model, the average scores (white diamond in Figure 5) of correct prediction for samples with GBM label and SBM label are 0.9365 (95% CI: 0.9044–0.9686) and 0.8762 (95% CI: 0.8350–0.9174), respectively.
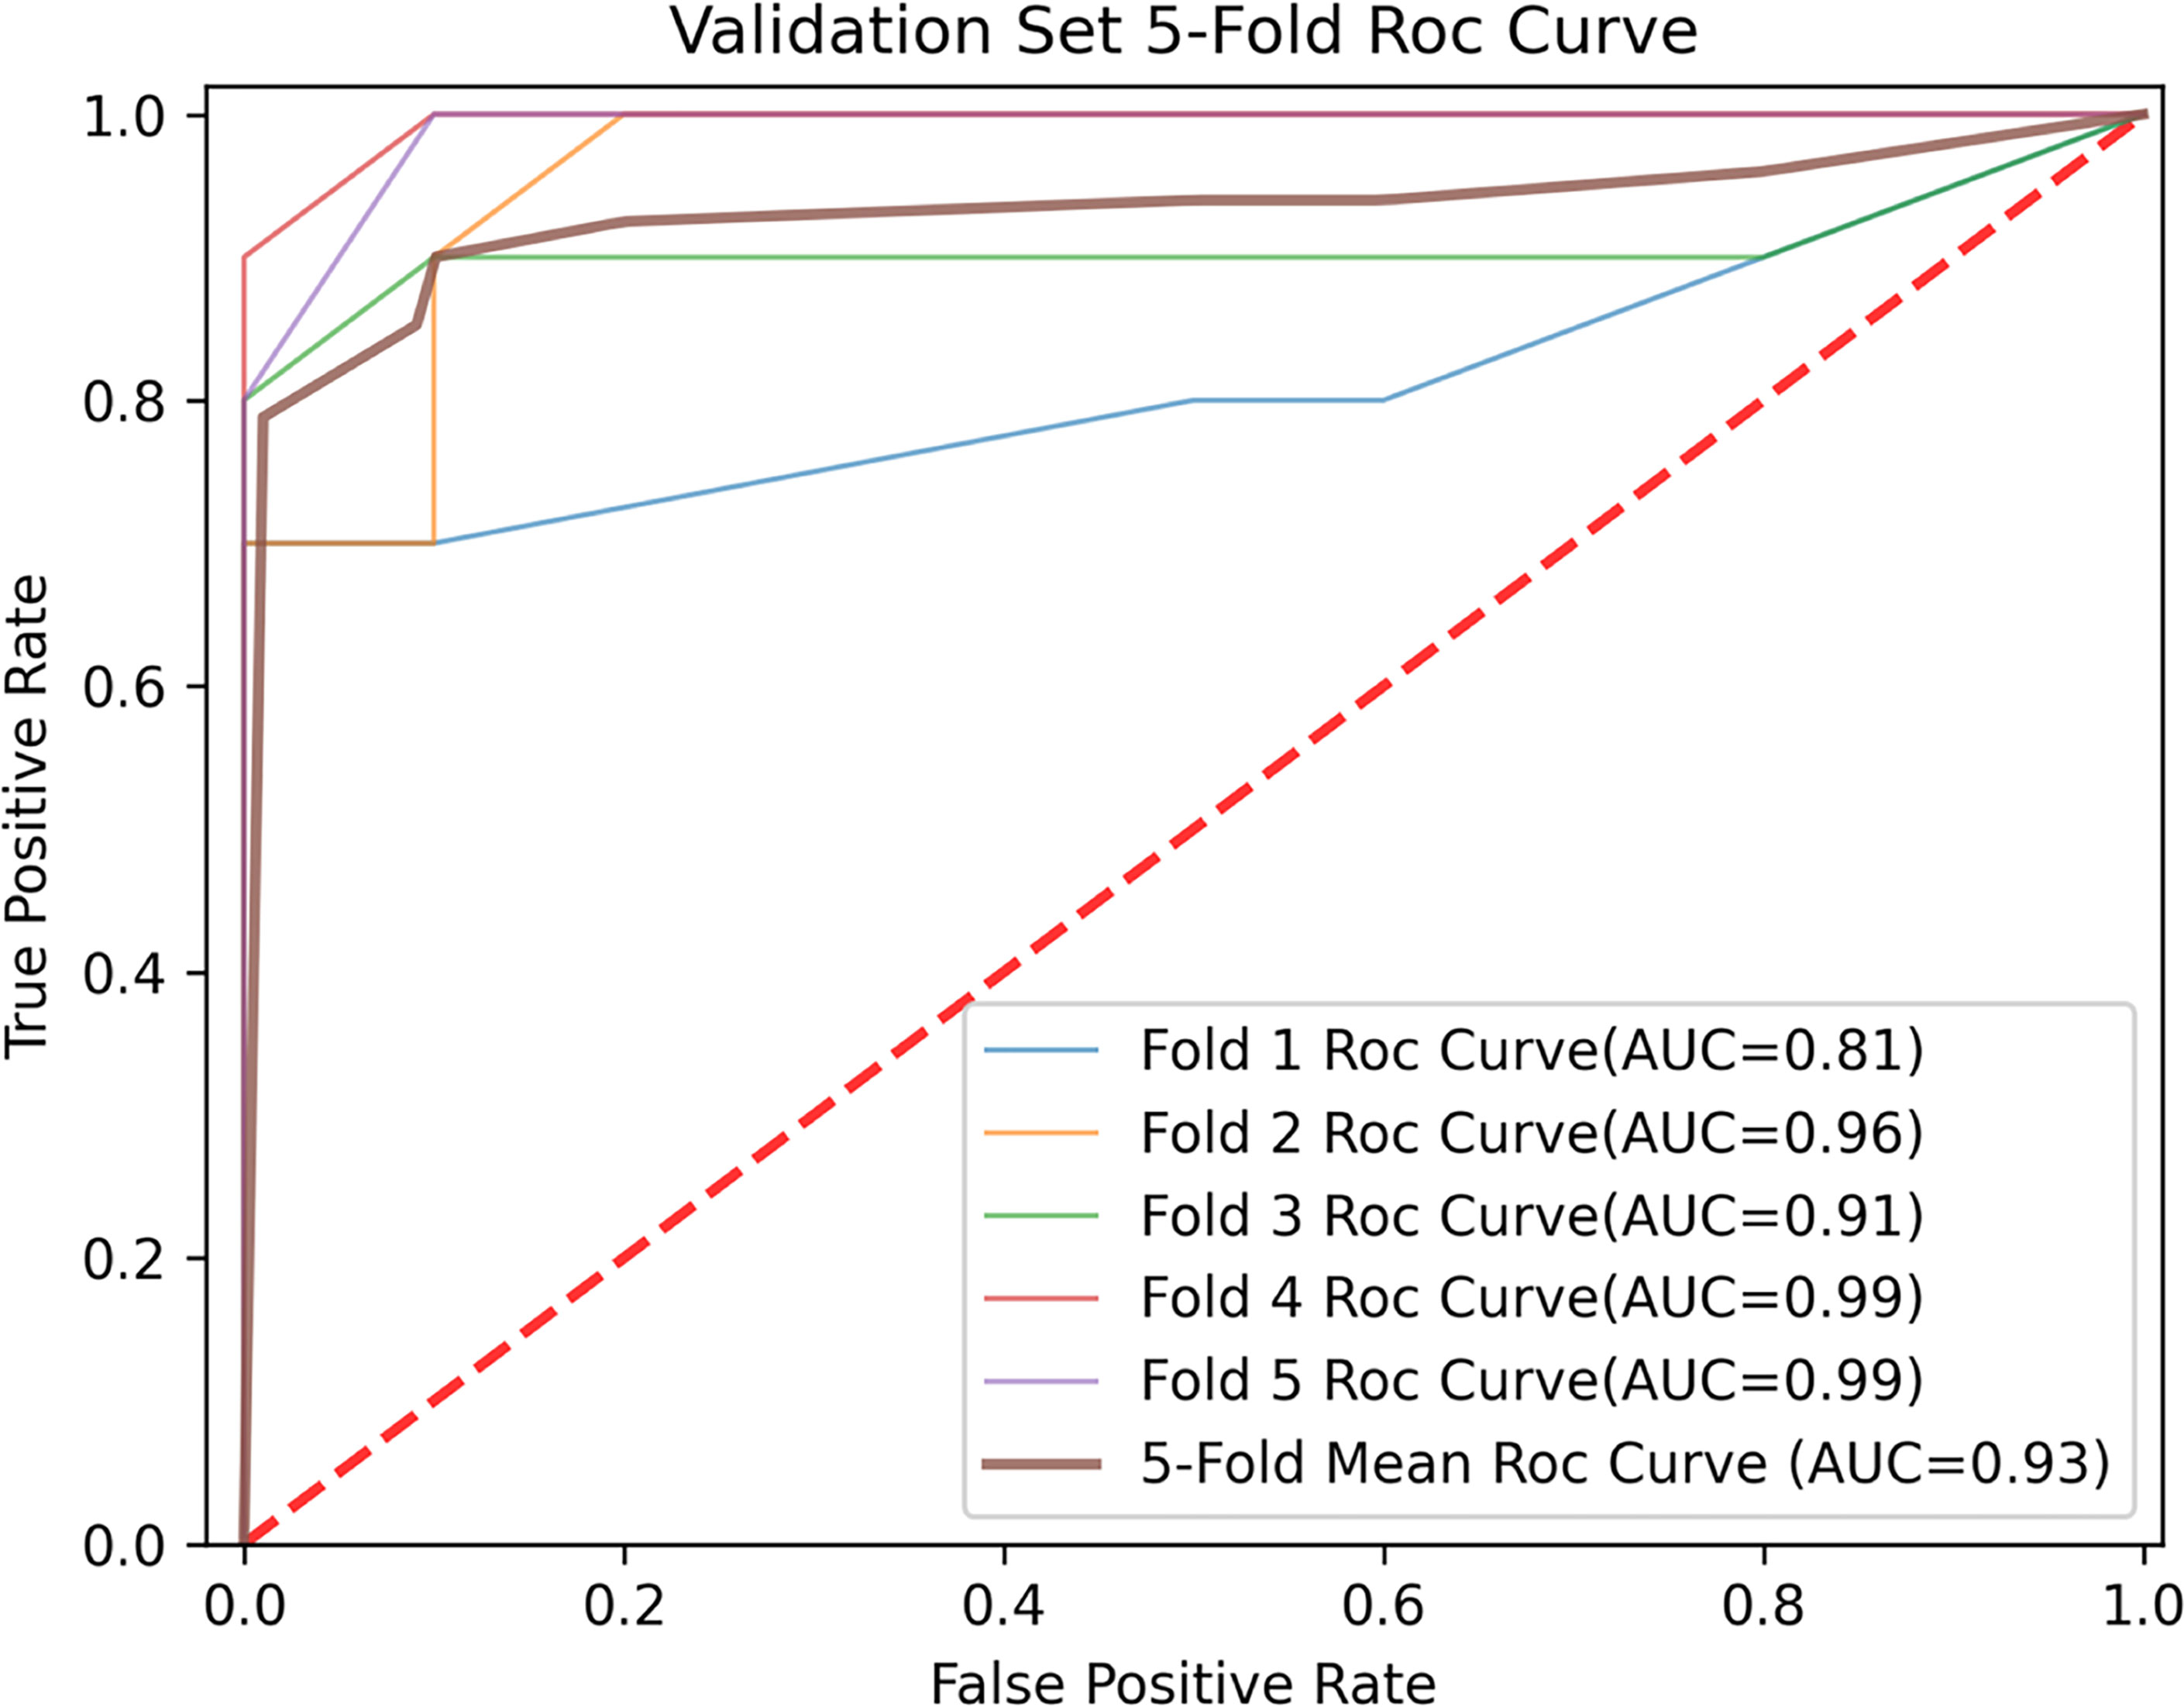
Figure 4 Fivefold and mean receiver operating characteristic (ROC) curve for prediction in the validation cohort.
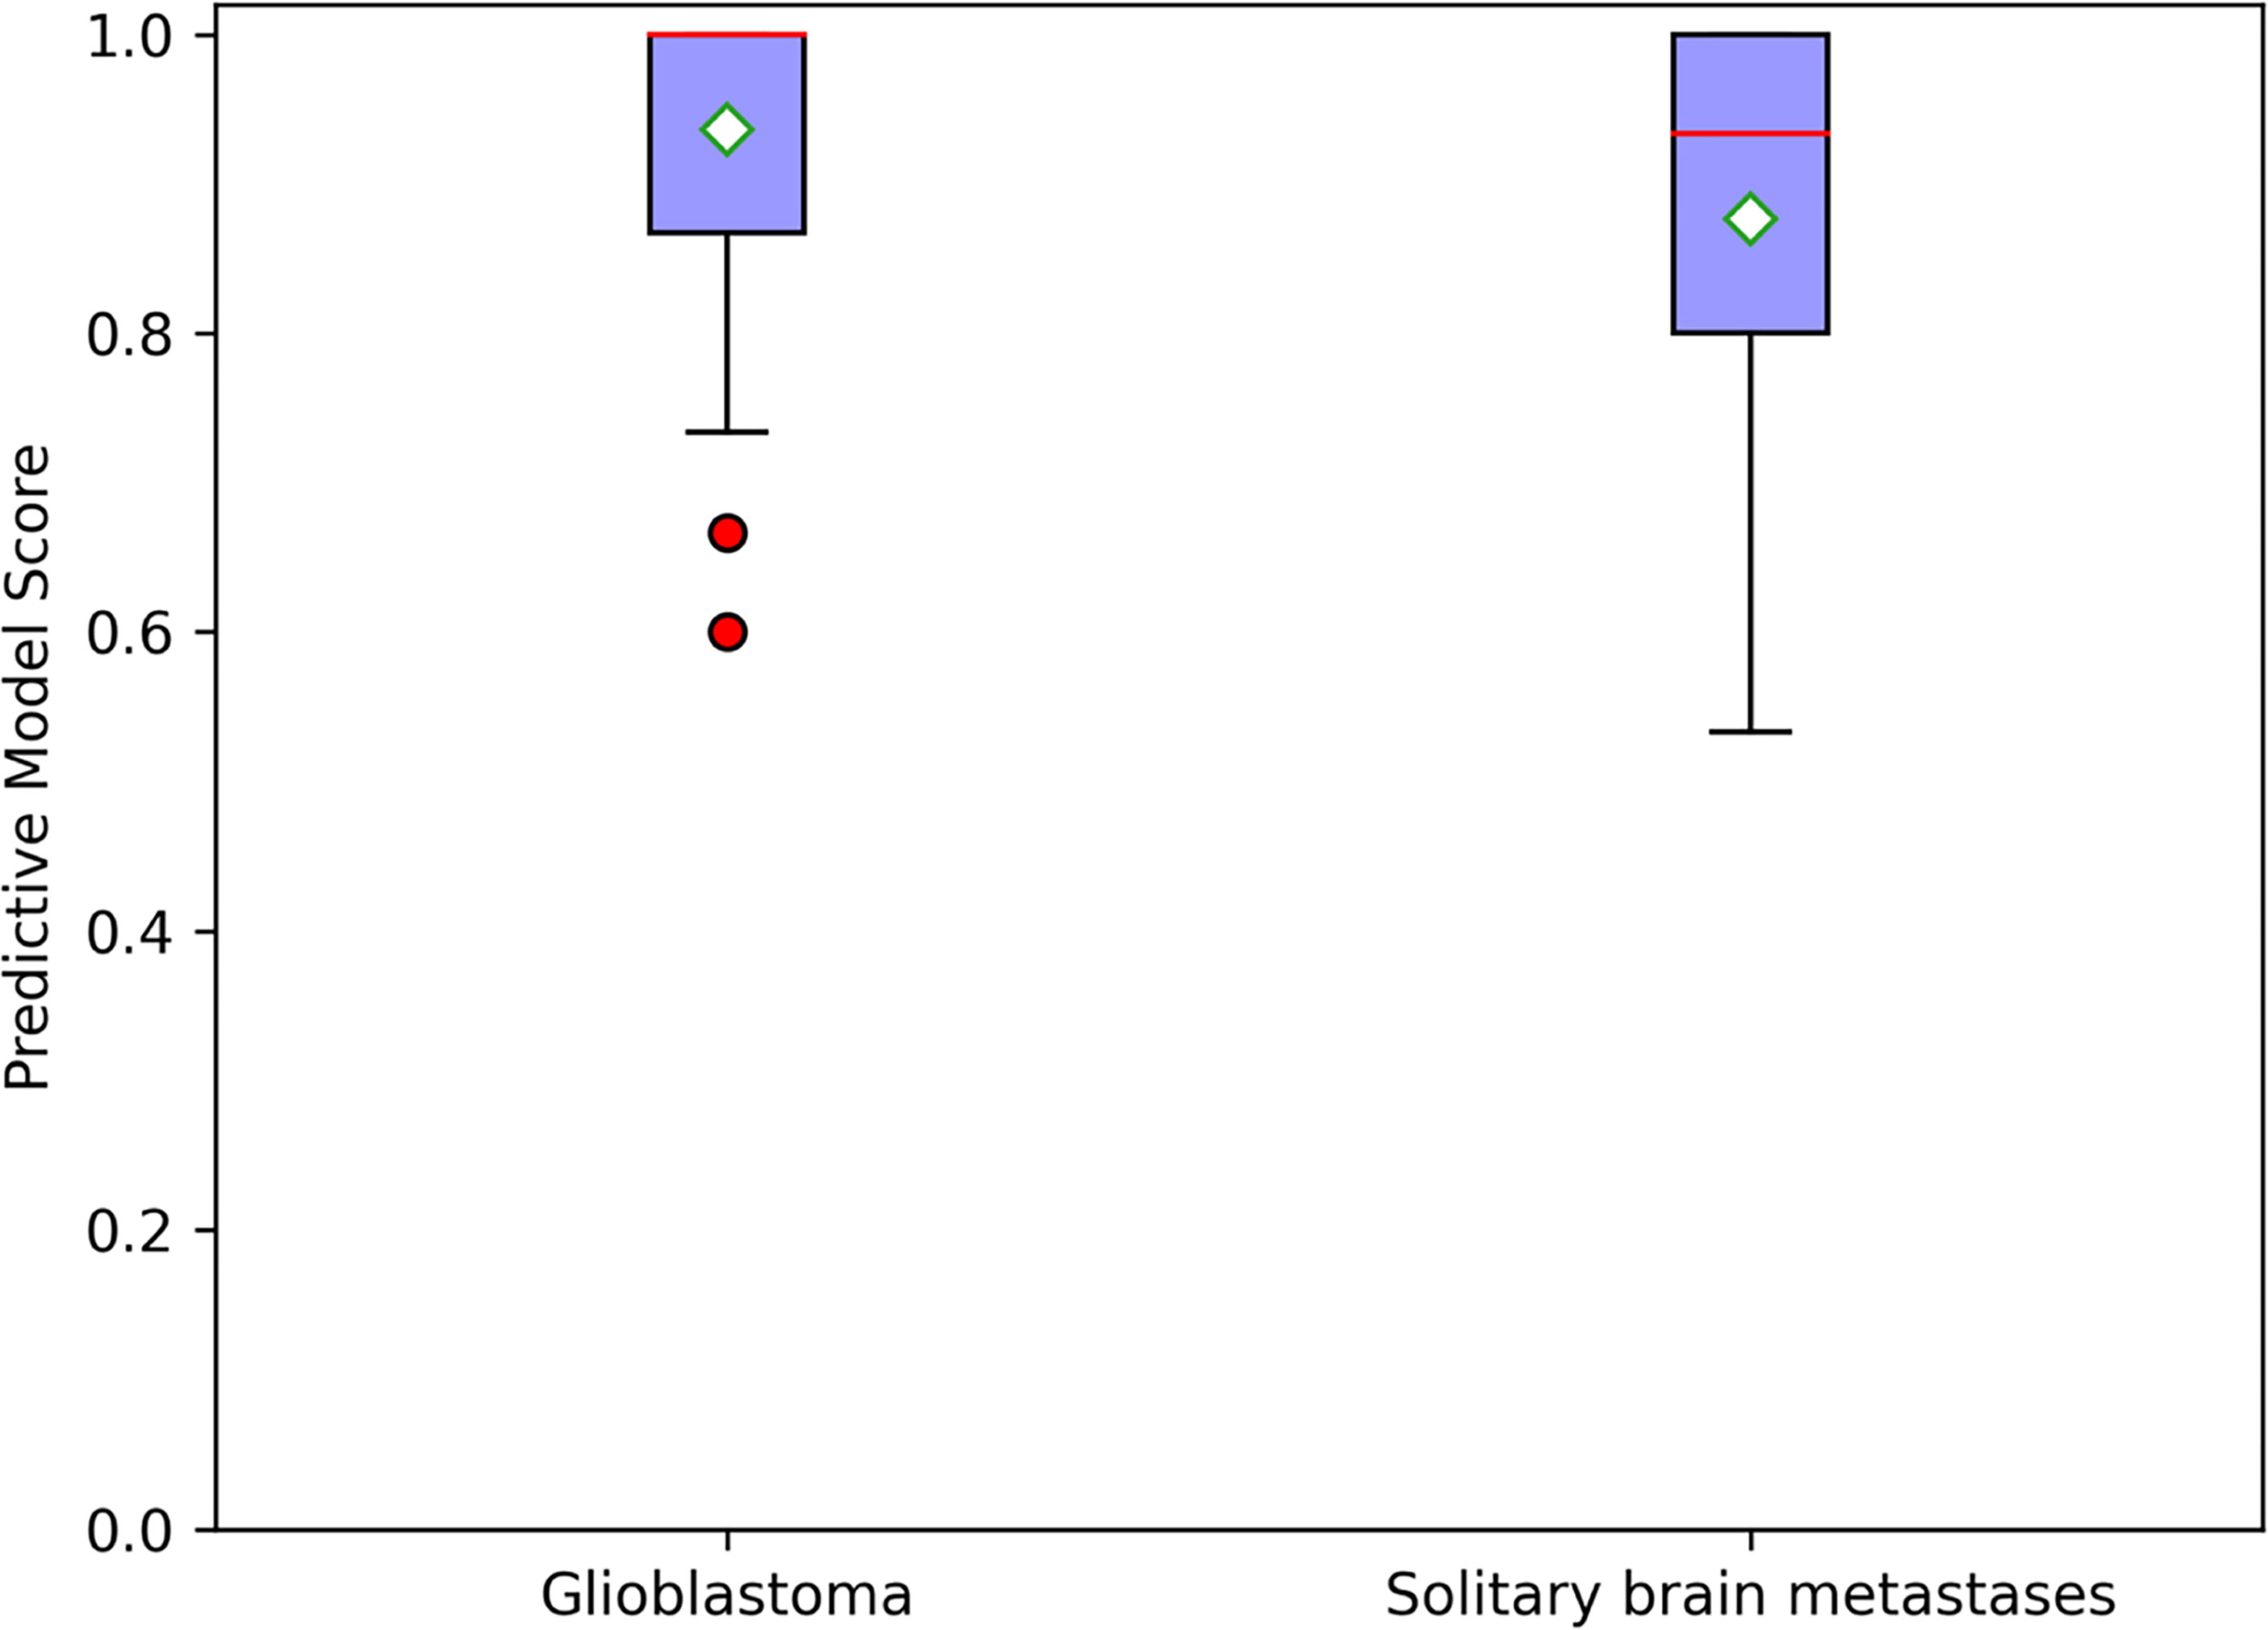
Figure 5 Random forest classifier scores for glioblastoma and solitary brain metastases in the validation cohort; the red line indicates median, and the white diamond represents average prediction score.
The sensitivity and specificity of the integrated radiomics model in the training set were 92.5% and 98.7%, respectively. The AUC value was higher in the integrated radiomics model (AUC = 0.98) than in the combined radiomics models (DWI + 18F-FDG PET: AUC = 0.93, p=0.014; Conventional + DWI: AUC = 0.89, p = 0.011; Conventional + 8F-FDG PET: AUC = 0.91, p = 0.015), the single radiomics model using cMRI (AUC = 0.85, p = 0.018), DWI (AUC = 0.84, P = 0.017), 18F-FDG PET (AUC = 0.85, p = 0.421) and single nonradiomics method (AUC = 0.57–0.71, p < 0.05), showing the integrated model with better performance (Table 3).
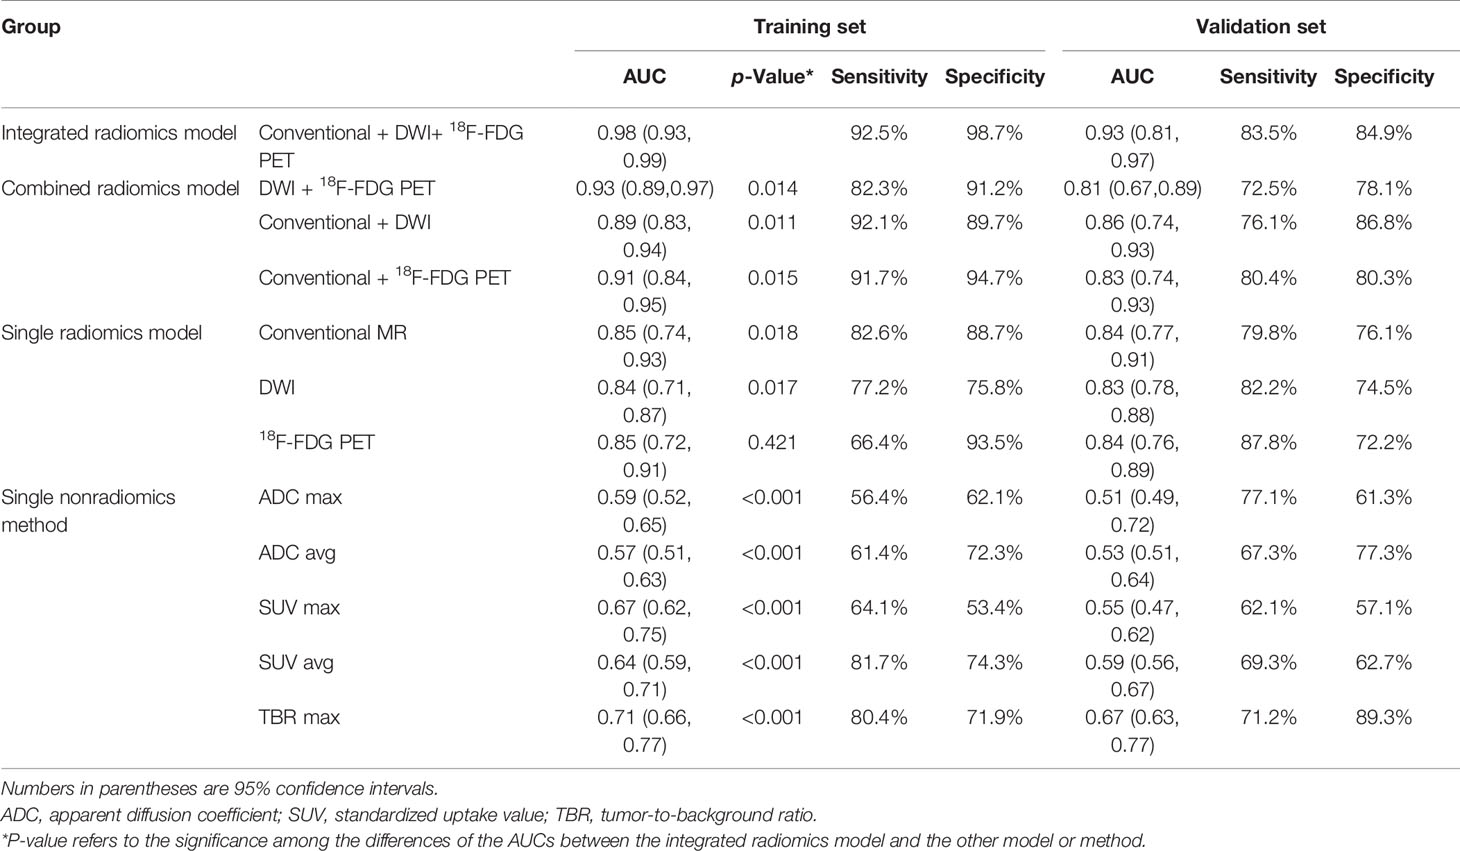
Table 3 Comparison of diagnostic performance between integrated radiomics model and other methods in the training and validation sets.
The sensitivity and specificity of the integrated radiomics model in the validation set were 83.5% and 84.9%, respectively. The AUC value was higher in the integrated radiomics model (AUC = 0.93) than in the combined radiomics models (DWI + 18F-FDG PET: AUC = 0.81; Conventional + DWI: AUC = 0.86; Conventional + 8F-FDG PET: AUC = 0.83), the single radiomics model using cMRI (AUC = 0.84), DWI (AUC = 0.83), and 18F-FDG PET (AUC = 0.84) and the single nonradiomics method (AUC = 0.51–0.67), showing the integrated model with better performance as well. The comparison of diagnostic performance of the radiomics models in the validation is shown by the fivefold mean ROC curve for different combinations in Figure 6, and more evaluation indicator information can be seen in Table 4.
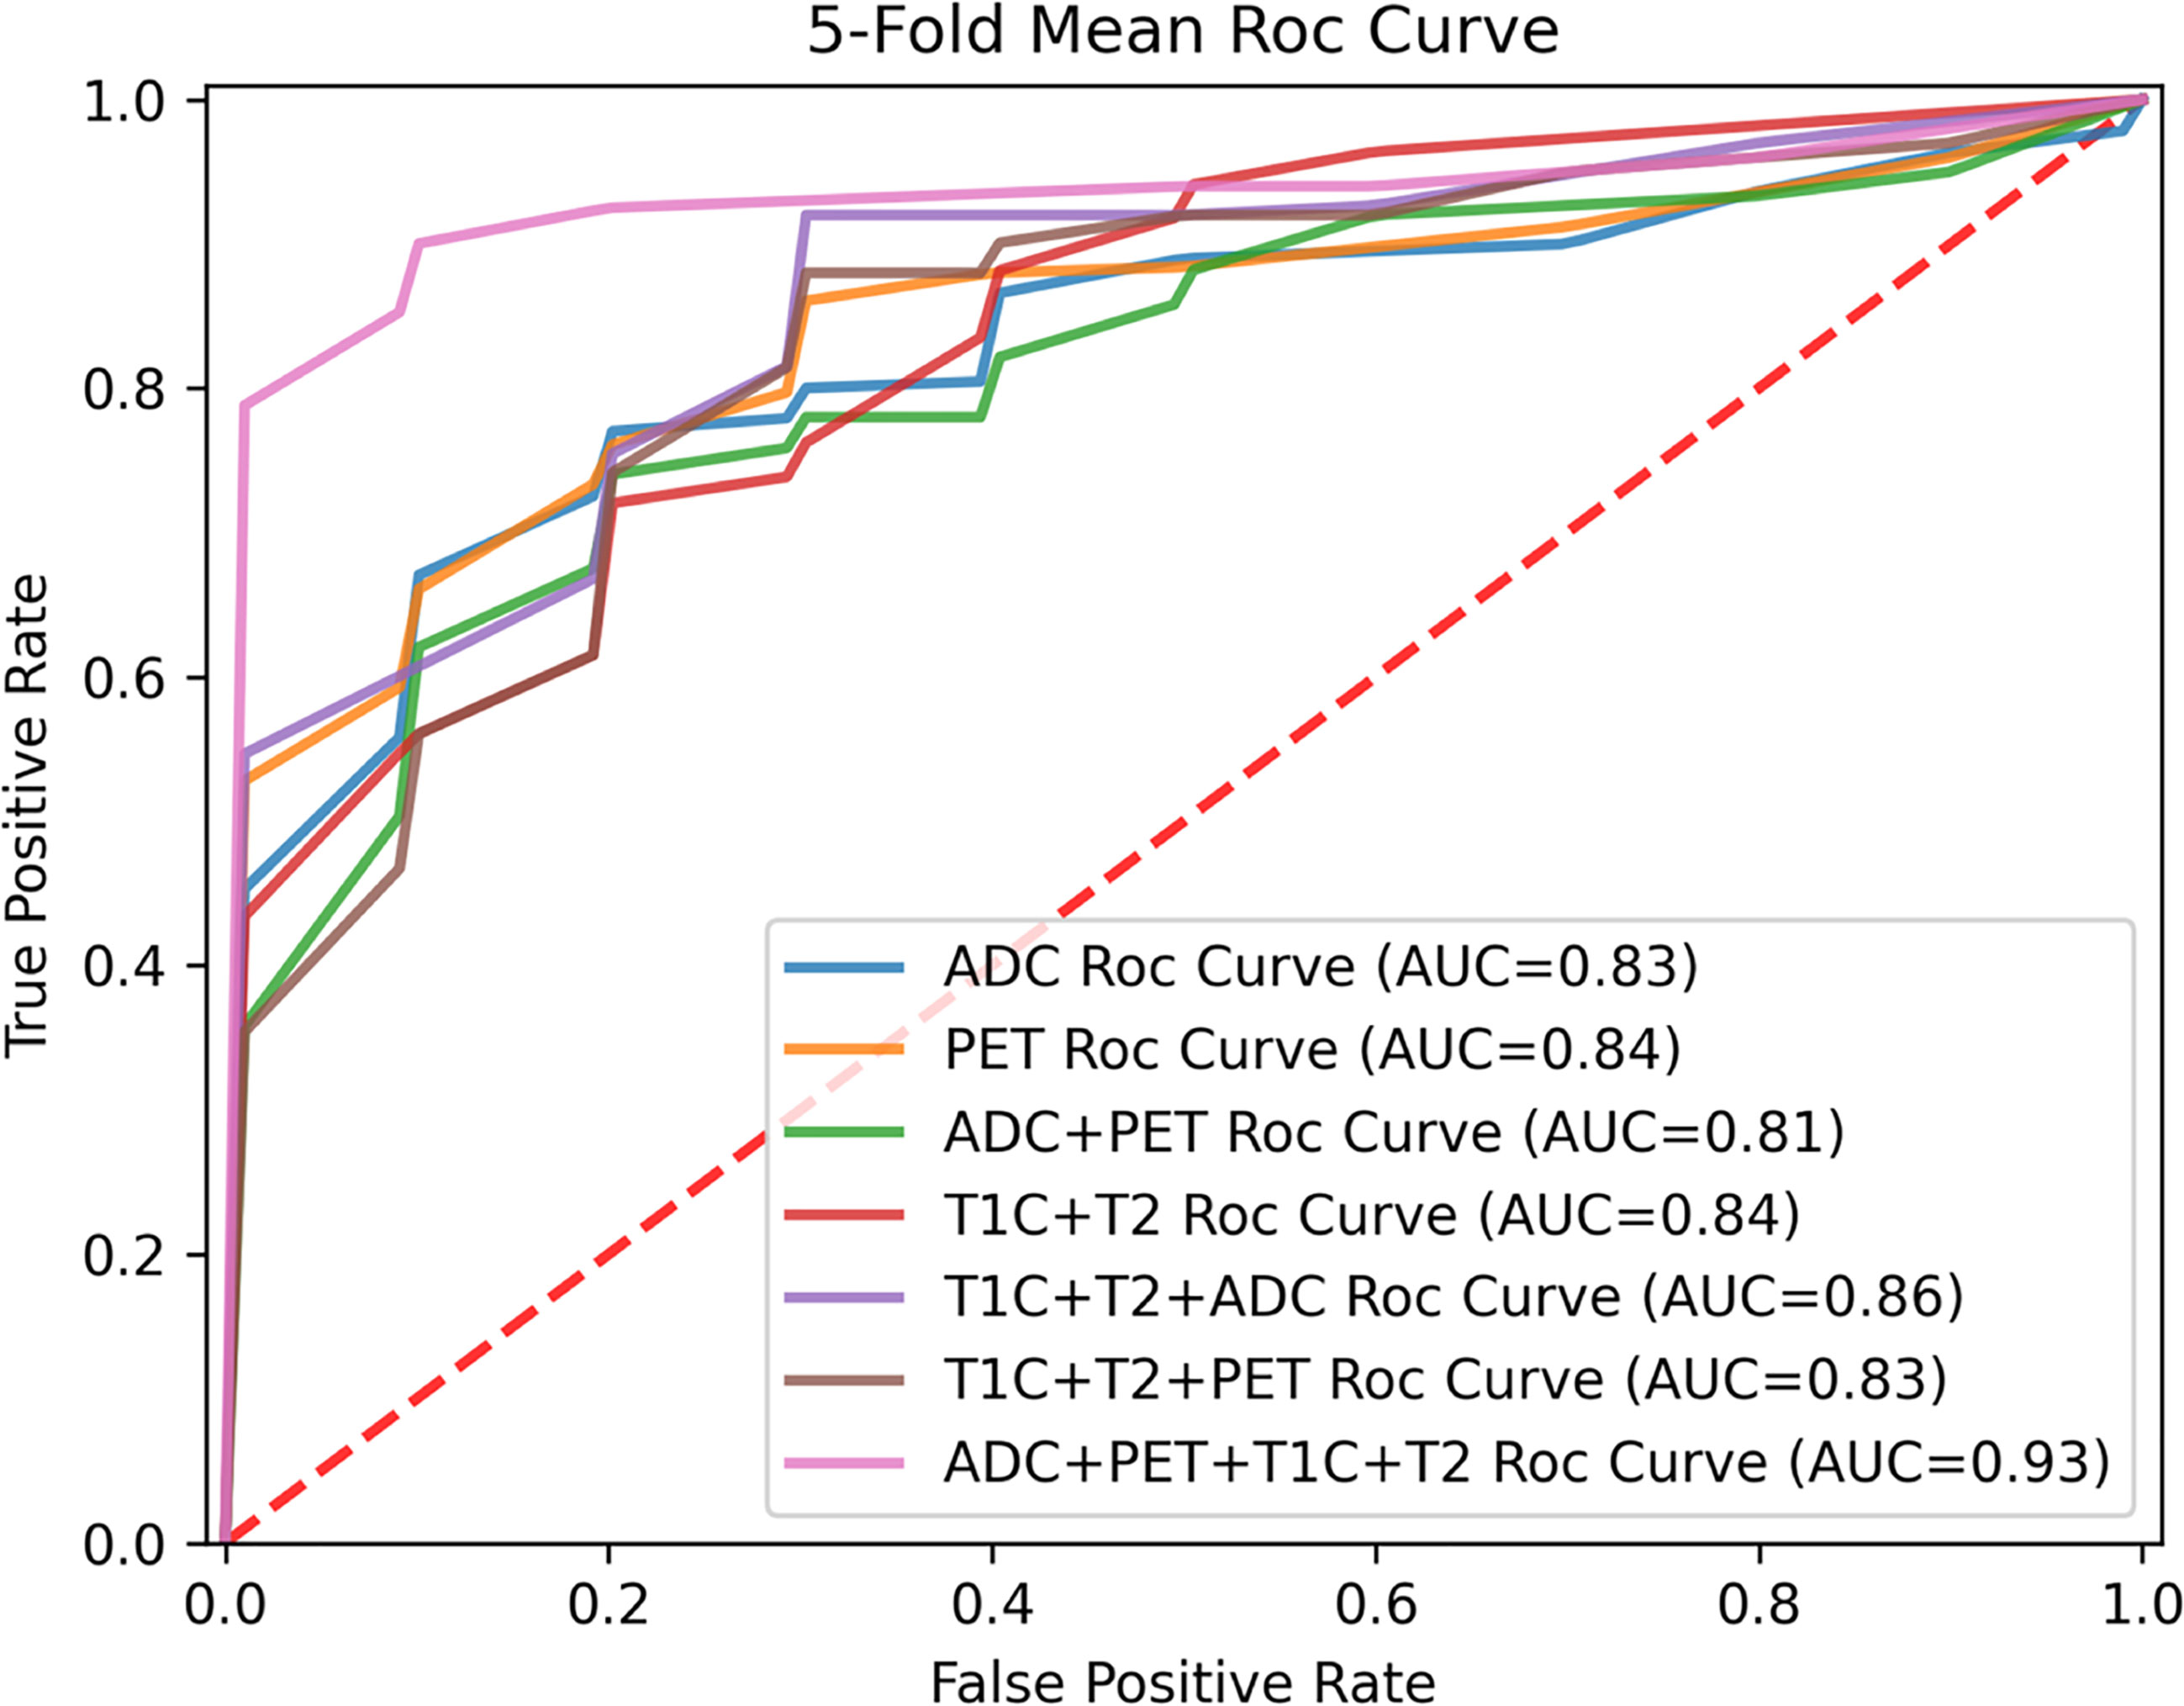
Figure 6 Fivefold mean ROC curve for different modality combination.
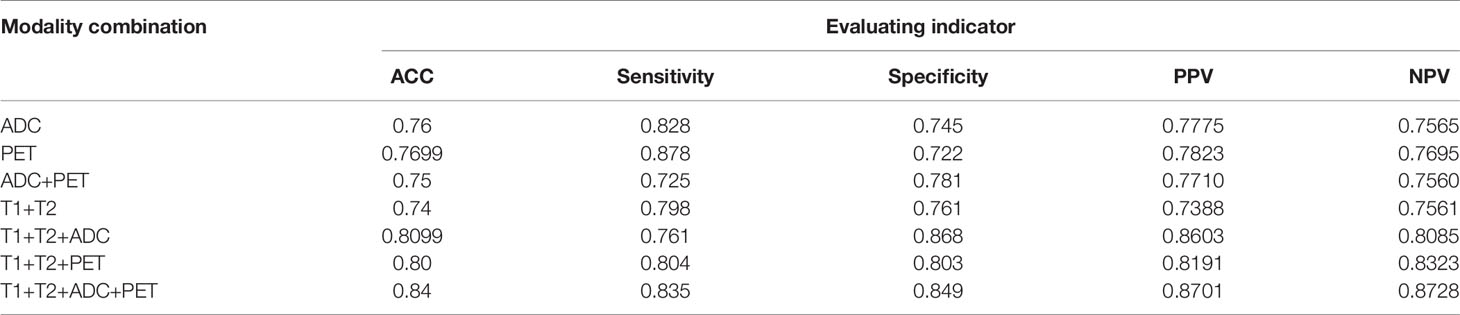
Table 4 Comparison of more evaluation indicator information.
In the present study, we built seven radiomics models and five nonradiomics methods and compared their performance. By optimizing the radiomics models from single parameter, single and double sequences to multimodality, we finally concluded that the integrated radiomics model incorporating DWI and 18F-FDG PET outperformed any other radiomics models and nonradiomics methods. The integrated radiomics models in the training and validation sets have an AUC of 98% and 93%, a sensitivity of 92.5% and 83.5%, and a specificity of 98.7% and 84.9%, respectively. Some studies have used advanced imaging modalities (DWI and PET, etc.) to differentiate GBM from SBM. Lee et al. (29) analyzed patient age and sex, minimum ADC value, and ADC ratio of the two groups and found a statistical difference between GBM and metastasis. Kamson et al. (31) tested the accuracy of α[11C]-methyl-L-tryptophan (AMT)–positron emission tomography (PET) to differentiate GBM from metastases and concluded that tumor/cortex AMT SUV ratios could distinguish GBM from metastases. However, their researches are just quantitative or semi-quantitative statistical analyses and limited to depict heterogeneous nature and excavate deeper information of GBM and metastases. As far as we know, this is the first radiomic study in brain tumors that combines MRI and 18F-FDG PET. The CE-T1WI/T2WI, DWI, and 18F-FDG PET in the model provided structural, functional, and metabolic information at the same time and space, which makes our research more comprehensive and in-depth.
This study extended previous radiomic studies that only extracted features from cMRI sequences on enhancing tumor region or peri-enhancing edema region to differentiate GBM from SBM (12–15, 32–35). First, we incorporated DWI and 18F-FDG PET based on cMRI sequences, which is the first of its kind. Second, the ROI of our study covers both enhancing tumor region and peri-enhancing edema region, which is larger than that of previous studies and is conducive to extracting more effective features. Third, we used the t-test to screen radiomics features with significant independence, and then used partial least squares regression to process these features further. The partial least squares regression with fivefold cross-validation was applied to analyze the correlation between different radiomics features within and between different imaging types in this study. Through cross-validity analysis to determine the final output dimension size of PLS regression, all radiomics features were mapped to the new two-dimensional space. After that, a variety of classical classifiers were used to predict classification outcomes using the new effective features, and the classifier with the best result (The random forest classifier is selected in this paper) will be selected to build the final radiomics model. Unlike the partial original radiomics features screened by LASSO in previous studies, we built the new interpretation dimensions according to the correlation between all radiomics features principal components and the corresponding label principal components to complete the construction of radiomics model. Even in a few new projection mapping dimensions, the final results are satisfactory. By comparing the diagnostic performance of models, we finally found an optimal integrated radiomics model to distinguish GBM from SBM. The integrated radiomics model achieved a noteworthy result, with AUCs of 0.98 (95% CI: 0.83–0.99) and 0.93 (95% CI: 0.81–0.97) in the training and validation sets, respectively, indicating the higher predictive performance of our study than the former ones.
Nevertheless, there are several limitations in this study. The total sample size was relatively small for the radiomics study, and a larger data set is needed to assess and adjust our model. Moreover, the validation set size is small, leading to the relatively low sensitivity of the integrated radiomics model. Finally, the study is a retrospective single-center study, and larger data sets from multicenter registration using different MR protocols should be interrogated to improve the radiomics model’s stability further. If validated correctly and properly, this integrated model is expected to differentiate GBM from SBM before surgery, which can improve the diagnostic accuracy and provide help for the treatment plan and prognostic evaluation. Although the low-dimensional effective features screened by PLS can get a satisfactory performance, it ignores those principal components with large numbers but small contributions in feature screening, which may lead to a low cumulative contribution rate of the final screened effective features. Therefore, how to mine new information from these principal components with a large number but small contribution can be the future research direction.
In conclusion, our results confirm that the integrated radiomics model incorporating functional (DWI) and metabolic (18F-FDG PET) sequences can achieve promising diagnostic efficiency for distinguishing between GBM and SBM with robustness. A large-scale multicenter study should be carried out to further confirm the preliminary results, thus making this noninvasive, simple and effective method applicable for routine clinical practice.
The raw data supporting the conclusions of this article will be made available by the authors, without undue reservation.
The studies involving human participants were reviewed and approved by The First Affiliated Hospital of Chongqing Medical University. The patients/participants provided their written informed consent to participate in this study. Written informed consent was obtained from the individual(s) for the publication of any potentially identifiable images or data included in this article.
Manuscript writing and statistical analysis: LZ, RY, and JG. Manuscript editing, supervised image segmentation, and statistical analysis: RY. Image postprocessing, data provision, and informatics software support: DT and LZ. Supervised image postprocessing: JG, DT, and XY. Pathologic analysis: LZ, MW, YL, and SC. Clinical/oncologic database curation and oversight: YL, SC, and LZ. Database construction and data provision: XX, RL, SC, and JW. Database construction, clinical oversight, conceptual feedback, and project integrity: JG, DT, TY, YL, and SC. All authors contributed to the article and approved the submitted version.
This work was supported by the National Natural Science Foundation of China (31800823), the Medicine Scientific key Research Project of Chongqing Municipal Health and Family Planning Commission (2016ZDXM002), the Chongqing basic research and frontier exploration project of Chongqing Science & Technology Commission (cstc2018jcyjAX0584), the National Key Research & Development Plan of Ministry of Science and Technology of the People’s Republic of China (2016YFC0107109). We thank the funders supporting the research.
The authors declare that the research was conducted in the absence of any commercial or financial relationships that could be construed as a potential conflict of interest.
All claims expressed in this article are solely those of the authors and do not necessarily represent those of their affiliated organizations, or those of the publisher, the editors and the reviewers. Any product that may be evaluated in this article, or claim that may be made by its manufacturer, is not guaranteed or endorsed by the publisher.
We thank other radiologists for helping the team with visualization. We also appreciate those patients who provided their images for our study. During the study process, our institution and radiology department provided a lot of support and convenience, to which we also express our deep gratitude.
1. Ohgaki H, Kleihues P. Epidemiology and Etiology of Gliomas. Acta Neuropathol (2005) 109:93–108. doi: 10.1007/s00401-005-0991-y
2. Platta CS, Khuntia D, Mehta MP, Suh JH. Current Treatment Strategies for Brain Metastasis and Complications From Therapeutic Techniques: A Review of Current Literature. Am J Clin Oncol (2010) 33:398–407. doi: 10.1097/COC.0b013e318194f744
3. Cha S, Lupo JM, Chen MH, Lamborn KR, McDermott MW, Berger MS, et al. Differentiation of Glioblastoma Multiforme and Single Brain Metastasis by Peak Height and Percentage of Signal Intensity Recovery Derived From Dynamic Susceptibility-Weighted Contrast-Enhanced Perfusion MR Imaging. AJNR Am J Neuroradiol (2007) 28:1078–84. doi: 10.3174/ajnr.A0484
4. Giese A, Westphal M. Treatment of Malignant Glioma: A Problem Beyond the Margins of Resection. J Cancer Res Clin Oncol (2001) 127:217–25. doi: 10.1007/s004320000188
5. O’Neill BP, Buckner JC, Coffey RJ, Dinapoli RP, Shaw EG. Brain Metastatic Lesions. Mayo Clin Proc (1994) 69:1062–8. doi: 10.1016/S0025-6196(12)61374-3
6. Lin X, DeAngelis LM. Treatment of Brain Metastases. J Clin Oncol (2015) 33:3475. doi: 10.1200/JCO.2015.60.9503
7. Weller M, van den Bent M, Tonn JC, Stupp R, Preusser M, Cohen-Jonathan-Moyal E, et al. European Association for Neuro-Oncology (EANO) Guideline on the Diagnosis and Treatment of Adult Astrocytic and Oligodendroglial Gliomas. Lancet Oncol (2017) 18:e315–29. doi: 10.1016/S1470-2045(17)30194-8
8. Yang G, Jones TL, Howe FA, Barrick TR. Morphometric Model for Discrimination Between Glioblastoma Multiforme and Solitary Metastasis Using Three-Dimensional Shape Analysis. Magn Reson Med (2016) 75:2505–16. doi: 10.1002/mrm.25845
9. Blanchet L, Krooshof PW, Postma GJ, Idema AJ, Goraj B, Heerschap A, et al. Discrimination Between Metastasis and Glioblastoma Multiforme Based on Morphometric Analysis of MR Images. AJNR Am J Neuroradiol (2011) 32:67–73. doi: 10.3174/ajnr.A2269
10. Bernstein M, Parrent AG. Complications of CT-Guided Stereotactic Biopsy of Intra-Axial Brain Lesions. J Neurosurg (1994) 81:165–8. doi: 10.3171/jns.1994.81.2.0165
11. Lambin P, Rios-Velazquez E, Leijenaar R, Carvalho S, van Stiphout RGPM, Granton P, et al. Radiomics: Extracting More Information From Medical Images Using Advanced Feature Analysis. Eur J Cancer (2012) 48(4):441–6. doi: 10.1016/j.ejca.2011.11.036
12. Qian Z, Li Y, Wang Y, Li L, Li R, Wang K, et al. Differentiation of Glioblastoma From Solitary Brain Metastases Using Radiomic Machine-Learning Classifiers. Cancer Lett (2019) 451:128–35. doi: 10.1016/j.canlet.2019.02.054
13. Dong F, Li Q, Jiang B, Zhu X, Zeng Q, Huang P, et al. Differentiation of Supratentorial Single Brain Metastasis and Glioblastoma by Using Peri-Enhancing Oedema Region-Derived Radiomic Features and Multiple Classifiers. Eur Radiol (2020) 30:3015–22. doi: 10.1007/s00330-019-06460-w
14. Moran A, Idan B, Bashat Dafna B. Differentiation Between Glioblastoma, Brain Metastasis and Subtypes Using Radiomics Analysis. J Magn Reson Imaging (2019) 50:519–28. doi: 10.1002/jmri.26643
15. Su C-Q, Chen X-T, Duan S-F, Zhang JX, You YP, Lu SS, et al. A Radiomics-Based Model to Differentiate Glioblastoma From Solitary Brain Metastases. Clin Radiol (2021) 76:629.e11–.e18. doi: 10.1016/j.crad.2021.04.012
16. Byrnes TJ, Barrick TR, Bell BA, Clark CA. Diffusion Tensor Imaging Discriminates Between Glioblastoma and Cerebral Metastases In Vivo. NMR BioMed (2011) 24:54–60. doi: 10.1002/nbm.1555
17. Chiang IC, Kuo YT, Lu CY, Yeung K-W, Lin W-C, Sheu F-O, et al. Distinction Between High-Grade Gliomas and Solitary Metastases Using Peritumoral 3-T Magnetic Resonance Spectroscopy, Diffusion, and Perfusion Imaging. Neuroradiology (2004) 46:619–27. doi: 10.1007/s00234-004-1246-7
18. Pavlisa G, Rados M, Pavlisa G, Pavic L, Potocki K, Mayer D. The Differences of Water Diffusion Between Brain Tissue Infiltrated by Tumor and Peritumoral Vasogenic Edema. Clin Imaging (2009) 33:96–101. doi: 10.1016/j.clinimag.2008.06.035
19. Kono K, Inoue Y, Nakayama K, Shakudo M, Morino M, Ohata K, et al. The Role of Diffusion-Weighted Imaging in Patients With Brain Tumors. AJNR (2001) 22:1081–8.
20. Tsougos I, Svolos P, Kousi E, Fountas K, Theodorou K, Fezoulidis I, et al. Differentiation of Glioblastoma Multiforme From Metastatic Brain Tumor Using Proton Magnetic Resonance Spectroscopy, Diffusion and Perfusion Metrics at 3 T. Cancer Imaging (2012) 12:423–36. doi: 10.1102/1470-7330.2012.0038
21. Min ZG, Niu C, Rana N, Ji HM, Zhang M. Differentiation of Pure Vasogenic Edema and Tumorinfiltrated Edema in Patients With Peritumoral Edema by Analyzing the Relationship of Axial and Radial Diffusivities on 3. 0T MRI Clin Neurol Neurosurg (2013) 115:1366–70. doi: 10.1016/j.clineuro.2012.12.031
22. Pauleit D, Floeth F, Hamacher K, Riemenschneider MJ, Reifenberger G, Muller HW, et al. O-(2-[18F]Fluoroethyl)-L-Tyrosine PET Combined With MRI Improves the Diagnostic Assessment of Cerebral Gliomas. Brain (2005) 128:678–87. doi: 10.1093/brain/awh399
23. Jansen NL, Suchorska B, Wenter V, Eigenbrod S, Schmid-Tannwald C, Zwergal A, et al. Dynamic 18f-FET PET in Newly Diagnosed Astrocytic Low-Grade Glioma Identifies High-Risk Patients. J Nucl Med (2014) 55:198–203. doi: 10.2967/jnumed.113.122333
24. Albert NL, Weller M, Suchorska B, Galldiks N, Soffietti R, Kim MM, et al. Response Assessment in Neuro-Oncology Working Group and European Association for Neuro-Oncology Recommendations for the Clinical Use of PET Imaging in Gliomas. Neuro-Oncology (2016) 18:1199–208. doi: 10.1093/neuonc/now058
25. Puttick S, Bell C, Dowson N, Rose S, Fay MPET. MRI, and Simultaneous PET/MRI in the Development of Diagnostic and Therapeutic Strategies for Glioma. Drug Discov Today (2015) 20(3):306–17. doi: 10.1016/j.drudis.2014.10.016
26. Wang K, Qiao Z, Zhao X, Li X, Wang X, Wu T, et al. Individualized Discrimination of Tumor Recurrence From Radiation Necrosis in Glioma Patients Using an Integrated Radiomics-Based Model. Eur J Nucl Med Mol Imaging (2020) 47(6):1400–11. doi: 10.1007/s00259-019-04604-0
27. Avants BB, Tustison NJ, Song G, Cook PA, Klein A, Gee JC. A Reproducible Evaluation of ANTs Similarity Metric Performance in Brain Image Registration. Neuroimage (2011) 54:2033–44. doi: 10.1016/j.neuroimage.2010.09.025
28. Shinohara RT, Sweeney EM, Goldsmith J, Shiee N, Mateen FJ, Calabresi PA, et al. Statistical Normalization Techniques for Magnetic Resonance Imaging. NeuroImage Clin (2014) 6:9–19. doi: 10.1016/j.nicl.2014.08.008
29. Lee EJ, terBrugge K, Mikulis D, Choi DS, Bae JM, Lee SK, et al. Diagnostic Value of Peritumoral Minimum Apparent Diffusion Coefficient for Differentiation of Glioblastoma Multiforme From Solitary Metastatic Lesions. AJR Am J Roentgenol (2011) 196:71–6. doi: 10.2214/AJR.10.4752
30. Fedorov A, Beichel R, Kalpathy-Cramer J, Finet J, Fillion-Robin JC, Pujol S, et al. 3d Slicer as an Image Computing Platform for the Quantitative Imaging Network. Magn Reson Imaging (2012) 30:1323–41. doi: 10.1016/j.mri.2012.05.001
31. Kamson David O, Sandeep M, Buth A, Muzik O, Kupsky William J, Robinette Natasha L, et al. Differentiation of Glioblastomas From Metastatic Brain Tumors by Tryptophan Uptake and Kinetic Analysis: A Positron Emission Tomographic Study With Magnetic Resonance Imaging Comparison. Mol Imaging (2013) 12(5):327–37. doi: 10.2310/7290.2013.00048
32. Sauerbrei W, Royston P, Binder H. Selection of Important Variables and Determination of Functional Form for Continuous Predictors in Multivariable Model Building. Stat Med (2007) 26:5512–28. doi: 10.1002/sim.3148
33. Tibshirani R. Regression Shrinkage and Selection via the Lasso. J Roy Stat Soc B Met (1996) 58(1):267–88. doi: 10.1111/j.2517-6161.1996.tb02080.x
34. Wu TT, Chen YF, Hastie T, Sobel E, Lange K. Genome-Wide Association Analysis by Lasso Penalized Logistic Regression. Bioinf (Oxf Engl) (2009) 25(6):714–21. doi: 10.1093/bioinformatics/btp041
Keywords: 18F-FDG PET, diffusion-weighted imaging (DWI), apparent diffusion coefficient (ADC), glioblastoma, solitary brain metastases (SBM)
Citation: Zhang L, Yao R, Gao J, Tan D, Yang X, Wen M, Wang J, Xie X, Liao R, Tang Y, Chen S and Li Y (2021) An Integrated Radiomics Model Incorporating Diffusion-Weighted Imaging and 18F-FDG PET Imaging Improves the Performance of Differentiating Glioblastoma From Solitary Brain Metastases. Front. Oncol. 11:732704. doi: 10.3389/fonc.2021.732704
Received: 29 June 2021; Accepted: 06 August 2021;
Published: 30 August 2021.
Edited by:
Manoj Kumar, National Institute of Mental Health and Neurosciences (NIMHANS), IndiaReviewed by:
Shuai Ren, Affiliated Hospital of Nanjing University of Chinese Medicine, ChinaCopyright © 2021 Zhang, Yao, Gao, Tan, Yang, Wen, Wang, Xie, Liao, Tang, Chen and Li. This is an open-access article distributed under the terms of the Creative Commons Attribution License (CC BY). The use, distribution or reproduction in other forums is permitted, provided the original author(s) and the copyright owner(s) are credited and that the original publication in this journal is cited, in accordance with accepted academic practice. No use, distribution or reproduction is permitted which does not comply with these terms.
*Correspondence: Yongmei Li, lymzhang70@aliyun.com; Shanxiong Chen, csxpml@163.com; Yao Tang, ty15320328153@163.com
†These authors have contributed equally to this work and share first authorship
Disclaimer: All claims expressed in this article are solely those of the authors and do not necessarily represent those of their affiliated organizations, or those of the publisher, the editors and the reviewers. Any product that may be evaluated in this article or claim that may be made by its manufacturer is not guaranteed or endorsed by the publisher.
Research integrity at Frontiers
Learn more about the work of our research integrity team to safeguard the quality of each article we publish.