 John M. Astle*Huiya Huang
- Department of Pathology, Medical College of Wisconsin, Milwaukee, WI, United States
Recent advances in global gene sequencing technologies and the effect they have had on disease diagnosis, therapy, and research have fueled interest in technologies capable of more broadly profiling not only genes but proteins, metabolites, cells, and almost any other component of biological systems. Mass cytometry is one such technology, which enables simultaneous characterization of over 40 parameters per cell, significantly more than can be achieved by even the most state-of-the-art flow cytometers. This mini-review will focus on how mass cytometry has been utilized to help advance the field of neoplastic hematology. Common themes among published studies include better defining lineage sub-populations, improved characterization of tumor microenvironments, and profiling intracellular signaling across multiple pathways simultaneously in various cell types. Reviewed studies highlight potential applications for disease diagnosis, prognostication, response to therapy, measurable residual disease analysis, and identifying new therapies.
Introduction and Overview of Mass Cytometry
Mass cytometry, also known as cytometry by time‐of‐flight (CyTOF), combines many aspects of flow cytometry with key advantages of mass spectrometry to enable simultaneous detection of over 40 parameters per cell for up to millions of cells (1, 2). Rather than using antibodies labeled with fluorophores for detection as in flow cytometry, mass cytometry uses antibodies labeled with heavy metals. Detecting the presence and abundance of heavy metals by mass spectrometry minimizes the amount of signal that “spills over” from one parameter to another, significantly decreasing the problem of spectral overlap that plagues flow cytometry (see Figure 1). The large number of parameters that can now be reasonably detected on limited specimens enables more thorough characterization, providing a more systemic view of networked processes while at the same time higher resolution of cellular sub-populations and individual cells.
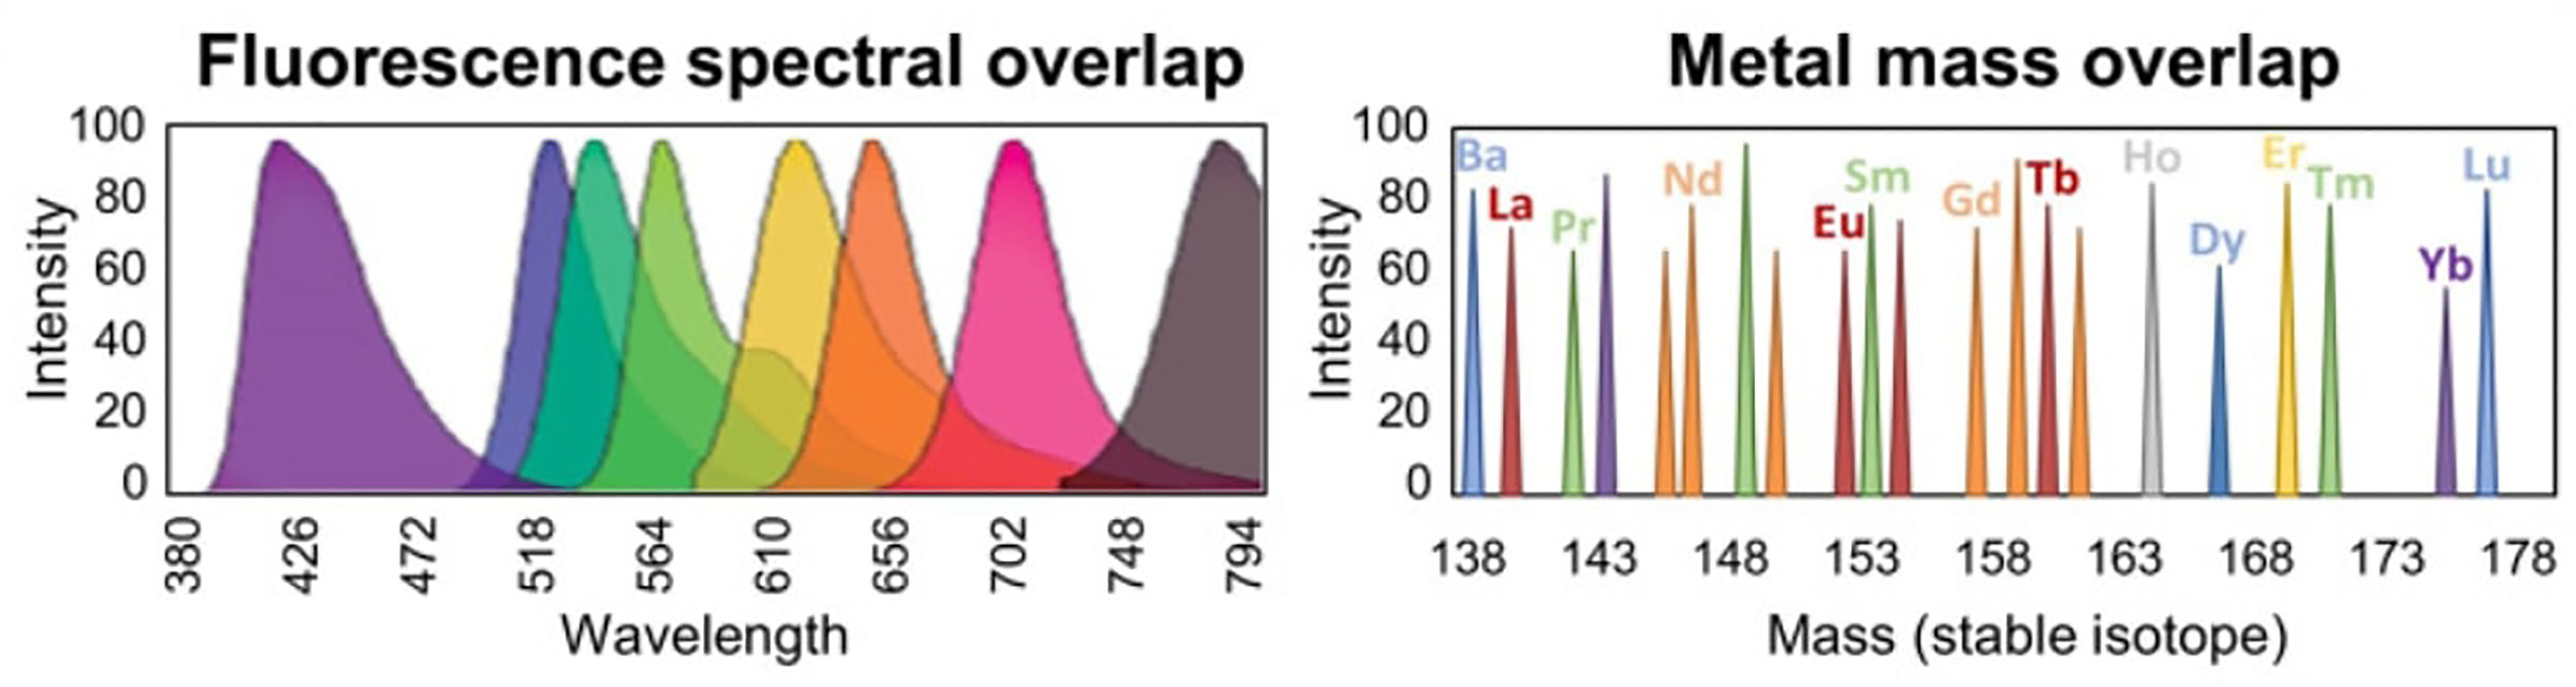
Figure 1 Overcoming spectral overlap via mass cytometry. Significant spectral overlap complicates measurement of specific parameters when detecting emitted light from fluorophores in flow cytometry (left). Contamination of adjacent parameters is minimized via detection of heavy metal isotopes by mass cytometry (right). Figure adapted from (3).
CyTOF was originally developed by Scott Tanner and colleagues at the University of Toronto (1). Simplified, the CyTOF technique begins by incubating fixed cell suspensions and antibodies labeled with heavy metals that are not present in normal biological systems. Rather than individual cells being exposed to a laser and the emitted light detected as in flow cytometry, the cells are nebulized into liquid droplets then vaporized, ionized, and sent through a time-of-flight mass spectrometer, which can determine the identity of each heavy metal based on how long it takes to reach a sensor.
This new technology first popped onto many people’s radar after Gary Nolan’s group at Stanford (in collaboration with Scott Tanner and others) published a seminal article showcasing the power of this novel technology (4). They stimulated cell populations with various stimuli and simultaneously measured 34 parameters per cell within a population of hematopoietic cells to show differential responses of individual cells and cell sub-populations to these stimuli. By utilizing SPADE analysis software, they were able to visualize an overview of the different cell types and differential expression of various proteins (Figure 2). Since that time, there have been continual improvements in technology and reagents, as well as software. Commonly used analysis software include SPADE (5–7), viSNE (8), Citrus (9, 10), and PhenoGraph (11).
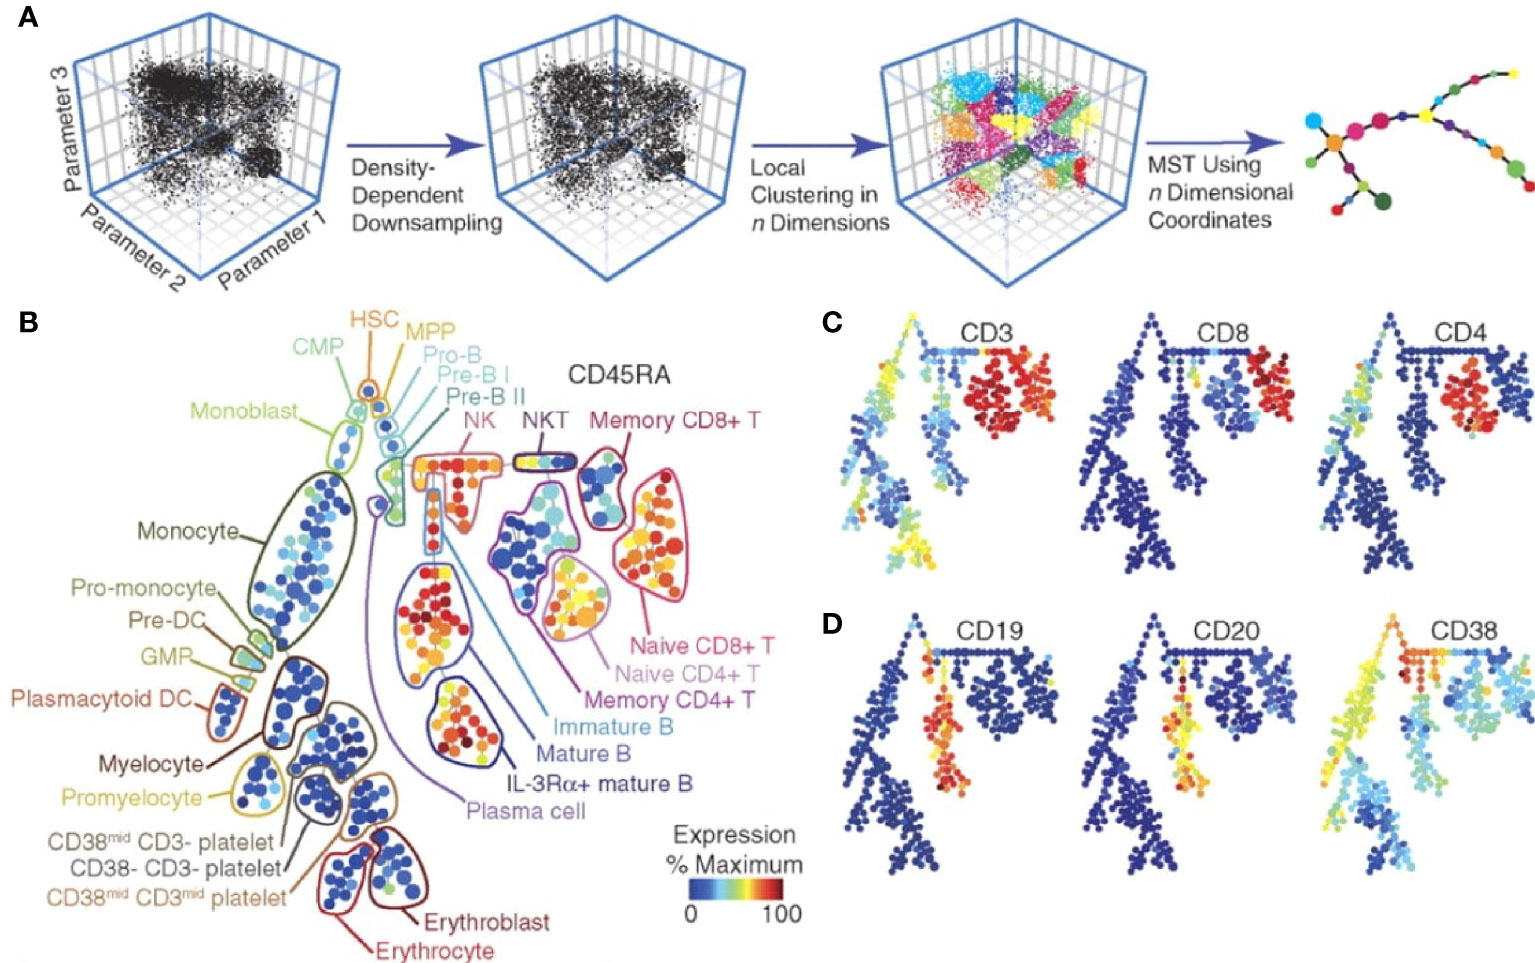
Figure 2 SPADE analysis of multidimensional data. Overview of simplifying multi-dimensional data into a two-dimensional plot by SPADE analysis (A). A tree plot constructed by SPADE software utilizing 13 cell surface markers identified hematopoietic cell populations (B). Expression levels of specific markers can be visualized for each cellular sub-population (C, D). Figure adapted from Bendall et al. (4), with permission.
This new technology has been utilized to study several different aspects of biology and disease, with many studies thus far emphasizing the characterization of novel subpopulations of various immune cell subsets, characterization of tumor microenvironments, and profiling intracellular signaling across multiple cell subpopulations. Various disease processes have been studied, including COVID-19 (12), Alzheimer disease (13), tuberculosis (14), rheumatoid arthritis (15), non-alcoholic steatohepatitis and hepatocellular carcinoma (16), just to name a few. Potential applications of CyTOF in clinical medicine have been reviewed (17). This mini-review will focus on studies characterizing hematologic malignancies and some of their findings relevant to disease diagnosis, prognostication, response to therapy, measurable residual disease (MRD) analysis, and potential new therapies.
Research Highlights in Hematologic Malignancies
Diagnosis
CyTOF has enabled profiling of cellular signaling states, tumor microenvironments, and immune responses to several diseases in a more global fashion than has been done with more traditional approaches, facilitating identification of disease biomarkers. These biomarkers have potential to aid in the diagnosis of various diseases. For example, Han et al. (18) identified disease-specific profiles of intracellular signaling activation that could aid in diagnosis of acute myeloid leukemia. Bailur et al. (19) profiled many markers simultaneously to show that leukemic cells created via CRISPR-induced MLL rearrangement were more similar to acute myeloid leukemia (AML) than acute lymphoblastic leukemia (ALL). A similar approach may aid in the distinction between AML and ALL in the subset of cases where this is difficult using currently utilized markers and flow cytometric approaches. Behbehani et al. (20) evaluated cell surface markers in patients with myelodysplastic syndrome (MDS) compared to healthy donors and showed aberrancies in 27 of 31 markers in patients with MDS, the presence of which may be helpful for diagnosing MDS. Van Leeuwen-Kerkhoff et al. (21) showed specific subsets of monocytes are decreased in MDS bone marrows and that these monocytes mediate expansion of a specific T-cell subset, suggesting the identification and quantitation of specific cell subsets may also aid in the diagnosis of MDS. Yang et al. (22) studied tumor microenvironments in follicular lymphoma (FL) and discovered at least 12 subsets of intratumoral CD4(+) T cells, three of which were unique to FL specimens. Subsequent study of FL identified a lack of plasmablasts in FL specimens compared to controls (23). Roussel et al. (24) compared tumor microenvironments of FL, diffuse large B-cell lymphoma (DLBCL) and classic Hodgkin lymphoma (cHL) and identified immune profiles specific to each lymphoma type, including the presence and abundance of monocyte subsets and T-cell subsets. These studies lend evidence to the idea that detecting the presence, absence, or relative abundance of non-neoplastic cell types within a tumor microenvironment can be useful for disease diagnosis.
Prognostication
CyTOF has also facilitated identification of biomarkers potentially helpful for disease prognostication. Levine et al. (11) published PhenoGraph software for analyzing CyTOF data, which enabled better identification and characterization of leukemic hematopoietic stem and progenitor cells (HSPCs). They showed that cell surface molecules indicating an HSPC immunophenotype are decoupled from intracellular signaling signatures of HSPCs in a significant subset of AML patient samples, and that the number of cells showing intracellular signaling markers of HSPCs correlates more closely with prognosis than when cell surface molecules are used to identify HSPCs. Around the same time Behbehani et al. (25) showed that core binding factor AMLs, which generally have a good prognosis, have an increased fraction of leukemic HSPCs in S-phase of the cell cycle while the relatively poor prognostic FLT3-ITD AMLs have a decreased S-phase fraction. Chretien et al. (26) showed that a “hypomature” NK cell profile or low expression of NKp30 is associated with poor survival in AML patients, while high expression of NKp30 without a hypomature profile is associated with longer survival. Good et al. (27) evaluated 60 primary diagnostic B-lymphoblastic leukemia (BLL) samples to identify 6 features able to predict patient relapse at diagnosis, improving currently established risk stratification methods. Bailur et al. (28) studied tumor microenvironments and identified immune profiles that correlated with disease risk in BLL. Van Leeuwen-Kerkhoff et al. (29) showed thrombomodulin expression on monocytes of MDS patients is associated with lower risk and better leukemia-free survival. Gullaksen et al. (30) profiled intracellular signal transduction in chronic myeloid leukemia (CML) and clear differences were noted between CML cells and healthy donor cells. Changes in signaling were detected within three hours of nilotinib therapy, and profiles identified after seven days of therapy correlated with BCR-ABL1 burden at 3 and 6 months, suggesting early signal transduction profiles may be useful for prognostication. Yang et al. (22) showed that naïve T cells within the tumor microenvironment of FL were associated with improved survival, while specific subsets of PD-1(+) T cells and loss of the costimulatory receptor CD27 on intratumoral T cells were associated with poor survival. Yang et al. (31) then showed that T-cell immunoglobulin and ITIM domain (TIGIT) is highly expressed on exhausted intratumoral T cells of FL and is associated with inferior survival. These studies show that the types of biomarkers identifiable by CyTOF for disease diagnosis such as intracellular signaling profiles and cellular profiles within tumor microenvironments may be helpful for disease prognostication.
Response to Therapy and Vaccination
CyTOF has been used to better characterize responses to various therapies, leading to better understanding of mechanisms of action as well as mechanisms of resistance to therapy. Saenz et al. (32) used CyTOF to help evaluate the response of post-myeloproliferative neoplasm secondary AML (sAML) cells to different therapies in a xenograft model, facilitating a broad and detailed characterization of drug responses, suggesting BET protein proteolysis-targeting chimera may be more effective than bromodomain inhibitor in treating this neoplasm. This group also showed decreased expression of Bcl-xL, CDK4/6, c-MYC, IL-7R, p-STAT5, and PIM1, and increased expression of BIM, HEXIM1, and p21 in BET inhibitor treated AML cells from sAML. Synergistic activity of BET inhibitor with the JAK inhibitor ruxolitinib is seen in sAML cells, and there is also synergistic activity of BET inhibitor and HSP90 inhibitor against ruxolitinib-resistant sAML cells. Zeng et al. (33) evaluated 24 primary AML samples to perform detailed characterization of mTOR inhibition in AML cells, and results pointed to cell signaling pathways dampening drug response. Edwards et al. (28) characterized CSF1R signaling to show anti-leukemic activity of CSF1R inhibitors occurs through inhibiting paracrine signaling from support cells. In 2020 Han et al. (34) showed that cobimetinib antagonized pERK and pS6 signaling, and was associated with increased BCL2 expression in leukemia HSPCs in venetoclax-sensitive AML specimens. Borthakur et al. (35) published findings of a phase-I study of combined sorafenib, plerixafor, and G-CSF for AML, where CyTOF was used to identify resistant sub-clones and characterized signaling within these cells to show persistent Akt and/or ERK signaling. Rorby et al. (36) investigated the mechanism of synergistic activity of midostaurin in combination with daunorubicin and cytarabine, which has been shown to increase survival in FLT3-mutated AML patients. They showed that cytarabine appeared to antagonize midostaurin’s effect on protein phosphorylation and increased surface expression of FLT3. Deng et al. (37) helped identify VEGFR2 signaling as the mechanism by which Apatinib exerts its anti-leukemic effect in BLL. Bandyopadhyay et al. (38) showed that avasimibe, an inhibitor of cholesterol esterification, synergistically suppressed CML cell proliferation, and led to downregulation of the MAPK signaling pathway, which likely sensitized CML cells to imatinib. Baughn et al. (39) identified loss of CD56 and CD66a and a signature of activation are associated with proteasome inhibitor resistance in a myeloma cell line suggesting these have potential as markers of resistance to proteasome inhibitor therapy. Adams et al. (40) characterized the myeloma tumor microenvironment and showed that daratumumab-treated patients have increased cytotoxic T cells and reduced immunosuppressive cell populations, consistent with immune modulation as a novel mechanism of action for daratumumab. Teh et al. (41) characterized regulators of cell death, mitosis, cell signaling, and cancer-related pathways in myeloma cells treated with dexamethasone or bortezomib to identify increased CREB and MCL-1 in treatment-resistant myeloma cells. Visram et al. (42) evaluated bone marrow from 13 newly diagnosed, 11 relapsed pre-daratumumab, and 13 triple-refractory myeloma patients and found that patients who are resistant to three lines of therapy have a distinct immune tumor microenvironment including decreased CD4(+) T cells and naïve T cells compared to newly diagnosed and relapsed but pre-daratumumab treated patients. This finding suggests that immune microenvironment signatures may help predict response to therapy. Finally, Alimam et al. (43) monitored immune responses to influenza A vaccine in 7 polycythemia vera (PV), 8 essential thrombocythemia (ET), and 4 myelofibrosis (MF) patients compared to 6 healthy donors, and evidence of impaired B- and T-memory cell responses in patients with myeloproliferative neoplasms was identified. The ability of CyTOF to broadly characterize numerous antigens and cells simultaneously greatly facilitates evaluation of responses to various therapies and even vaccinations. Several of these studies also highlight the ability of CyTOF data to elucidate the mechanism of action of drugs, and to identify potential predictors of response or resistance to therapy.
MRD Analysis
MRD analysis is typically performed using one or a combination of two distinct approaches. The first approach is to identify populations of cells that are immunophenotypically similar to the immunophenotype at diagnosis. This is the easier of the two approaches in many respects, but falls short when tumors modulate their immunophenotype, which some neoplasms do quite readily. The second approach is to identify immunophenotypes that are different from the immunophenotype of a normal cell counterpart to the tumor cell. For example, a “different-from-normal” approach to MRD analysis for AML would look for populations of aberrant HSPCs that display a different immunophenotype than normal HSPCs. A study by Ferrell et al. (44) highlighted the power of CyTOF for characterizing how versatile AML cells can be at modulating their immunophenotype. They characterized 46 samples from 5 AML patients before, during, and immediately after induction chemotherapy to show how the AML population and subpopulations modulated their immunophenotypes over time. Studies such as this not only characterize the degree of versatility with which cancers can modulate their immunophenotype, but may help identify new cancer-specific immunophenotypes and their frequency in studied populations. Unfortunately, the rate at which cells flow through CyTOF machines is roughly an order of magnitude slower than flow cytometers frequently used in clinical laboratories, limiting its utility for clinical use. However, CyTOF can facilitate the discovery of disease-specific immunophenotypes including specific combinations of immunophenotypes much more readily than other approaches due to the sheer number of antigens that can be monitored from a given, often limited, specimen. Despite the limited number of specimens that could be run in a day, a mass cytometer may be warranted for MRD detection in patients where MRD analysis has been hindered by the use of new antibody therapeutics. For example, antibodies targeting B-cell antigens are being used to treat B-cell lineage leukemias and lymphomas, and the antigens that these antibodies target (which are usually the same antigens used to identify the presence of these cell populations by flow cytometry) are often rendered useless as markers for MRD detection. The ability to identify cancer cell populations using combinations of other antigens by CyTOF could be extremely useful. Even if CyTOF machines are not used in clinical laboratories in the near future, software developed for CyTOF may prove useful for MRD detection. Amir et al. (8) showed that viSNE software can be used to visually distinguish leukemia from healthy bone marrow samples, and the potential of viSNE for identification of MRD was shown. Similarly, Bandyopadhyay et al. (45) utilized CyTOF to identify a subpopulation of cells in secondary AML that was not readily identified by manual gating approaches of two-dimensional plots, highlighting the power of software facilitating evaluation of multiple dimensions at once. As technological improvements increase acquisition rates, costs decrease, and data validating the value of high-parameter approaches to MRD analysis are published, clinical laboratories may in the not-too-distant future begin using CyTOF for MRD analysis.
Potential New Therapies
New discoveries identified via CyTOF analysis can point to potential new therapies, and potential new therapies can be tested in model cells and organisms to characterize their effects and side-effects across multiple signaling pathways in multiple cell types at once. Han et al. (18) identified distinct patterns of signaling activation within leukemia stem cells across AML samples and between AML and control samples. mTOR signaling was identified as a possible therapeutic target as mTOR regulated proteins 4EBP1 and S6 were found to be phosphorylated in FLT3-ITD progenitor cells but not in controls. This study highlights the importance of using high dimensional cytometry to monitor multiple signaling pathways simultaneously to identify possible therapeutic targets. Zeng et al. (33), after identifying cell signaling pathways that dampen drug response during mTOR inhibitor administration, showed that targeting these pathways along with mTOR inhibition led to increased efficacy. Sarno et al. (46) set out to study why high expression of CRLF2 is associated with poor prognosis in patients with B-lymphoblastic leukemia/lymphoma, and identified coordinated signaling involving JAK/STAT, PI3K and CREB pathways downstream of CRLF2. The authors showed in primary leukemia cells that SRC/ABL inhibition was more effective at inhibiting the CRLF2-driven network than JAK or PI3K inhibition. Fisher et al. (47) identified increased activity of JAK-STAT, MAPK, PI3K and NFkB signaling in myelofibrosis (MF) and sAML cells. They identified constitutive and hypersensitive NFkB signaling in MF and sAML HSPCs, and found that inhibition of NFkB in CD34(+) HSPCs from MF patients suppressed myeloid colony formation, suggesting NFkB inhibition as a potential therapeutic approach in MF and sAML. They then monitored cytokine production in MF patient blood cells by CyTOF, and monocytes were found to overexpress many cytokines induced by thrombopoietin, TLR ligands, and tumor necrosis factor (48). All of these cytokines could be suppressed by inhibiting NFkB and/or MAPK signaling, suggesting this as a novel pharmacotherapy in MF. Teh et al. (41), after identifying increased CREB and MCL-1 in treatment-resistant myeloma cells, showed that combining an MCL-1 inhibitor to dexamethasone showed synergistic activity in killing primary myeloma cells from patients. These are just a few examples of how high-parameter profiling via CyTOF can help identify new potential therapies for diseases.
Discussion
Mass cytometry has significantly increased our capacity to profile entire populations of cells at the individual cellular level. This can be extremely useful, particularly when the total number of cells for evaluation is limited, such as in clinical biopsy or fine needle aspirate specimens. However, it is important to recognize that CyTOF is not completely equivalent to flow cytometry with more measurable parameters. Slower acquisition rate, more complicated data analysis, and need for surrogates of forward and side scatter are a few of the caveats to the promise of mass cytometry for clinical use.
Review of the current literature has shown that only a few hematopoietic malignancies such as AML and plasma cell myeloma have been investigated via CyTOF in more than a handful of studies. Numerous diseases not mentioned in this mini-review could benefit from more detailed characterization made possible by this new technology. A major strength of CyTOF is in its ability to identify not only individual biomarkers but combinations of markers that together provide more systemic or global signatures of diseases or biological states (similar to gene expression profiling). These signatures may incorporate relative abundance of different cell subsets, expression levels of different proteins, and/or activation states of various cellular signaling pathways. Such expression profiles may be useful for disease diagnosis, prognostication, and predicting response to therapy. While the relatively slow acquisition rate of current CyTOF machines limits their utility for clinical MRD analysis, CyTOF provides a powerful mechanism for identifying disease-specific markers (i.e. leukemia-specific immunophenotypes) that can be used in routine flow cytometric MRD analysis. CyTOF has been particularly useful for characterization of tumor microenvironments. Continued research utilizing CyTOF will undoubtedly promote efforts to move this powerful technology into the clinic.
Author Contributions
HH and JA contributed to the concept development, review of literature and writing of manuscript. All authors contributed to the article and approved the submitted version.
Conflict of Interest
The authors declare that the research was conducted in the absence of any commercial or financial relationships that could be construed as a potential conflict of interest.
Publisher’s Note
All claims expressed in this article are solely those of the authors and do not necessarily represent those of their affiliated organizations, or those of the publisher, the editors and the reviewers. Any product that may be evaluated in this article, or claim that may be made by its manufacturer, is not guaranteed or endorsed by the publisher.
References
1. Bandura DR, Baranov VI, Ornatsky OI, Antonov A, Kinach R, Lou X, et al. Mass Cytometry: Technique for Real Time Single Cell Multitarget Immunoassay Based on Inductively Coupled Plasma Time-of-Flight Mass Spectrometry. Anal Chem (2009) 81(16):6813–22. doi: 10.1021/ac901049w
2. Spitzer MH, Nolan GP. Mass Cytometry: Single Cells, Many Features. Cell Cell Press (2016) 165:780–91. doi: 10.1016/j.cell.2016.04.019
3. Blair TA, Frelinger AL, Michelson AD. Chapter 35 - Flow Cytometry. In: Michelson AD. Platelets (Fourth Edition). Academic Press (2019) 627–51. doi: 10.1016/B978-0-12-813456-6.00035-7
4. Bendall SC, Simonds EF, Qiu P, Amir EAD, Krutzik PO, Finck R, et al. Single-Cell Mass Cytometry of Differential Immune and Drug Responses Across a Human Hematopoietic Continuum. Science (2011) 332(6030):687–96. doi: 10.1126/science.1198704
5. Qiu P, Simonds EF, Bendall SC, Gibbs KD, Bruggner RV, Linderman MD, et al. Extracting a Cellular Hierarchy From High-Dimensional Cytometry Data With SPADE. Nat Biotechnol (2011) 29(10):886–93. doi: 10.1038/nbt.1991
6. Anchang B, Hart TDP, Bendall SC, Qiu P, Bjornson Z, Linderman M, et al. Visualization and Cellular Hierarchy Inference of Single-Cell Data Using SPADE. Nat Protoc (2016) 11(7):1264–79. doi: 10.1038/nprot.2016.066
7. Gautreau G, Pejoski D, Le Grand R, Cosma A, Beignon A-S, Tchitchek N. SPADEVizR: An R Package for Visualization, Analysis and Integration of SPADE Results. Bioinf (Oxford England) (2017) 33(5):779–81. doi: 10.1093/bioinformatics/btw708
8. Amir EAD, Davis KL, Tadmor MD, Simonds EF, Levine JH, Bendall SC, et al. ViSNE Enables Visualization of High Dimensional Single-Cell Data and Reveals Phenotypic Heterogeneity of Leukemia. Nat Biotechnol (2013) 31(6):545–52. doi: 10.1038/nbt.2594
9. Bruggner RV, Bodenmiller B, Dill DL, Tibshirani RJ, Nolan GP. Automated Identification of Stratifying Signatures in Cellular Subpopulations. Proc Natl Acad Sci USA (2014) 111(26):E2770-7. doi: 10.1073/pnas.1408792111
10. Polikowsky HG, Drake KA. Supervised Machine Learning With CITRUS for Single Cell Biomarker Discovery. Methods Mol Biol (Clifton NJ) (2019) 1989:309–32. doi: 10.1007/978-1-4939-9454-0_20
11. Levine JH, Simonds EF, Bendall SC, Davis KL, Amir EAD, Tadmor MD, et al. Data-Driven Phenotypic Dissection of AML Reveals Progenitor-Like Cells That Correlate With Prognosis. Cell (2015) 162(1):184–97. doi: 10.1016/j.cell.2015.05.047
12. Schulte-Schrepping J, Reusch N, Paclik D, Baßler K, Schlickeiser S, Zhang B, et al. Severe COVID-19 Is Marked by a Dysregulated Myeloid Cell Compartment. Cell (2020) 182(6):1419–40.e23. doi: 10.1016/j.cell.2020.08.001
13. Gate D, Saligrama N, Leventhal O, Yang AC, Unger MS, Middeldorp J, et al. Clonally Expanded CD8 T Cells Patrol the Cerebrospinal Fluid in Alzheimer’s Disease. Nature (2020) 577(7790):399–404. doi: 10.1038/s41586-019-1895-7
14. Roy Chowdhury R, Vallania F, Yang Q, Lopez Angel CJ, Darboe F, Penn-Nicholson A, et al. A Multi-Cohort Study of the Immune Factors Associated With M. Tuberculosis Infection Outcomes. Nature (2018) 560(7720):644–8. doi: 10.1038/s41586-018-0439-x
15. Rao DA, Gurish MF, Marshall JL, Slowikowski K, Fonseka CY, Liu Y, et al. Pathologically Expanded Peripheral T Helper Cell Subset Drives B Cells in Rheumatoid Arthritis. Nature (2017) 542(7639):110–4. doi: 10.1038/nature20810
16. Pfister D, Núñez NG, Pinyol R, Govaere O, Pinter M, Szydlowska M, et al. NASH Limits Anti-Tumour Surveillance in Immunotherapy-Treated HCC. Nature (2021) 592(7854):450–56. doi: 10.1038/s41586-021-03362-0
17. Behbehani GK. Applications of Mass Cytometry in Clinical Medicine: The Promise and Perils of Clinical CyTOF. Clinics Lab Med (2017) 37:945–64. W.B. Saunders. doi: 10.1016/j.cll.2017.07.010
18. Han L, Qiu P, Zeng Z, Jorgensen JL, Mak DH, Burks JK, et al. Single-Cell Mass Cytometry Reveals Intracellular Survival/Proliferative Signaling in FLT3-ITD-Mutated AML Stem/Progenitor Cells. Cytometry Part A (2015) 87(4):346–56. doi: 10.1002/cyto.a.22628
19. Bailur JK, McCachren SS, Pendleton K, Vasquez JC, Lim HS, Duffy A, et al. Risk-Associated Alterations in Marrow T Cells in Pediatric Leukemia. JCI Insight (2020) 5(16):e140179. doi: 10.1172/jci.insight.140179
20. Behbehani GK, Finck R, Samusik N, Sridhar K, Fantl WJ, Greenberg PL, et al. Profiling Myelodysplastic Syndromes by Mass Cytometry Demonstrates Abnormal Progenitor Cell Phenotype and Differentiation. Cytometry Part B - Clin Cytometry (2020) 98(2):131–45. doi: 10.1002/cyto.b.21860
21. Van Leeuwen-Kerkhoff N, Westers TM, Poddighe PJ, Povoleri GAM, Timms JA, Kordasti S, et al. Reduced Frequencies and Functional Impairment of Dendritic Cell Subsets and non-Classical Monocytes in Myelodysplastic Syndromes. Haematologica (2021). doi: 10.3324/haematol.2020.268136
22. Yang ZZ, Kim HJ, Villasboas JC, Price-Troska T, Jalali S, Wu H, et al. Mass Cytometry Analysis Reveals That Specific Intratumoral CD4 + T Cell Subsets Correlate With Patient Survival in Follicular Lymphoma. Cell Rep (2019) 26(8):2178–93.e3. doi: 10.1016/j.celrep.2019.01.085
23. Wogsland CE, Greenplate AR, Kolstad A, Myklebust JH, Irish JM, Huse K. Mass Cytometry of Follicular Lymphoma Tumors Reveals Intrinsic Heterogeneity in Proteins Including HLA-DR and a Deficit in Nonmalignant Plasmablast and Germinal Center B-Cell Populations. Cytometry Part B - Clin Cytometry (2017) 92(1):79–87. doi: 10.1002/cyto.b.21498
24. Roussel M, Lhomme F, Roe CE, Bartkowiak T, Gravelle P, Laurent C, et al. Mass Cytometry Defines Distinct Immune Profile in Germinal Center B-Cell Lymphomas. Cancer Immunol Immunother (2020) 69(3):407–20. doi: 10.1007/s00262-019-02464-z
25. Behbehani GK, Samusik N, Bjornson ZB, Fantl WJ, Medeiros BC, Nolan GP. Mass Cytometric Functional Profiling of Acute Myeloid Leukemia Defines Cell-Cycle and Immunophenotypic Properties That Correlate With Known Responses to Therapy. Cancer Discov (2015) 5(9):988–1003. doi: 10.1158/2159-8290.CD-15-0298
26. Chretien AS, Fauriat C, Orlanducci F, Galseran C, Rey J, Borg GB, et al. Natural Killer Defective Maturation is Associated With Adverse Clinical Outcome in Patients With Acute Myeloid Leukemia. Front Immunol (2017) 8(MAY). doi: 10.3389/fimmu.2017.00573
27. Good Z, Sarno J, Jager A, Samusik N, Aghaeepour N, Simonds EF, et al. Single-Cell Developmental Classification of B Cell Precursor Acute Lymphoblastic Leukemia at Diagnosis Reveals Predictors of Relapse. Nat Med (2018) 24(4):474–83. doi: 10.1038/nm.4505
28. Edwards DK, Watanabe-Smith K, Rofelty A, Damnernsawad A, Laderas T, Lamble A, et al. CSF1R Inhibitors Exhibit Antitumor Activity in Acute Myeloid Leukemia by Blocking Paracrine Signals From Support Cells. Blood (2019) 133(6):588–99. doi: 10.1182/blood-2018-03-838946
29. van Leeuwen-Kerkhoff N, Westers TM, Poddighe PJ, de Gruijl TD, Kordasti S, van de Loosdrecht AA. Thrombomodulin-Expressing Monocytes are Associated With Low-Risk Features in Myelodysplastic Syndromes and Dampen Excessive Immune Activation. Haematologica (2020) 105(4):961–70. doi: 10.3324/haematol.2019.219303
30. Gullaksen SE, Skavland J, Gavasso S, Tosevski V, Warzocha K, Dumrese C, et al. Single Cell Immune Profiling by Mass Cytometry of Newly Diagnosed Chronic Phase Chronic Myeloid Leukemia Treated With Nilotinib. Haematologica (2017) 102(8):1361–7. doi: 10.3324/haematol.2017.167080
31. Yang Z-Z, Kim HJ, Wu H, Jalali S, Tang X, Krull JE, et al. TIGIT Expression Is Associated With T-Cell Suppression and Exhaustion and Predicts Clinical Outcome and Anti–PD-1 Response in Follicular Lymphoma. Clin Cancer Res (2020) 26(19):5217–31. doi: 10.1158/1078-0432.CCR-20-0558
32. Saenz DT, Fiskus W, Qian Y, Manshouri T, Rajapakshe K, Raina K, et al. Novel BET Protein Proteolysis-Targeting Chimera Exerts Superior Lethal Activity Than Bromodomain Inhibitor (BETi) Against Post-Myeloproliferative Neoplasm Secondary (s) AML Cells. Leukemia (2017) 31(9):1951–61. doi: 10.1038/leu.2016.393
33. Zeng Z, Konopleva M, Andreeff M. Single-Cell Mass Cytometry of Acute Myeloid Leukemia and Leukemia Stem/Progenitor Cells. In: Methods in Molecular Biology. Humana Press Inc (2017). p. 75–86.
34. Han L, Zhang Q, Dail M, Shi C, Cavazos A, Ruvolo VR, et al. Concomitant Targeting of BCL2 With Venetoclax and MAPK Signaling With Cobimetinib in Acute Myeloid Leukemia Models. Haematologica (2020) 105(3):697–707. doi: 10.3324/haematol.2018.205534
35. Borthakur G, Zeng Z, Cortes JE, Chen HC, Huang X, Konopleva M, et al. Phase 1 Study of Combinatorial Sorafenib, G-CSF, and Plerixafor Treatment in Relapsed/Refractory, FLT3-ITD-Mutated Acute Myelogenous Leukemia Patients. Am J Hematol (2020) 95(11):1296–303. doi: 10.1002/ajh.25943
36. Stone RM, Mandrekar SJ, Sanford BL, Laumann K, Geyer S, Bloomfield CD, et al. Midostaurin Plus Chemotherapy for Acute Myeloid Leukemia With a FLT3 Mutation. New Engl J Med (2017) 377(5):454–64. doi: 10.1056/NEJMoa1614359
37. Deng M, Zha J, Jiang Z, Jia X, Shi Y, Li P, et al. Apatinib Exhibits Anti-Leukemia Activity in Preclinical Models of Acute Lymphoblastic Leukemia. J Trans Med (2018) 16(1):47. doi: 10.1186/s12967-018-1421-y
38. Bandyopadhyay S, Li J, Traer E, Tyner JW, Zhou A, Oh ST, et al. Cholesterol Esterification Inhibition and Imatinib Treatment Synergistically Inhibit Growth of BCR-ABL Mutation-Independent Resistant Chronic Myelogenous Leukemia. PloS One (2017) 12(7):e0179558. doi: 10.1371/journal.pone.0179558
39. Baughn LB, Sachs Z, Noble-Orcutt KE, Mitra A, Van Ness BG, Linden MA. Phenotypic and Functional Characterization of a Bortezomib-Resistant Multiple Myeloma Cell Line by Flow and Mass Cytometry. Leuk Lymphoma (2017) 58(8):1931–40. doi: 10.1080/10428194.2016.1266621
40. Adams HC, Stevenaert F, Krejcik J, van der Borght K, Smets T, Bald J, et al. High-Parameter Mass Cytometry Evaluation of Relapsed/Refractory Multiple Myeloma Patients Treated With Daratumumab Demonstrates Immune Modulation as a Novel Mechanism of Action. Cytometry Part A (2019) 95(3):279–89. doi: 10.1002/cyto.a.23693
41. Teh CE, Gong JN, Segal D, Tan T, Vandenberg CJ, Fedele PL, et al. Deep Profiling of Apoptotic Pathways With Mass Cytometry Identifies a Synergistic Drug Combination for Killing Myeloma Cells. Cell Death Differ (2020) 27(7):2217–33. doi: 10.1038/s41418-020-0498-z
42. Visram A, Dasari S, Anderson E, Kumar S, Kourelis TV. Relapsed Multiple Myeloma Demonstrates Distinct Patterns of Immune Microenvironment and Malignant Cell-Mediated Immunosuppression. Blood Cancer J (2021) 11(3):45. doi: 10.1038/s41408-021-00440-4
43. Alimam S, Ann Timms J, Harrison CN, Dillon R, Mare T, DeLavallade H, et al. Altered Immune Response to the Annual Influenza A Vaccine in Patients With Myeloproliferative Neoplasms. Br J Haematol (2021) 193(1):150–4. doi: 10.1111/bjh.17096
44. Ferrell PB, Diggins KE, Polikowsky HG, Mohan SR, Seegmiller AC, Irish JM. High-Dimensional Analysis of Acute Myeloid Leukemia Reveals Phenotypic Changes in Persistent Cells During Induction Therapy. PloS One (2016) 11(4):e0153207. doi: 10.1371/journal.pone.0153207
45. Bandyopadhyay S, Fowles JS, Yu L, Fisher DAC, Oh ST. Identification of Functionally Primitive and Immunophenotypically Distinct Subpopulations in Secondary Acute Myeloid Leukemia by Mass Cytometry. Cytometry Part B - Clin Cytometry (2019) 96(1):46–56. doi: 10.1002/cyto.b.21743
46. Sarno J, Savino AM, Buracchi C, Palmi C, Pinto S, Bugarin C, et al. SRC/ABL Inhibition Disrupts CRLF2-Driven Signaling to Induce Cell Death in B-Cell Acute Lymphoblastic Leukemia. Oncotarget (2018) 9(33):22872–85. doi: 10.18632/oncotarget.25089
47. Fisher DAC, Malkova O, Engle EK, Miner CA, Fulbright MC, Behbehani GK, et al. Mass Cytometry Analysis Reveals Hyperactive NF Kappa B Signaling in Myelofibrosis and Secondary Acute Myeloid Leukemia. Leukemia (2017) 31(9):1962–74. doi: 10.1038/leu.2016.377
Keywords: mass cytometry, cyTOF, hematologic, oncology, acute myeloid leukemia, myeloma, flow cytometry
Citation: Astle JM and Huang H (2021) Mass Cytometry in Hematologic Malignancies: Research Highlights and Potential Clinical Applications. Front. Oncol. 11:704464. doi: 10.3389/fonc.2021.704464
Received: 03 May 2021; Accepted: 20 October 2021;
Published: 05 November 2021.
Edited by:
Alejandro Gru, University of Virginia Health System, United StatesReviewed by:
Ranganatha R. Somasagara, North Carolina Central University, United StatesDaniele Derudas, Ospedale Oncologico Armando Businco, Italy
Copyright © 2021 Astle and Huang. This is an open-access article distributed under the terms of the Creative Commons Attribution License (CC BY). The use, distribution or reproduction in other forums is permitted, provided the original author(s) and the copyright owner(s) are credited and that the original publication in this journal is cited, in accordance with accepted academic practice. No use, distribution or reproduction is permitted which does not comply with these terms.
*Correspondence: John M. Astle, jastle@mcw.edu