 Yue Hu†
 Zhong Zheng Jia
94% of researchers rate our articles as excellent or good
Learn more about the work of our research integrity team to safeguard the quality of each article we publish.
Find out more
ORIGINAL RESEARCH article
Front. Oncol., 08 December 2020
Sec. Cancer Imaging and Image-directed Interventions
Volume 10 - 2020 | https://doi.org/10.3389/fonc.2020.593102
This article is part of the Research TopicAdvanced Imaging of GliomaView all 11 articles
Objectives: To investigate whether glioma isocitrate dehydrogenase (IDH) 1 mutation and vascular endothelial growth factor (VEGF) expression can be estimated by histogram analysis of dynamic contrast-enhanced magnetic resonance imaging (DCE-MRI).
Methods: Chinese Glioma Genome Atlas (CGGA) database was wined for differential expression of VEGF in gliomas with different IDH genotypes. The VEGF expression and IDH1 genotypes of 56 glioma samples in our hospital were assessed by immunohistochemistry. Preoperative DCE-MRI data of glioma samples were reviewed. Regions of interest (ROIs) covering tumor parenchyma were delineated. Histogram parameters of volume transfer constant (Ktrans) and volume of extravascular extracellular space per unit volume of tissue (Ve) derived from DCE-MRI were obtained. Histogram parameters of Ktrans, Ve and VEGF expression of IDH1 mutant type (IDH1mut) gliomas were compared with the IDH1 wildtype (IDH1wt) gliomas. Receiver operating characteristic (ROC) curve analysis was performed to differentiate IDH1mut from IDH1wt gliomas. The correlation coefficients were determined between histogram parameters of Ktrans, Ve and VEGF expression in gliomas.
Results: In CGGA database, VEGF expression in IDHmut gliomas was lower as compared to wildtype counterpart. The immunohistochemistry of glioma samples in our hospital also confirmed the results. Comparisons demonstrated statistically significant differences in histogram parameters of Ktransand Ve [mean, standard deviation (SD), 50th, 75th, 90th. and 95th percentile] between IDH1mutand IDH1wtgliomas (P < 0.05, respectively). ROC curve analysis revealed that 50th percentile of Ktrans (0.019 min−1) and Ve (0.039) provided the perfect combination of sensitivity and specificity in differentiating gliomas with IDH1mutfrom IDH1wt. Irrespective of IDH1 mutation, histogram parameters of Ktransand Ve were correlated with VEGF expression in gliomas (P < 0.05, respectively).
Conclusions: VEGF expression is significantly lower in IDH1mut gliomas as compared to the wildtype counterpart, and it is non-invasively predictable with histogram analysis of DCE-MRI.
Glioma is the most common primary intracranial tumor. According to the 2016 World Health Organization (WHO) classification criteria, mutation in the gene encoding isocitrate dehydrogenase (IDH) enzyme has been identified in the sub-stratification of glioma (1). Emerging evidence has shown that IDH mutation can convert α-ketoglutarate (α-KG) to 2-hydroxyglutaate (2-HG). Excessive 2-HG can activate prolyl hydroxylase (PHD) and then promote the degradation of hypoxia induced factor (HIF), which can weaken tumor microvascular proliferation (2, 3). Moreover, a study has reported that IDH mutation inhibited PI3K/Akt signaling and reduced the HIF expression level (4). Vascular endothelial growth factor (VEGF) regulated by HIF is one of the angiogenesis-related genes, and its over-expression correlates with poor prognoses in gliomas (5, 6). So, anti-VEGF therapy increases progression-free survival and improves quality of life in patients with glioma (7, 8). On account of these findings, we assumed that the expression level of VEGF was lower in IDH mutant type (IDHmut) gliomas, which fitted with the indolent clinical course of IDHmutgliomas. IDH genotypes and the expression level of VEGF can be detected by surgery or biopsy, but it suffers from several drawbacks such as sampling error, tumor heterogeneities, and risk of surgical complications. Therefore, it is urgent to find a non-invasive technique. The pharmacokinetic parameters derived from dynamic contrast-enhanced magnetic resonance imaging (DCE-MRI) have the ability to predict the microvascular features of glioma in a non-invasive manner (9, 10). Based on the value of DCE-MRI in gliomas and the hypothetical correlation between glioma IDH mutation and VEGF expression, we aimed to investigate whether glioma IDH1 mutation and VEGF expression can be estimated by histogram analysis of DCE-MRI.
The data of VEGF expression and IDH genotypes in 641 unique samples with glioma (286 samples with IDHmut and 355 with IDH wildtype (IDHwt)) were available from the CGGA database. Wilcox test implemented in R language was utilized to analyze the differential expression of VEGF in gliomas with different IDH genotypes.
The inclusion criteria for case selection of this study were as follows: (1) pathologically confirmed gliomas; (2) treatment-naive before MRI examination and surgery; (3) underwent preoperative DCE-MRI. The final study population included 56 patients. All the data were retrospectively reviewed. The clinical cohort consisted of 33 males and 23 females, aged 55 ± 14 years (range, 22–75 years). This retrospective data evaluation was approved by the local institutional review board and written informed consent was obtained from each patient.
MRI was examined on a 3.0-T MR system (GE Healthcare, Milwaukee, WI, USA) with a 16-element head-neck coil. Conventional MRI were T1-weighted imaging, T2-weighted imaging, T2-weighted fluid attenuated inversion recovery (T2-Flair) imaging.
DCE-MRI was done using dynamic scan of a T1-fast field echo (T1-FFE; RF-spoiled gradient echo) sequence and setting the following parameters: repetition time (TR), 5.1 ms; echo time (TE), 1.4 ms; slice thickness, 2.8 mm; matrix, 256 × 210; field of view (FOV), 250 mm × 250 mm; axial scanning. Precontrast images with multiple flip angles 3, 6, 9, 12, and 15° were acquired for the T1 maps. Then, the contrast agent (Ommiscan, GE Healthcare, Oslo, Norway) was administered (0.1 mmol/kg of body weight) through the antecubital vein via a power injector at 4 ml/s, followed by a flush of 15 ml saline. A series of 1,000 images at 50 time points for 20 axial sections were acquired with a temporal resolution approximately of 7 s for each time point. Finally, the postcontrast T1-weighted imaging was conducted in the same axial geometry.
A software module (OmniKinetics, GE Healthcare, China) was applied for post-processing. The volume transfer constant (Ktrans) and volume of extravascular extracellular space per unit volume of tissue (Ve) were obtained based on the extended Tofts and Kermode pharmacokinetic model. The arterial input function was located on the superior sagittal sinus. The postcontrast T1-weighted imaging functioned as reference. When the tumor was without enhancement, the T2-Flair images were registered in the DCE images, and the registration images were taken as reference. Regions of interest (ROIs) covering tumor parenchyma were placed after consensus was reached between two experienced radiologists. The ROIs placed on the reference images can automatically transfer onto the parameters maps, and then histogram parameters of Ktrans and Ve were generated automatically.
All clinical glioma specimens were fixed in 4% formalin and embedded in paraffin. The paraffin blocks were cut into 5-μm sections and stained with hematoxylin and eosin (H&E).
The IDH1 mutation was detected with a mutation-specific antibody. Staining was interpreted as positive when ≥10% of the tumor cells exhibited an intense cytoplasmic staining, whereas staining was deduced as negative when positive cells <10% (11).
Tissue blocks from each specimen were stained for VEGF rabbit anti-human polyclonal antibody (Beijing Bioss Biotechnology Co., Ltd.). All specimens were analyzed with Motic Images Advanced software (version 3.2, Motic China Group Co., Ltd). A semiquantitative grading of VEGF expression was applied. The percentage of positive cells was calculated in five hotspots randomly selected from each section, and the percentage was scored: 1) zero point: positive cells <5%; 2) one point: positive cells 5–25%; 3) two points: positive cells 26–50%; 4) three points: positive cells 51–75%; 5) four points: positive cells 76–100%. The staining intensity was also scored: 1) zero point: no staining; 2) one point: faint yellow; 3) two points: brown-yellow; 4) three points: brown. Total score = percentage score × staining intensity score: 1) zero point: negative (−); 2) one to four points: weak positive(+); 3) five to eight points: positive (++); 4) 9–12 points: strong positive (+++).
Statistical computations were carried out with the SPSS 22.0 (SPSS Inc, Chicago, IL, USA). Histogram parameters (mean, standard deviation (SD), 50th, 75th, 90th, and 95th percentile) of Ktrans, Ve and VEGF expression of IDH1mut gliomas were compared with the IDH1wt gliomas using the Mann–Whitney U test. Receiver operating characteristic (ROC) curve analysis was plotted to differentiate IDH1mut from IDH1wt gliomas. The Spearman test was performed to calculate correlation coefficients between histogram parameters of Ktrans, Ve and VEGF expression in gliomas. P < 0.05 was considered statistically significant.
The CGGA database analysis showed the expression level of VEGF was lower in IDHmut gliomas (Figure 1).
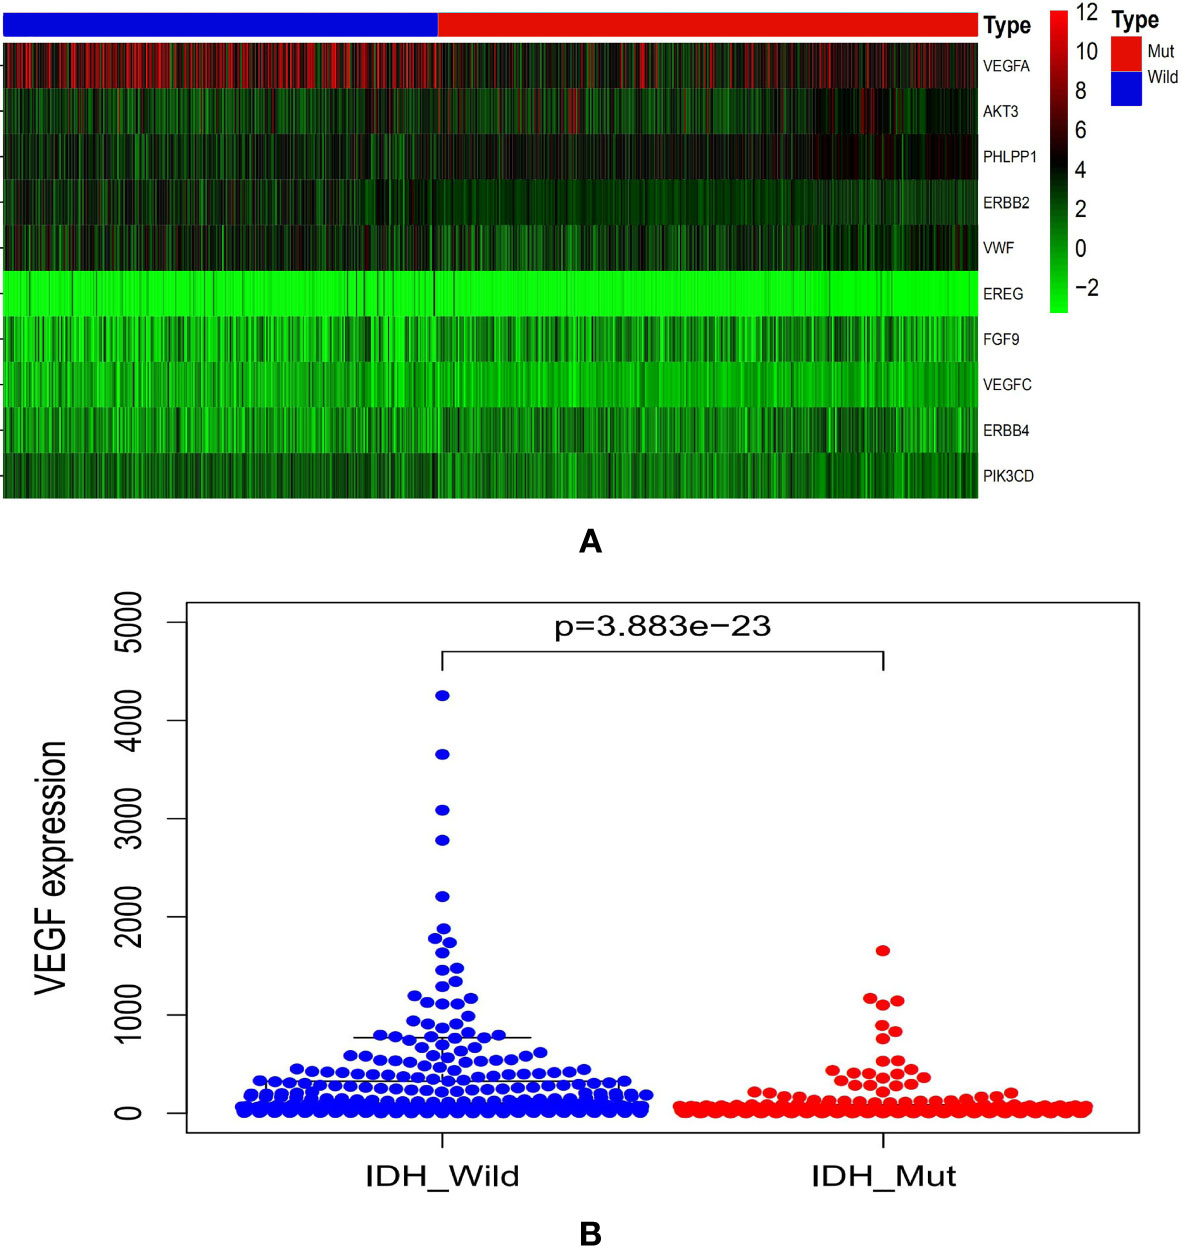
Figure 1 Graphs showed the differential VEGF expression in gliomas with different IDH genotypes from CGGA database (A, B). CGGA, Chinese Glioma Genome Atlas; IDH, isocitrate dehydrogenase; VEGF, vascular endothelial growth factor.
A total of 56 patients were included. Immunohistochemistry revealed 17 patients with IDH1mut and 39 patients with IDH1wt gliomas (Table 1).
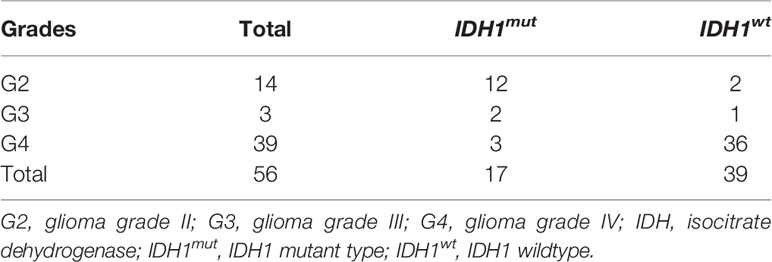
Table 1 Pathology and IDH1 genotypes of glioma samples.
Comparisons demonstrated that the mean, SD, 50th, 75th, 90th, and 95th percentile of Ktrans, Ve and VEGF expression were significantly lower in IDH1mut than IDH1wt gliomas (P < 0.05, respectively) (Table 2 and Figures 2, 3).
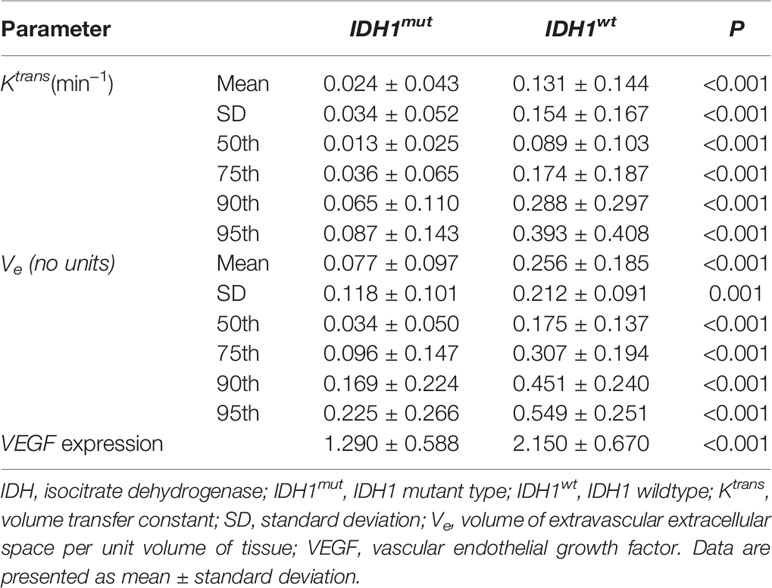
Table 2 Histogram parameters and VEGF expression in IDH1mut and IDH1wtglioma samples.
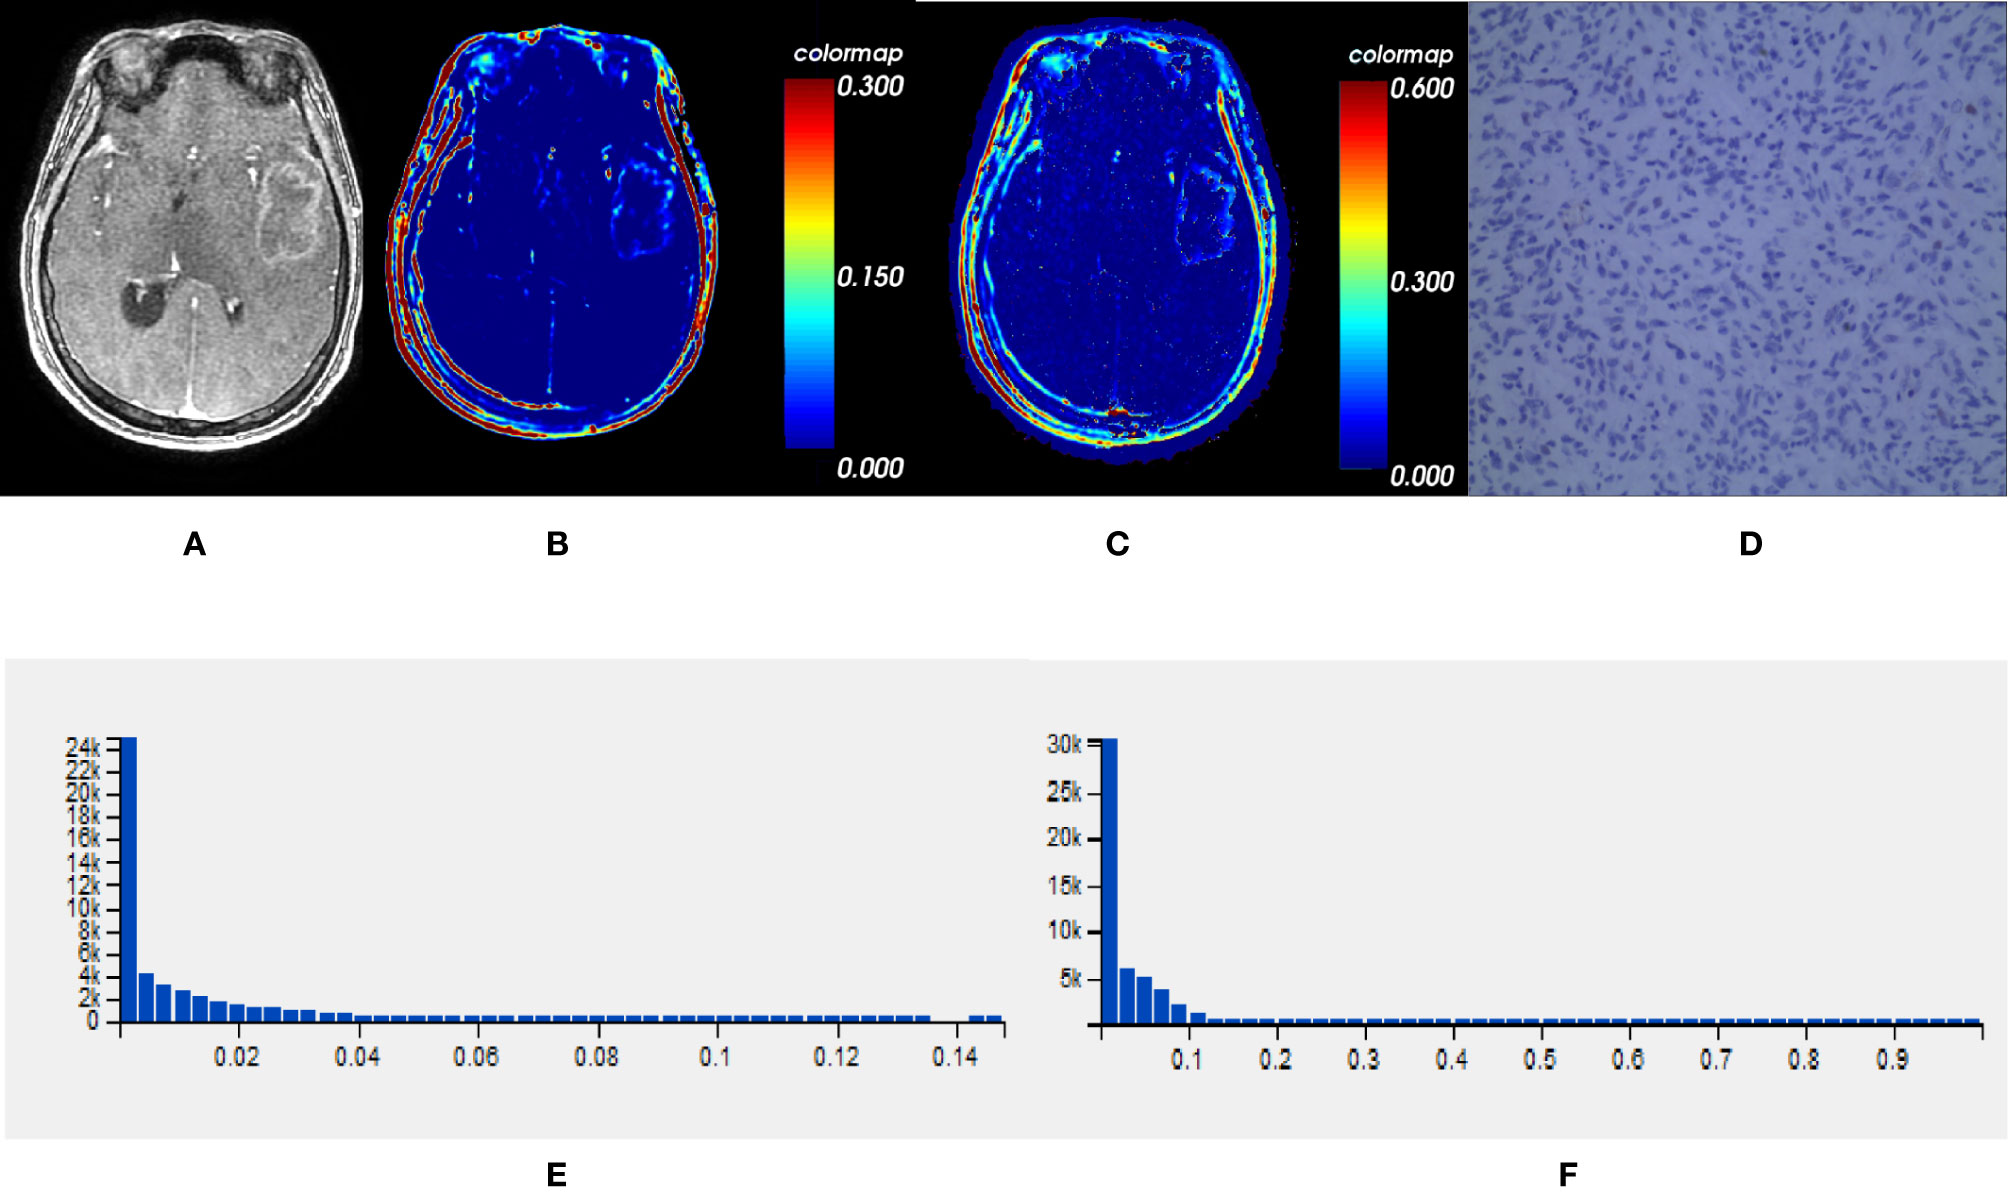
Figure 2 One IDH1mut glioblastoma in left temporal lobe; (A) T1-weighted contrast map, (B) Ktrans map, (C) Ve map, (D) VEGF sample from lesion area, (E) Histogram distribution of Ktrans, (F) Histogram distribution of Ve. The signal intensities of Ktrans and Ve in the lesion area were lower than those of the wildtype counterpart. In VEGF sample from lesion area, the staining cells and intensities were significantly fewer and lower than the wildtype counterpart. IDH, isocitrate dehydrogenase; IDH1mut, IDH1 mutant type; Ktrans, volume transfer constant; Ve, volume of extravascular extracellular space per unit volume of tissue; VEGF, vascular endothelial growth factor.
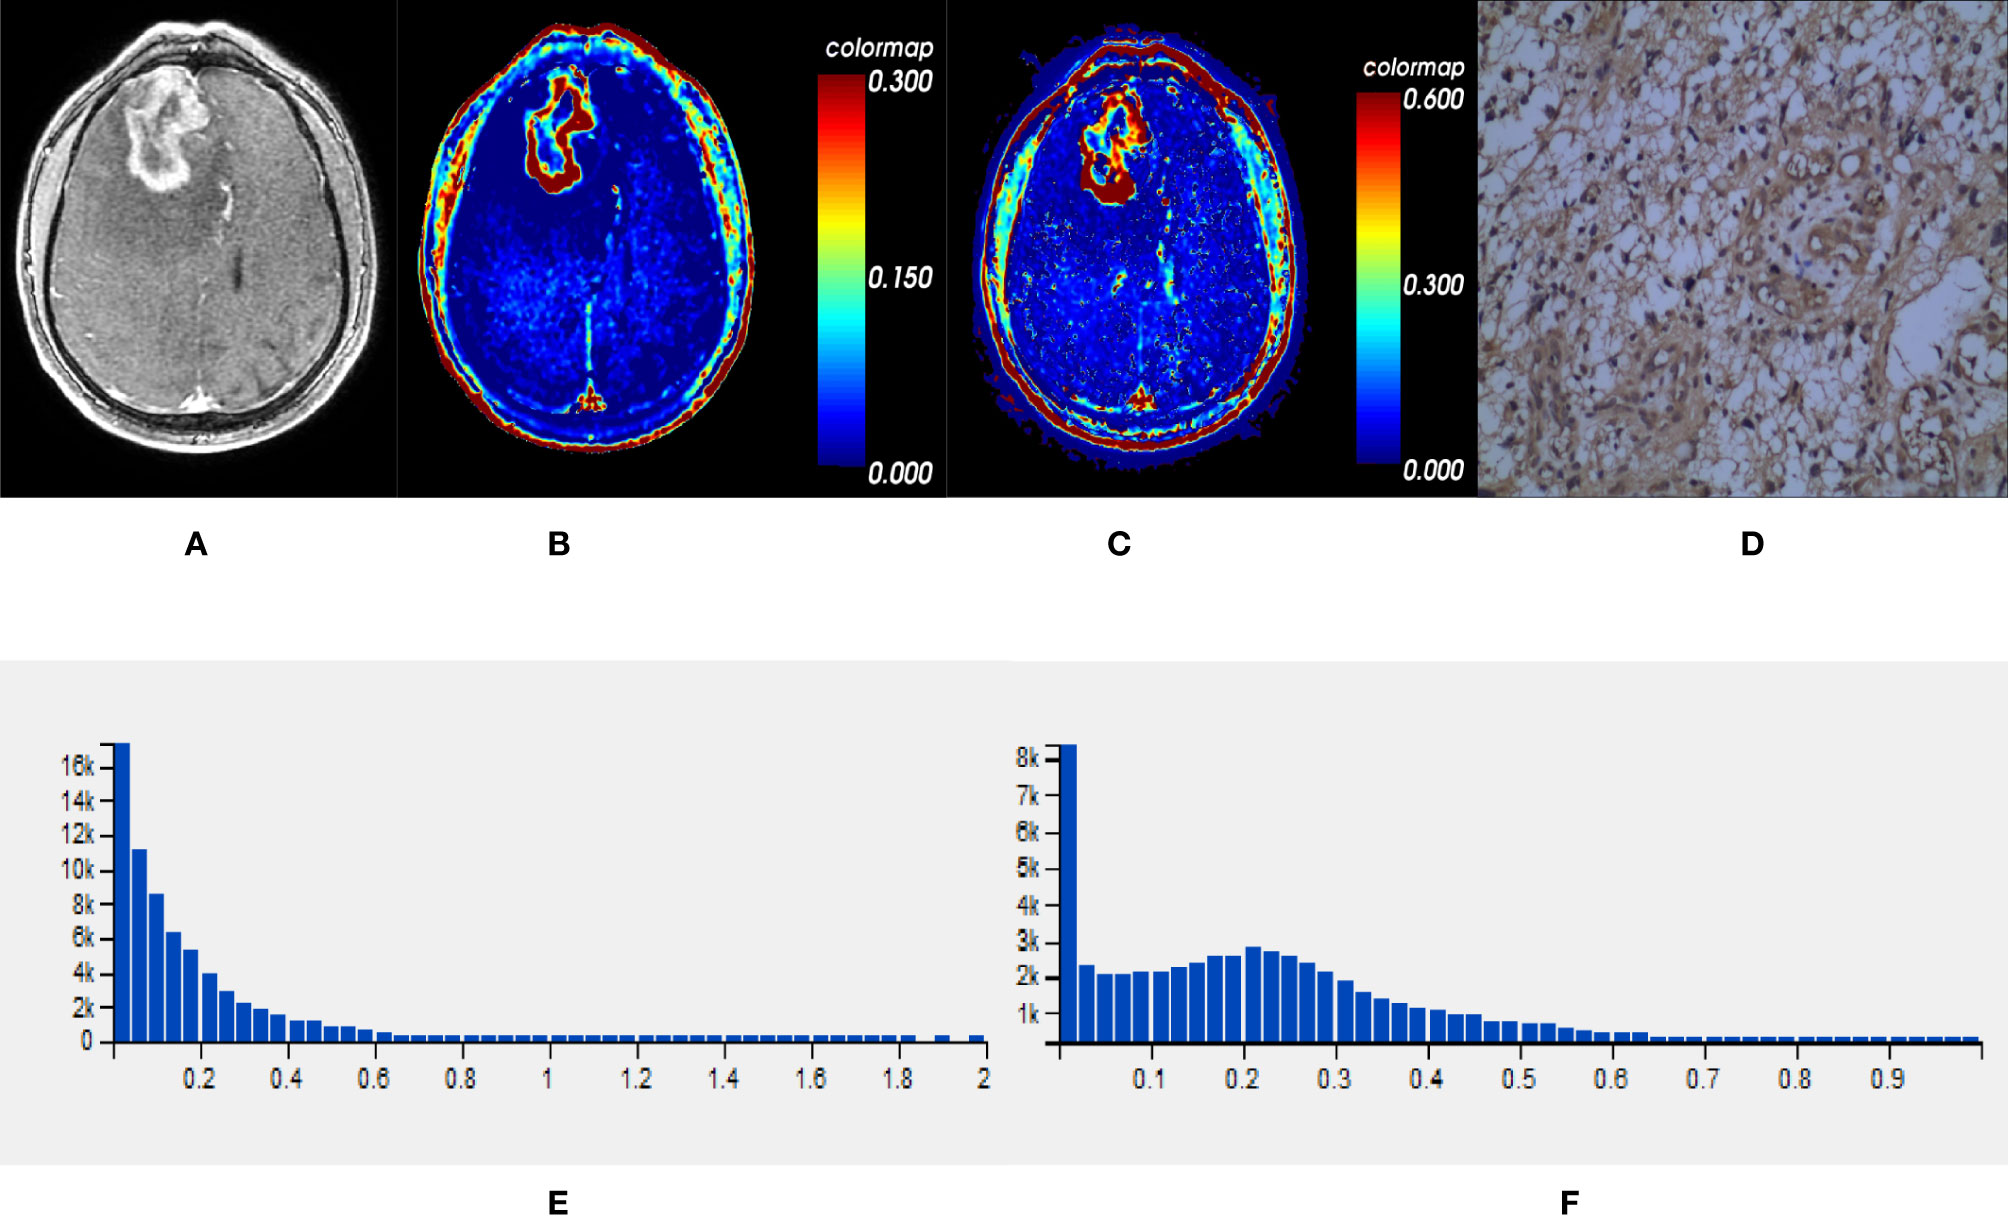
Figure 3 One IDH1wt glioblastoma in right frontal lobe; (A) T1-weighted contrast map, (B) Ktrans map, (C) Ve map, (D) VEGF sample from lesion area, (E) Histogram distribution of Ktrans, (F) Histogram distribution of Ve. The signal intensities of Ktrans and Ve in the lesion area were higher than those of the mutant type counterpart. In VEGF sample from lesion area, the staining cells and intensities were significantly more and higher than those in the mutant type counterpart. IDH, isocitrate dehydrogenase; IDH1wt, IDH1 wildtype; Ktrans, volume transfer constant; Ve, volume of extravascular extracellular space per unit volume of tissue; VEGF, vascular endothelial growth factor.
ROC curve analysis revealed that 50th percentile of Ktrans (0.019 min−1) and Ve (0.039) provided the perfect combination of sensitivity (0.872, 0.846) and specificity (0.882, 0.824) in distinguishing IDH1mut with IDH1wt gliomas (P < 0.05, respectively). Area under the curve (AUC) for Ktrans and Ve were 0.899 and 0.880 (Table 3 and Figure 4).
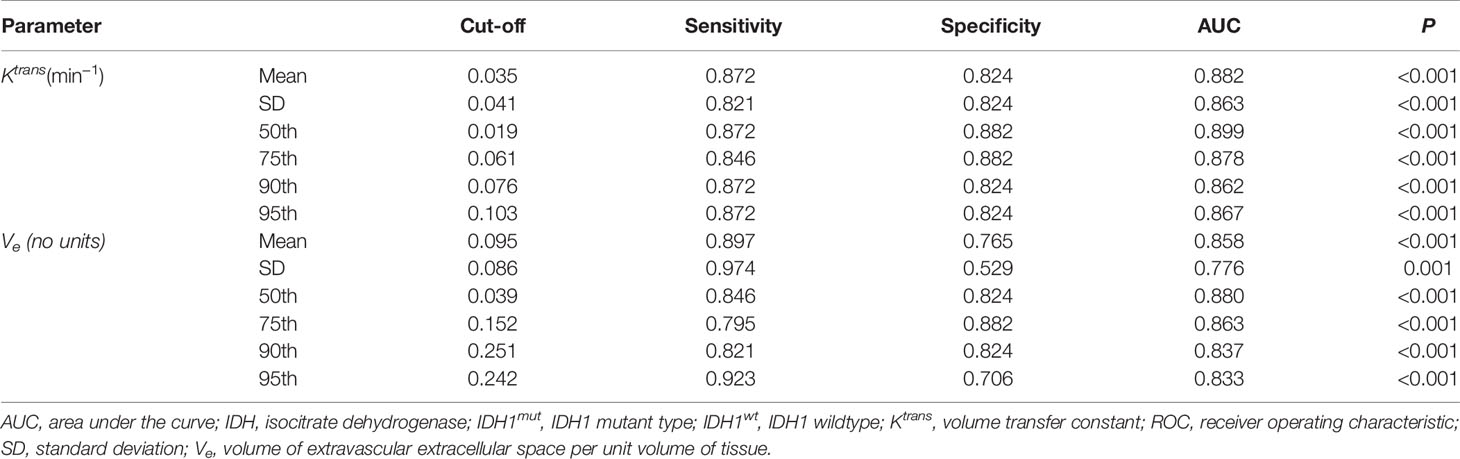
Table 3 ROC curve analysis of histogram parametersfor differentiating IDH1mut from IDH1wt glioma samples.
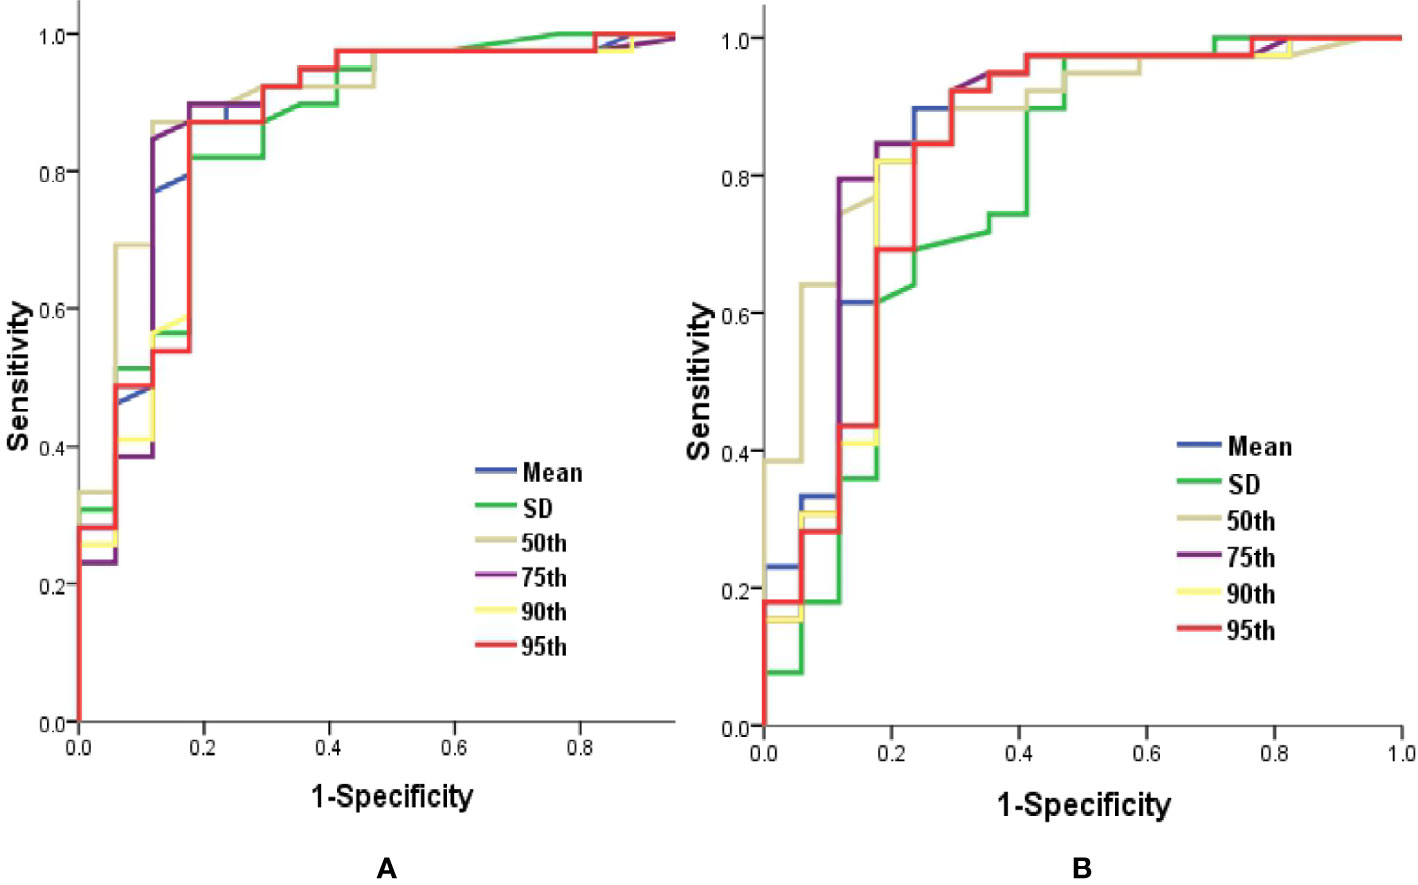
Figure 4 Graphs showed ROC curves of histogram parameters of Ktrans (A) and Ve (B) for differentiating the IDH1mutfrom IDH1wt gliomas. IDH, isocitrate dehydrogenase; IDH1mut, IDH1 mutant type; IDH1wt, IDH1 wildtype; Ktrans, volume transfer constant; ROC, receiver operating characteristic; Ve, volume of extravascular extracellular space per unit volume of tissue.
Irrespective of IDH1 mutation, histogram parameters of Ktransand Ve were positively correlated with VEGF expression in gliomas (P < 0.05, respectively) (Table 4).
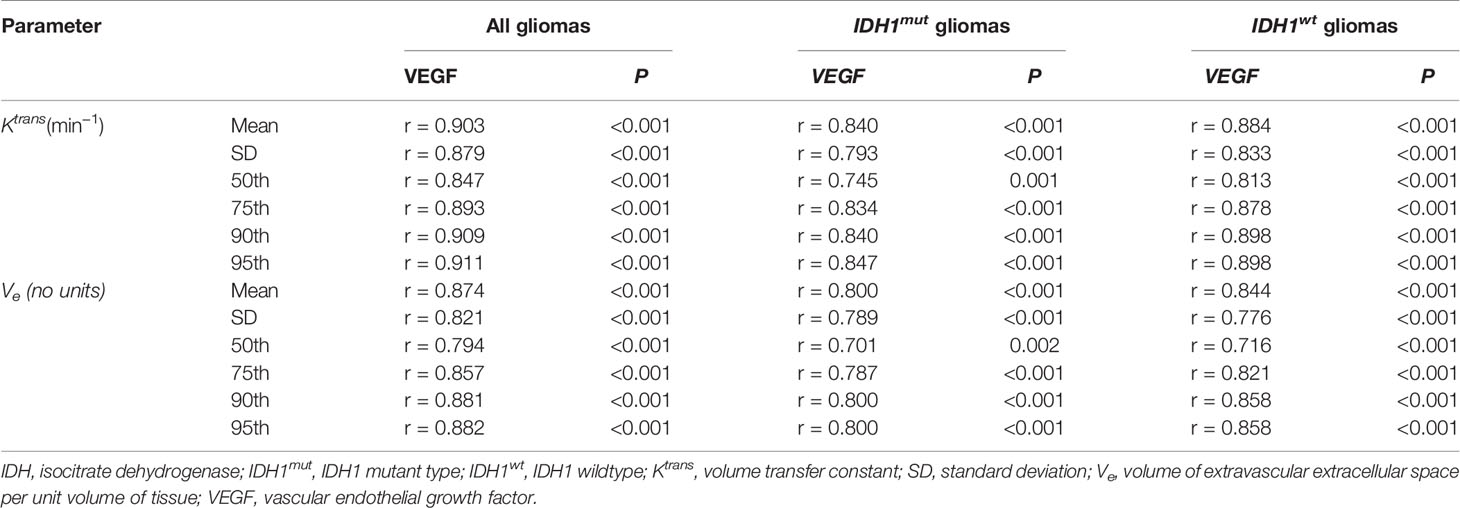
Table 4 The correlations between histogram parameters and VEGF expression in glioma samples.
IDH mutation indicates a favorable clinical prognosis as compared to IDH without mutation in gliomas (12, 13). A previous study found that patients with IDH1wt anaplastic astrocytomas even exhibited worse prognosis than those with IDH1mut glioblastomas (14). Therefore, there are several differences between the two genotypes of glioma. Analysis of CGGA database and clinical practice in our hospital indicated that VEGF expression was significantly lower in IDH1mut as compared to the wildtype counterpart. Some studies demonstrated that the expression of VEGF was inhibited in the IDHmut gliomas (15, 16). These findings supported our results indirectly.
In recent years, several MRI techniques provide insight into exploring the link between glioma IDH mutation and microvascular characteristics. Conventional MRI showed the frequency and degree of enhancing were lower in gliomas with IDH mutation (17, 18). Moreover, radiomics served as predictive markers in assessing the IDH mutation in gliomas (19, 20). Dynamic susceptibility contrast-enhanced magnetic resonance imaging (DSC-MRI) and arterial spin labeling (ASL) revealed that blood flow or blood volume was significantly lower in IDHmut than IDHwt gliomas (3, 21–23). The current results implied a discriminant function for differentiating between IDH1mut and IDH1wt gliomas was constructed using DCE-MRI. Hilario et al. and Zhang et al. found that Ktranswas lower in gliomas with IDH mutation, which corroborates our results (24, 25).
Hitherto, there is no study focusing on the combined estimation of glioma IDH1 mutation and VEGF expression with histogram analysis of DCE-MRI. In our study, we found that the signal intensities of lesions on Ktrans and Ve maps were lower in IDH1mut than IDH1wt gliomas. Simultaneously, the values of Ktrans and Ve were significantly higher in IDH1wt than IDH1mut gliomas. Our study also demonstrated that Ktrans and Ve were correlated with VEGF expression in gliomas. The conclusions clarifying Ktrans was correlated with VEGF expression in gliomas were consistent with our findings (26, 27). Pang et al. published that cerebral blood flow (CBF) derived from ASL also positively correlated significantly with VEGF expression in gliomas (28). Although both DCE-MRI and ASL can quantitatively assess tumor perfusion, they might be not completely comparable. The ASL primarily represents the degree of microvascular capacity, while microvascular immaturity and permeability are reflected by DCE-MRI. The pivotal features of VEGF are to enhance microvessel leakage and stimulate mitosis of endothelial cells to develop immature vascular infrastructure for supporting tumor cells (29, 30). However, the studies conducted by Awasthi et al. and Haris et al. did not demonstrate the positive correlation between Ktrans and VEGF expression in gliomas (31, 32). One reason might be that glioma samples were not exactly same. More glioblastomas were recruited in our study. The other might be that the methods used were different. The studies mentioned above chose partial areas of solid tumor as ROI, while entire tumor parenchyma was included in our study. More importantly, histogram analysis can assess the heterogeneity of tumors and improve the accuracy of diagnosis.
However, we have recognized a few limitations in the current study. First, the small sample size of glioma specimens restricts the accuracy of statistical analysis, and more samples are needed to verify the results in the future. Second, the IDH2 mutation has not been considered due to the lack of genomic sequence analysis in our hospital. Owing to the low frequency of IDH2 mutation in gliomas, the immunohistochemistry technique for detecting IDH1 mutation could represent the maximum number of IDH mutation in gliomas (33). Nonetheless, gene sequencing should substantiate these results in following studies.
VEGF expression is significantly lower in IDH1mut gliomas as compared to that in the wildtype counterpart, and it is non-invasively predictable with histogram analysis of DCE-MRI.
The raw data supporting the conclusions of this article will be made available by the authors without undue reservation.
The studies involving human participants were reviewed and approved by the Ethics Committee of Affiliated Hospital of Nantong University. The patients/participants provided their written informed consent to participate in this study. Written informed consent was obtained from the individual(s) for the publication of any potentially identifiable images or data included in this article.
YH conceived and wrote the paper. YC processed the imaging. JW and JK analyzed the study data. DS and ZJ supervised and leaded the study. All authors contributed to the article and approved the submitted version.
This work is supported by the China Postdoctoral Science Foundation (2014M551641) and Jiangsu Commission of Health (H2019089).
The authors declare that the research was conducted in the absence of any commercial or financial relationships that could be construed as a potential conflict of interest.
AUC, Area under the curve; ASL, Arterial spin labeling; CGGA, Chinese Glioma Genome Atlas; CBF, Cerebral blood flow; DCE-MRI, Dynamic contrast-enhanced magnetic resonance imaging; DSC-MRI, Dynamic susceptibility contrast-enhanced magnetic resonance imaging; IDH, Isocitrate dehydrogenase; Ktrans, Volume transfer constant; ROIs, Regions of interest; ROC, Receiver operating characteristic; Ve, Volume of extravascular extracellular space per unit volume of tissue; VEGF, Vascular endothelial growth factor; WHO, World Health Organization.
1. Louis DN, Perry A, Reifenberger G, von Deimling A, Figarella-Branger D, Cavenee WK, et al. The 2016 World Health Organization Classification of Tumors of the Central Nervous System: a summary. Acta Neuropathol (2016) 131:803–20. doi: 10.1007/s00401-016-1545-1
2. Koivunen P, Lee S, Duncan CG, Lopez G, Lu G, Ramkissoon S, et al. Transformation by the (R)-enantiomer of 2-hydroxyglutarate linked to EGLN activation. Nature (2012) 483:484–8. doi: 10.1038/nature10898
3. Kickingereder P, Sahm F, Radbruch A, Wick W, Heiland S, Deimling AV, et al. IDH mutation status is associated with a distinct hypoxia/angiogenesis transcriptome signature which is non-invasively predictable with rCBV imaging in human glioma. Sci Rep (2015) 5:16238. doi: 10.1038/srep16238
4. Birner P, Pusch S, Christov C, Mihaylova S, Toumangelova-Uzeir K, Natchev S, et al. Mutant IDH1 inhibits PI3K/Akt signaling in human glioma. Cancer (2014) 120:2440–7. doi: 10.1002/cncr.28732
5. Yuan X, Liu D, Wang Y, Li X. Significance of nuclear magnetic resonance combined with Ki-67 and VEGF detection in the diagnosis and prognosis evaluation of brain glioma. J BUON (2018) 23:410–5.
6. Rainer E, Wang H, Traub-Weidinger T, Widhalm G, Fueger B, Chang J, et al. The prognostic value of [123I]-vascular endothelial growth factor ([123I]-VEGF) in glioma. Eur J Nucl Med Mol Imaging (2018) 45:2396–403. doi: 10.1007/s00259-018-4088-y
7. Friedman HS, Prados MD, Wen PY, Mikkelsen T, Schiff D, Abrey LE, et al. Bevacizumab alone and in combination with irinotecan in recurrent glioblastoma. J Clin Oncol (2009) 27:4733–40. doi: 10.1200/JCO.2008.19.8721
8. Kreisl TN, Kim L, Moore K, Duic P, Royce C, Stroud I, et al. Phase II trial of single-agent bevacizumab followed by bevacizumab plus irinotecan at tumor progression in recurrent glioblastoma. J Clin Oncol (2009) 27:740–5. doi: 10.1200/JCO.2008.16.3055
9. Jia ZZ, Gu HM, Zhou XJ, Shi JL, Li MD, Zhou GF, et al. The assessment of immature microvascular density in brain gliomas with dynamic contrast-enhanced magnetic resonance imaging. Eur J Radiol (2015) 84:1805–9. doi: 10.1016/j.ejrad.2015.05.035
10. Jensen RL, Mumert ML, Gillespie DL, Kinney AY, Schabel MC, Salzman KL. Preoperative dynamic contrast-enhanced MRI correlates with molecular markers of hypoxia and vascularity in specific areas of intratumoral microenvironment and is predictive of patient outcome. Neuro Oncol (2014) 16:280–91. doi: 10.1093/neuonc/not148
11. Takano S, Tian W, Matsuda M, Yamamoto T, Ishikawa E, Kaneko MK, et al. Detection of IDH1 mutation in human gliomas: comparison of immunohistochemistry and sequencing. Brain Tumor Pathol (2011) 28:115–23. doi: 10.1007/s10014-011-0023-7
12. Myung JK, Cho HJ, Park CK, Kim SK, Phi JH, Park SH. IDH1 mutation of gliomas with long-term survival analysis. Oncol Rep (2012) 28:1639–44. doi: 10.3892/or.2012.1994
13. Houillier C, Wang X, Kaloshi G, Mokhtari K, Guillevin R, Laffaire J, et al. IDH1 or IDH2 mutations predict longer survival and response to temozolomide in low-grade gliomas. Neurology (2010) 75:1560–6. doi: 10.1212/WNL.0b013e3181f96282
14. Hartmann C, Hentschel B, Wick W, Capper D, Felsberg J, Simon M, et al. Patients with IDH1 wild type anaplastic astrocytomas exhibit worse prognosis than IDH1-mutated glioblastomas, and IDH1 mutation status accounts for the unfavorable prognostic effect of higher age: implications for classification of gliomas. Acta Neuropathol (2010) 120:707–18. doi: 10.1007/s00401-010-0781-z
15. Sun C, Zhao Y, Shi J, Zhang J, Yuan Y, Gu Y, et al. Isocitrate dehydrogenase1 mutation reduces the pericyte coverage of microvessels in astrocytic tumours. J Neurooncol (2019) 143:187–96. doi: 10.1007/s11060-019-03156-5
16. Polívka J, Pešta M, Pitule P, Hes O, Holubec L, Polívka J, et al. IDH1 mutation is associated with lower expression of VEGF but not microvessel formation in glioblastoma multiforme. Oncotarget (2018) 9:16462–76. doi: 10.18632/oncotarget.24536
17. Qi S, Yu L, Li H, Ou Y, Qiu X, Ding Y, et al. Isocitrate dehydrogenase mutation is associated with tumor location and magnetic resonance imaging characteristics in astrocytic neoplasms. Oncol Lett (2014) 7:1895–902. doi: 10.3892/ol.2014.2013
18. Ding H, Huang Y, Li Z, Li S, Chen Q, Xie C, et al. Prediction of IDH Status Through MRI Features and Enlightened Reflection on the Delineation of Target Volume in Low-Grade Gliomas. Technol Cancer Res Treat (2019) 18:1533033819877167. doi: 10.1177/1533033819877167
19. Kim M, Jung SY, Park JE, Jo Y, Park SY, Nam SJ, et al. Diffusion- and perfusion-weighted MRI radiomics model may predict isocitrate dehydrogenase (IDH) mutation and tumor aggressiveness in diffuse lower grade glioma. Eur Radiol (2020) 30:2142–51. doi: 10.1007/s00330-019-06548-3
20. Tan Y, Zhang ST, Wei JW, Dong D, Wang XC, Yang GQ, et al. A radiomics nomogram may improve the prediction of IDH genotype for astrocytoma before surgery. Eur Radiol (2019) 29:3325–37. doi: 10.1007/s00330-019-06056-4
21. Xing Z, Zhang H, She D, Lin Y, Zhou X, Zeng Z, et al. IDH genotypes differentiation in glioblastomas using DWI and DSC-PWI in the enhancing and peri-enhancing region. Acta Radiol (2019) 60:1663–72. doi: 10.1177/0284185119842288
22. Xing Z, Yang X, She D, Lin Y, Zhang Y, Cao D. Noninvasive Assessment of IDH Mutational Status in World Health Organization Grade II and III Astrocytomas Using DWI and DSC-PWI Combined with Conventional MR Imaging. AJNR Am J Neuroradiol (2017) 38:1138–44. doi: 10.3174/ajnr.A5171
23. Brendle C, Hempel JM, Schittenhelm J, Skardelly M, Tabatabai G, Bender B, et al. Glioma Grading and Determination of IDH Mutation Status and ATRX loss by DCE and ASL Perfusion. Clin Neuroradiol (2018) 28:421–8. doi: 10.1007/s00062-017-0590-z
24. Hilario A, Hernandez-Lain A, Sepulveda JM, Lagares A, Perez-Nuñez A, Ramos A. Perfusion MRI grading diffuse gliomas: Impact of permeability parameters on molecular biomarkers and survival. Neurocirugia (Astur) (2019) 30:11–8. doi: 10.1016/j.neucir.2018.06.004
25. Zhang HW, Lyu GW, He WJ, Lei Y, Lin F, Wang MZ, et al. DSC and DCE Histogram Analyses of Glioma Biomarkers, Including IDH, MGMT, and TERT, on Differentiation and Survival. Acad Radiol (2020) S1076–6332(19):30624–5. doi: 10.1016/j.acra.2019.12.010
26. Di N, Cheng W, Jiang X, Liu X, Zhou J, Xie Q, et al. Can dynamic contrast-enhanced MRI evaluate VEGF expression in brain glioma? An MRI-guided stereotactic biopsy study. J Neuroradiol (2019) 46:186–92. doi: 10.1016/j.neurad.2018.04.008
27. Di N, Yao C, Cheng W, Ren Y, Qu J, Wang B, et al. Correlation of dynamic contrast-enhanced MRI derived volume transfer constant with histological angiogenic markers in high-grade gliomas. J Med Imaging Radiat Oncol (2018) 62:1954–6. doi: 10.1111/1754-9485.12701
28. Pang H, Dang X, Ren Y, Zhuang D, Qiu T, Chen H, et al. 3D-ASL Perfusion Correlates With VEGF Expression and Overall Survival in Glioma Patients: Comparison of Quantitative Perfusion and Pathology on Accurate Spatial Location-Matched Basis. J Magn Reson Imaging (2019) 50:209–20. doi: 10.1002/jmri.26562
29. Ferrara N, Adamis AP. Ten years of anti-vascular endothelial growth factor therapy. Nat Rev Drug Discov (2016) 15:385–403. doi: 10.1038/nrd.2015.17
30. Carmeliet P, Jain RK. Angiogenesis in cancer and other diseases. Nature (2016) 407:249–57. doi: 10.1038/35025220
31. Awasthi R, Rathore RK, Soni P, Sahoo P, Awasthi A, Husain N, et al. Discriminant analysis to classify glioma grading using dynamic contrast-enhanced MRI and immunohistochemical markers. Neuroradiology (2012) 54:205–13. doi: 10.1007/s00234-011-0874-y
32. Haris M, Husain N, Singh A, Husain M, Srivastava S, Srivastava C, et al. Dynamic contrast-enhanced derived cerebral blood volume correlates better with leak correction than with no correction for vascular endothelial growth factor, microvascular density, and grading of astrocytoma. J Comput Assist Tomogr (2012) 32:955–65. doi: 10.1097/RCT.0b013e31816200d1
Keywords: glioma, isocitrate dehydrogenase, vascular endothelial growth factor, magnetic resonance imaging, histogram
Citation: Hu Y, Chen Y, Wang J, Kang JJ, Shen DD and Jia ZZ (2020) Non-Invasive Estimation of Glioma IDH1 Mutation and VEGF Expression by Histogram Analysis of Dynamic Contrast-Enhanced MRI. Front. Oncol. 10:593102. doi: 10.3389/fonc.2020.593102
Received: 09 August 2020; Accepted: 30 October 2020;
Published: 08 December 2020.
Edited by:
Han Zhang, University of North Carolina at Chapel Hill, United StatesReviewed by:
Nuria Arias-Ramos, Autonomous University of Madrid, SpainCopyright © 2020 Hu, Chen, Wang, Kang, Shen and Jia. This is an open-access article distributed under the terms of the Creative Commons Attribution License (CC BY). The use, distribution or reproduction in other forums is permitted, provided the original author(s) and the copyright owner(s) are credited and that the original publication in this journal is cited, in accordance with accepted academic practice. No use, distribution or reproduction is permitted which does not comply with these terms.
*Correspondence: Dan Dan Shen, cmljaGllOTIxMkAxNjMuY29t; Zhong Zheng Jia, anp6MjM5N0AxNjMuY29t
†These authors have contributed equally to this work
Disclaimer: All claims expressed in this article are solely those of the authors and do not necessarily represent those of their affiliated organizations, or those of the publisher, the editors and the reviewers. Any product that may be evaluated in this article or claim that may be made by its manufacturer is not guaranteed or endorsed by the publisher.
Research integrity at Frontiers
Learn more about the work of our research integrity team to safeguard the quality of each article we publish.