 Gang Li1
 Hao Zhang
 Lu Bai
- 1School of Food Science, Henan Institute of Science and Technology, Xinxiang, China
- 2Henan Institute of Metrology, Zhengzhou, China
Introduction: The search for natural bioactive compounds that act as α-glucosidase inhibitors is a central focus in diabetes treatment research.
Methods: This study utilized ultrasonic-assisted extraction to optimize the extraction of polyphenols from honeysuckle leaves through response surface methodology (RSM). Enzyme inhibition and fluorescence quenching experiments were conducted to examine the inhibitory activity and binding behavior of the extracted polyphenols.
Results: The results indicated that the optimal conditions for polyphenol extraction were as follows: ethanol concentration, 64%, liquid–solid ratio, 45 mL/g, ultrasonic power, 700 W, ultrasonic time, 6 min. Under these conditions, the yield of polyphenols from honeysuckle leaves was 9.16 ± 0.19%, which closely aligns with the predicted value of 9.18%. The total phenolic content of the polyphenol extracts was 20.6 ± 0.67%, with chlorogenic acid and luteoloside contents measuring 5.65 ± 0.40% and 2.51 ± 0.14%, respectively. The inhibitory effect of polyphenol extracts (IC50, 0.14 ± 0.01 mg/mL) on α-glucosidase was better than that of chlorogenic acid (IC50, 0.55 ± 0.02 mg/mL). Fluorescence quenching experiments indicated that the polyphenol extracts interact with α-glucosidase, resulting in alterations to the microenvironment of amino acid residues.
Discussion: This interaction can reduce the binding affinity between the substrate and α-glucosidase, thereby contributing to the objective of lowering postprandial hyperglycemia. Our research results can provide reference for the development and utilization of honeysuckle leaves.
1 Introduction
Currently, diabetes, as one of the predominant chronic diseases, extensively and persistently affects people’s lives (1–6). Controlling postprandial hyperglycemia is a critical approach in diabetes treatment, which is achieved by inhibiting the activity of carbohydrate-related hydrolases (α-amylase and α-glucosidase). Inhibitors of these enzymes slow glucose absorption in the intestine, thereby mitigating the postprandial increase in blood glucose levels. Classic antidiabetic drugs such as miglitol, acarbose, and voglibose function as α-glucosidase inhibitors (7). Their molecular structures resemble those of disaccharides or oligosaccharides, enabling them to bind to the carbohydrate-binding site of α-glucosidase. This binding reduces the interaction between α-glucosidase and carbohydrates, resulting in delayed digestion and absorption of carbohydrates, ultimately lowering postprandial hyperglycemia. However, substantial evidence indicates that the use of these medications can lead to various adverse effects, including abdominal pain, diarrhea, and hepatotoxicity (8, 9). In recent years, people have begun to focus on the development and utilization of natural products, which are low-cost and relatively safe. Džamić and Matejić (10) summarized the natural active compounds used in diabetes treatment, including plant extracts, carotenoids, polyphenols, saponins, flavonoids, phytosterols, and other bioactive compounds, which represent a rich source for the development of therapeutic and preventive drugs for diabetes.
Honeysuckle (Lonicera japonica Thunb.) is an important medicinal and edible plant. Its flowers can be utilized in the production of traditional Chinese medicine formulations and serves as an industrial raw material for the extraction of chlorogenic acid. Despite the annual increase in its market price, the branches and leaves of honeysuckle are largely discarded as non-medicinal components. Research indicates that the leaves and flowers of honeysuckle exhibit significant homogeneity in their primary bioactive constituents. In particular, the leaves exhibit considerable activity, even surpassing that of the floral components, and can serve as an alternative or supplementary source to flowers (11). The leaves are rich in polyphenolic compounds, including chlorogenic acid and luteoloside (12), and their and pharmacological effects and active components are comparable to those of the flower buds. Chlorogenic acid, the primary active component in the leaves of honeysuckle, possesses significant potential for development and application. Agunloye et al. (13) found that chlorogenic acid can reduce the activity of enzymes associated with the pathogenesis of hypertension, demonstrating favorable antihypertensive and cardioprotective properties. Additionally, chlorogenic acid has shown promising efficacy in reducing blood glucose levels, suggesting its potential as a preventive agent for type 2 diabetes (14). Luteoloside exerts neuroprotective effects through mechanisms that reduce the apoptosis rate of nerve cells, as well as through antioxidant and anti-inflammatory actions (15). China possesses abundant and diverse resources of honeysuckle. Effective utilization and development of the polyphenols from honeysuckle leaves could yield broad application prospects.
Ultrasound-assisted extraction technology, recognized for its efficiency, rapidity, and environmental benefits, plays an increasingly significant role in the extraction of bioactive compounds from plants (16). This method utilizes mechanical vibrations generated by ultrasound to facilitate the extraction of active components from plant samples. The cavitation effect induced by these vibrations, combined with elevated temperature and pressure, enhances extraction efficiency, reduces extraction time, and minimizes the use of harmful solvents (17). Traditional water extraction methods for polyphenols exhibit limitations such as low extraction efficiency and challenges in separation. Ultrasound-assisted extraction improves the yield of polyphenols while simultaneously reducing extraction time and minimizing solvent consumption. Xu et al. (18) demonstrated that, compared to conventional maceration and Soxhlet extraction methods, ultrasound-assisted extraction significantly increases the yield of antioxidants and decreases extraction time.
In view of this, the present study employed response surface methodology (RSM) to optimize the process conditions for ultrasound-assisted extraction of polyphenols, and enzyme inhibition and fluorescence quenching experiments were conducted to investigate the enzyme inhibitory activity and interactions of polyphenols from honeysuckle leaves. The findings of this study can serve as a reference for the development and utilization of honeysuckle leaves.
2 Materials and methods
2.1 Materials and chemicals
The leaves of honeysuckle (variety, Baijin 2) were harvested from the experimental field in Xinxiang. The powder of honeysuckle leaves after drying and crushing was stored in the laboratory of the School of Food Science at Henan Institute of Science and Technology (Xinxiang, China). α-glucosidase (from yeast) and p-nitrophenyl-α-D-glucopyranoside (PNPG) were purchased from Aladdin (Shanghai, China). All other chemicals were of analytical grade.
2.2 Ultrasonic-assisted extraction of polyphenols from honeysuckle leaves
Honeysuckle leaves were dried at a constant temperature of 50°C until no significant weight change was observed. The dried leaves were subsequently crushed and sieved to obtain honeysuckle leaf powder, which was stored in a dark environment at refrigerated temperatures. One gram of powdered honeysuckle leaves was weighed and placed in a 50 mL conical flask, followed by the addition of a specific volume of an ethanol-water mixed solution to ensure thorough mixing. The mixture underwent ultrasonic treatment in an ultrasonic cleaner, followed by centrifugation at 6,000 rpm for 10 min, after which the supernatant was collected.
2.3 Determination of total phenolic content
According to the methods described in reference (19), with slight modifications. First, 300 μL of the aforementioned collected supernatant was added to a colorimetric tube, followed by the addition of distilled water to reach a total volume of 10 mL. Subsequently, 0.5 mL of Folin–Ciocalteu reagent was added, and the mixture was shaken for 5 min. Immediately thereafter, 5 mL of 5% Na2CO3 solution was added, and distilled water was used to adjust the final volume to 25 mL. The mixture was thoroughly mixed and allowed to stand for 90 min. Absorbance was measured at a wavelength of 750 nm, and the total phenolic content of the supernatant was calculated using a chlorogenic acid standard curve. The yield of polyphenols was calculated by Equation 1.
where, Y was the polyphenol yield of honeysuckle leaves, %; C1 was the total amount of polyphenols in the supernatant, mg; C0 was the mass of the honeysuckle leaf raw material, mg.
2.4 Single factor experiment of ultrasonic-assisted extraction
The experiment evaluated the yield of polyphenols from honeysuckle leaves, examining the effects of ethanol concentration (10, 30, 50, 70, 90%), liquid–solid ratio (10, 20, 30, 40, 50 mL/g), ultrasonic time (2, 4, 6, 8, 10, 12 min), and ultrasonic power (280, 420, 560, 700 W) on the polyphenol yield.
2.5 Optimization experiment of ultrasonic-assisted extraction based on RSM
Based on the results of the single factor experiments, RSM was employed to further optimize the conditions for ultrasonic-assisted extraction. Four factors were selected as independent variables: ethanol concentration (A), liquid–solid ratio (B), ultrasonic time (C), and ultrasonic power (D), with the response variable being the yield of polyphenols (Y).
2.6 Determination of total phenolic content in extracts
The supernatant obtained from the aforementioned process was subjected to rotary evaporation to remove ethanol, followed by freeze-drying to obtain the polyphenol extract. 2 mg/mL methanolic solution of the extract was prepared and the total phenolic content was determined according to the method described in section 2.3.
2.7 Determination of chlorogenic acid and luteoloside content
According to the reference method and slightly modified (20). Determination of chlorogenic acid and luteoloside using a Waters Alliance HPLC system (e2695 separating module) (Waters Co., MA, United States). The extract solution of 2 mg/mL was prepared with methanol, and the column was Waters C18 (4.6 mm × 250 mm, 5 μm). Acetonitrile was mobile phase A, 0.04% glacial acetic acid solution was mobile phase B, the volume flow rate was 1.0 mL/min, the column temperature was 30°C, the injection volume was set at 20 μL, and the gradient elution was performed for 0–10 min, A: 3–15%, B: 97–85%. 10–31 min, A: 15–30%, B: 85–70%, detection wavelength was 348 nm.
2.8 Determination of α-glucosidase inhibitory effect
According to the method described in the reference (21), the inhibitory activity of α-glucosidase by sample solutions at different concentrations was determined, with chlorogenic acid as the positive control and PNPG as the substrate. The reaction was carried out in PBS buffer solution (0.1 mol/L, pH 6.8). Respectively, 1 mL of chlorogenic acid solution and 1 mL of polyphenol extract solution were uniformly mixed with 1 mL of α-glucosidase solution (0.2 U/mL). The mixed solutions were incubated in a water bath at 37°C for 10 min. Subsequently, added PNPG (1 mL, 1 mmol/L) and incubate the resulting mixed solution in a water bath at 37°C for 20 min. Finally, 1 mL ethanol was quickly added to terminate the reaction, and the final volume was 4 mL. The absorbance value was measured at 405 nm (A1). The control group (A0) was treated with 1 mL of PBS buffer solution instead. The inhibitory activity (R) of α-glucosidase was calculated according to Equation 2:
2.9 Determination of binding behavior
According to Geng et al. (21), the interaction of polyphenol extracts with α-glucosidase was determined using a fluorescence quenching method. PBS buffer solution (50 mmol/L, pH 6.8) was used to prepare 2 U/mL α-glucosidase solution and different concentrations of polyphenol extract solutions (0, 10, 20, 30, 40, 50 mg/mL). Four milliliters of the aforementioned enzyme solution was uniformly mixed with 1 mL of the polyphenol extract solution and stabilized at 30°C for 10 min. The fluorescence spectra were scanned using an Agilent Cary Eclipse Fluorescence Spectrophotometer (Santa Clara, CA). The scanning conditions were set as follows: excitation wavelength/280 nm, scanning range/300–450 nm, slit width/5 nm, and scanning voltage/750 kV.
2.10 Determination of synchronous and 3D fluorescence spectra
Referring to the method of He et al. (22) with slight modifications, the conformational changes of α-glucosidase were identified by measuring the synchronous and 3D spectral behaviors of tyrosine and tryptophan residues. The reaction system of enzyme-polyphenol extract was constructed according to the method described in section 2.9. The synchronous fluorescence spectra were recorded at Δλ = 15 nm/Ex = 265–350 nm and Δλ = 60 nm/Ex = 220–350 nm. The 3D fluorescence spectra of the sample solution were recorded with excitation wavelengths ranging from 220 to 300 nm and emission wavelengths ranging from 300 to 450 nm. The scanning rate was set at 9,600 nm/min.
2.11 Statistical analysis
Each experiment was conducted with three repetitions, and the resulting data underwent error analysis. Graphs were generated using Origin 8.0 software. Response surface data analysis was conducted using Design-Expert software.
3 Results and discussion
3.1 Analysis of results from single factor experiments
Ultrasound-assisted extraction technology is an efficient, rapid, and environmentally friendly method that increasingly plays a significant role in extracting bioactive compounds from plants. In examining the conditions of the ultrasonic-assisted extraction process, numerous parameters influence the yield of polyphenols, including the type of extraction solvent, the liquid–solid ratio, ultrasonic power, and ultrasonic time. Given the potential applications of honeysuckle leaf polyphenols in the food industry, ethanol, a food-grade solvent, was selected as the extraction solvent. Furthermore, the liquid–solid ratio is directly related to cost-effectiveness, making it an important evaluation metric. The intensity of cavitation effects, determined by ultrasonic power and time, facilitates the release of polyphenols from plant tissues into the solvent, thereby influencing extraction efficiency. Consequently, this study examined the impact of these four factors on the extraction yield of polyphenols. The initial conditions for the fixed factors were established as follows: ethanol concentration 30%, liquid–solid ratio 30 mL/g, ultrasonic time 6 min, and ultrasonic power 560 W.
3.1.1 The impact of ethanol concentration
Water enhances the swelling of plant materials, while ethanol disrupts the binding between solutes and the plant matrix (23). Figure 1A illustrated the effect of ethanol concentration on polyphenol yield, demonstrating that as ethanol concentration increases, polyphenol yield initially rises before subsequently declining. The highest yield of polyphenols from honeysuckle leaves, at 8.49%, was achieved at an ethanol concentration of 50%. Zhou et al. (24) reported a similar phenomenon when extracting polyphenols from the seed coat of the red sword bean. This trend may be attributed to insufficient ethanol concentration, which hinders penetration through plant cells. Conversely, excessively high concentrations increase the polarity of the mixture, thereby reducing interactions with polyphenolic compounds and resulting in lower yields of the target components. According to the principle of “like dissolves like,” the solubility of the target compound varies with changes in solvent polarity (25). Consequently, ethanol concentrations ranging from 30 to 70% were selected for subsequent RSM studies.
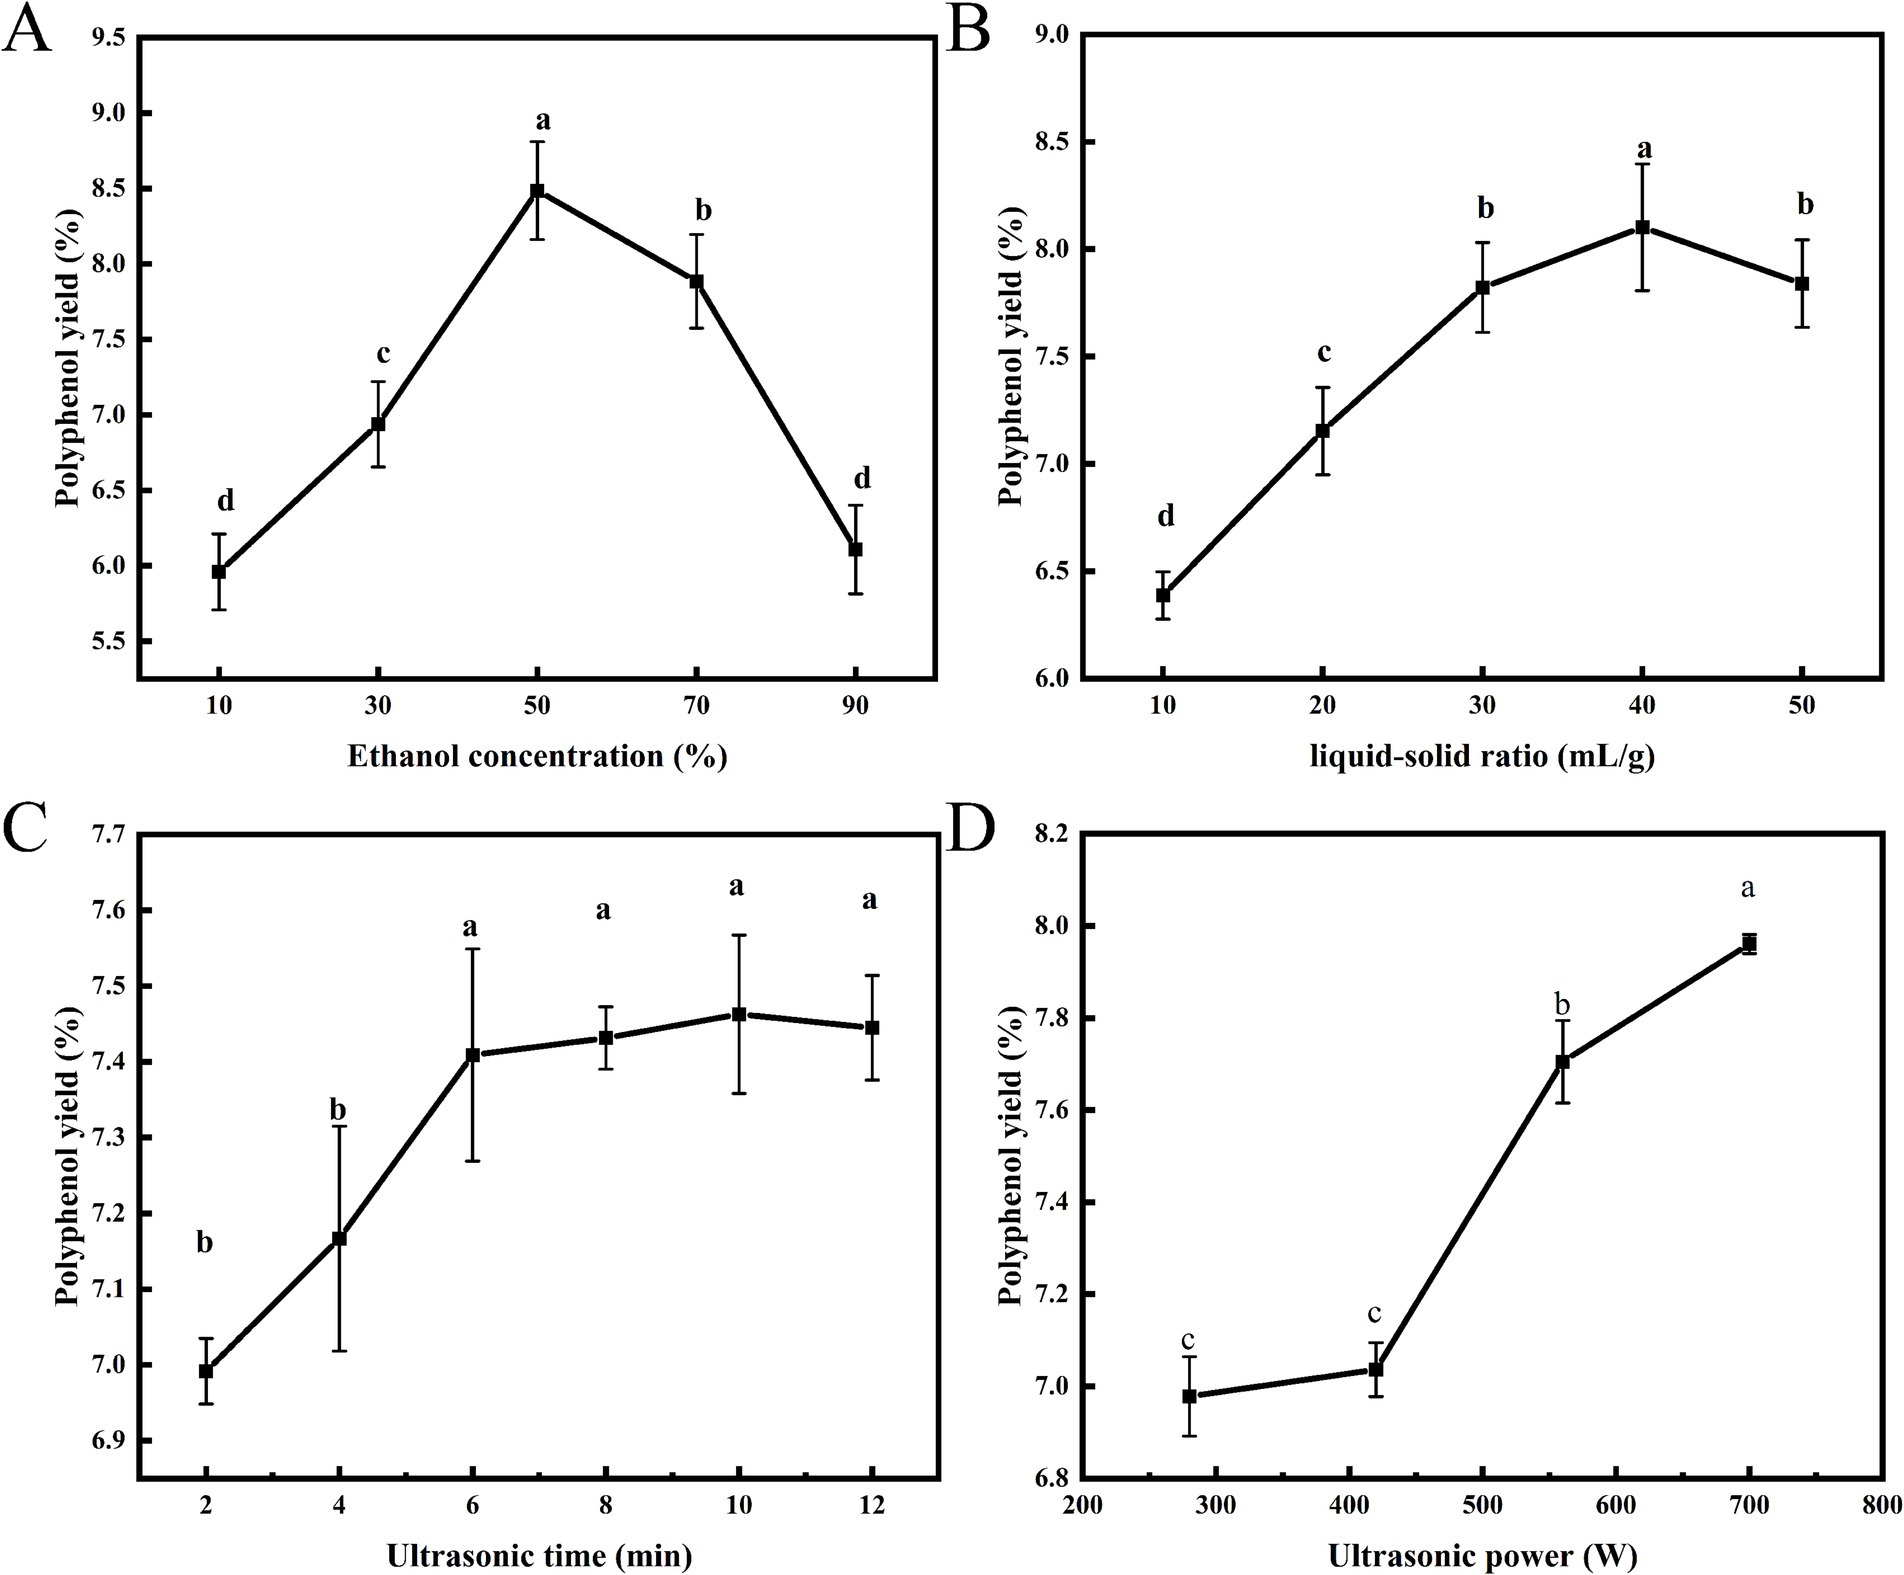
Figure 1. Effects of ethanol concentration (A), liquid–solid ratio (B), ultrasonic time (C) and ultrasonic power (D) on the yield of polyphenols.
3.1.2 The impact of liquid–solid ratio
The efficiency of polyphenol extraction is significantly influenced by the liquid–solid ratio. An inadequate amount of extraction solvent can result in incomplete extraction, while an excessive amount leads to wastage. Consequently, determining an appropriate liquid–solid ratio is essential. Figure 1B illustrated the effect of the liquid–solid ratio on polyphenol yield. As the liquid–solid ratio increased, the yield of polyphenols initially rose, followed by a subsequent decline. At a liquid–solid ratio of 40 mL/g, the maximum yield of polyphenols reached 8.10%. This outcome may be attributed to the increased liquid–solid ratio, which can dilute the concentration of target components in the solution, thereby facilitating the hydration and swelling of honeysuckle leaf powder and promoting the diffusion of constituents within the plant tissue. However, an excessively high liquid–solid ratio may complicate subsequent processing steps, thereby reducing overall efficiency. Similar experimental results have been reported in the extraction of polyphenols from pomegranate flowers (26). Therefore, a liquid–solid ratio of 30–50 mL/g was selected for subsequent RSM studies.
3.1.3 The impact of ultrasonic time
When the ethanol concentration and liquid–solid ratio are held constant, the yield of polyphenols is closely related to ultrasonic time and power. Ultrasonic vibration facilitates the rapid penetration of the solvent into the extract, thereby maximizing the dissolution of polyphenols within the solvent. Figure 1C illustrated the effect of ultrasonic time on the yield of polyphenols. Within the range of 2 to 6 min, the yield of polyphenols significantly increased with the prolongation of ultrasonic time (p < 0.05). After 6 min, the yield of polyphenols tended to level off, with no significant changes (p > 0.05). Prolonging ultrasonic time facilitated the release of active ingredients; however, as time progressed, the osmotic pressure inside and outside the leaves of honeysuckle reached equilibrium, leading to a gradual stabilization of the dissolution rate (27). Although the yield of polyphenols slightly increases with further extension of ultrasonic time, this is unnecessary. Therefore, to reduce energy consumption, ultrasonic time of 4–8 min was selected for optimization studies in subsequent RSM studies.
3.1.4 The impact of ultrasonic power
Ultrasonic waves generate high-frequency vibrations that can create tiny bubbles in solvents, which burst instantaneously, resulting in localized conditions of high temperature and pressure. This phenomenon disrupts cell walls, cell membranes, and other plant cell structures, thereby promoting the release of target compounds from plant tissues into the solvent and enhancing extraction efficiency (28). Figure 1D illustrated the effect of varying ultrasonic power on the yield of polyphenols from honeysuckle leaves. As ultrasonic power increased, the yield of polyphenols also rose, reaching a maximum of 7.96% at 700 W. The progressively enhanced cavitation effect intensifies the energy surrounding the bubbles, making ultrasonic-assisted extraction more effective in disrupting cellular structures compared to conventional methods, thus facilitating the release of polyphenols from honeysuckle leaf powder into the solvent. Therefore, an ultrasonic power range of 420–700 W was selected for subsequent RSM studies.
3.2 RSM optimization of ultrasonic-assisted extraction process
Based on the results of single-factor experiments, an RSM experiment was designed with the yield of polyphenolic extracts Y (%) as the response variable. The experiment consisted of 27 experimental points, including three central points, to optimize the extraction process. The RSM experimental design and results were presented in Table 1.
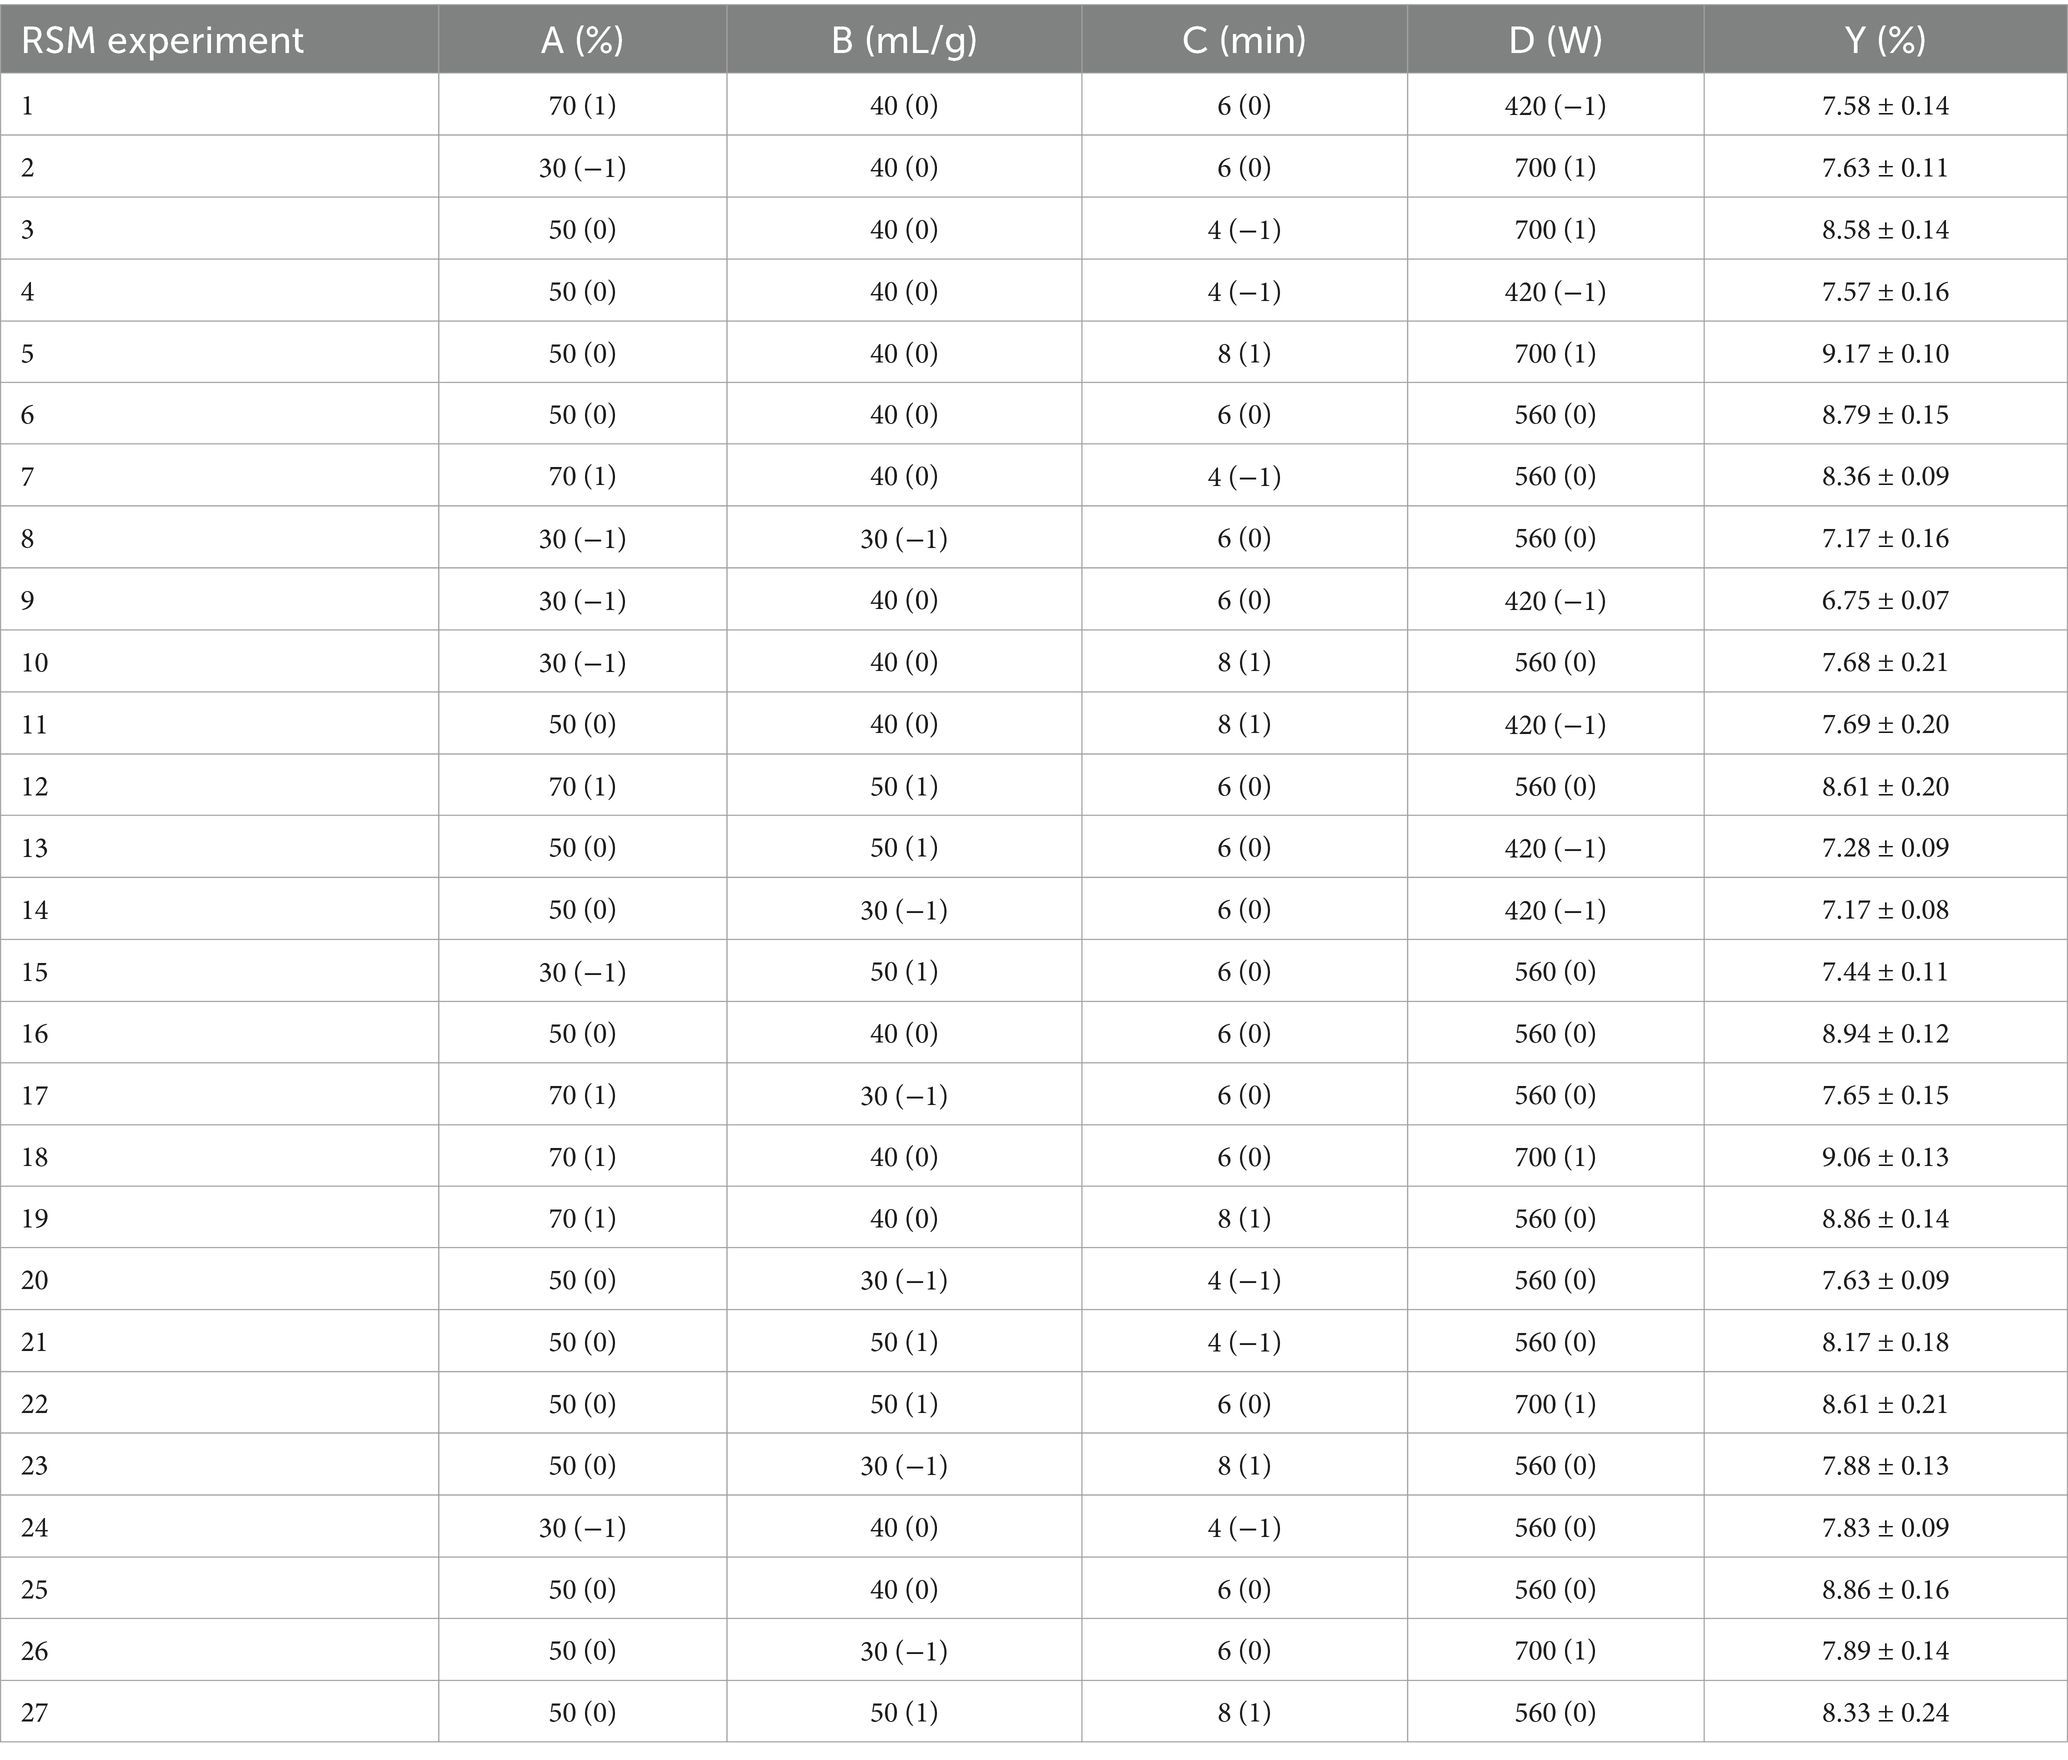
Table 1. RSM experimental design and results.
The results of the ANOVA are presented in Table 2. The model demonstrated high significance (p < 0.0001), while the lack of fit term was not significant (p = 0.2959). The mean square value of the fitted model equation yielded an R2 of 0.9845 and an adjusted R2 of 0.9664. These data indicated that the model fit was adequate to make reasonable predictions within the scope of the experiment. With the yield (Y) as the response variable, the regression equation obtained was: Y = 8.86 + 0.4679A + 0.2553B + 0.1233C + 0.5753D + 0.1699AB + 0.1611 AC + 0.1486 AD − 0.0244 BC + 0.1535BD + 0.1178CD − 0.5455A2 − 0.6450B2 − 0.1538C2 − 0.4994D2. Linear terms (A, B, C, D), interactive terms (AB, AC, AD, BD), and quadratic terms (A2, B2, C2, D2) significantly influenced polyphenol yield (p < 0.05). As shown in Figure 2, to predict the association between the dependent and independent variables, we utilized a regression equation to generate a 3D response surface plot. By comparing F-values and the curvatures of the 3D response surfaces, we determined that the interaction between AB was the most significant, followed by AC.
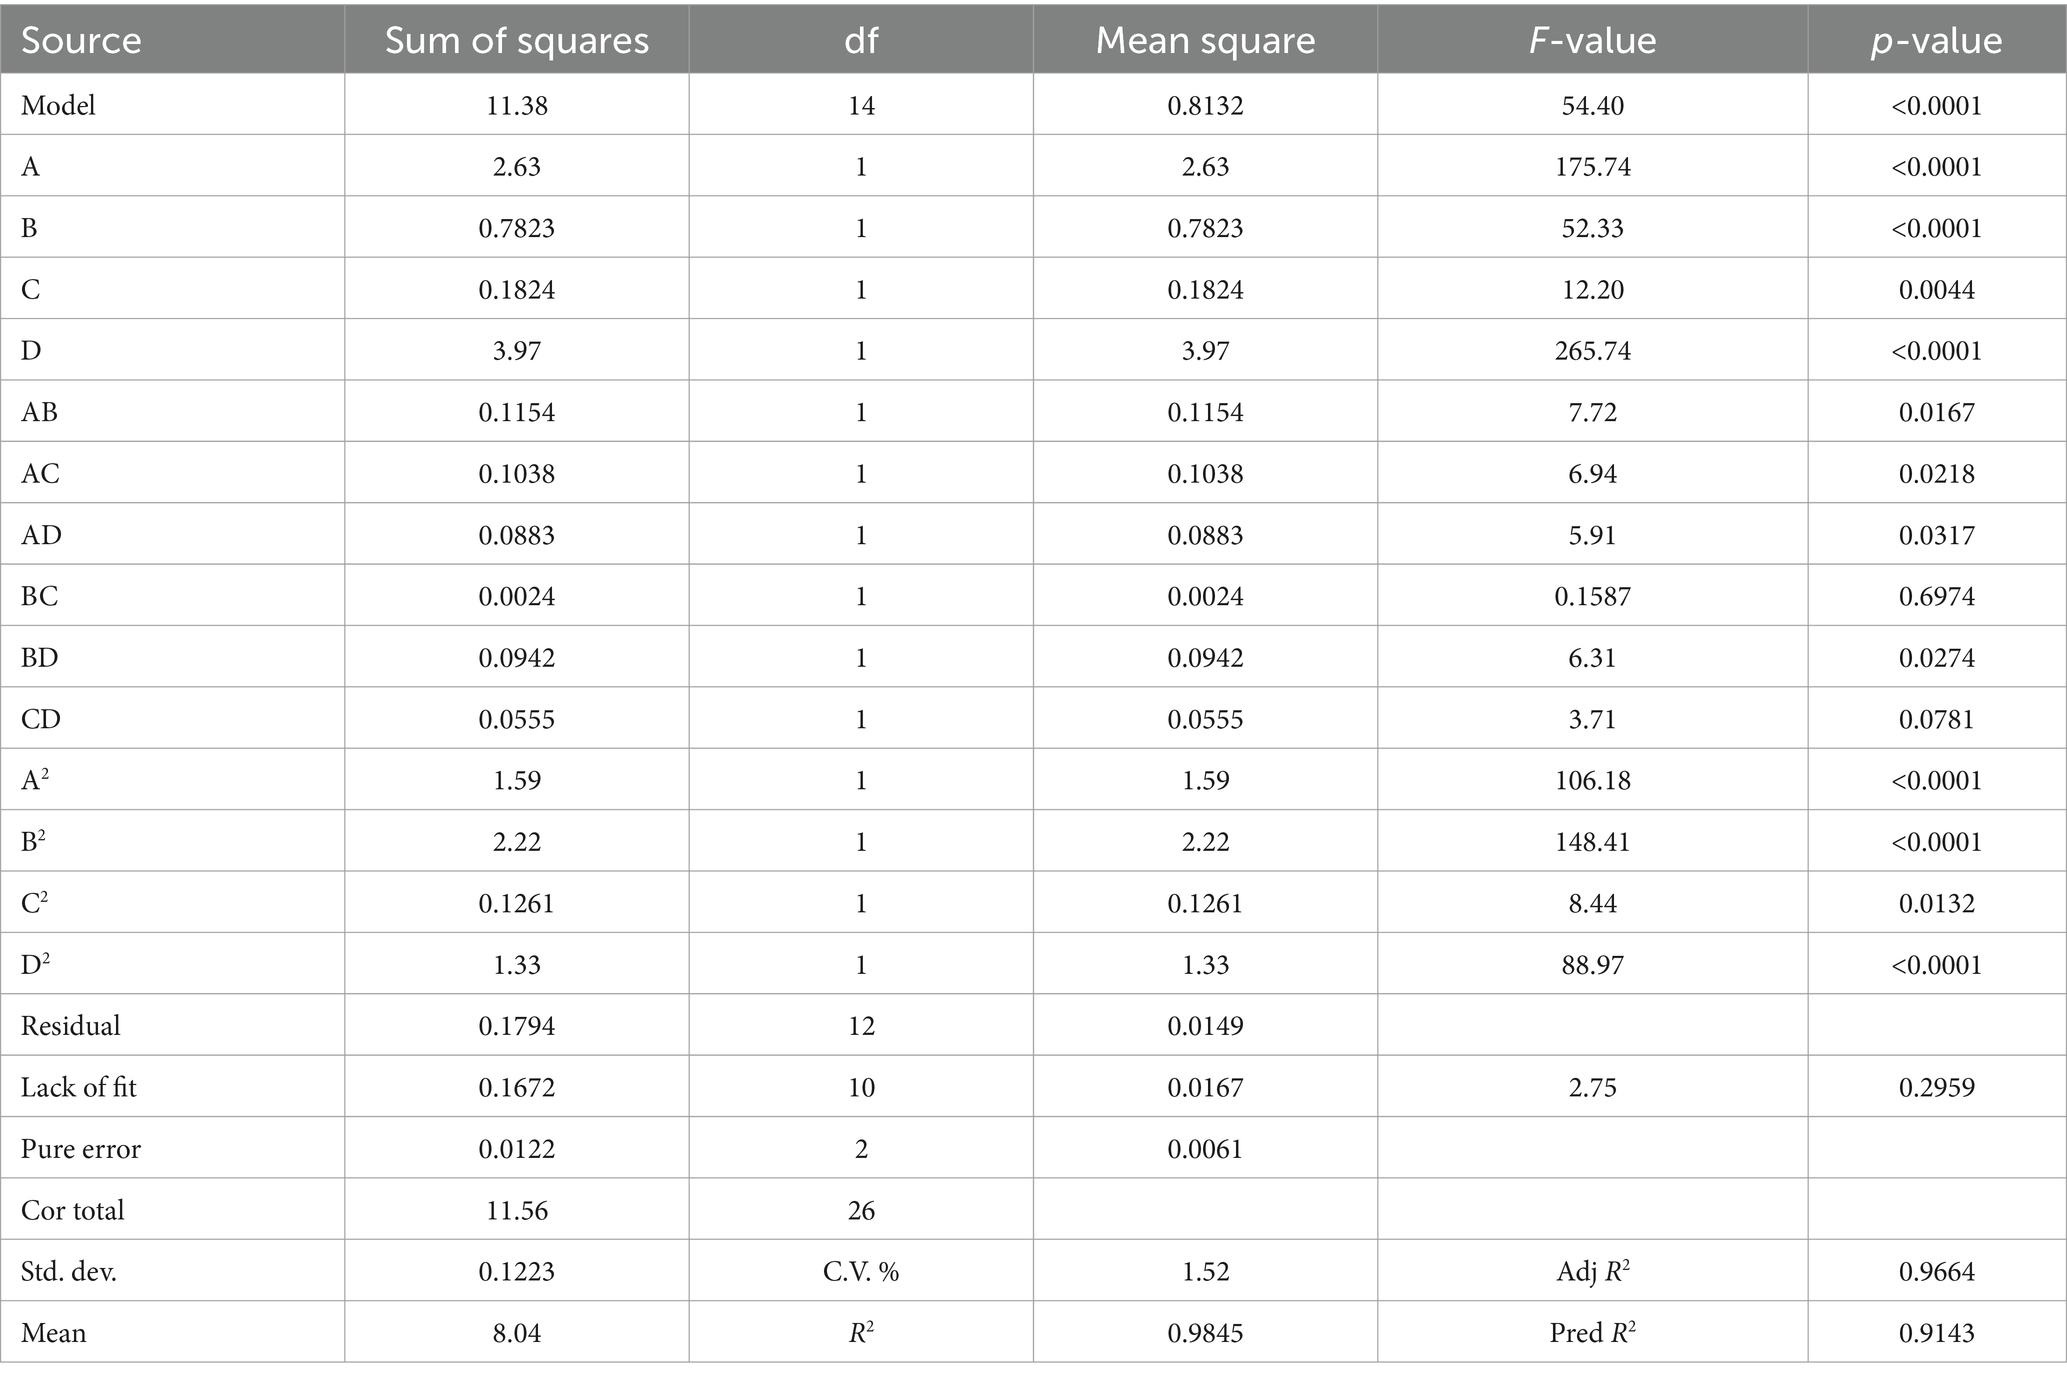
Table 2. Results of analysis of variance.
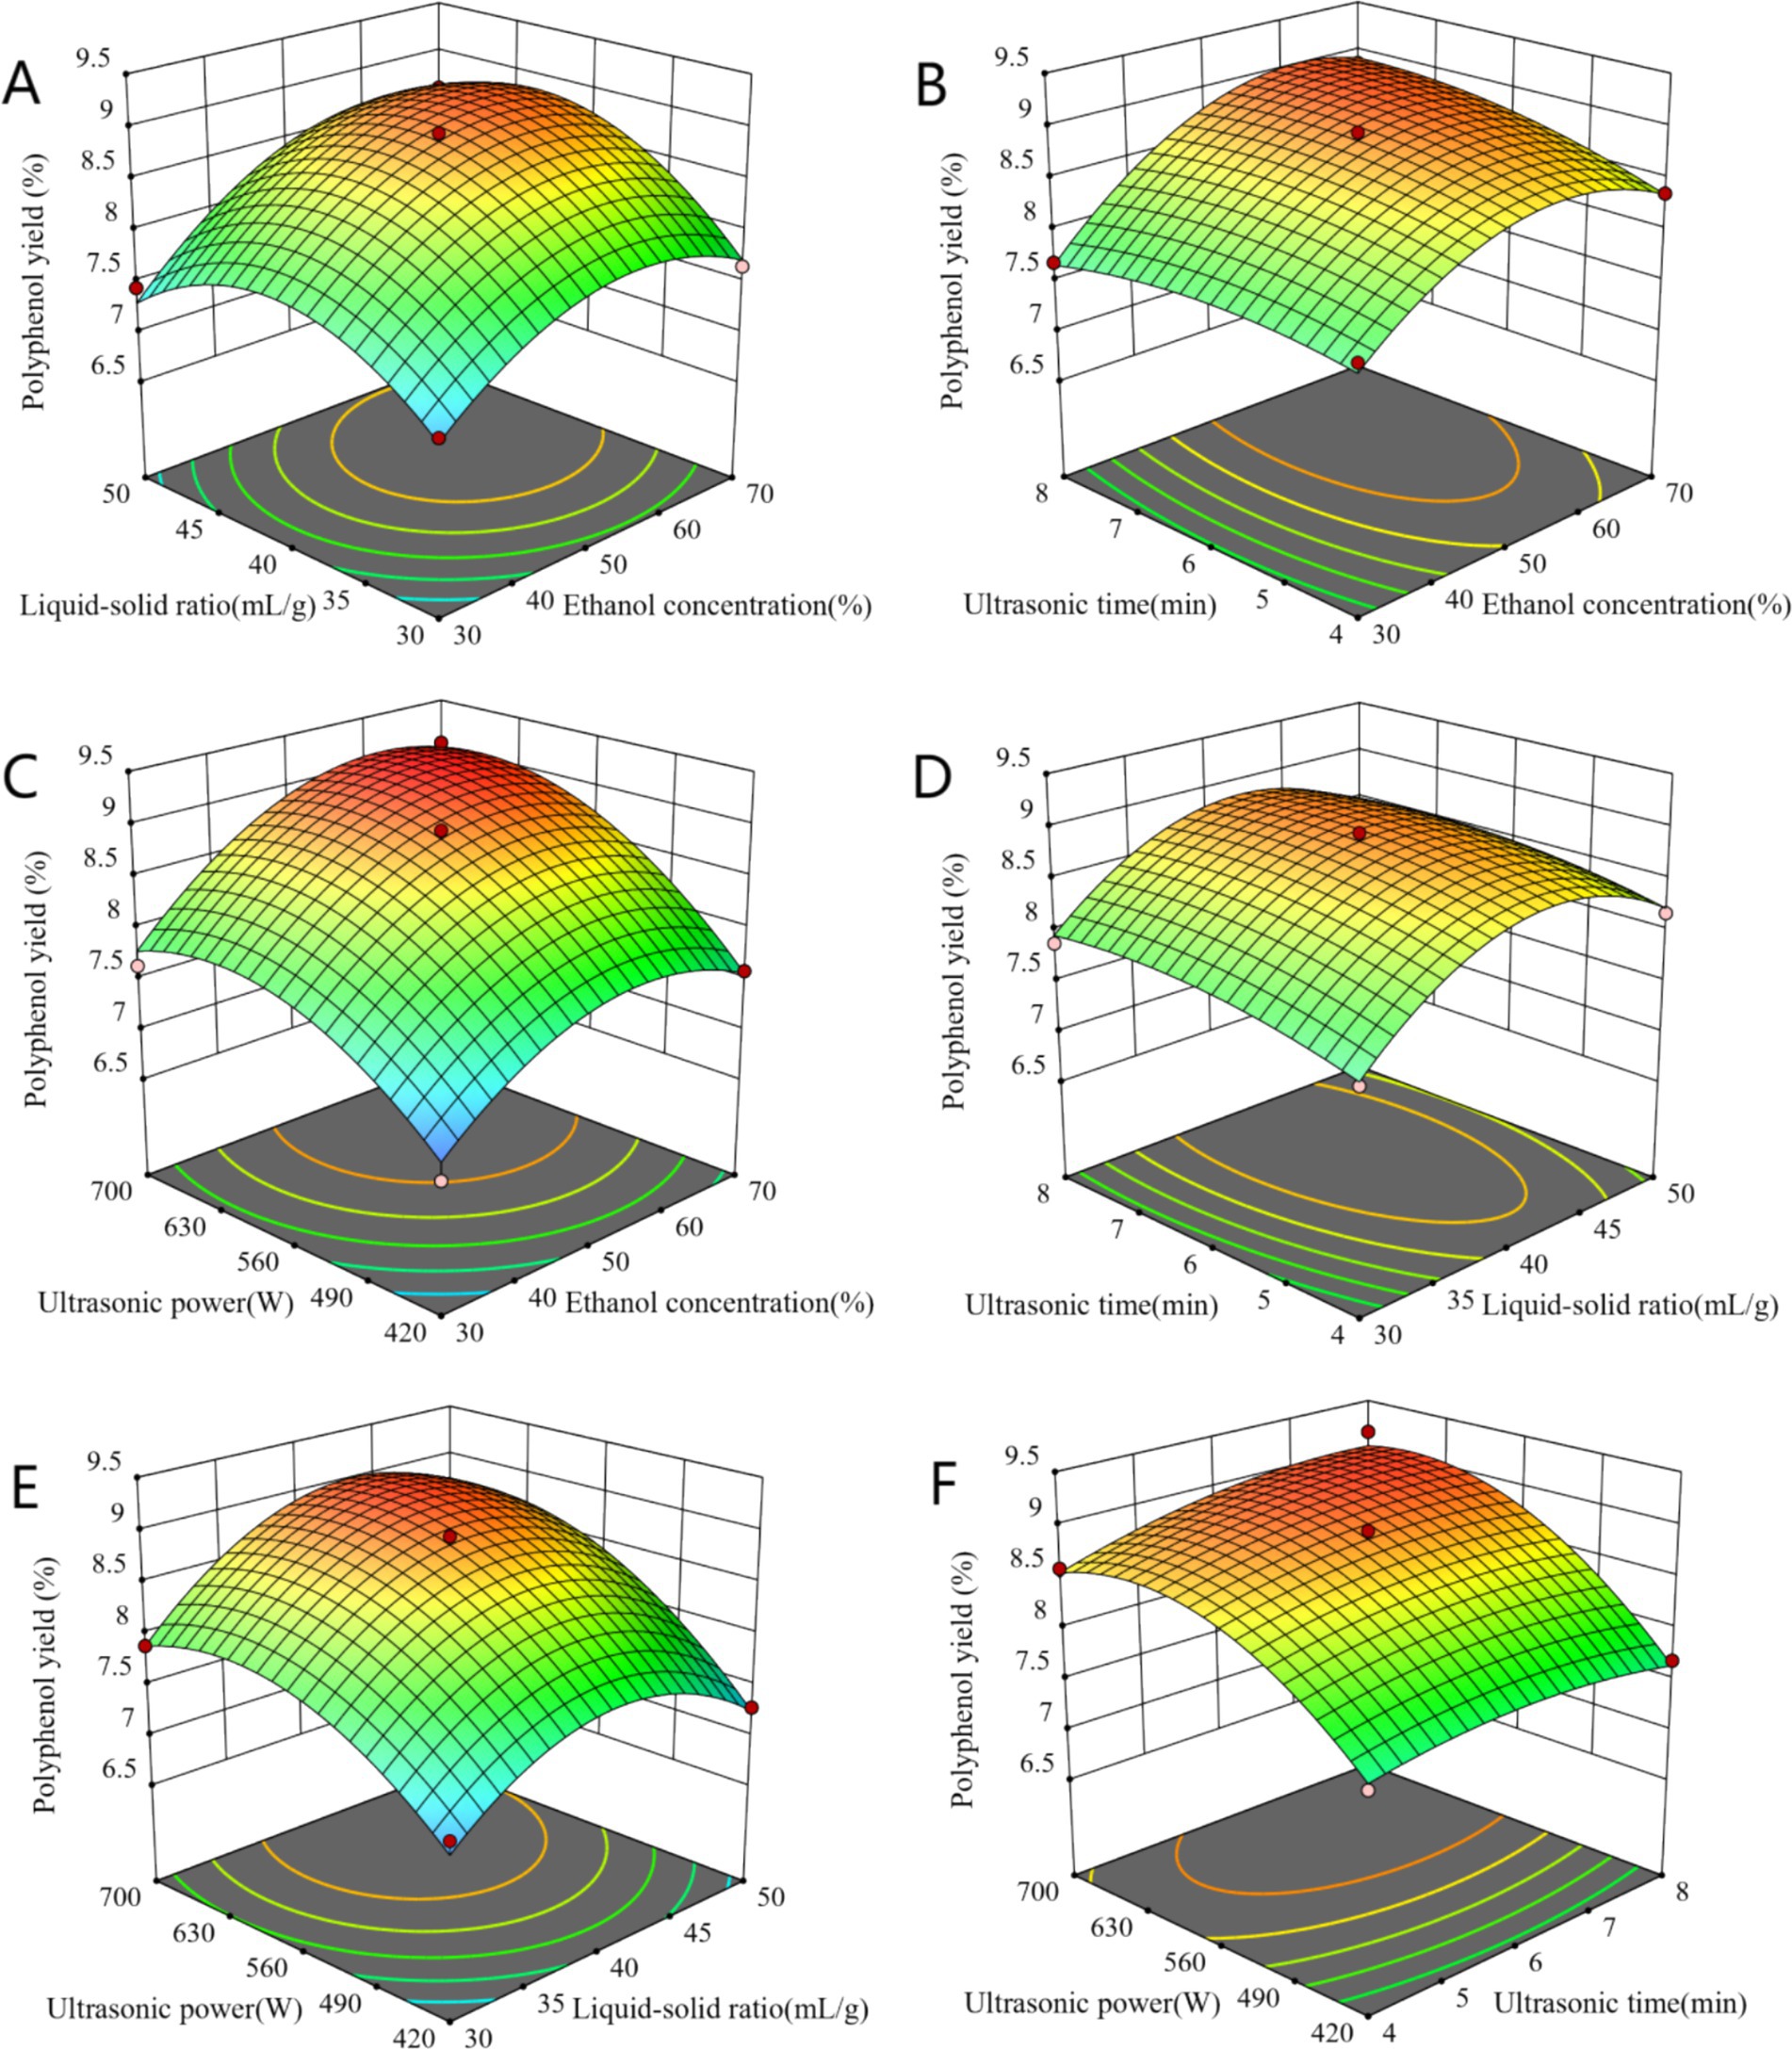
Figure 2. The interaction of ethanol concentration and liquid-solid ratio (A), ethanol concentration and ultrasonic time (B), ethanol concentration and ultrasonic power (C), liquid-solid ratio and ultrasonic time (D), liquid-solid ratio and ultrasonic power (E), ultrasonic time and ultrasonic power (F) on polyphenol yield.
Based on the experimental results, the optimal extraction conditions were predicted using a second-order polynomial equation: ethanol concentration of 63.5%, liquid–solid ratio of 45.4 mL/g, ultrasonic time of 5.69 min, and ultrasonic power of 670.9 W. To facilitate practical applications, validation experiments were conducted under the following conditions: ethanol concentration of 64%, liquid–solid ratio of 45 mL/g, ultrasonic time of 6 min, and ultrasonic power of 700 W. The repeated experiments yielded a polyphenol extraction rate of 9.16 ± 0.19%, which closely approximated the predicted value of 9.18%, thereby confirming the reliability of the model.
3.3 Analysis of total phenol, chlorogenic acid and luteoloside content
Honeysuckle is abundant in bioactive compounds, primarily phenolic acids and flavonoids. Among these, chlorogenic acid is the most prominent phenolic acid, while luteoloside is the principal flavonoid (29, 30). According to the Chinese Pharmacopoeia, these two polyphenolic compounds are not only the primary active constituents of honeysuckle but also serve as quality control markers for this herb. As shown in Figure 3, the primary polyphenolic compounds identified in the leaf extracts were chlorogenic acid and luteoloside. As indicated in Table 3, the total phenolic content of honeysuckle leaves was measured at 20.6 ± 0.67%. The chlorogenic acid content in the extract was found to be 5.65 ± 0.40%, while the luteoloside content was 2.51 ± 0.14%. Yue et al. (29) reported that the leaves and buds of honeysuckle are rich in medicinal components, which can be utilized as raw materials for the extraction of chlorogenic acid and luteoloside, thus preventing waste.
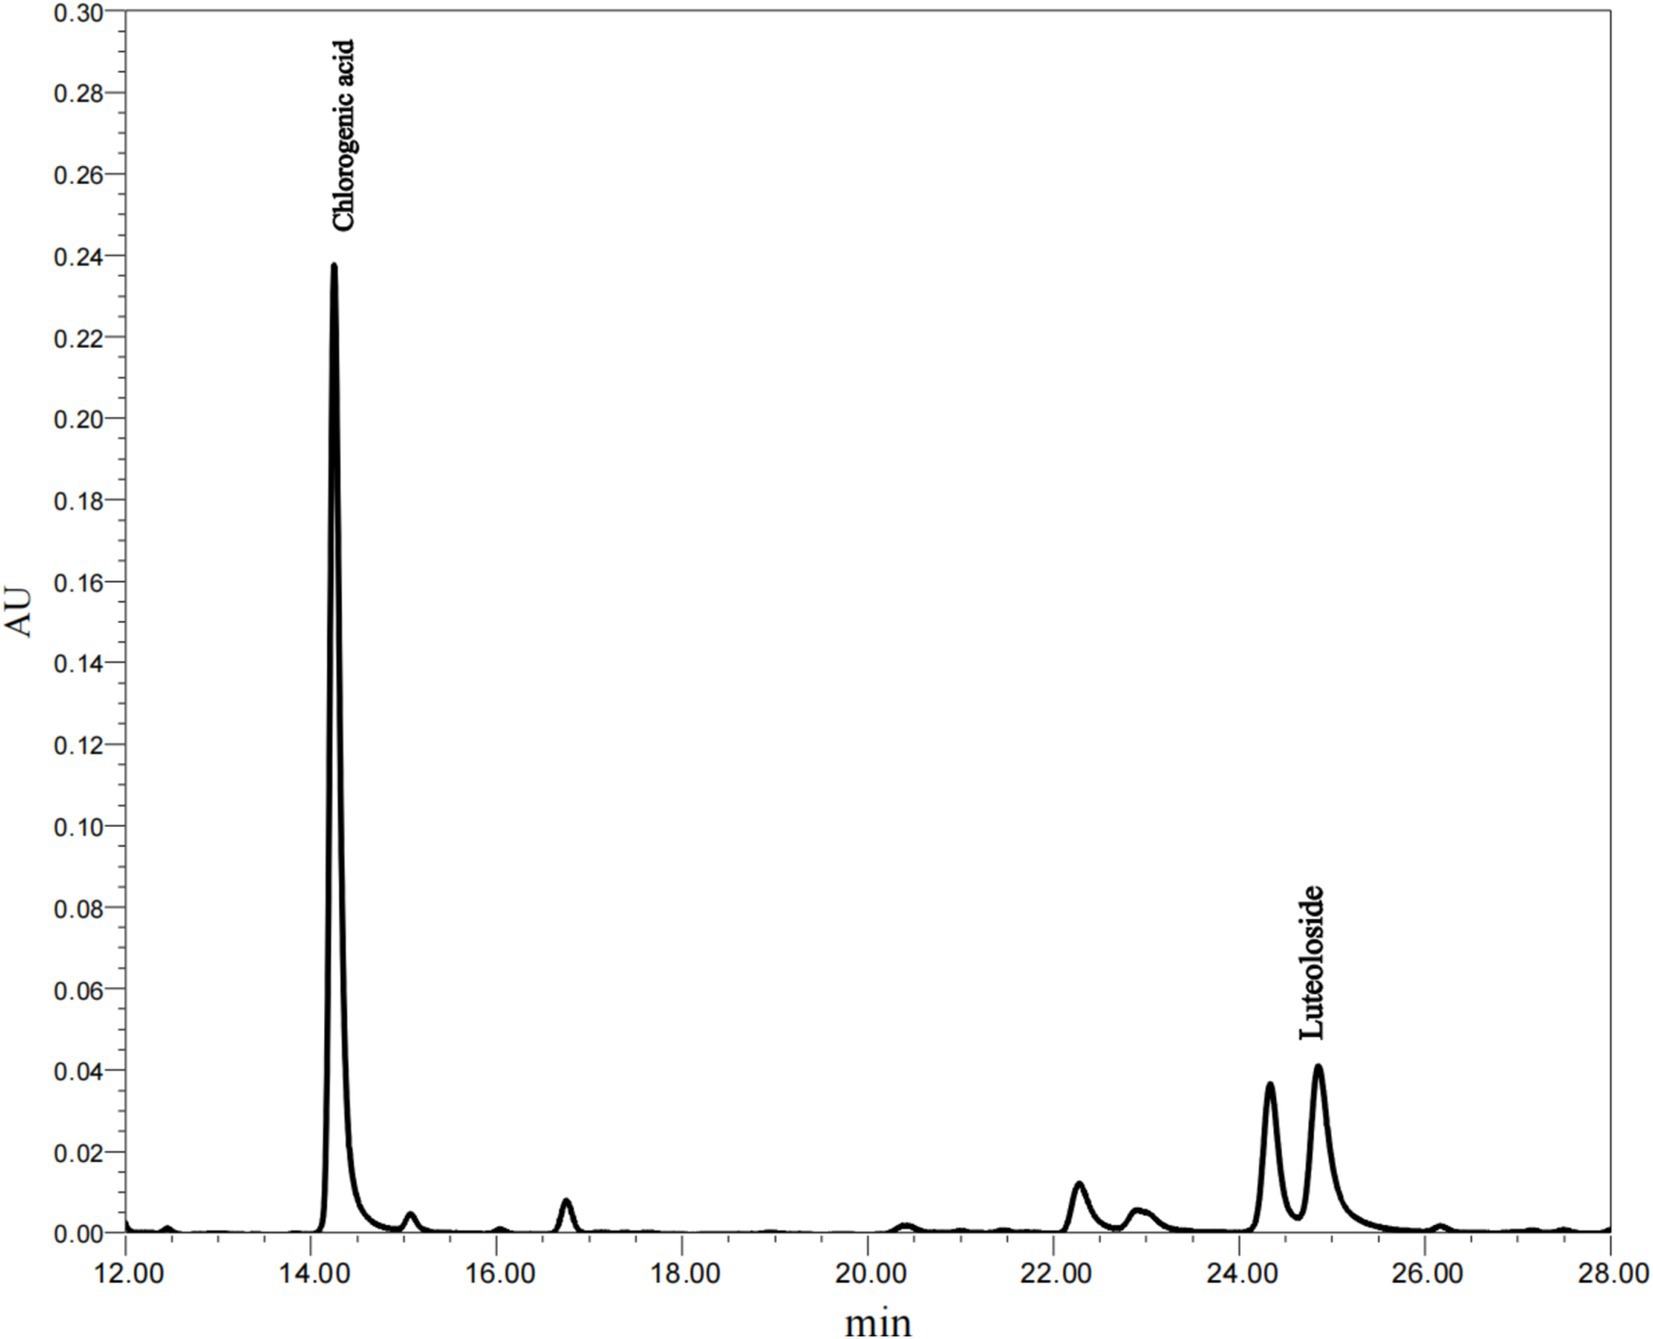
Figure 3. HPLC profile of the polyphenol extract.
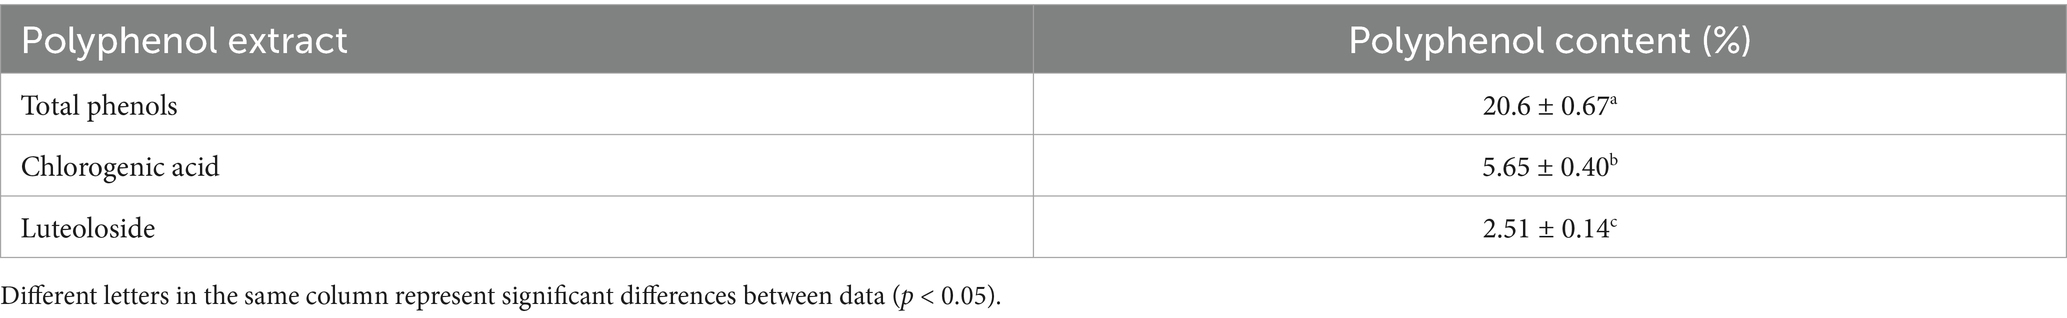
Table 3. The polyphenol content of extract.
3.4 The inhibitory effect on α-glucosidase
The analysis of the polyphenolic composition revealed that the extracts from the leaves of honeysuckle predominantly comprised chlorogenic acid and luteoloside, along with other polyphenolic compounds. Previous pharmacological studies have demonstrated that chlorogenic acid possesses significant antioxidant, anti-inflammatory, and antibacterial properties without any cytotoxicity (31–33), while luteoloside exhibits notable neuroprotective effects (34). These polyphenolic compounds from honeysuckle leaves (chlorogenic acid and luteoloside) exhibit favorable biological properties, which are consistent with the requirements for developing α-glucosidase inhibitors. Consequently, this study selected chlorogenic acid as a positive control to examine the inhibitory effects of polyphenol extracts on α-glucosidase. As illustrated in Figure 4, the inhibition rates of chlorogenic acid and honeysuckle leaf polyphenol extracts on α-glucosidase were significantly and positively correlated with their concentrations, indicating that both compounds exhibited pronounced dose-dependent inhibitory effects. The increase in polyphenol content diminished the binding of α-glucosidase to the substrate PNPG, thereby preventing the formation of the colored product, p-nitrophenol, and consequently exerting an inhibitory effect. Through fitting calculations, the IC50 values for chlorogenic acid and polyphenol extracts were determined to be 0.55 ± 0.02 mg/mL and 0.14 ± 0.01 mg/mL. Puspitasari et al. (35) determined the IC50 of acarbose, a commonly used anti-diabetic drug, to be 2.4 ± 0.2 mg/mL. Therefore, the polyphenolic extract from the leaves of honeysuckle presents a promising potential as an α-glucosidase inhibitor, with valuable applications in functional foods and pharmaceuticals.
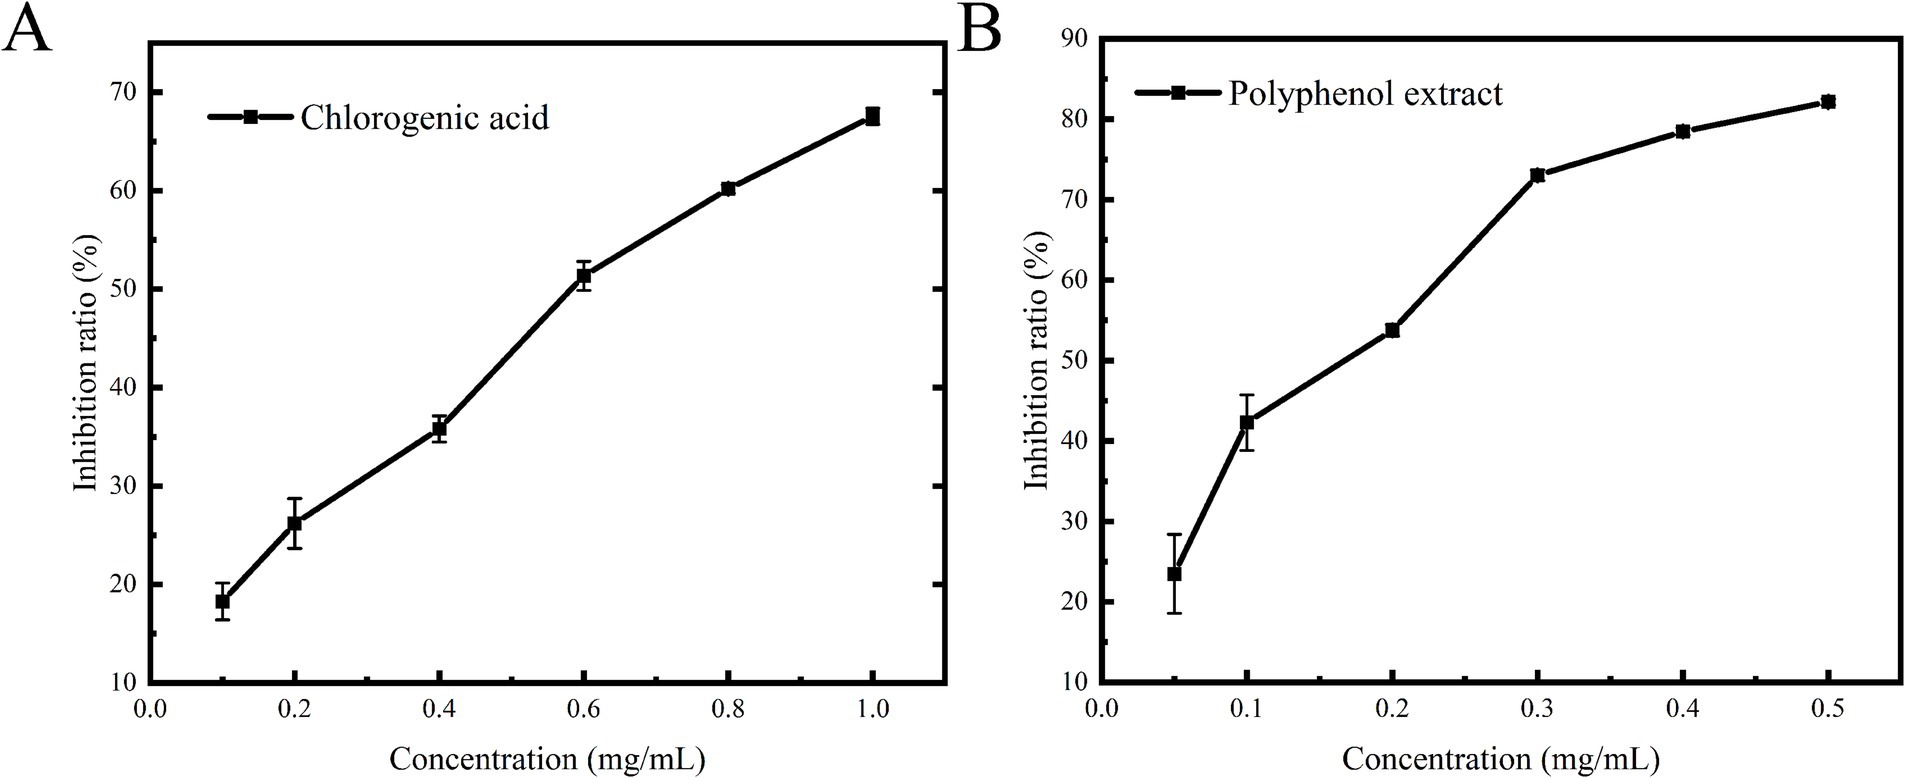
Figure 4. Effects of chlorogenic acid (A) and polyphenol extract (B) on α-glucosidase inhibition.
3.5 Combing behavioral analysis
Fluorescence spectroscopy serves as an effective technique for investigating the interactions between small drug molecules and enzymes. These interactions can modify the microenvironment of amino acid residues, resulting in changes in fluorescence intensity. As illustrated in Figure 5, when the excitation wavelength was set to 280 nm, the fluorescence spectra of the tyrosine and tryptophan residues of the enzyme were recorded. Following the addition of polyphenol extracts, a consistent decrease in the fluorescence intensity of the enzyme was observed. Notably, α-glucosidase displayed a characteristic fluorescence absorption peak at 338 nm; as the concentration of polyphenol extract increased, the fluorescence spectrum exhibited a red shift. This observation indicates that an interaction occurred between the enzyme and the polyphenol extracts, leading to alterations in the microenvironment of the amino acid residues. Liu et al. (36) demonstrated in their experiments that this alteration may hinder the binding of α-glucosidase to its substrate, thereby reducing enzyme activity and effectively lowering postprandial hyperglycemia.
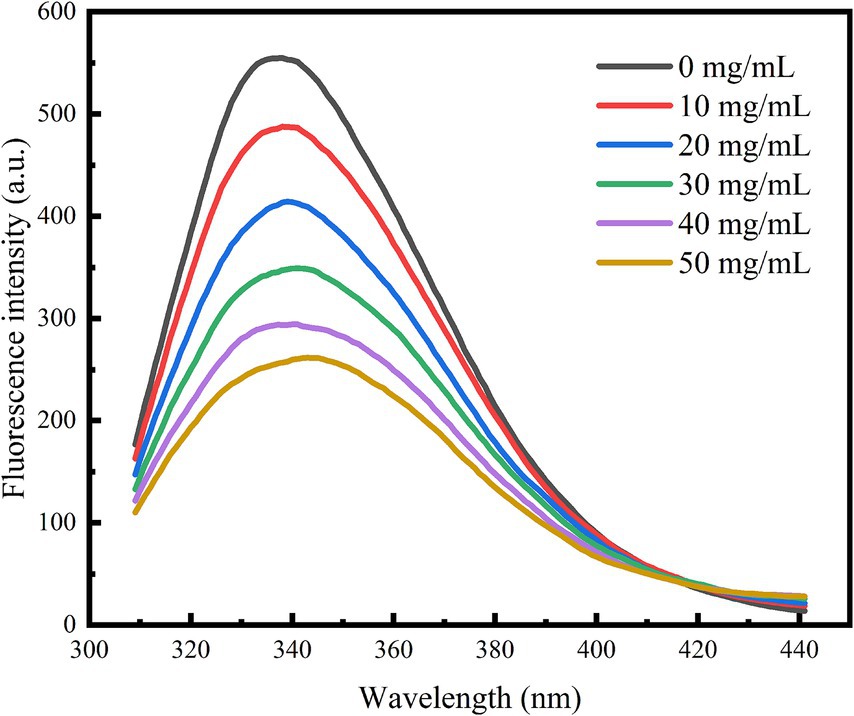
Figure 5. Effect of polyphenol extract on fluorescence spectra of α-glucosidase.
3.6 Synchronous fluorescence spectroscopy analysis
By setting Δλ to 15 nm and 60 nm, the characteristic fluorescence peaks of tyrosine and tryptophan residues were identified. As illustrated in Figure 6, the synchronous fluorescence spectra of these two amino acid residues exhibit a consistent decrease with increasing concentrations of polyphenol extract. The fluorescence intensity of tryptophan was greater than that of tyrosine, and its quenching rate was also faster, which aligns with findings from previous studies (37). Notably, the characteristic peak of tyrosine underwent significant alterations, suggesting that the polyphenol extract interacts with α-glucosidase, leading to changes in the microenvironment of the amino acid residues. Consequently, it can be inferred that the polyphenolic extract from honeysuckle may bind to the active site or adjacent regions of α-glucosidase, inducing conformational changes in the enzyme. This binding likely prevents the substrate from entering the active site, thereby exerting an inhibitory effect on α-glucosidase and resulting in a decrease in its activity.
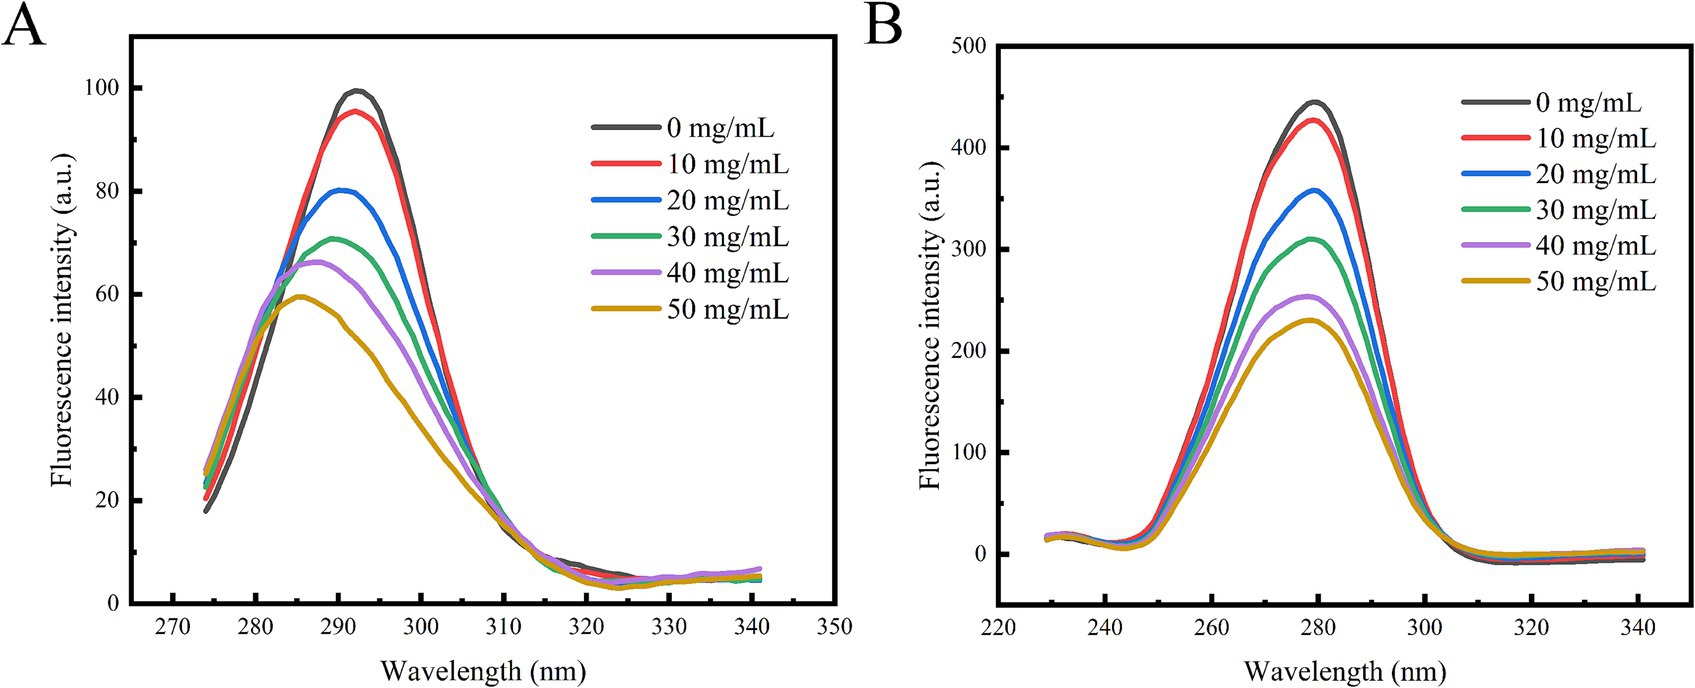
Figure 6. Effect of polyphenol extract on synchronous fluorescence spectra of α-glucosidase. (A) The synchronous spectrum at Δλ = 15 nm. (B) The synchronous spectrum at Δλ = 60 nm.
3.7 3D fluorescence spectroscopy analysis
Three-dimensional fluorescence spectroscopy was employed to further investigate the conformational changes of α-glucosidase induced by polyphenol extracts. As illustrated in Figure 7A, the 3D fluorescence spectrum of α-glucosidase displayed two characteristic peaks. Peak 1 (λEX/λEM = 225 nm/338 nm) corresponded to the spectral behavior resulting from n → π* transitions within the polypeptide backbone structure (38), whereas Peak 2 (λEX/λEM = 280 nm/336 nm) represented the fluorescence spectra of tyrosine and tryptophan residues (39). Following the complexation with polyphenol extracts, the fluorescence intensities of both Peak 1 and Peak 2 were significantly diminished, as depicted in Figure 7B. The emission wavelengths of Peak 1 and Peak 2 both exhibited a slight redshift, with Peak 1 shifting from 338 nm to 400 nm and Peak 2 from 336 nm to 338 nm. These results further corroborated the interaction between the polyphenol extracts and α-glucosidase, indicating that the polyphenol extracts bind to regions near the tryptophan and tyrosine residues, thereby influencing the conformational structure of the enzyme’s polypeptide chain.
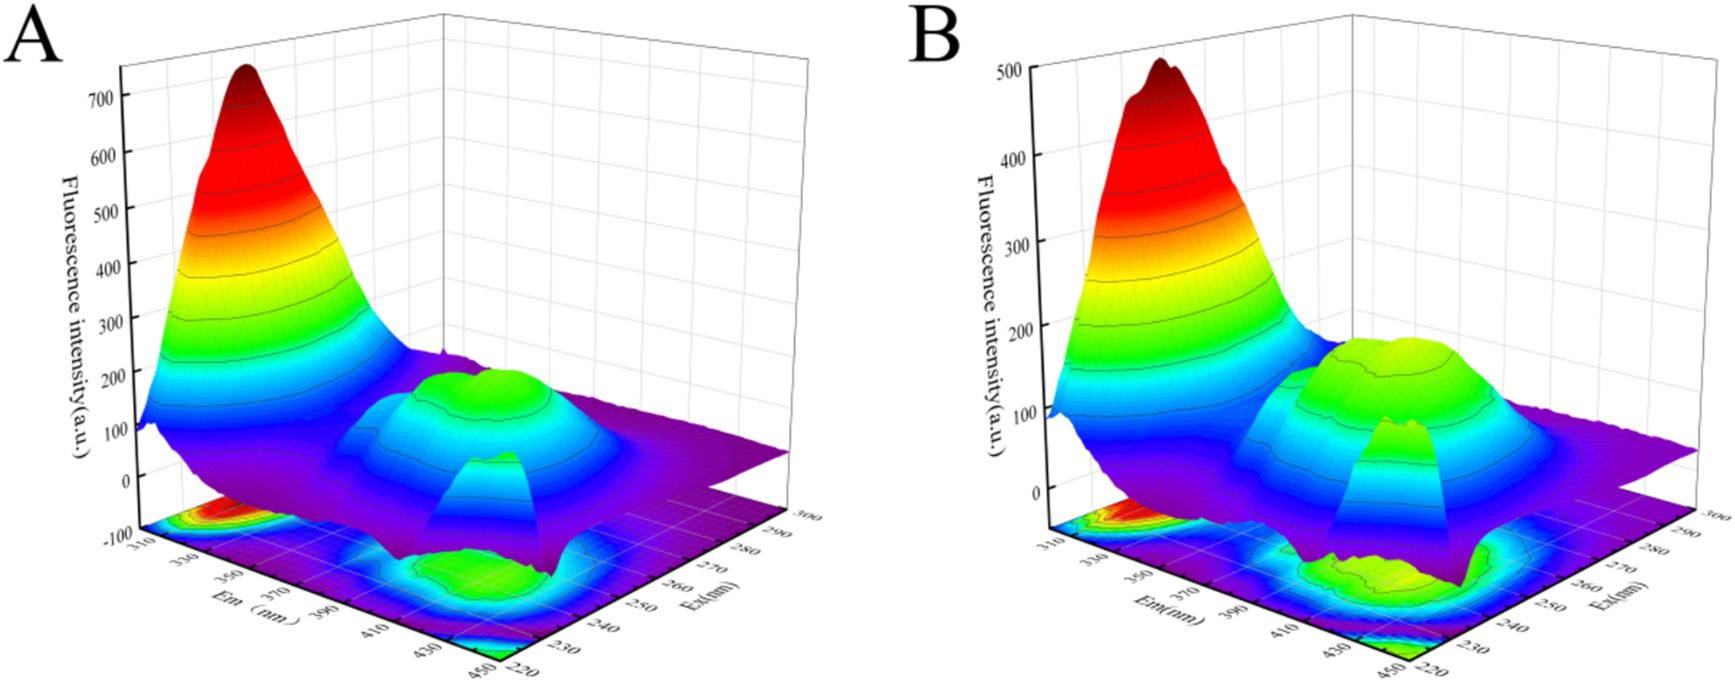
Figure 7. Effect of polyphenol extract on three-dimensional fluorescence spectra of α-glucosidase. (A) Three-dimensional fluorescence spectra of α-glucosidase. (B) Three-dimensional fluorescence spectra of α-glucosidase after addition of polyphenol extract.
4 Conclusion
This study utilized ultrasound-assisted extraction to obtain polyphenols from honeysuckle leaves. The optimal extraction conditions were identified as an ethanol concentration of 64%, a liquid–solid ratio of 45 mL/g, an ultrasonic time of 6 min, and an ultrasonic power of 700 W. The actual yield of polyphenols was 9.16 ± 0.19%, which closely approximated the predicted value of 9.18%. The total phenolic content of the extracts was measured at 20.6 ± 0.67%, with chlorogenic acid and luteoloside contents recorded at 5.65 ± 0.40% and 2.51 ± 0.14%, respectively. The polyphenol extract demonstrated significant α-glucosidase inhibitory activity (IC50, 0.14 ± 0.01 mg/mL), surpassing that of chlorogenic acid (IC50, 0.55 ± 0.02 mg/mL). Fluorescence quenching experiments indicated that the polyphenol extracts interacted with α-glucosidase, modifying its microenvironment and reducing its substrate binding, thereby effectively mitigating postprandial hyperglycemia. This experiment laid the foundation for the study of honeysuckle leaf polyphenols, and further in-depth research on the biological activity and potential synergistic effect of its polyphenol compounds can be carried out in the future.
Data availability statement
The original contributions presented in the study are included in the article/supplementary material, further inquiries can be directed to the corresponding author.
Author contributions
GL: Data curation, Formal analysis, Investigation, Methodology, Validation, Visualization, Writing – original draft, Writing – review & editing. CB: Formal analysis, Investigation, Methodology, Writing – original draft, Writing – review & editing. HZ: Funding acquisition, Methodology, Resources, Supervision, Writing – original draft, Writing – review & editing. LB: Conceptualization, Investigation, Methodology, Project administration, Resources, Software, Supervision, Validation, Visualization, Writing – original draft, Writing – review & editing.
Funding
The author(s) declare that financial support was received for the research, authorship, and/or publication of this article. This work was supported by the Key Research and Development Program Project of Shaanxi Province of China (No. 2023-YBNY-190).
Acknowledgments
The authors thank the participants and professionals involved in this study.
Conflict of interest
The authors declare that the research was conducted in the absence of any commercial or financial relationships that could be construed as a potential conflict of interest.
Generative AI statement
The authors declare that no Gen AI was used in the creation of this manuscript.
Publisher’s note
All claims expressed in this article are solely those of the authors and do not necessarily represent those of their affiliated organizations, or those of the publisher, the editors and the reviewers. Any product that may be evaluated in this article, or claim that may be made by its manufacturer, is not guaranteed or endorsed by the publisher.
References
1. Li, Y, Mitchell, W, Elze, T, and Zebardast, N. Association between diabetes, diabetic retinopathy, and glaucoma. Curr Diab Rep. (2021) 21:38. doi: 10.1007/s11892-021-01404-5
2. Hamed, AE, Elsahar, M, Elwan, NM, EI-Nakeep, S, Naguib, M, and Soliman, HH. Managing diabetes and liver disease association. Arab J Gastroenterol. (2018) 19:166–79. doi: 10.1016/j.ajg.2018.08.003
3. Pecoits, R, Abensur, H, Betônico, CCR, Machado, AD, Parente, EB, and Queiroz, M. Interactions between kidney disease and diabetes: dangerous liaisons. Diabetol Metab Syndr. (2016) 8:50. doi: 10.1186/s13098-016-0159-z
4. Obrosova, IG. Diabetes and the peripheral nerve. Biochim Biophys Acta. (2009) 1792:931–40. doi: 10.1016/j.bbadis.2008.11.005
5. Marwick, TH, Ritchie, R, Shaw, JE, and Kaye, D. Implications of underlying mechanisms for the recognition and management of diabetic cardiomyopathy. J Am Coll Cardiol. (2018) 71:339–51. doi: 10.1016/j.jacc.2017.11.019
6. Chen, R, Ovbiagele, B, and Feng, W. Diabetes and stroke: epidemiology, pathophysiology, pharmaceuticals and outcomes. Am J Med Sci. (2016) 351:380–6. doi: 10.1016/j.amjms.2016.01.011
7. Zhao, XH, Tao, JH, Zhang, T, Jiang, S, Wei, W, Han, H, et al. Resveratroloside alleviates postprandial hyperglycemia in diabetic mice by competitively inhibiting α-glucosidase. J Agric Food Chem. (2019) 67:2886–93. doi: 10.1021/acs.jafc.9b00455
8. Bonora, E, and Muggeo, M. Postprandial blood glucose as a risk factor for cardiovascular disease in type II diabetes: the epidemiological evidence. Diabetologia. (2001) 44:2107–14. doi: 10.1007/s001250100020
9. Tundis, R, Loizzo, MR, and Menichini, F. Natural products as α-amylase and α-glucosidase inhibitors and their hypoglycaemic potential in the treatment of diabetes: an update. Mini Rev Med Chem. (2010) 10:315–31. doi: 10.2174/138955710791331007
10. Džamić, AM, and Matejić, JS. Plant products in the prevention of diabetes mellitus. Mini Rev Med Chem. (2022) 22:1395–419. doi: 10.2174/1389557521666211116122232
11. Li, YK, Xie, L, Liu, K, Li, XF, and Xie, F. Bioactive components and beneficial bioactivities of flowers, stems, leaves of L. japonica Thunberg: a review. Biochem Syst Ecol. (2023) 106:104570. doi: 10.1016/j.bse.2022.104570
12. Li, RJ, Kuang, XP, Wang, WJ, Wan, CP, and Li, WX. Comparison of chemical constitution and bioactivity among different parts of L. japonica Thunb. J Sci Food Agric. (2020) 100:614–22. doi: 10.1002/jsfa.10056
13. Agunloye, OM, Oboh, G, Ademiluyi, AO, Ademosun, AO, Akindahunsi, AA, Oyagbemi, AA, et al. Cardio-protective and antioxidant properties of caffeic acid and chlorogenic acid: mechanistic role of angiotensin converting enzyme, cholinesterase and arginase activities in cyclosporine induced hypertensive rats. Biomed Pharmacother. (2019) 109:450–8. doi: 10.1016/j.biopha.2018.10.044
14. Tunnicliffe, JM, Eller, LK, Reimer, RA, Hittel, DS, and Shearer, J. Chlorogenic acid differentially affects postprandial glucose and glucose-dependent insulinotropic polypeptide response in rats. Appl Physiol Nutr Metab. (2011) 36:650–9. doi: 10.1139/h11-072
15. Cheng, X, Zhang, F, Li, JW, and Wang, G. Luteoloside attenuates cerebral ischemia/reperfusion injury in rats via anti-apoptotic, anti-oxidant, and anti-inflammatory mechanisms. Neuropsychiatr Dis Treat. (2019) 15:2671–80. doi: 10.2147/NDT.S215263
16. Pimpley, VA, and Murthy, PS. Influence of green extraction techniques on green coffee: nutraceutical compositions, antioxidant potential and in vitro bio-accessibility of phenolics. Food Biosci. (2021) 43:101284. doi: 10.1016/j.fbio.2021.101284
17. Jang, S, Lee, AY, Lee, AR, Choi, G, and Kim, HK. Optimization of ultrasound-assisted extraction of glycyrrhizic acid from licorice using response surface methodology. Integr Med Res. (2017) 6:388–94. doi: 10.1016/j.imr.2017.08.003
18. Xu, DP, Zheng, J, Zhou, Y, Li, Y, Li, S, and Li, HB. Ultrasound-assisted extraction of natural antioxidants from the flower of Limonium sinuatum: optimization and comparison with conventional methods. Food Chem. (2017) 217:552–9. doi: 10.1016/j.foodchem.2016.09.013
19. Guo, C, Han, F, Geng, S, Shi, Y, Ma, HJ, and Liu, BG. The physicochemical properties and Pickering emulsifying capacity of acorn starch. Int J Biol Macromol. (2023) 239:124289. doi: 10.1016/j.ijbiomac.2023.124289
20. Li, J, Wang, Y, Xue, J, Wang, P, and Shi, S. Dietary exposure risk assessment of flonicamid and its effect on constituents after application in Lonicerae Japonicae Flos. Chem Pharm Bull. (2018) 66:608–11. doi: 10.1248/cpb.c17-00985
21. Geng, S, Chen, YS, Abbasi, AM, Ma, HJ, Mo, HZ, and Liu, BG. Tannin fraction from Ampelopsis grossedentata leaves tea (Tengcha) as an antioxidant and α-glucosidase inhibitory nutraceutical. Int J Food Sci Technol. (2016) 51:2692–700. doi: 10.1111/ijfs.13259
22. He, C, Bai, L, Liu, D, and Liu, B. Interaction mechanism of okra (Abelmoschus esculentus L.) seed protein and flavonoids: fluorescent and 3D-QSAR studies. Food Chem X. (2023) 20:101023. doi: 10.1016/J.FOCHX.2023.101023
23. Martínez-patiño, JC, Gullón, B, Romero, I, Ruiz, E, Brncic, M, Zlabur, JS, et al. Optimization of ultrasound-assisted extraction of biomass from olive trees using response surface methodology. Ultrason Sonochem. (2019) 51:487–95. doi: 10.1016/j.ultsonch.2018.05.031
24. Zhou, Y, Xu, XY, Gan, RY, Zheng, J, Li, Y, Zhang, JJ, et al. Optimization of ultrasound-assisted extraction of antioxidant polyphenols from the seed coats of red sword bean (Canavalia gladiate (Jacq.) DC.). Antioxidants. (2019) 8:200. doi: 10.3390/antiox8070200
25. Sahin, S, and Samli, R. Optimization of olive leaf extract obtained by ultrasound-assisted extraction with response surface methodology. Ultrason Sonochem. (2013) 20:595–602. doi: 10.1016/j.ultsonch.2012.07.029
26. Wu, WX, Jiang, S, Liu, MM, and Tian, SG. Simultaneous process optimization of ultrasound-assisted extraction of polyphenols and ellagic acid from pomegranate (Punica granatum L.) flowers and its biological activities. Ultrason Sonochem. (2021) 80:105833. doi: 10.1016/j.ultsonch.2021.105833
27. Teh, SS, and Birch, EJ. Effect of ultrasonic treatment on the polyphenol content and antioxidant capacity of extract from defatted hemp, flax and canola seed cakes. Ultrason Sonochem. (2014) 21:346–53. doi: 10.1016/j.ultsonch.2013.08.002
28. Vardanega, R, Santos, DT, and De Almeida, MA. Intensification of bioactive compounds extraction from medicinal plants using ultrasonic irradiation. Pharmacogn Rev. (2014) 8:88–95. doi: 10.4103/0973-7847.134231
29. Yue, XC, Gu, DZ, Geng, XD, Wu, S, Xian, YT, Kong, DX, et al. Correlation analysis of chlorogenic acid and luteoloside biosyntheses with transcription levels of HQTs and FNSs in Lonicera species. J Appl Bot Food Qual. (2021) 94:213–9. doi: 10.5073/JABFQ.2021.094.026
30. Kong, DX, Li, YQ, Bai, M, He, HJ, Liang, GX, and Wu, H. Correlation between the dynamic accumulation of the main effective components and their associated regulatory enzyme activities at different growth stages in L. japonica Thunb. Ind Crop Prod. (2017) 96:16–22. doi: 10.1016/j.indcrop.2016.11.024
31. Hwang, SJ, Kim, YW, Park, Y, Lee, HJ, and Kim, KW. Anti-inflammatory effects of chlorogenic acid in lipopolysaccharide-stimulated RAW 264.7 cells. Inflamm Res. (2014) 63:81–90. doi: 10.1007/s00011-013-0674-4
32. Lou, ZX, Wang, HX, Zhu, S, Ma, CY, and Wang, ZP. Antibacterial activity and mechanism of action of chlorogenic acid. J Food Sci. (2011) 76:M398–403. doi: 10.1111/j.1750-3841.2011.02213.x
33. Sato, Y, Itagaki, S, Kurokawa, T, Ogura, J, Kobayashi, M, Hirano, T, et al. In vitro and in vivo antioxidant properties of chlorogenic acid and caffeic acid. Int J Pharm. (2011) 403:136–8. doi: 10.1016/j.ijpharm.2010.09.035
34. Zhu, JX, Wang, LY, and Zhang, JP. Luteoloside inhibited autophagy for neuroprotection against transient focal cerebral ischemia in rats. NeuroMolecular Med. (2020) 22:493–502. doi: 10.1007/s12017-020-08606-2
35. Puspitasari, YE, Tuenter, E, Breynaert, A, Foubert, K, Herawati, H, and Hariati, AM. α-glucosidase inhibitory activity of tea and kombucha from Rhizophora mucronata leaves. Beverages. (2024) 10:22. doi: 10.3390/beverages10010022
36. Liu, M, Zhang, W, Wei, JT, and Lin, XK. Synthesis and α-glucosidase inhibitory mechanisms of bis(2,3-dibromo-4,5-dihydroxybenzyl) ether, a potential marine bromophenol α-glucosidase inhibitor. Mar Drugs. (2011) 9:1554–65. doi: 10.3390/md9091554
37. Zhang, Y, Pan, YN, Li, JQ, Zhang, Z, He, YM, Yang, HJ, et al. Inhibition on α-glucosidase activity and non-enzymatic glycation by an anti-oxidative proteoglycan from Ganoderma lucidum. Molecules. (2022) 27:1457. doi: 10.3390/molecules27051457
38. Wang, MT, Chen, JC, Ye, XQ, and Liu, DH. In vitro inhibitory effects of Chinese bayberry (Myrica rubra Sieb. et Zucc.) leaves proanthocyanidins on pancreatic α-amylase and their interaction. Bioorg Chem. (2020) 101:104029. doi: 10.1016/j.bioorg.2020.104029
Keywords: honeysuckle leaves, polyphenol extracts, α-glucosidase, enzyme inhibition, fluorescence
Citation: Li G, Bao C, Zhang H and Bai L (2025) Ultrasound-assisted extraction of polyphenols from Lonicera japonica leaves and their α-glucosidase inhibition. Front. Nutr. 12:1542217. doi: 10.3389/fnut.2025.1542217
Edited by:
Joyce Trujillo, Instituto Potosino de Investigación Científica y Tecnológica (IPICYT), MexicoReviewed by:
Fatimah Salim, Atta-ur-Rahman Institute for Natural Product Discovery (AuRIns), MalaysiaEnrique Almanza Aguilera, Institut d’Investigacio Biomedica de Bellvitge (IDIBELL), Spain
Copyright © 2025 Li, Bao, Zhang and Bai. This is an open-access article distributed under the terms of the Creative Commons Attribution License (CC BY). The use, distribution or reproduction in other forums is permitted, provided the original author(s) and the copyright owner(s) are credited and that the original publication in this journal is cited, in accordance with accepted academic practice. No use, distribution or reproduction is permitted which does not comply with these terms.
*Correspondence: Lu Bai, YmFpbHVAc3R1Lmhpc3QuZWR1LmNu