 Xinran Li
 Xin Zhang1†
95% of researchers rate our articles as excellent or good
Learn more about the work of our research integrity team to safeguard the quality of each article we publish.
Find out more
ORIGINAL RESEARCH article
Front. Nutr. , 13 March 2025
Sec. Nutritional Epidemiology
Volume 12 - 2025 | https://doi.org/10.3389/fnut.2025.1534915
This article is part of the Research Topic Dietary Strategies for Managing Hypertension and Hypotension: Insights and Mechanisms View all 12 articles
Objectives: This study aimed to investigate the dietary patterns of Tibetan residents and explore their association with the prevalence of hypertension.
Methods: A multi-stage, stratified, random sampling method was employed to include Tibetan residents from Luhuo County, Garze Tibetan Autonomous Prefecture, Sichuan Province, China. Dietary information was collected through face-to-face interviews using a Food Frequency Questionnaire (FFQ) consisting of 92 food items. Participants were asked to report the frequency and portion size of their consumption of each food item over the past year. The collected data were subsequently converted into average daily intake, with the 92 food items grouped into 23 distinct categories. Principal Component Analysis (PCA) was then used to identify dietary patterns. Binary logistic regression analysis was conducted to investigate the association between dietary patterns and the prevalence of hypertension, adjusting for potential confounders including age, gender, living area, education, physical activity, current smoking, current alcohol consumption, diabetes, dyslipidemia, and overweight/obesity. A P value <0.05 was considered statistically significant.
Results: A total of 1,262 Tibetan residents participated in the study, with an average age of 46 ± 15 years. Among them, 36.8% were male, and the prevalence of hypertension was 30.2%. Three distinct dietary patterns were identified among Tibetan residents and were subsequently named as the “Tsamba-red meat-tuber,” “Rice-vegetable-fruit,” and “Dairy products” patterns. After adjusting for confounding factors, individuals in the highest quartile following the “Tsamba-red meat-tuber” pattern were found to be associated with a higher prevalence of hypertension (OR = 3.04, 95% CI: 2.06–4.50; P for trend <0.001). In contrast, individuals in the highest quartile following the “Rice-vegetable-fruit” pattern were associated with a lower prevalence of hypertension (OR = 0.45, 95% CI: 0.30–0.67; P for trend <0.001). Additionally, those in the highest quartile of the “Dairy products” pattern also showed a lower prevalence of hypertension (OR = 0.58, 95% CI: 0.39–0.85; P for trend = 0.002).
Conclusion: The “Tsamba-red meat-tuber” pattern is associated with a higher risk of hypertension, whereas the “Rice-vegetable-fruit” and “Dairy products” patterns are associated with a lower risk of hypertension in this population.
Hypertension is a major risk factor for cardiovascular and cerebrovascular diseases (1). Among the primary ethnic groups in China, Tibetans, numbering over 6 million, have been shown to exhibit a high prevalence of hypertension, ranging from 23.4 to 55.9% (2–4), with this heterogeneity in prevalence potentially attributable to differences in altitude (5) and lifestyle factors (2, 6) among the studied populations. These rates are substantially higher than the national average of 23.5% (7). Hypertension is influenced by both genetic and environmental factors, with diet being one of the most significant environmental contributors (8). The high-altitude, low-oxygen environment of Tibetan regions has shaped unique dietary habits, including a preference for tsamba, beef and mutton, and dairy products. However, the detailed characteristics of the Tibetan diet and its relationship with hypertension remain inadequately understood.
To comprehensively evaluate the relationship between diet and disease, nutritionists have proposed the concept of dietary patterns (9). Dietary patterns take into account multiple foods and nutrients as a whole, emphasizing their interactions, and thus better reflect the impact of overall dietary exposure on disease (10, 11). Research evidence suggests that dietary patterns, such as the Mediterranean diet and the Dietary Approaches to Stop Hypertension (DASH) diet, are strongly associated with a lower risk of hypertension, while the Western diet is correlated with a higher risk (12). A longitudinal study from the China Health and Nutrition Survey (1991–2018) found that adherence to the modern dietary pattern, characterized by a high intake of fruits and dairy products, was negatively associated with systolic blood pressure (SBP), while the meat-based dietary pattern was positively associated with diastolic BP (DBP) and the risk of hypertension (13). However, few studies have investigated the link between Tibetan dietary patterns and hypertension. A cross-sectional study conducted in Diqing, Yunnan, which included a multi-ethnic population with 35% Tibetans, identified three major dietary patterns: ‘Grassland healthy,’ ‘Tuber and meat,’ and ‘Fruit and vegetable.’ The ‘Grassland healthy’ pattern was found to be associated with a lower risk of hypertension (14). Additionally, a cohort study of Tibetan adults in the Tibetan Plateau region identified three primary dietary patterns: modern, urban, and pastoral dietary patterns. The modern dietary pattern was positively associated with elevated BP, while the pastoral dietary pattern showed a negative association with elevated BP (15). Tibetans are mainly distributed across southwestern China, including Tibet, Sichuan, Qinghai, Yunnan, and other regions. Garze Tibetan Autonomous Prefecture in Sichuan is the second-largest Tibetan area in China. This region not only preserves traditional Tibetan dietary habits but also absorbs influences from the culinary culture of southwestern China. Furthermore, with improved transportation access, the diversity of available ingredients has significantly increased. As a result, Garze Tibetan Autonomous Prefecture has developed a unique dietary profile. However, no studies have yet explored the dietary patterns in this region or their association with hypertension.
Therefore, this study aims to investigate the dietary patterns of Tibetan residents in Ganzi Tibetan Autonomous Prefecture using a food frequency questionnaire (FFQ) and explore their potential correlation with hypertension risk.
Luhuo County is located in the central and northern parts of the Garze Tibetan Autonomous Prefecture in Sichuan Province and is a semi-agricultural, semi-pastoral area, with the majority of the population being Tibetan (94.8%). The locals have preserved traditional Tibetan food habits and ways of life. Therefore, we conducted a multi-stage, stratified, and randomly sampled survey in Luhuo County from January 2018 to October 2020. First, two towns were selected from each of the four administrative districts in Luhuo County. Then, 2–3 villages were selected from each town, and finally, 95 Tibetan residents were randomly selected in each village, all of whom were aged between 18 and 80 years. We excluded the following individuals from the study: those with self-reported mental illnesses, serious physical illnesses, or visual/hearing impairments; those with a recent history of angina, acute myocardial infarction, heart failure, or cerebrovascular disease within the past 6 months; those with severe liver/kidney damage (serum alanine aminotransferase or aspartate aminotransferase >2 times the upper limit of normal, serum creatinine >260 μmol/L); those with severe digestive system diseases or known malignant tumors; and pregnant or breastfeeding women. A total of 1,262 subjects, with data on dietary surveys and medical history, were included in the study, out of 1,423 participants overall (Figure 1). This study was approved by the Ethics Committee of West China Hospital, Sichuan University. All participants provided informed consent after being informed of the objectives and potential benefits of the study.

Figure 1. Flow diagram illustrating the study population inclusion process.
According to our prior dietary survey of 86 Tibetan residents, we compiled a list of foods commonly consumed by this population. Using nutritional epidemiology methods as a reference (16), we developed a Food Frequency Questionnaire (FFQ) containing 92 food items for dietary assessment. Our trained investigators, with the assistance of local Tibetan translators, conducted face-to-face dietary surveys with the participants. Participants were asked to report the frequency and portion size of each food item consumed over the past year. Standard containers, such as bowls, cups, and spoons with marked scales, as well as concentric circles of different sizes and pictures of foods, were used to assist participants in recalling their food intake. The portion weights for each food item were determined in advance. The dietary information obtained from the FFQ was subsequently converted into average daily intake, calculated by multiplying the intake frequency by the portion size and its corresponding weight. To facilitate the identification and interpretation of dietary patterns in subsequent analyses, we utilized the classification of the China Food Composition Table (17) and considered the dietary habits of the Tibetan region. The 92 food items listed in the FFQ were consolidated into 23 distinct food groups, including rice and its products, wheat and its products, tsamba, whole grains, tubers, beans and their products, vegetables, mushrooms, pork, beef and mutton, poultry, animal organs, aquatic products, eggs, dairy and its products, fruits, nuts, pastries, butter tea/mike tea, sweet beverages, tea, salt, and oils. Among these, tsamba, a staple food crop widely consumed by Tibetans, is made from roasted Tibetan barley (13, 18).
The interview involved the collection of demographic data (e.g., sex, education, living area), clinical data (e.g., current smoking status, medical history), and information related to lifestyle (e.g., physical activity).
Participants’ height and weight were measured while they were wearing lightweight clothing and without shoes, with precision to 1 cm and 0.2 kg. Body mass index (BMI) was calculated as weight divided by height squared (kg/m2).
BP was measured using a standardized automatic electronic sphygmomanometer (Omron HBP-1100), following a standardized protocol (19). Readings were taken three times at 2-min intervals after at least 5 min of rest in a warm and quiet indoor setting. The mean value of the three readings was used in subsequent statistical analyses.
Blood samples were drawn from the antecubital vein in the morning after an 8-h fast. The blood samples were then transported to the Department of Laboratory Medicine at West China Hospital of Sichuan University and analyzed for fasting blood glucose (FBG), fasting serum total cholesterol (TC), low-density lipoprotein cholesterol (LDL-C), high-density lipoprotein cholesterol (HDL-C), and triglycerides (TG) using an automatic biochemistry analyzer (Roche Cobas8000).
Hypertension was defined as a SBP of at least 140 mmHg and/or a DBP of at least 90 mmHg, or self-reported current use of antihypertensive medications (20). Diabetes was defined as a fasting blood glucose level of at least 7.0 mmol/L, or self-reported current use of insulin or hypoglycemic agents (21). Dyslipidemia was defined as the self-reported current use of antilipidemic medications or meeting at least one of the following criteria: TC ≥ 5.2 mmol/L, LDL-C ≥ 3.4 mmol/L, HDL-C < 1.0 mmol/L, or TG ≥ 1.7 mmol/L (22). BMI was categorized as overweight (BMI 24–27.9 kg/m2) and obesity (BMI ≥ 28 kg/m2). Current smoking was defined as smoking at least one cigarette per day within the past year, while current drinking was defined as consuming alcohol at least once per week within the past year. Physical activity levels were classified into four categories based on daily activity duration: <30 min (level 1), 30 min to 1 h (level 2), 1 to 1.5 h (level 3), and > 1.5 h (level 4) (19).
Dietary patterns were identified using Principal Component Analysis (PCA). Prior to conducting the analysis, the Kaiser-Meyer-Olkin measure of sample and Bartlett test of sphericity were employed to evaluate the suitability of the data for factor analysis (23). A total of 23 factors were initially extracted. Based on eigenvalues (>1.0), the scree plot (indicating the point where the slope levels off), the proportion of variance explained by each factor (>5%), and the interpretability of the factors, three primary dietary patterns were retained. The scree plot is provided in Supplementary material. Subsequently, the Varimax orthogonal rotation method was applied to the factor matrix to produce uncorrelated factors, facilitating simpler data interpretation. Next, to identify the important food items for each pattern, food items with rotated factor loadings >0.3 or < −0.3 were retained (14, 18). The naming and interpretation of the patterns were determined based on these retained food items. Dietary pattern scores were calculated for each participant and categorized into quartiles. The characteristics of the study population were summarized as frequencies and percentages for categorical variables and as means ± standard deviations (SD) for continuous variables. Differences in demographic and clinical characteristics between two groups were assessed based on an analysis of categorical variables using the Chi-square test, independent t-tests for normally distributed variables, and non-parametric Mann–Whitney or Wilcoxon tests for skewed variables. Binary logistic regression analysis was performed to explore the association between dietary pattern score quartiles and hypertension, using Quartile 1 (Q1) as the reference group. Demographic characteristics and comorbidities that might be associated with hypertension were included as covariates in the model. Model 1 adjusted for demographic factors such as age (per 1 year), gender (male or female), living area (urban, farming, or pastoral area), education (no schooling, primary school, middle school, or > middle school), physical activity (levels 1, 2, 3, or 4), current smoking status (smoker or non-smoker), and current drinking status (drinker or non-drinker), while Model 2 further adjusted for comorbidities, including diabetes (diabetic or non-diabetic), dyslipidemia (dyslipidemic or non-dyslipidemic), and overweight/obesity (overweight/obese or non-overweight/non-obese). The results were reported as odds ratios (OR) with 95% confidence intervals (95% CI) to quantify the strength of the association between dietary patterns and hypertension. We conducted tests for linear trend by entering the median value of each category of dietary pattern score as a continuous variable in the models. A P-value of <0.05 was considered statistically significant. All statistical analyses were conducted using IBM SPSS Statistics version 23.
This study included a total of 1,262 Tibetan residents, with 38.7% from farming areas, 29.6% from pastoral areas, and 31.6% from urban areas. The study population had a mean age of 46 ± 15 years, with 36.8% being male. The prevalence rates of hypertension, diabetes, overweight/obesity, and dyslipidemia were 30.2, 5.5, 61.9, and 50.2%, respectively. Men were observed to be more likely than women to have higher BMI, SBP, and TG levels, and lower HDL-C levels. No significant differences were noted between the two genders for DBP and LDL-C. A greater proportion of men were current smokers, consumed alcohol, and were overweight or obese, while a higher proportion of women had diabetes. No significant differences were found in the prevalence of hypertension or dyslipidemia between genders (Table 1).
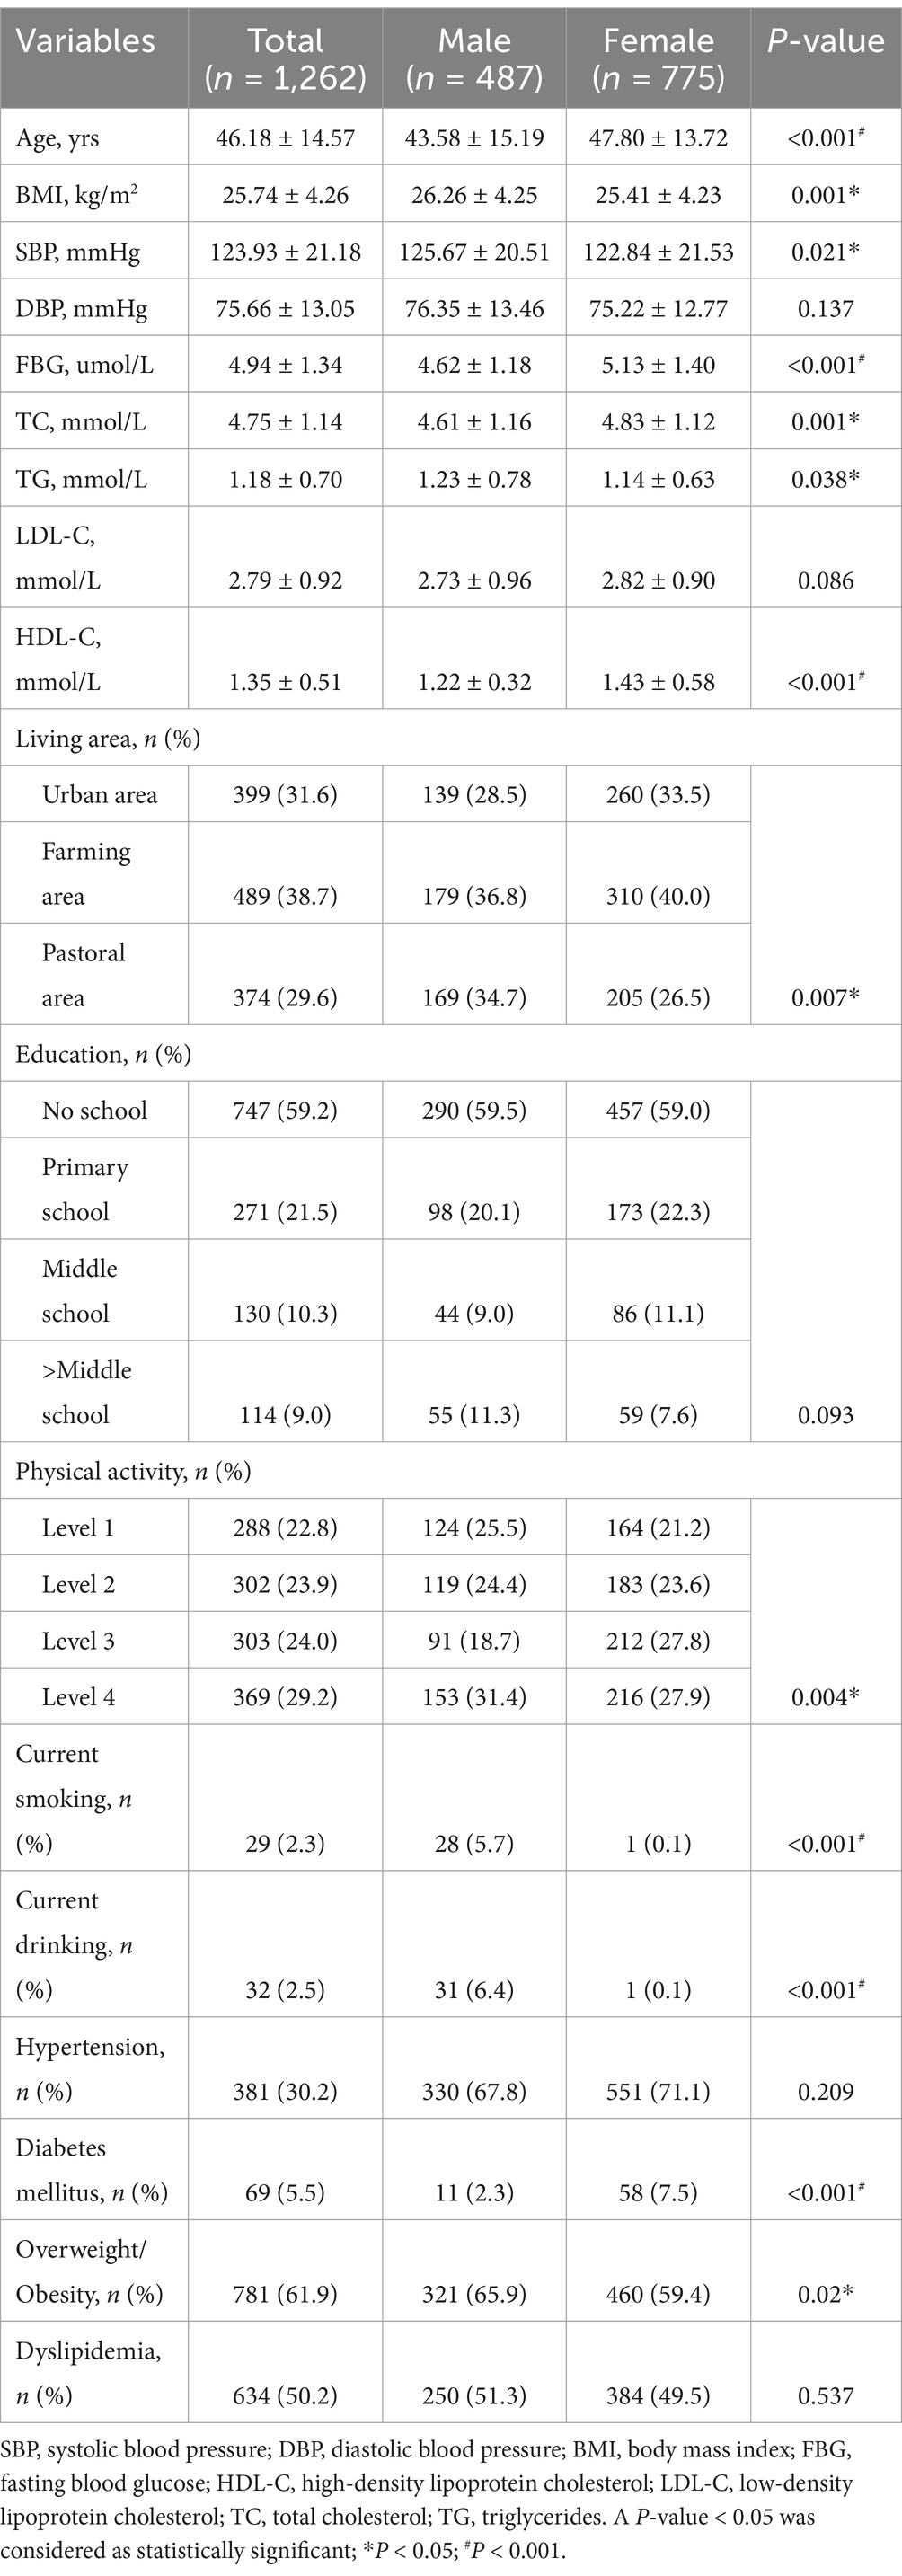
Table 1. Participant characteristics.
Table 2 presents the factor loadings for the three major dietary patterns. Three distinct dietary patterns were identified, namely “Tsamba-red meat-tuber,” “Rice-vegetable-fruit,” and “Dairy products,” which together accounted for 25.4% of the variance in total food intake. The “Tsamba-red meat-tuber” pattern was characterized by frequent consumption of Tsamba, beef, mutton, tubers, wheat and its products, and oil. The “Rice-vegetable-fruit” pattern was characterized by frequent consumption of vegetables, rice and its products, pork, fresh fruits, mushrooms, and eggs. The “Dairy products” pattern was characterized by frequent consumption of dairy and its products.
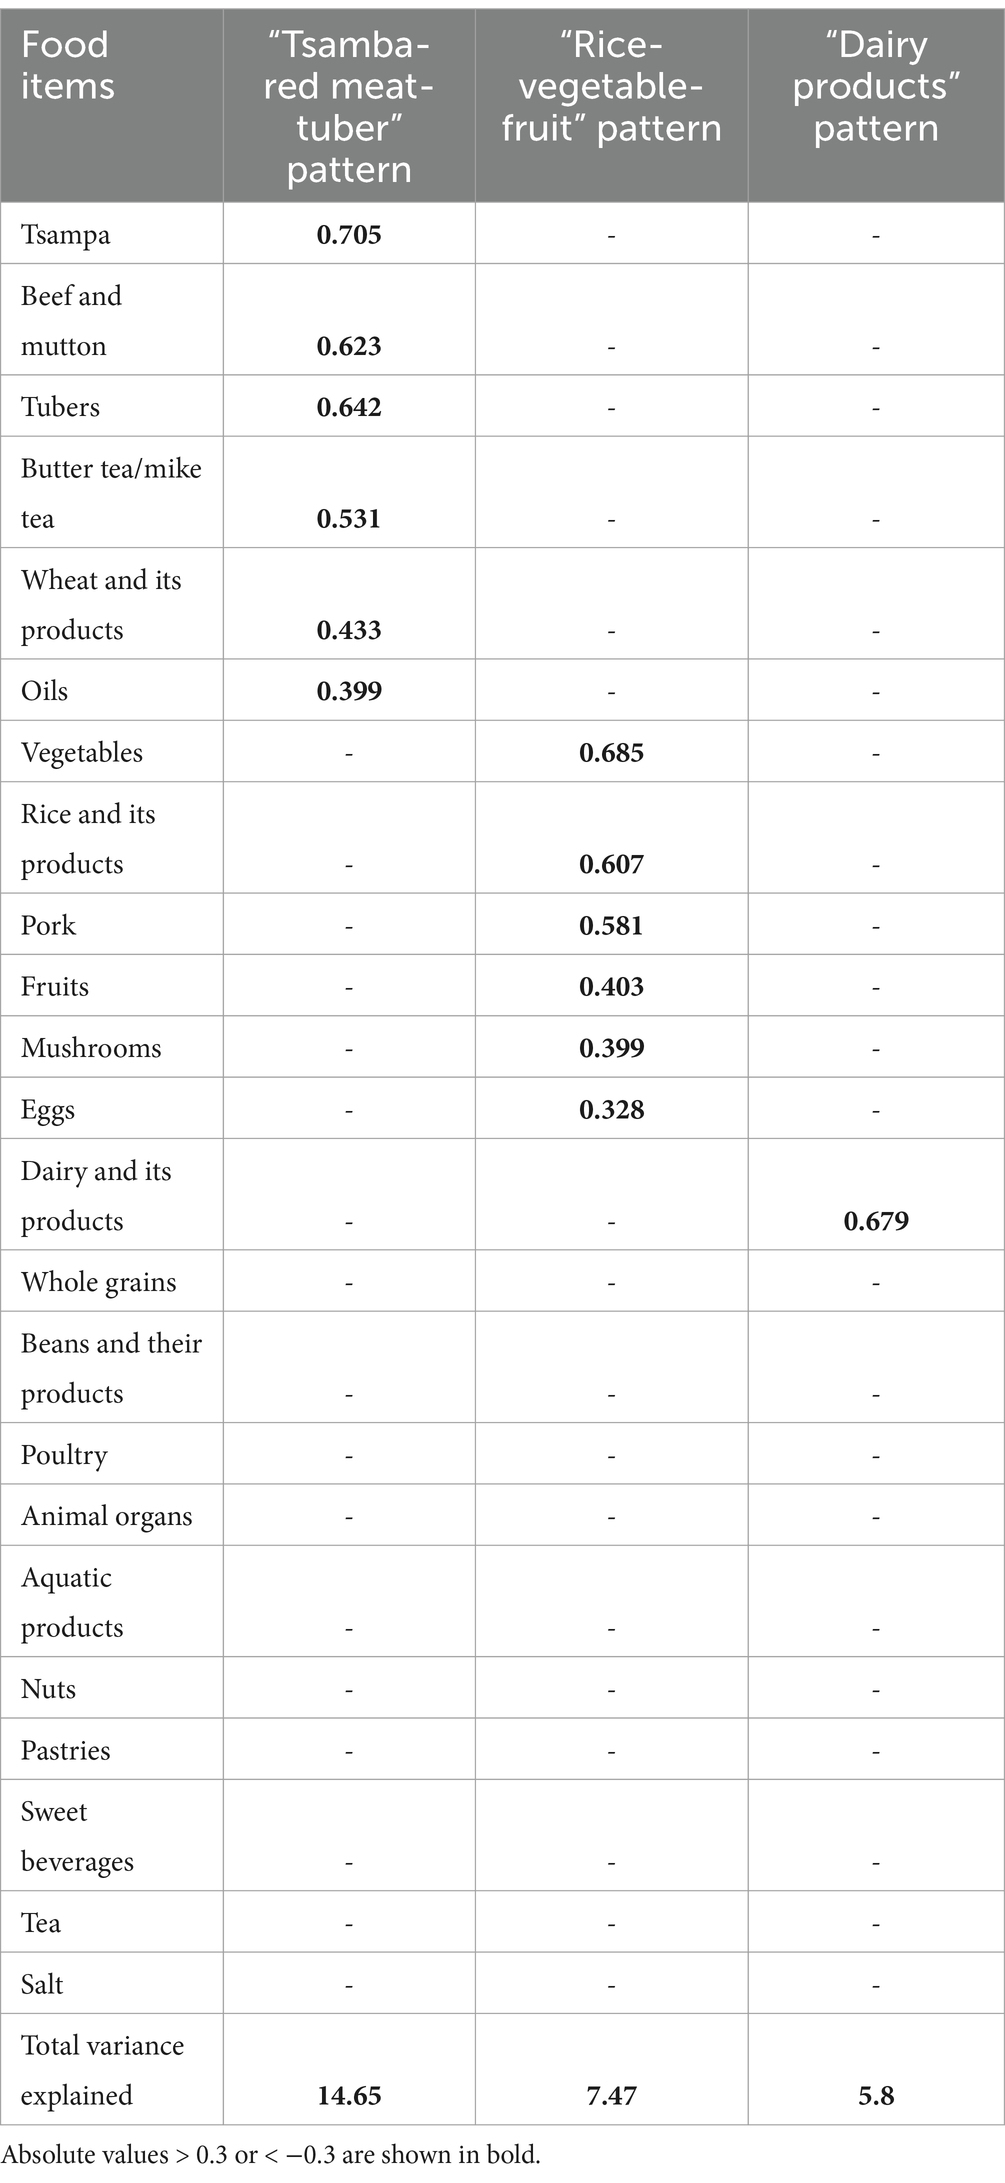
Table 2. Factor loading of three major dietary patterns among subjects.
Table 3 presents the characteristics of participants in the highest and lowest quartiles of each dietary pattern. Individuals in the highest quartile of the “Tsamba-red meat-tuber” pattern were more likely to reside in farming and pastoral areas and to have lower education levels compared to those in the lowest quartile. Individuals in the highest quartile of the “Rice-vegetable-fruit” pattern were more likely to reside in urban and farming areas, with a higher proportion having completed middle school or higher education compared to the lowest quartile. Individuals in the highest quartile of the “Dairy products” pattern were more likely to reside in urban and pastoral areas, engage in higher levels of physical activity, and demonstrate a lower prevalence of smoking and drinking compared to those in the lowest quartile.
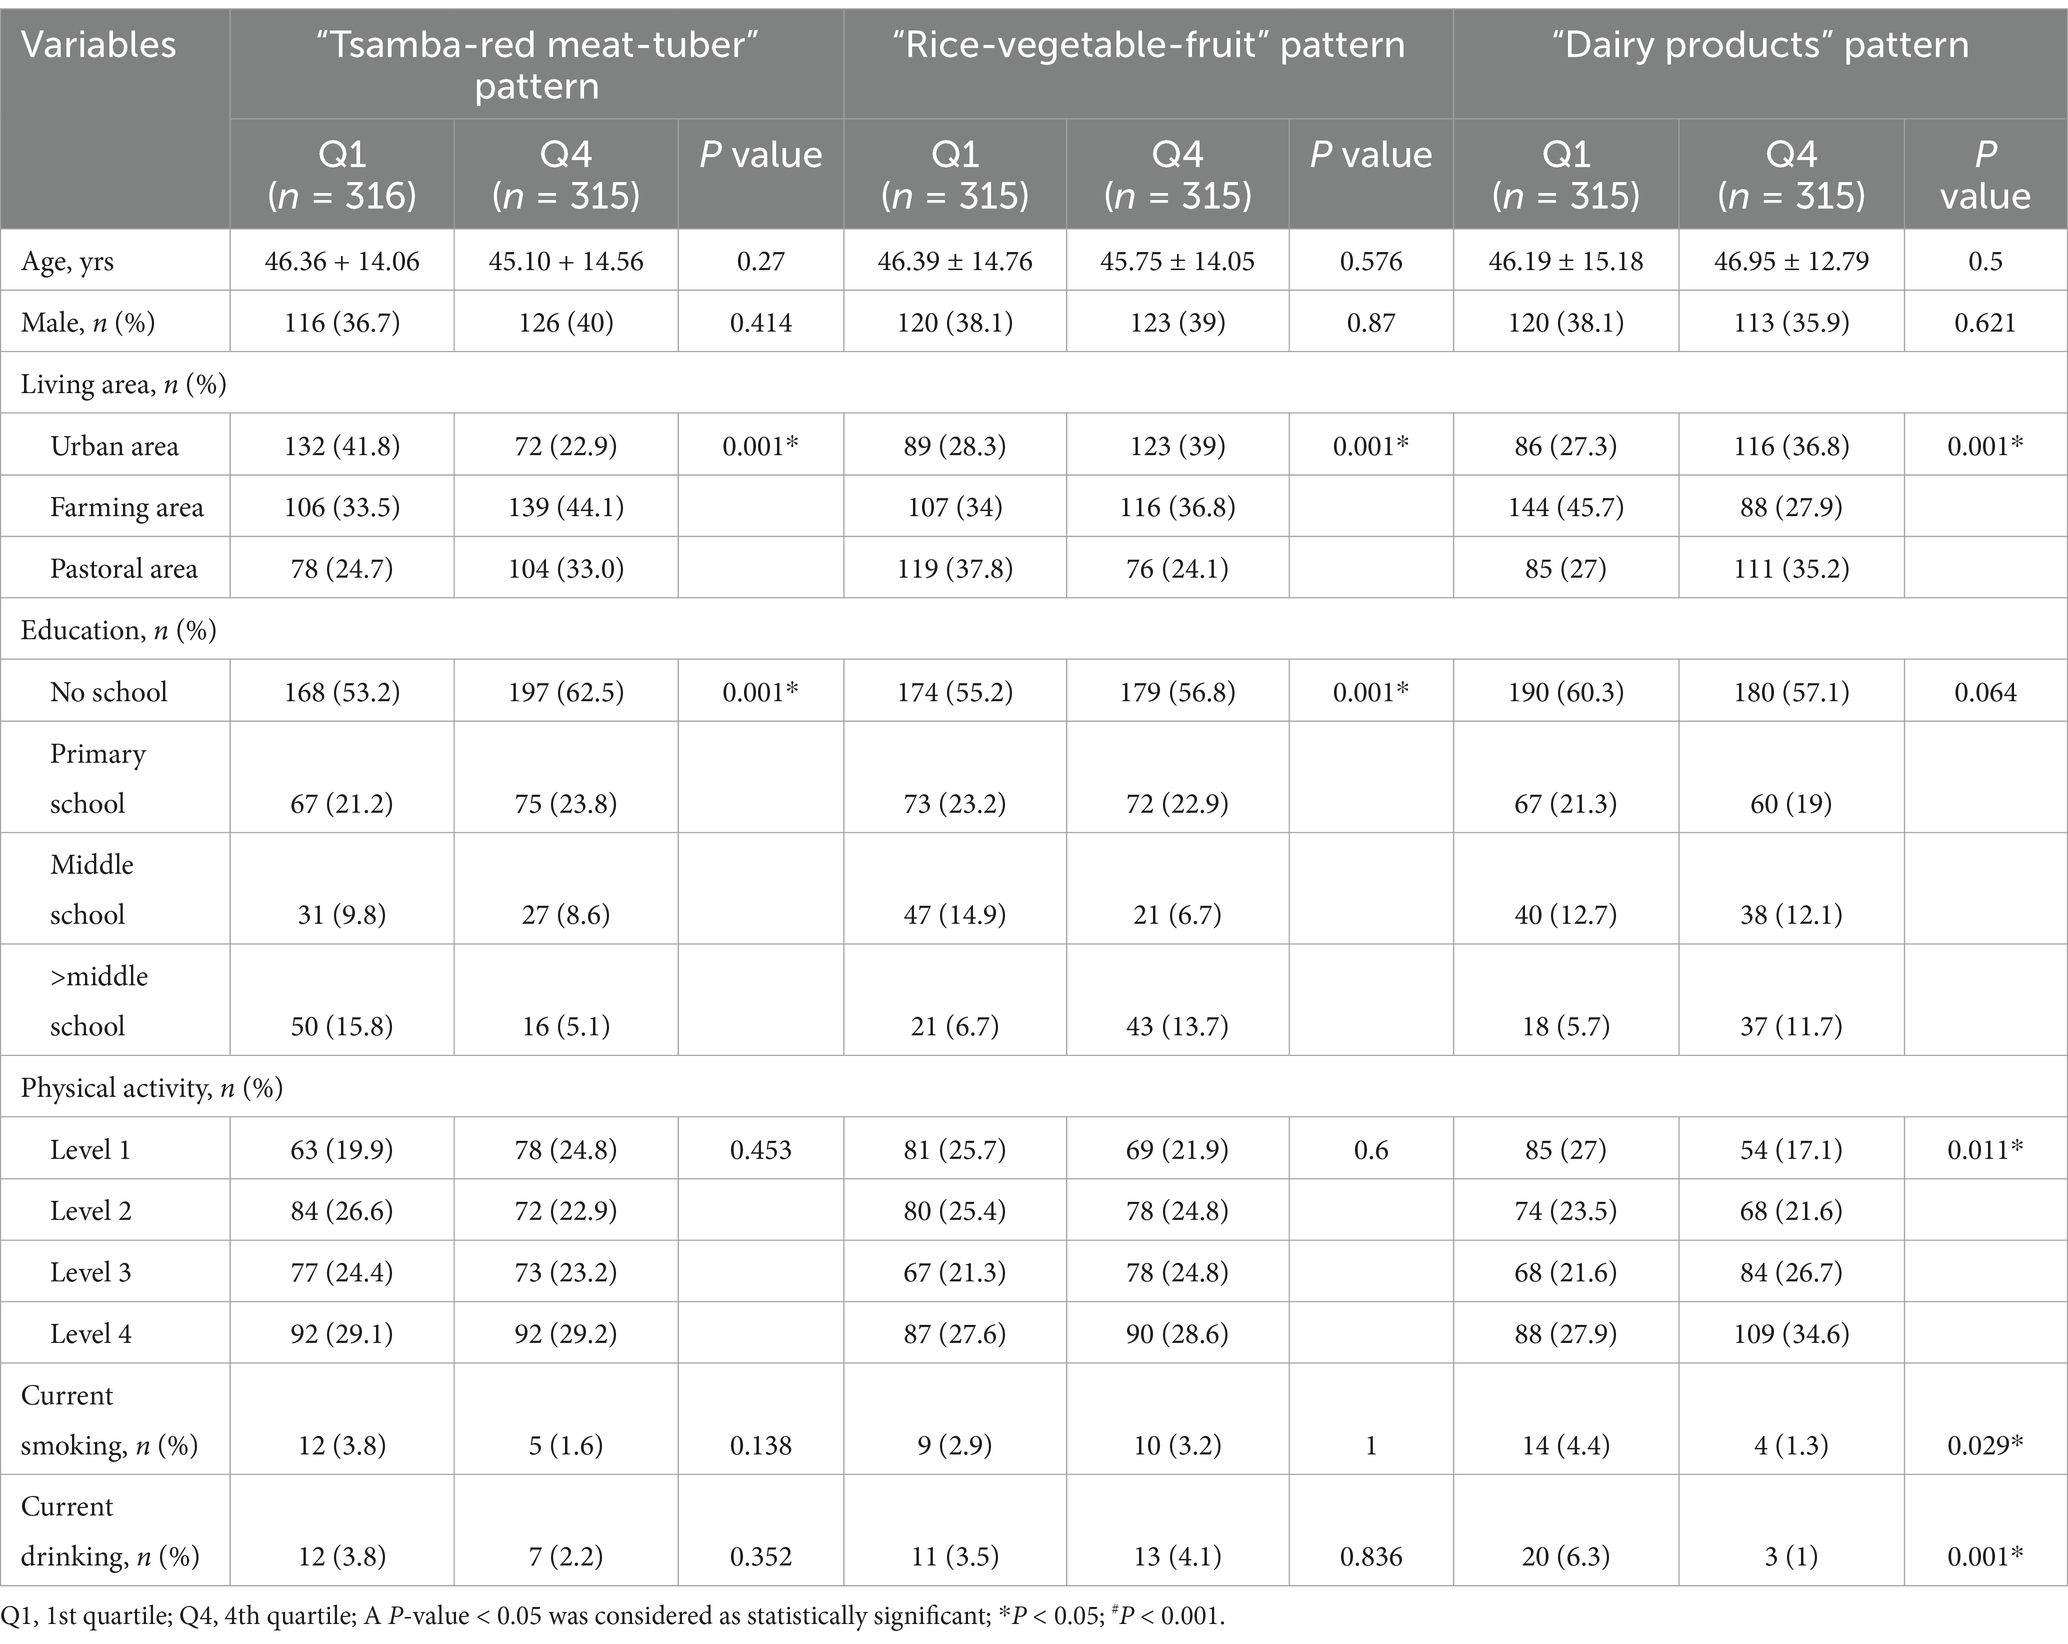
Table 3. Characteristics according to dietary patterns.
Significant differences were observed in the prevalence of hypertension across quartiles of the three major dietary pattern scores. As the scores for the “Tsamba-red meat-tuber” pattern increased, the prevalence of hypertension rose from 21.5 to 41.6%. In contrast, as the scores for the “Rice-vegetable-fruit” and “Dairy products” patterns increased, the prevalence of hypertension declined from 41.9 to 21.3% and from 39.4 to 24.1%, respectively. These findings are presented in Table 4.

Table 4. Prevalence of hypertension and logistic regression analysis between hypertension and dietary pattern.
Logistic regression analysis was conducted to investigate the association between the three major dietary patterns and the prevalence of hypertension (Table 4). Univariate regression analysis indicated that, compared to the lowest quartile group, participants in the highest quartile of the ‘Tsamba-red meat-tuber’ pattern had a significantly higher prevalence of hypertension, with an OR of 2.60 (95% CI: 1.83–3.68; P for trend <0.001). Conversely, the highest quartiles of the ‘Rice-vegetable-fruit’ and ‘Dairy products’ patterns were associated with significantly lower prevalence of hypertension, with ORs of 0.38 (95% CI: 0.26–0.53; P for trend <0.001) and 0.49 (95% CI: 0.34–0.69; P for trend <0.001), respectively. After adjusting for confounding factors, including sex, age, living area, education level, physical activity, current smoking, current alcohol consumption, BMI, FBG, TC, TG, LDL-C, HDL-C, these associations remained statistically significant. The adjusted OR for the highest quartile of the ‘Tsamba-red meat-tuber’ pattern was 3.07 (95% CI: 2.07–4.55; P for trend <0.001), while the adjusted ORs for the highest quartiles of the ‘Rice-vegetable-fruit’ and ‘Dairy products’ patterns were 0.43 (95% CI: 0.29–0.65; P for trend <0.001) and 0.55 (95% CI: 0.37–0.82; P for trend =0.002), respectively.
In this study, we conducted a dietary survey using a FFQ among 1,262 Tibetan residents in farming, pastoral, and urban areas of Luhuo County in Garze Tibetan Autonomous Prefecture in Sichuan Province. Three major dietary patterns were identified among Tibetan residents: the “Tsamba-red meat-tuber,” “Rice-vegetable-fruit” and “Dairy products” patterns. The “Tsamba-red meat-tuber” pattern contributed the highest factor load (14.62%) and was considered the main dietary pattern among Tibetan residents, consistent with previous studies (18, 24). The “Rice-vegetable-fruit” pattern was similar to the main pattern of southern Chinese residents who mainly consume rice, vegetables, fruits and meat, more common in urban areas and among highly educated Tibetan residents (25). These changes may be related to urbanization in Tibetan areas, increased cultural exchange between Tibetan and Chinese cuisines, improved transportation and logistics, and greater food diversity (26, 27). Furthermore, as Tibetans originated from a nomadic ethnic group, dairy and its products remain important food sources. Our research found that Tibetans in pastoral areas, urban areas, with more physical activity and healthier lifestyles tended to prefer the “Dairy products” pattern.
This study found that the “Tsamba-red meat-tuber” pattern was a significant risk factor for hypertension among Tibetan residents. Beef and mutton, classified as red meat, are the primary food components of the “Tsamba-red meat-tuber” pattern. Both cross-sectional and longitudinal studies have demonstrated a positive association between red meat and hypertension (28). A recent umbrella review that included 43 meta-analyses found that higher consumption of red meat, particularly processed meat, was associated with an increased risk of hypertension. Further dose–response analysis revealed that an additional 100 g/day of red meat intake was positively associated with a 14% increased risk of hypertension, while consuming more than 50 g of processed meat per day was associated with a 12% increased risk of hypertension (29). Although this study did not examine the cooking methods or consumption levels of red meat, based on previous research, we suggest that red meat intake plays a significant role in the development of hypertension within the “Tsamba-red meat-tuber” pattern. Several mechanisms may explain the hypertension risk associated with red meat (28). Firstly, compared to unprocessed red meat, processed red meat—such as that which is cured, dried, fermented, or smoked—has a sodium content that is 400% higher (28). High sodium intake has been shown to be associated with elevated blood pressure and an increased risk of hypertension through mechanisms such as increasing extracellular volume, vascular resistance, and sympathetic activity, as well as worsening endothelial inflammation (30–32). Furthermore, red meat, particularly processed red meat, contains nitrite additives, with nitrite levels 50% higher than in unprocessed red meat (33). Studies have reported that each increase in the tertile of nitrate consumption is associated with a 3.1 mmHg increase in diastolic BP (34). Nitrite additives have been found to cause endothelial dysfunction, a key pathophysiological factor in the development of hypertension (35). Moreover, red meat is rich in acylcarnitines, which are metabolized by intestinal microbiota and hepatic enzymes into trimethylamine-N-oxide (TMAO). TMAO has been associated with several adverse effects, including endothelial dysfunction, atherosclerosis, oxidative stress, and vascular aging, all of which could contribute to the development of hypertension (36, 37). Additionally, the “Tsamba-red meat-tuber” pattern is characterized by a higher intake of tubers, particularly potatoes. Some studies have found inconsistent results regarding the relationship between potato intake and hypertension, with the cooking method being a factor (38–40). However, a recent meta-analysis found no association between total potato intake and hypertension, though both fried and non-fried potato consumption may increase the risk of diabetes (41). Boiled white potatoes, with a glycemic load of 21 (42), can cause postprandial hyperglycemia, which is associated with endothelial dysfunction, oxidative stress, and inflammation—factors that may negatively impact BP regulation (8). Furthermore, tsamba, a staple food in this dietary pattern, is made from naked barley. Animal studies have shown that supplementation with partly milled highland barley in high-fat diet (HFD)-fed mice significantly reduces FBG, improves oral glucose tolerance, and prevents HFD-induced gut microbiota dysbiosis (43). However, Tibetans often mix tsamba with salt and butter, which may diminish its protective effects. Therefore, the “Tsamba-red meat-tuber” pattern, characterized by high consumption of beef, mutton, and tubers, may contribute to the elevated hypertension risk observed in this population. Nevertheless, few studies have explored the dietary habits of Tibetans and their relation to hypertension. For example, Peng et al. conducted a study on Tibetan adults in the Tibetan Plateau and identified a “Pastoral pattern” similar to the “Tsamba-red meat-tuber” pattern. This pattern, which includes high consumption of red meat, tsamba, Tibetan cheese, butter tea/milk tea, and whole-fat dairy, was not associated with elevated BP (18). These findings may stem from the higher intake of whole-fat dairy in the “Pastoral pattern,” which has been found to act as a protective factor against hypertension (44), potentially offsetting the harmful effects of red meat on BP.
The Chinese traditional southern dietary pattern, characterized by a higher intake of vegetables, fruits, rice, pork, poultry, and aquatic products, has been shown to be associated with a reduced incidence of hypertension and a lower risk of future cardiovascular disease (25, 45). In our study, the “Rice-vegetable-fruit” pattern, which shares similarities with the traditional southern dietary pattern but contains relatively lower amounts of poultry and aquatic products, was observed to be associated with a lower incidence of hypertension among Tibetan residents. The observed antihypertensive effect may be attributed to the higher intake of vegetables and fruits. A recent meta-analysis of prospective studies found that a high intake of fruits and vegetables was associated with a reduced risk of hypertension, although the results for specific subtypes remain inconclusive and warrant further research (46). Several mechanisms may explain the association between vegetable and fruit consumption and lower BP. First, these foods are rich in dietary fiber, which helps regulate BP by improving vascular endothelial function, enhancing mineral absorption, reducing serum cholesterol levels, improving gastrointestinal function, and decreasing insulin resistance (47). Furthermore, fruits and vegetables are high in potassium, magnesium, vitamin C, folate, flavonoids, and carotenoids, which are thought to lower blood pressure by enhancing endothelial function, modulating baroreceptor sensitivity, and increasing antioxidant activity (48, 49). Furthermore, the “Rice-vegetable-fruit” pattern features rice as the primary staple. While a prospective cohort study conducted in China reported an inverse association between rice intake and the risk of future cardiovascular events (45), a meta-analysis found no significant association between white rice consumption and specific chronic conditions (50). The association between rice intake, hypertension, and cardiovascular events requires further investigation. Moreover, while the role of red meat in hypertension has been emphasized, the “Rice-vegetable-fruit” pattern includes higher pork intake. Possible explanations for this contradiction include: (1) the BP-lowering effects of vegetables and fruits may counteract the impact of pork; (2) studies have shown a U-shaped relationship between red meat intake and new-onset hypertension, with the risk increasing beyond a certain threshold (51). The amount of pork intake may thus influence its effect on hypertension. Additionally, inconsistent findings have been reported. A community-based nationwide study conducted in Eastern China identified a “Rice-vegetable” dietary pattern, characterized by high consumption of vegetables, rice and rice products, and aquatic products, but did not find an association with hypertension. The study suggested that the potential antihypertensive benefits of vegetable consumption could be counterbalanced by the adverse effects of polished rice, oil, and salt commonly used in stir-frying vegetables in Chinese cuisine (52). These discrepancies may arise from differences in cooking methods or the ingredients themselves, suggesting the need for further research to clarify their impact.
Our study found that the ‘Dairy products’ pattern was associated with a lower risk of hypertension among Tibetan residents. The Tibetan ethnicity, which evolved from a nomadic heritage, continues the habitual consumption of dairy products. These dairy products commonly include yogurt, whole-fat milk, cheese, and butter residue, with yogurt being the most frequently consumed item. Recent meta-analyses have shown that total dairy consumption is associated with a lower risk of hypertension, especially low-fat dairy and milk, while yogurt is more strongly linked to a reduced risk of diabetes and overweight or obesity (44). The BP-lowering effects of dairy consumption have been attributed to several components, including calcium, vitamin D, magnesium, potassium, and whey protein, which may regulate BP by enhancing insulin sensitivity, promoting renal sodium excretion, lowering intracellular calcium concentrations, and increasing nitric oxide synthesis (53–55). Additionally, yogurt, which is rich in probiotics, has been shown to lower cholesterol levels and inhibit angiotensin-converting enzyme, thereby contributing to reduced BP (56). In line with our study results, Ruan and colleagues conducted a dietary survey in Diqing of Yunnan Province, southwest China, involving Han and multi-ethnic populations, and found that a “Grassland healthy” dietary pattern, characterized by a relatively high intake of yogurt, soy products, and eggs, was associated with a lower risk of hypertension (14).
There are some limitations to this study. First, the survey sample was restricted to Luhuo County in Ganzi Tibetan Autonomous Prefecture, Sichuan Province; therefore, the research results may not be generalizable of all Tibetan populations. Second, the cross-sectional design of the study limits the ability to establish a causal relationship between dietary patterns and hypertension. Third, the findings are based on self-reported dietary information, which may be subject to recall bias. Lastly, the study did not differentiate between processed and unprocessed red meat consumption, which limits the in-depth analysis of potential mechanisms by which red meat might affect hypertension.
In summary, our study identified three primary dietary patterns among the Tibetan population: the “Tsamba-red meat-tuber,” the “Rice-vegetable-fruit,” and the “Dairy products” pattern. The “Tsamba-red meat-tuber” pattern is associated with a higher risk of hypertension, whereas the “Rice-vegetable-fruit” and “Dairy products” patterns are associated with a lower risk of hypertension in this population. This study provides a theoretical foundation for developing dietary strategies aimed at preventing and managing hypertension among Tibetans, with a particular focus on the Garze Tibetan Autonomous Prefecture in Sichuan Province. Future prospective studies are still needed to establish the causality between these dietary patterns and hypertension.
The original contributions presented in the study are included in the article/Supplementary material, further inquiries can be directed to the corresponding author.
The studies involving humans were approved by Ethics committee of West China Hospital, Sichuan University. The studies were conducted in accordance with the local legislation and institutional requirements. The participants provided their written informed consent to participate in this study.
XL: Writing – original draft, Writing – review & editing. XZ: Writing – original draft, Writing – review & editing. QG: Data curation, Investigation, Writing – review & editing. QM: Investigation, Methodology, Writing – review & editing. XC: Funding acquisition, Project administration, Resources, Supervision, Validation, Visualization, Writing – review & editing.
The author(s) declare that financial support was received for the research and/or publication of this article. This work was supported by the Sichuan Science and Technology Pillar Programs (Grant No. 2017SZ0008), Sichuan Science and Technology Program (Grant No. 2023NSFSC0581), the Medical Science and Technology Project of Health Commission of Sichuan Province (Grant No. 21PJ026); and the Science and Technology Program of Tibet Autonomous Region (Grant No. XZ202303ZY0004G).
The authors sincerely thank the team led by Zhiyong Rao from the Department of Nutrition at West China Hospital, Sichuan University, particularly Yingyi Chen, as well as to the Luhuo County Health Bureau and Luhuo County Hospital in Ganzi Tibetan Autonomous Prefecture for their valuable assistance and support in this study.
The authors declare that the research was conducted in the absence of any commercial or financial relationships that could be construed as a potential conflict of interest.
The authors declare that no Gen AI was used in the creation of this manuscript.
All claims expressed in this article are solely those of the authors and do not necessarily represent those of their affiliated organizations, or those of the publisher, the editors and the reviewers. Any product that may be evaluated in this article, or claim that may be made by its manufacturer, is not guaranteed or endorsed by the publisher.
The Supplementary material for this article can be found online at: https://www.frontiersin.org/articles/10.3389/fnut.2025.1534915/full#supplementary-material
1. Carey, RM, Moran, AE, and Whelton, PK. Treatment of hypertension: a review. JAMA. (2022) 328:1849–61. doi: 10.1001/jama.2022.19590
2. Zuo, X, Zhang, X, Ye, R, Li, X, Zhang, Z, Shi, R, et al. Hypertension status and its risk factors in highlanders living in Ganzi Tibetan plateau: a cross-sectional study. BMC Cardiovasc Disord. (2024) 24:449. doi: 10.1186/s12872-024-04102-8
3. Zhao, X, Li, S, Ba, S, He, F, Li, N, Ke, L, et al. Prevalence, awareness, treatment, and control of hypertension among herdsmen living at 4,300 M in Tibet. Am J Hypertens. (2012) 25:583–9. doi: 10.1038/ajh.2012.9
4. Mingji, C, Onakpoya, IJ, Perera, R, Ward, AM, and Heneghan, CJ. Relationship between altitude and the prevalence of hypertension in Tibet: a systematic review. Heart. (2015) 101:1054–60. doi: 10.1136/heartjnl-2014-307158
5. Zhang, X, Zhang, Z, Ye, R, Meng, Q, and Chen, X. Prevalence of hypertension and its relationship with altitude in Highland areas: a systematic review and Meta-analysis. Hypertens Res. (2022) 45:1225–39. doi: 10.1038/s41440-022-00955-8
6. Meng, Q, Xu, Y, Shi, R, Zhang, X, Wang, S, Liu, K, et al. Effect of religion on hypertension in adult Buddhists and residents in China: a cross-sectional study. Sci Rep. (2018) 8:8203. doi: 10.1038/s41598-018-26638-4
7. Wang, Z, Chen, Z, Zhang, L, Wang, X, Hao, G, Zhang, Z, et al. Status of hypertension in China: results from the China hypertension survey, 2012-2015. Circulation. (2018) 137:2344–56. doi: 10.1161/circulationaha.117.032380
8. Oparil, S, Acelajado, MC, Bakris, GL, Berlowitz, DR, Cífková, R, Dominiczak, AF, et al. Hypertension. Nat Rev Dis Primers. (2018) 4:18014. doi: 10.1038/nrdp.2018.14
9. Schulz, CA, Oluwagbemigun, K, and Nöthlings, U. Advances in dietary pattern analysis in nutritional epidemiology. Eur J Nutr. (2021) 60:4115–30. doi: 10.1007/s00394-021-02545-9
10. Tucker, KL. Dietary patterns, approaches, and multicultural perspective. Appl Physiol Nutr Metab. (2010) 35:211–8. doi: 10.1139/h10-010
11. Cespedes, EM, and Hu, FB. Dietary patterns: from nutritional epidemiologic analysis to National Guidelines. Am J Clin Nutr. (2015) 101:899–900. doi: 10.3945/ajcn.115.110213
12. Sukhato, K, Akksilp, K, Dellow, A, Vathesatogkit, P, and Anothaisintawee, T. Efficacy of different dietary patterns on lowering of blood pressure level: an umbrella review. Am J Clin Nutr. (2020) 112:1584–98. doi: 10.1093/ajcn/nqaa252
13. Zhang, J, Du, W, Huang, F, Li, L, Bai, J, Wei, Y, et al. Longitudinal study of dietary patterns and hypertension in adults: China health and nutrition survey 1991-2018. Hypertens Res. (2023) 46:2264–71. doi: 10.1038/s41440-023-01322-x
14. Ruan, Y, Huang, Y, Zhang, Q, Qin, S, Du, X, and Sun, Y. Association between dietary patterns and hypertension among Han and multi-ethnic population in Southwest China. BMC Public Health. (2018) 18:1106. doi: 10.1186/s12889-018-6003-7
15. Wang, H, Wang, Y, Shi, Z, Zhao, L, Jian, W, Li, K, et al. Association between dietary patterns and metabolic syndrome and modification effect of altitude: a cohort study of Tibetan adults in China. Nutrients. (2023) 15:2226. doi: 10.3390/nu15092226
17. Chinese Center for Disease Control and Prevention. China food composition Table. 2nd ed. Beijing: Peking University Medical Press (2009).
18. Peng, W, Liu, Y, Malowany, M, Chen, H, Su, X, and Liu, Y. Metabolic syndrome and its relation to dietary patterns among a selected urbanised and semi-urbanised Tibetan population in transition from nomadic to settled living environment. Public Health Nutr. (2021) 24:984–92. doi: 10.1017/s1368980019004798
19. Zhang, X, Meng, Q, Feng, J, Liao, H, Shi, R, Shi, D, et al. The prevalence of hyperuricemia and its correlates in Ganzi Tibetan autonomous prefecture, Sichuan Province, China. Lipids Health Dis. (2018) 17:235. doi: 10.1186/s12944-018-0882-6
20. Joint Committee for Guideline Revision. Chinese guidelines for prevention and treatment of hypertension-a report of the revision Committee of Chinese Guidelines for prevention and treatment of hypertension. J Geriatr Cardiol. (2018, 2019) 16:182–241. doi: 10.11909/j.issn.1671-5411.2019.03.014
21. Community Development Society. Guideline for prevention and treatment of type 2 diabetes mellitus in China (2020 edition). Chin J Diab Mellitus. (2021) 13:315–409.
22. Joint Committee for Guideline Revision. Chinese adult dyslipidemia prevention and treatment guideline (2016 revision). Chinese Circ J. (2016) 31:937–50.
24. Li, T, Tang, X, Liu, Y, Li, Y, and He, B. Dietary patterns and metabolic syndrome among urbanized Tibetans: a cross-sectional study. Environ Res. (2021) 200:111354. doi: 10.1016/j.envres.2021.111354
25. Wang, D, He, Y, Li, Y, Luan, D, Yang, X, Zhai, F, et al. Dietary patterns and hypertension among Chinese adults: a nationally representative cross-sectional study. BMC Public Health. (2011) 11:925. doi: 10.1186/1471-2458-11-925
26. Zhai, FY, Du, SF, Wang, ZH, Zhang, JG, Du, WW, and Popkin, BM. Dynamics of the Chinese diet and the role of Urbanicity, 1991-2011. Obes Rev. (2014) 15 Suppl 1:16–26. doi: 10.1111/obr.12124
27. Batis, C, Sotres-Alvarez, D, Gordon-Larsen, P, Mendez, MA, Adair, L, and Popkin, B. Longitudinal analysis of dietary patterns in Chinese adults from 1991 to 2009. Br J Nutr. (2014) 111:1441–51. doi: 10.1017/s0007114513003917
28. Allen, TS, Bhatia, HS, Wood, AC, Momin, SR, and Allison, MA. State-of-the-art review: evidence on red meat consumption and hypertension outcomes. Am J Hypertens. (2022) 35:679–87. doi: 10.1093/ajh/hpac064
29. Zhang, X, Liang, S, Chen, X, Yang, J, Zhou, Y, Du, L, et al. Red/processed meat consumption and non-cancer-related outcomes in humans: umbrella review. Br J Nutr. (2023) 130:484–94. doi: 10.1017/s0007114522003415
30. Grillo, A, Salvi, L, Coruzzi, P, Salvi, P, and Parati, G. Sodium intake and hypertension. Nutrients. (2019) 11:9. doi: 10.3390/nu11091970
31. Sacks, FM, and Campos, H. Dietary therapy in hypertension. N Engl J Med. (2010) 362:2102–12. doi: 10.1056/NEJMct0911013
32. Oude Griep, LM, Seferidi, P, Stamler, J, Van Horn, L, Chan, Q, Tzoulaki, I, et al. Relation of unprocessed, processed red meat and poultry consumption to blood pressure in east Asian and Western adults. J Hypertens. (2016) 34:1721–9. doi: 10.1097/hjh.0000000000001008
33. Micha, R, Michas, G, and Mozaffarian, D. Unprocessed red and processed meats and risk of coronary artery disease and type 2 diabetes--an updated review of the evidence. Curr Atheroscler Rep. (2012) 14:515–24. doi: 10.1007/s11883-012-0282-8
34. Kotopoulou, S, Zampelas, A, and Magriplis, E. Nitrite and nitrate intake from processed meat is associated with elevated diastolic blood pressure (Dbp). Clin Nutr. (2023) 42:784–92. doi: 10.1016/j.clnu.2023.03.015
35. Kleinbongard, P, Dejam, A, Lauer, T, Jax, T, Kerber, S, Gharini, P, et al. Plasma nitrite concentrations reflect the degree of endothelial dysfunction in humans. Free Radic Biol Med. (2006) 40:295–302. doi: 10.1016/j.freeradbiomed.2005.08.025
36. Thøgersen, R, Rasmussen, MK, Sundekilde, UK, Goethals, SA, Van Hecke, T, Vossen, E, et al. Background diet influences Tmao concentrations associated with red meat intake without influencing apparent hepatic Tmao-related activity in a porcine model. Meta. (2020) 10:57. doi: 10.3390/metabo10020057
37. Beckman, JA, and Shibao, CA. Trimethylamine-N-oxide, more red meat for the vascular scientists. Hypertension. (2020) 76:40–1. doi: 10.1161/hypertensionaha.120.14857
38. Liang, J, Wen, Y, Yin, J, Zhu, G, and Wang, T. Utilization of plant-based foods for effective prevention of chronic diseases: a longitudinal cohort study. NPJ Sci Food. (2024) 8:113. doi: 10.1038/s41538-024-00362-y
39. Aljuraiban, GS, Pertiwi, K, Stamler, J, Chan, Q, Geleijnse, JM, Van Horn, L, et al. Potato consumption, by preparation method and meal quality, with blood pressure and body mass index: the Intermap study. Clin Nutr. (2020) 39:3042–8. doi: 10.1016/j.clnu.2020.01.007
40. Borgi, L, Rimm, EB, Willett, WC, and Forman, JP. Potato intake and incidence of hypertension: results from three prospective us cohort studies. BMJ. (2016) 353:i2351. doi: 10.1136/bmj.i2351
41. Su, Y, Liu, X, Jiang, B, He, H, Li, F, Li, X, et al. Potato intake and the risk of overweight/obesity, hypertension, diabetes, and cardiovascular disease: a systematic review and Meta-analysis of observational studies. Nutr Rev. (2024) 83:466–78. doi: 10.1093/nutrit/nuae159
42. Atkinson, FS, Foster-Powell, K, and Brand-Miller, JC. International tables of glycemic index and glycemic load values: 2008. Diabetes Care. (2008) 31:2281–3. doi: 10.2337/dc08-1239
43. Li, S, Wang, M, Li, C, Meng, Q, Meng, Y, Ying, J, et al. Beneficial effects of partly milled Highland barley on the prevention of high-fat diet-induced Glycometabolic disorder and the modulation of gut microbiota in mice. Nutrients. (2022) 14:762. doi: 10.3390/nu14040762
44. Feng, Y, Zhao, Y, Liu, J, Huang, Z, Yang, X, Qin, P, et al. Consumption of dairy products and the risk of overweight or obesity, hypertension, and type 2 diabetes mellitus: a dose-response Meta-analysis and systematic review of cohort studies. Adv Nutr. (2022) 13:2165–79. doi: 10.1093/advances/nmac096
45. Shi, Z, and Ganji, V. Dietary patterns and cardiovascular disease risk among Chinese adults: a prospective cohort study. Eur J Clin Nutr. (2020) 74:1725–35. doi: 10.1038/s41430-020-0668-6
46. Madsen, H, Sen, A, and Aune, D. Fruit and vegetable consumption and the risk of hypertension: a systematic review and meta-analysis of prospective studies. Eur J Nutr. (2023) 62:1941–55. doi: 10.1007/s00394-023-03145-5
47. Reynolds, A, Mann, J, Cummings, J, Winter, N, Mete, E, and Te Morenga, L. Carbohydrate quality and human health: a series of systematic reviews and meta-analyses. Lancet. (2019) 393:434–45. doi: 10.1016/s0140-6736(18)31809-9
48. Eberhardt, MV, Lee, CY, and Liu, RH. Antioxidant activity of fresh apples. Nature. (2000) 405:903–4. doi: 10.1038/35016151
49. Bondonno, CP, Croft, KD, Ward, N, Considine, MJ, and Hodgson, JM. Dietary flavonoids and nitrate: effects on nitric oxide and vascular function. Nutr Rev. (2015) 73:216–35. doi: 10.1093/nutrit/nuu014
50. Saneei, P, Larijani, B, and Esmaillzadeh, A. Rice consumption, incidence of chronic diseases and risk of mortality: meta-analysis of cohort studies. Public Health Nutr. (2017) 20:233–44. doi: 10.1017/s1368980016002172
51. Wei, Y, Su, X, Wang, G, Zu, C, Meng, Q, Zhang, Y, et al. Quantity and variety of food groups consumption and the risk of hypertension in adults: a prospective cohort study. Hypertens Res. (2024). doi: 10.1038/s41440-024-02036-4
52. Wang, C, Zheng, Y, Zhang, Y, Liu, D, Guo, L, Wang, B, et al. Dietary patterns in association with hypertension: a community-based study in eastern China. Front Nutr. (2022) 9:926390. doi: 10.3389/fnut.2022.926390
53. Mozaffarian, D, and Wu, JHY. Flavonoids, dairy foods, and cardiovascular and metabolic health: a review of emerging biologic pathways. Circ Res. (2018) 122:369–84. doi: 10.1161/circresaha.117.309008
54. Thorning, TK, Bertram, HC, Bonjour, JP, de Groot, L, Dupont, D, Feeney, E, et al. Whole dairy matrix or single nutrients in assessment of health effects: current evidence and knowledge gaps. Am J Clin Nutr. (2017) 105:1033–45. doi: 10.3945/ajcn.116.151548
55. Park, KM, and Cifelli, CJ. Dairy and blood pressure: a fresh look at the evidence. Nutr Rev. (2013) 71:149–57. doi: 10.1111/nure.12017
Keywords: Tibetan, dietary patterns, hypertension, food frequency questionnaire, principal component analysis
Citation: Li X, Zhang X, Gou Q, Meng Q and Chen X (2025) Association of dietary patterns with hypertension among adults residing in Tibetan China: findings from a population-based study. Front. Nutr. 12:1534915. doi: 10.3389/fnut.2025.1534915
Edited by:
Agnieszka Kujawska, Nicolaus Copernicus University in Toruń, PolandReviewed by:
Akinkunmi Paul Okekunle, University of Ibadan, NigeriaCopyright © 2025 Li, Zhang, Gou, Meng and Chen. This is an open-access article distributed under the terms of the Creative Commons Attribution License (CC BY). The use, distribution or reproduction in other forums is permitted, provided the original author(s) and the copyright owner(s) are credited and that the original publication in this journal is cited, in accordance with accepted academic practice. No use, distribution or reproduction is permitted which does not comply with these terms.
*Correspondence: Xiaoping Chen, eGlhb3BpbmdjaGVuMjJAMTYzLmNvbQ==
†These authors have contributed equally to this work and share first authorship
Disclaimer: All claims expressed in this article are solely those of the authors and do not necessarily represent those of their affiliated organizations, or those of the publisher, the editors and the reviewers. Any product that may be evaluated in this article or claim that may be made by its manufacturer is not guaranteed or endorsed by the publisher.
Research integrity at Frontiers
Learn more about the work of our research integrity team to safeguard the quality of each article we publish.