 Guotao Liu
 Jianyuan Zhang
94% of researchers rate our articles as excellent or good
Learn more about the work of our research integrity team to safeguard the quality of each article we publish.
Find out more
ORIGINAL RESEARCH article
Front. Nutr., 03 February 2025
Sec. Clinical Nutrition
Volume 12 - 2025 | https://doi.org/10.3389/fnut.2025.1486917
Purpose: The triglyceride-cholesterol-body weight index (TCBI), a novel and easily computable nutritional index, incorporates serum triglyceride (TG), total cholesterol (TC), and body weight (BW). This study explored the association between TCBI and cognitive impairment in middle-aged and elderly Chinese populations.
Patients and methods: This cross-sectional study employed data from the China Health and Retirement Longitudinal Study (CHARLS) baseline survey, including 7,145 participants. TCBI was calculated as TG (mg/dL) × TC (mg/dL) × BW (kg)/1,000. Cognitive function was assessed based on mental status and episodic memory, with a total score below 11 indicating cognitive impairment. The relationship between TCBI and cognitive impairment was examined using multiple logistic regression, smooth curve fitting, and subgroup analyses.
Results: After full adjustment, each 1-unit increase in log-transformed TCBI (Lg TCBI) was associated with a 29.7% reduction in cognitive impairment risk [odds ratio (OR) = 0.703, 95% confidence interval (CI): 0.529–0.933; p = 0.015]. When Lg TCBI was categorized into quartiles, the Q2, Q3, and Q4 groups exhibited a reduced risk of cognitive impairment by 19.9, 16.3, and 22.9%, respectively (p for trend = 0.043), compared to the Q1 group. Smooth curve fitting revealed a consistent decrease in cognitive impairment risk with higher Lg TCBI levels. Subgroup analysis indicated that the association was stronger among participants aged ≥60 years (OR = 0.655, 95% CI: 0.438–0.979), non-current drinkers (OR = 0.643, 95% CI: 0.451–0.917), and those who engaged in socializing (OR = 0.568, 95% CI: 0.371–0.871).
Conclusion: TCBI was significantly and negatively associated with cognitive impairment in Chinese middle-aged and elderly individuals, with the effect more pronounced in those aged ≥60 years, non-current drinkers, and socially active participants.
Cognitive impairment comprises various cognitive dysfunctions, ranging from mild cognitive impairment (MCI) to dementia. An epidemiological survey conducted in 2020 reported that approximately 38.77 million individuals aged ≥60 years in China had MCI, while 15.07 million were affected by dementia (1). In aging populations, cognitive impairment imposes significant social and economic burdens on global public health systems. Therefore, early identification and mitigation of risk factors associated with cognitive impairment are crucial.
Cognitive impairment is linked to several risk factors, including advanced age, female gender, family history of dementia, living alone, rural residence, low educational attainment, smoking, hyperlipidemia, and cerebrovascular disease (1–5). Recent studies increasingly highlight malnutrition as a significant risk factor for cognitive impairment with nutrition playing a crucial role in preventing cognitive decline (6–9). However, existing nutritional assessment tools, such as the Prognostic Nutritional Index (PNI) (10), Controlling Nutritional Status (CONUT) (11), and the Geriatric Nutritional Risk Index (GNRI) (12), have not been extensively adopted in clinical practice owing to their complexity. In response to this gap, Doi et al. (13) proposed a new, easily calculable index known as triglycerides (TG), total cholesterol (TC), and body weight (BW) index (TCBI). The TCBI is calculated using the following formula:
Previous studies have indicated that TCBI acts as a prognostic indicator for coronary heart disease (13), critical illness requiring mechanical circulatory support (MCS) devices (14), and heart failure (15). TCBI also negatively correlates with the incidence of stroke (16) and stroke-associated pneumonia (SAP) (17). However, the relationship between TCBI and cognitive function remains unexplored. We hypothesize that higher TCBI levels may reduce the risk of cognitive impairment. Therefore, this study systematically evaluated the association between TCBI and cognitive impairment. Additionally, we explored potential moderating factors that may influence this association.
This study used data from the China Health and Retirement Longitudinal Study (CHARLS).1 CHARLS collects high-quality micro-level longitudinal survey data on households and individuals aged ≥45 years in China, by focusing on the health status of the elderly population. The baseline survey, conducted in 2011, included 17,708 participants across 150 regions and 450 villages or urban communities nationwide, providing a representative snapshot of the middle-aged and elderly population in China (18). The research employed face-to-face computer-assisted personal interview, with follow-up surveys conducted every 2 years. Data collected encompassed demographic information, health status, health behaviors, social participation, and pension insurance. This study was approved by the Biomedical Ethics Committee of Peking University (IRB00001052-11015), and all procedures adhered to the Declaration of Helsinki. Informed consent was obtained from all participants.
This study conducted a cross-sectional analysis of baseline data from CHARLS 2011. Participants were excluded based on the following criteria: age <45, absence of lipid profile data, lack of cognitive assessment data, or missing other demographic or health-related information. Ultimately, 7,145 participants were included (Figure 1).
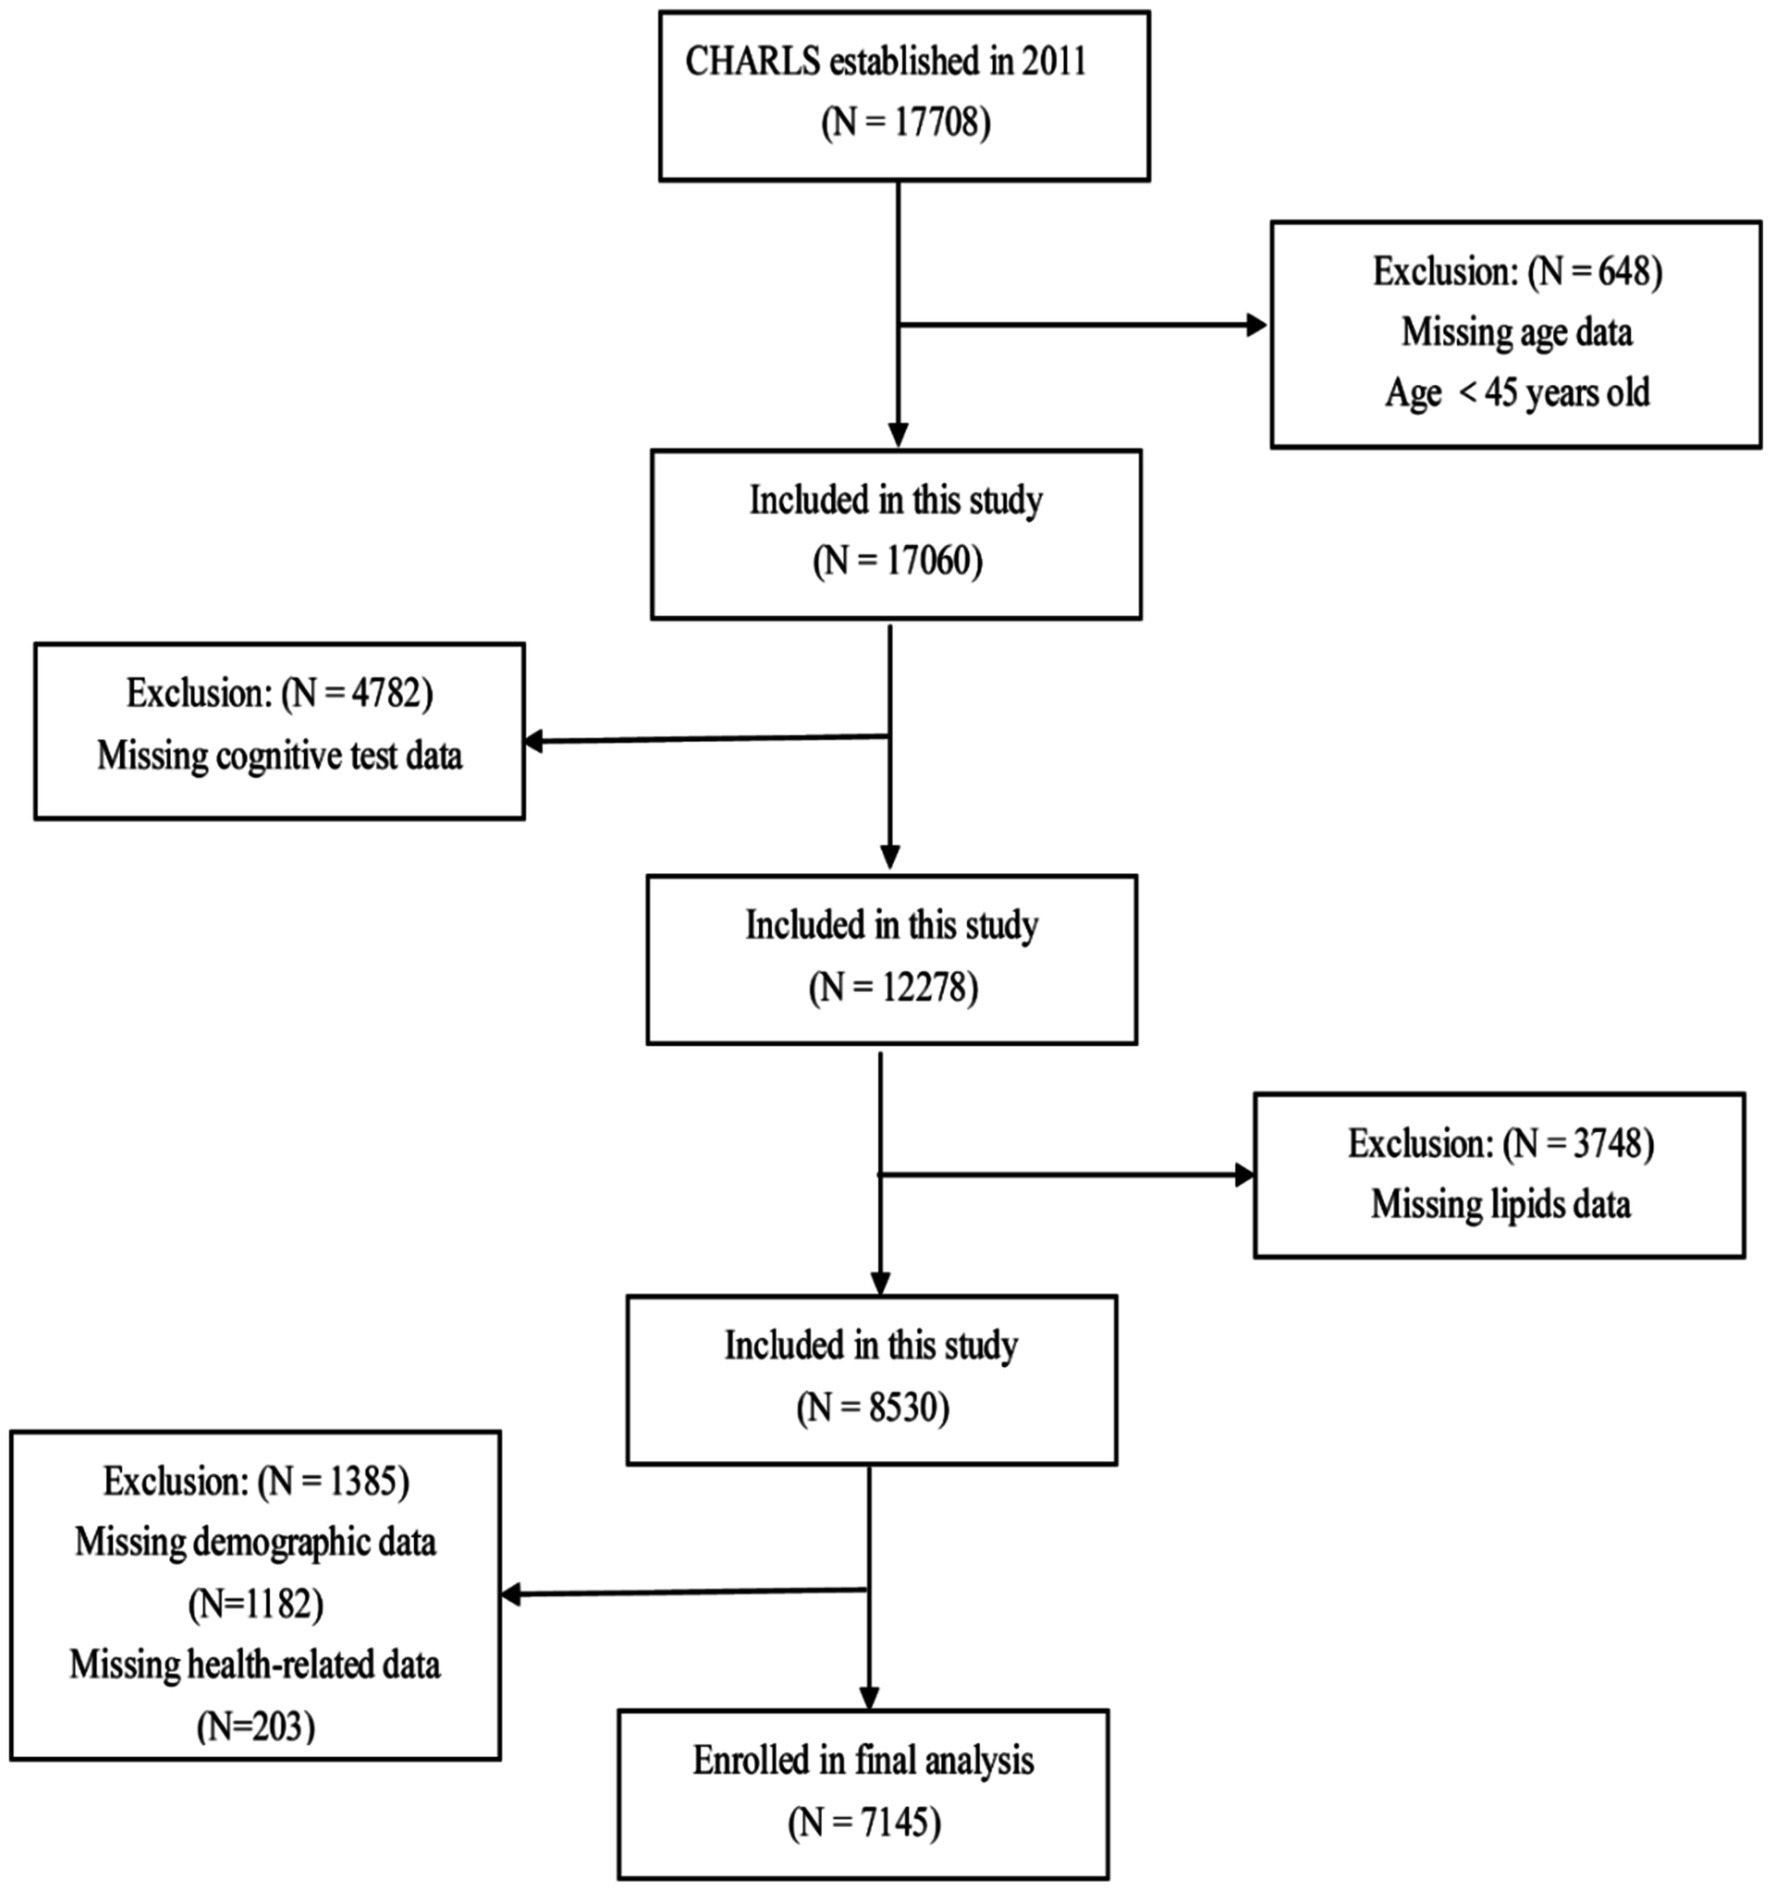
Figure 1. Participant selection process flowchart.
Cognitive function of the CHARLS study population was evaluated using the methodology of the American Health and Retirement Study (HRS) (19). This assessment encompassed two domains: mental status and episodic memory. Mental status was evaluated through data recognition, calculation, and drawing ability tests, with a maximum score of 11 points. Episodic memory was assessed using word recall tasks in which interviewers read a list of 10 words to participants, who were then asked to recall as many words as possible. After a 5-min interval, participants were required to recall the words again. Each correctly recalled word was scored as 1 point, with a maximum score of 20 points for episodic memory. The total cognitive assessment score was 31. Consistent with previous studies (19, 20), cognitive impairment was defined as a score <11.
Venous blood samples were collected from participants in the CHARLS study, subsequently isolated, and transported to the Chinese Center for Disease Control and Prevention (China CDC) in Beijing. The samples were stored at −80°C and later examined at the Clinical Laboratory Center of Capital Medical University (CMU). Lipid profile tests, including TC, low-density lipoprotein cholesterol (LDL-C), high-density lipoprotein cholesterol (HDL-C), and TG levels, were performed using enzymatic colorimetric methods. The TCBI formula is as follows: TCBI = TG (mg/dL) × TC (mg/dL) × BW (kg)/1,000. High-sensitivity C-reactive protein (hsCRP) levels were measured using an immunoturbidimetric assay.
Demographic and health-related factors were used as covariates. Demographic factors included age, sex, residence, education level, marital status, and employment status. Health-related factors included body mass index (BMI), systolic blood pressure (SBP), diastolic blood pressure (DBP), stroke, diabetes, hypertension, dyslipidemia, depressive symptoms, social engagement, and current smoking and drinking habits. BMI was calculated as weight divided by height squared (kg/m2).
In CHARLS, hypertension was defined as a self-reported diagnosis of hypertension or blood pressure measurements indicating DBP ≥90 mmHg or SBP ≥140 mmHg. Diabetes was defined as self-reported physician-diagnosed diabetes or blood test results showing fasting plasma glucose (FPG) ≥126 mg/dL or glycated hemoglobin (HbA1c) ≥6.5%. Other chronic diseases were self-reported by participants. The CHARLS survey utilized the Center for Epidemiological Studies Depression (CESD-10) scale to assess depressive risk among older adults, with a score of ≥10 indicating high depressive symptoms.
In the 2011 CHARLS survey, there were a total of 11 different types of social participation. These activities include socializing with friends; community activity room (mahjong, chess, card games, etc.); dancing, or exercising in parks, or other venues; participating in club activities; attending school or training courses; providing assistance to relatives, friends, or neighbors who do not live together; caring for patients or individuals with disabilities who do not live together; engaging in volunteer activities or charity events; stock trading; going online; and other activities. Social engagement was defined as participation in at least one of the above 11 activities in the past month.
Continuous variables were reported as mean ± standard deviation (normal distribution) or median with interquartile range (for skewed distribution). Categorical variables were presented as frequencies with percentages. Group comparisons of continuous variables were performed using one-way ANOVA or the Kruskal–Wallis H test. Categorical variables were compared using the chi-square test or the Kruskal–Wallis H test. Owing to the skewed distributions of the TCBI, it was transformed using the logarithm (log) to achieve normally. The association between clinical characteristics and cognitive impairment was assessed using a univariate logistic regression model. A multivariate logistic regression model, adjusted for age, sex, residence, education, marital status, retirement, current smoking, current drinking, socializing, hypertension, diabetes, dyslipidemia, stroke, depression symptoms, SBP, DBP, BMI, FPG, LDL-C, HDL-C, and hsCRP, was used to explore the relationship between TCBI and cognitive impairment.
Additionally, a detailed exploration of the association between TCBI and cognitive impairment was conducted using a generalized additive model with fitted smoothing curves. Stratified multivariate logistic regression models were used for subgroup analyses, according to age (45–60 and ≥60 years), sex, BMI (<24 and ≥24 kg/m2), residence (city and rural), education (illiteracy, primary school, middle school and high school and above), marital status (married and cohabiting and others), retirement, current smoking, current drinking, socializing, hypertension, diabetes, dyslipidemia, stroke, and depressive symptoms. The likelihood ratio test was used to examine interactions between subgroups. Finally, we conducted a sensitivity analysis among participants with normal blood lipid levels. All data analyses were performed using Statistical Product and Service Solutions software (SPSS, version 26.0) and EmpowerStats (http://www.empowerstats.com, X&Y Solutions, Inc., Boston, MA). A p-value of <0.05 (two-tailed) was considered statistically significant.
A flowchart of the participants is shown in Figure 1. A total of 7,145 participants were included in the study. The baseline characteristics of the participants are shown in Table 1. The average age of the participants was 58.86 ± 8.93 years, with 50.7% being males. The participants were divided into four groups based on the TCBI quartiles: Q1 (<749), Q2 (749–1,185), Q3 (1,185–1,938), and Q4 (≥1,938). No significant difference was observed in the proportion of stroke cases among the different TCBI groups (p > 0.05). In the high TCBI group (Q4), in contrast to the other three groups (Q1–Q3), participants had a higher proportion of females, rural residents, low education, married or cohabiting, socially engaged, non-retired, non-current smokers, non-current drinkers, and higher rates of hypertension, diabetes mellitus, dyslipidemia, and depressive symptoms. They also had higher levels of SBP, DBP, BMI, body weight, FPG, TC, TG, LDL-C, and hsCRP, but lower levels of age and HDL-C (p < 0.05). Additionally, the Q4 group had higher cognitive scores and a lower proportion of cognitively impaired participants (p < 0.05) than the Q1–Q3 groups.
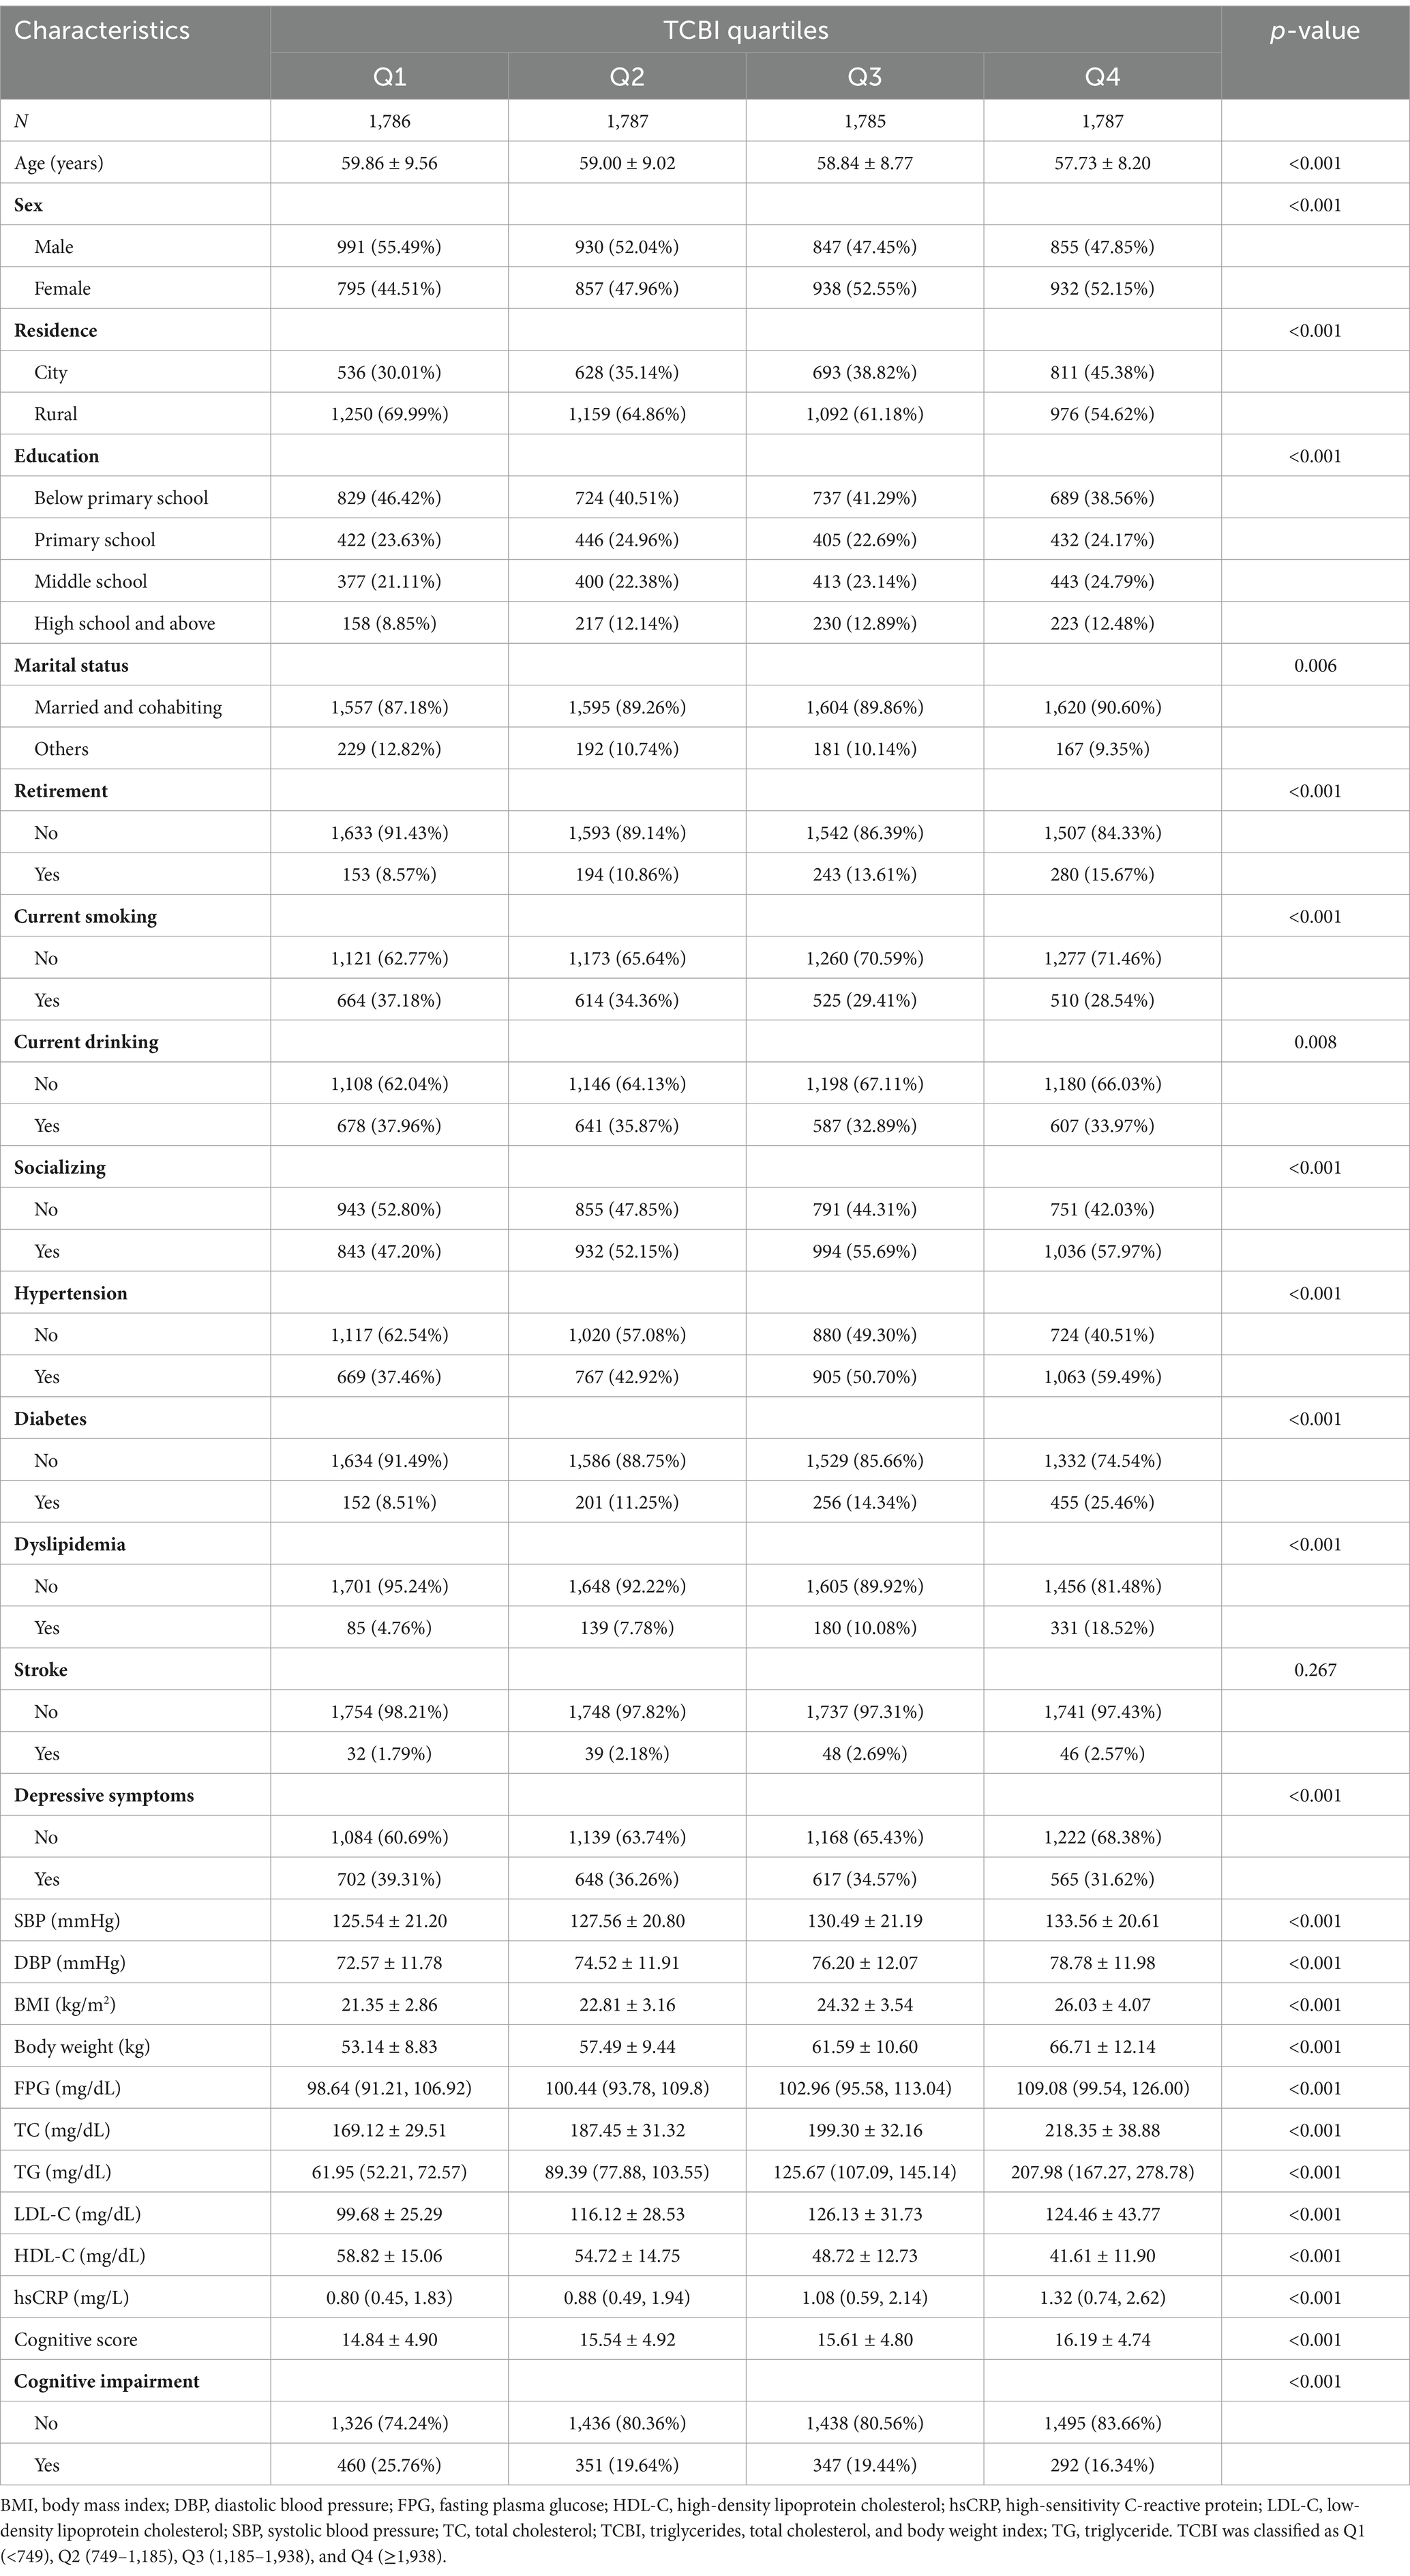
Table 1. The characteristics of participants according to quartiles of TCBI.
As shown in Table 2, univariate logistic regression analysis indicated that age, living in rural areas, hypertension, depressive symptoms, SBP, HDL-C levels, and hsCRP levels were positively associated with cognitive impairment (p < 0.05). Conversely, male sex, high education level, married and cohabiting, retired, current smoking, current drinking, social activity, dyslipidemia, BMI, TG, and TCBI were negatively associated with cognitive impairment (p < 0.05). However, diabetes, stroke, DBP, and FPG, TC, while LDL-C levels were not associated with cognitive impairment (p > 0.05).
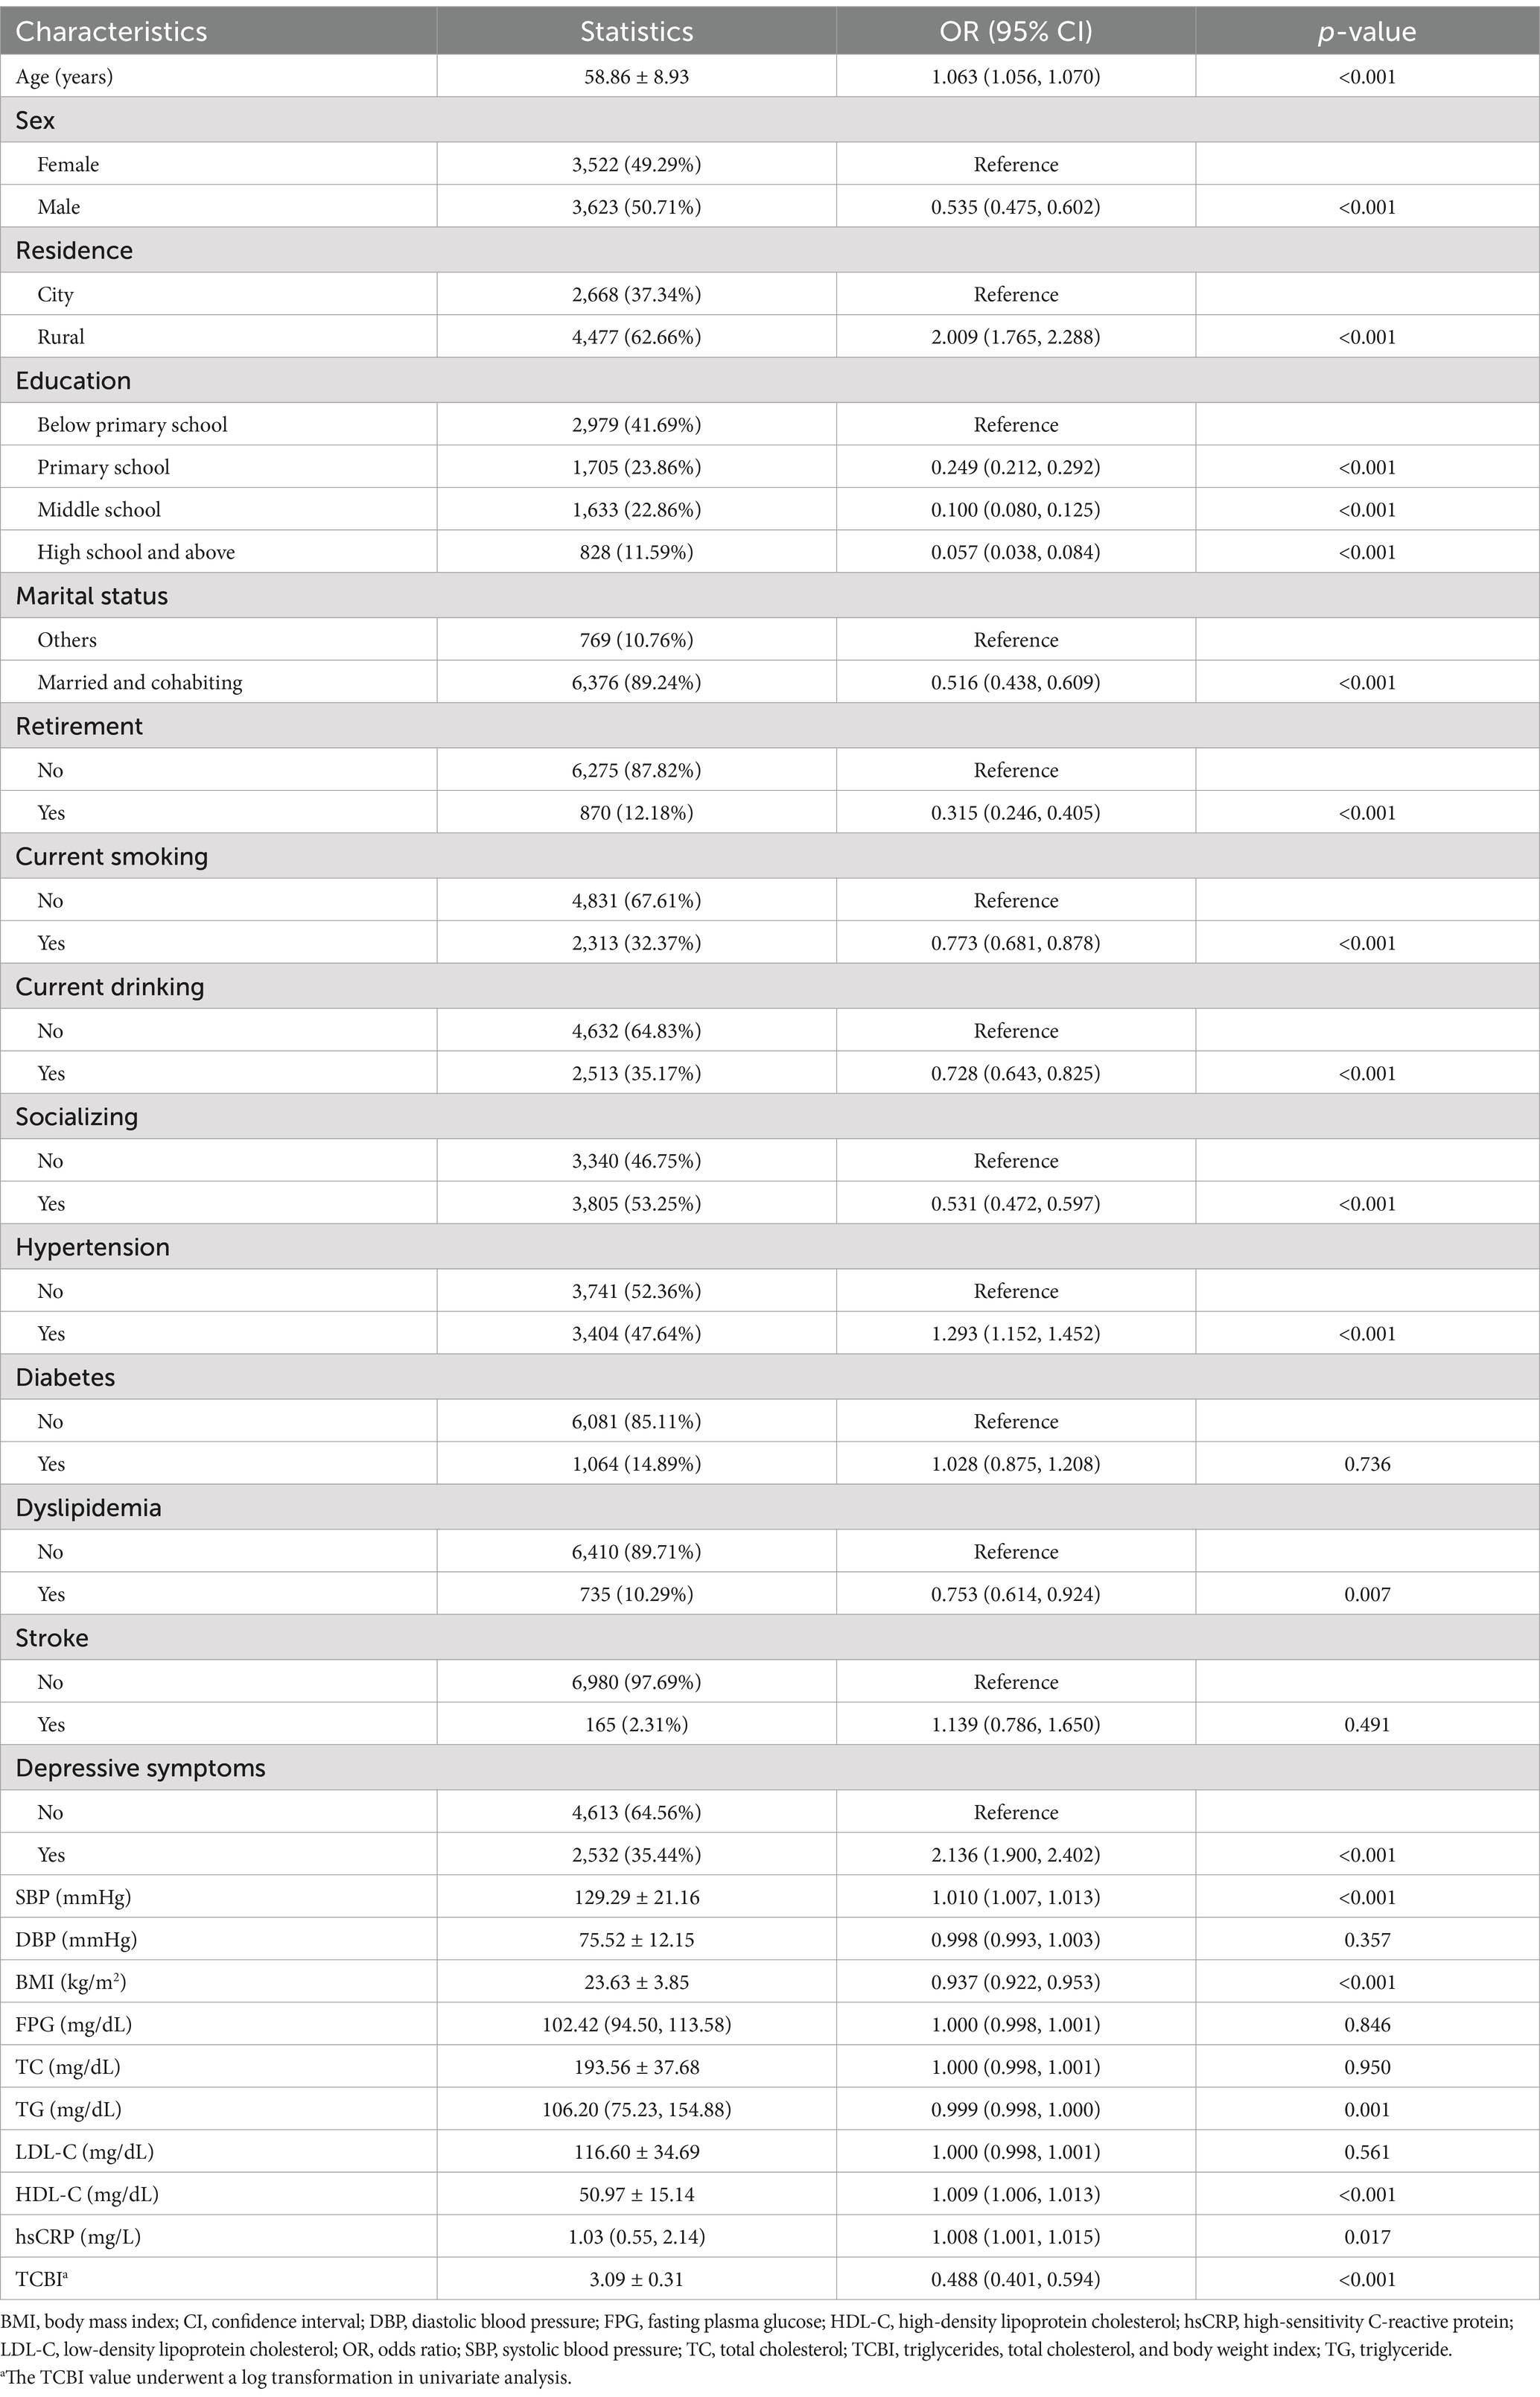
Table 2. The correlation between clinical characteristics and cognitive impairment.
We conducted a multivariable logistic regression analysis to evaluate the correlation between TCBI and cognitive impairment (Table 3). After full adjustment (Model 3), the probability of cognitive impairment decreased by 29.7% for every 1 unit increase in Lg TCBI (OR = 0.703, 95% CI: 0.529–0.933; p = 0.015). When Lg TCBI was treated as a 4-category variable, in Model 3, the incidence of cognitive impairment in the Q2, Q3, and Q4 groups was reduced by 19.9% (OR = 0.801, 95% CI: 0.667–0.962; p = 0.018), 16.3% (OR = 0.837, 95% CI: 0.684–1.024; p = 0.084), and 22.9% (OR = 0.771, 95% CI: 0.612–0.972; p = 0.028) (p for trend = 0.043) than the Q1 group. The dose-response relationship between Lg TCBI and cognitive impairment was investigated using smooth curve fitting. The results showed that the incidence of cognitive impairment decreased as Lg TCBI levels increased (Figure 2).
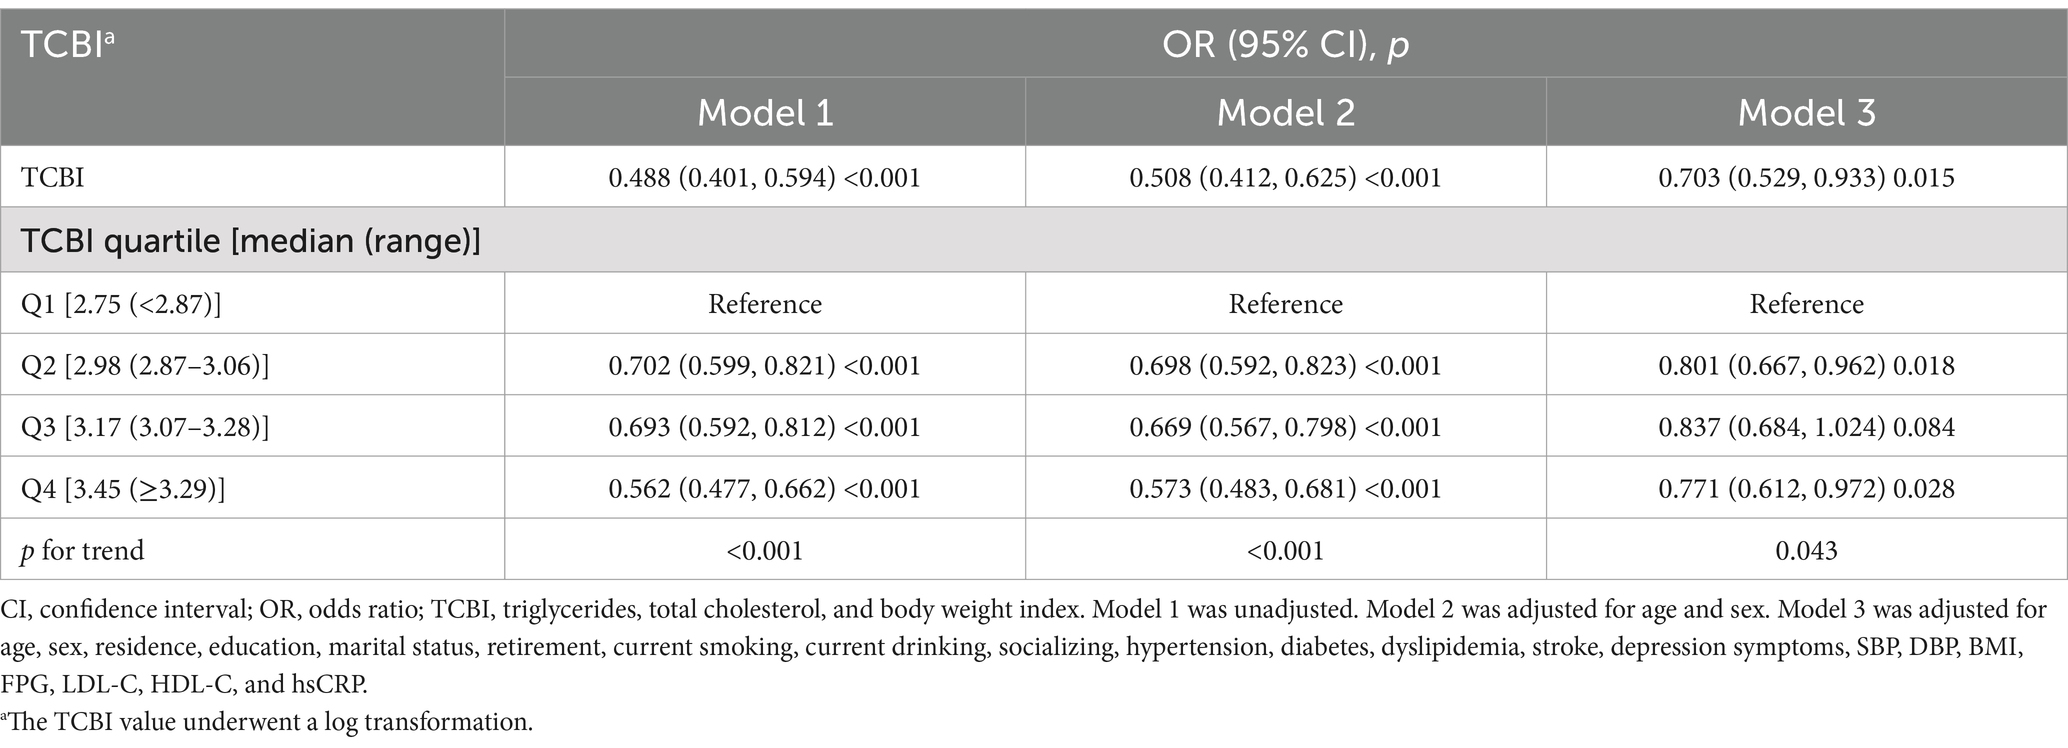
Table 3. Association between TCBI and cognitive impairment.
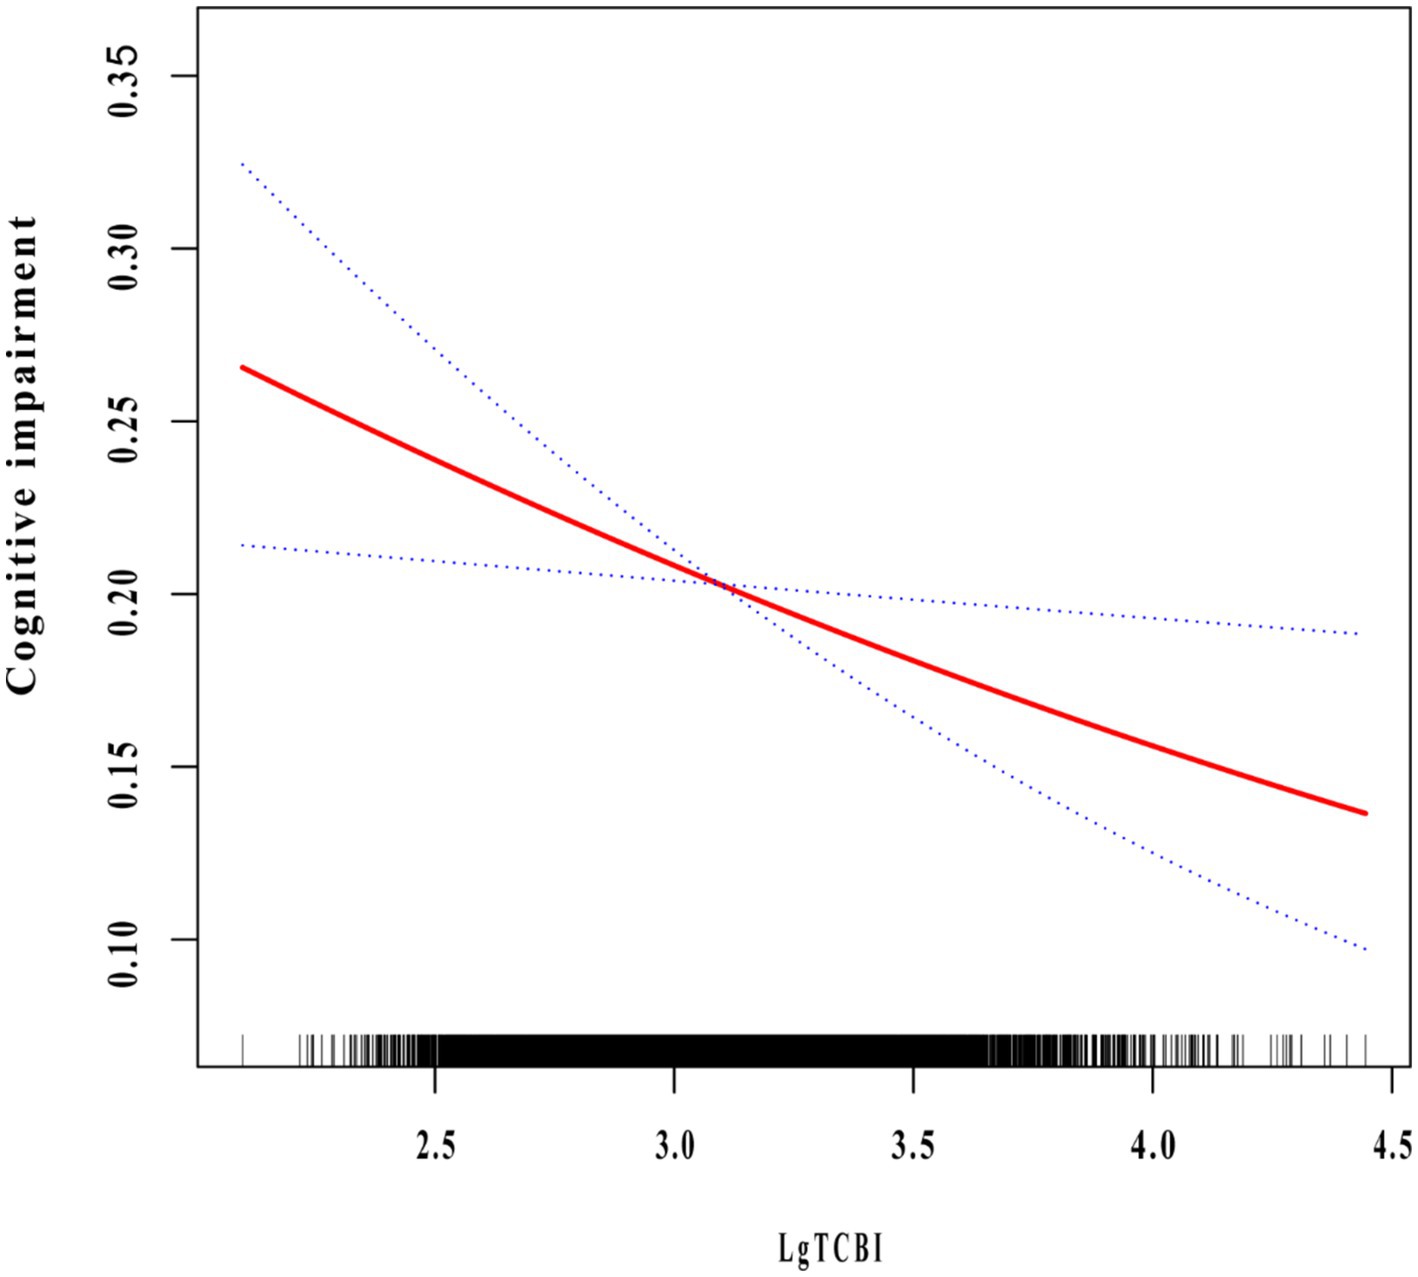
Figure 2. The association between TCBI and cognitive impairment. The relationship was detected after adjusting for age, sex, residence, education, marital status, retirement, current smoking, current drinking, socializing, hypertension, diabetes, dyslipidemia, stroke, depression symptoms, SBP, DBP, BMI, FPG, LDL-C, HDL-C, and hsCRP.
Stratified analyses were conducted to evaluate the correlation between TCBI and cognitive impairment in the different subgroups (Table 4). Significant interactions were observed for age, current drinking, and socialization (p < 0.05). The negative impact of TCBI on cognitive impairment was more pronounced in participants aged ≥60 years (OR = 0.655, 95% CI: 0.438–0.979; p for interaction = 0.039), non-current drinking (OR = 0.643, 95% CI: 0.451–0.917; p for interaction = 0.015), and those engaged in socializing (OR = 0.568, 95% CI: 0.371–0.871; p for interaction = 0.009).

Table 4. The effect size of TCBI on cognitive impairment in the subgroup.
After excluding participants with dyslipidemia, we evaluated the correlation between TCBI and cognitive impairment by multiple logistic regression analysis (Table 5). After adjusting for age, sex, residence, education, marital status, retirement, current smoking, current drinking, socializing, hypertension, diabetes, stroke, depression symptoms, SBP, DBP, BMI, FPG, and hsCRP, the probability of cognitive impairment decreased by 32.7% for every 1 unit increase in Lg TCBI (OR = 0.673, 95% CI: 0.515–0.878; p = 0.004). When Lg TCBI was treated as a 4-category variable, the incidence of cognitive impairment in the Q2, Q3, and Q4 groups was reduced by 21.6% (OR = 0.784, 95% CI: 0.650–0.947; p = 0.011), 19.6% (OR = 0.804, 95% CI: 0.662–0.976; p = 0.027), and 24.3% (OR = 0.757, 95% CI: 0.610–0.940; p = 0.012) (p for trend = 0.018) than the Q1 group. The negative relationship between TCBI and cognitive impairment is robust and reliable.
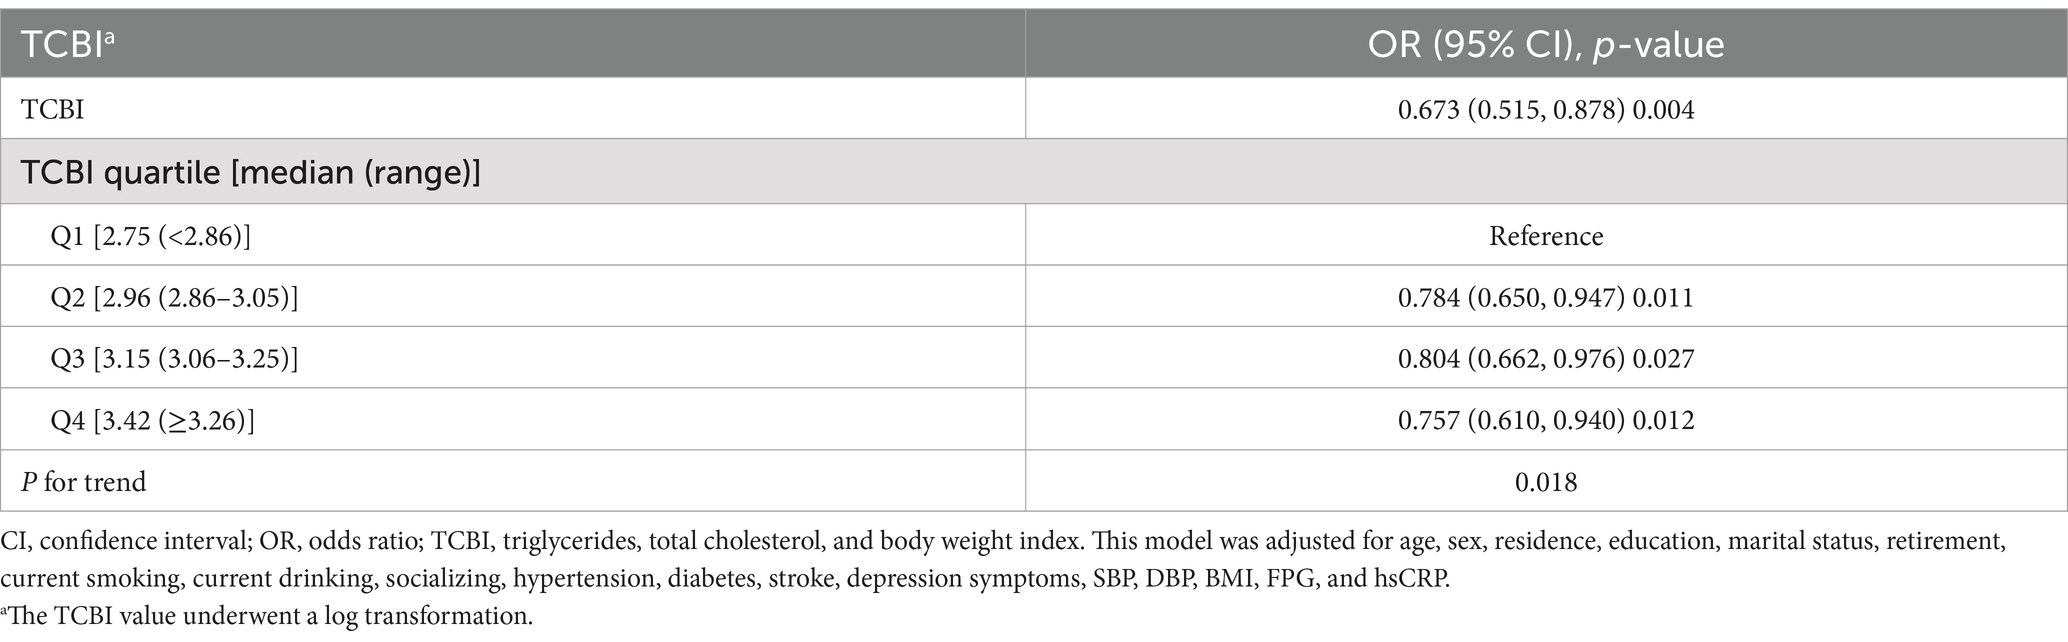
Table 5. Association between TCBI and cognitive impairment in participants with normal blood lipids.
In this cross-sectional study involving 7,145 middle-aged and elderly Chinese individuals, we found a significant association between overnutrition and cognitive impairment. The results indicate that an increase in TCBI levels is related to a reduced risk of cognitive impairment, particularly among participants aged ≥60 years, non-current drinkers, and those actively engaged in social activities.
In recent years, the correlation between nutritional status and disease occurrence and prognosis has received increasing attention. Previous nutritional assessment methods, such as the PNI, COUNT, and GNRI have not been extensively used in clinical practice because of their complexity and the numerous parameters required for their calculation. In 2017, Doi et al. (13) proposed a nutritional index known as the TCBI, which only requires triglycerides, total cholesterol, and body weight for calculation. Subsequent studies demonstrated that TCBI is an effective prognostic indicator in patients with coronary heart disease (13), MCS devices (14), and heart failure (15). Shi et al. (16) also indicated that TCBI was negatively correlated with the incidence of stroke in patients with hypertension. Liu et al. (17) found that TCBI reduced the risk of SAP. However, the relationship between TCBI and cognitive impairment remains unclear. To the best of our knowledge, this study is the first to explore the correlation between TCBI and cognitive impairment.
The relationship between undernutrition and cognitive impairment is complex and not yet fully understood. A review of neurodegenerative diseases indicated that undernutrition and low BMI are associated with dementia and higher mortality rates (21). Another recent review showed that undernutrition may lead to a cognitive decline, while improved nutritional status may enhance cognitive function (7). Loda et al. (9) suggested that individuals in the early stages of cognitive impairment are susceptible to energy-protein undernutrition and micronutrient deficiencies. A cross-sectional study by He et al. (8) found that the nutritional status of patients with Alzheimer’s disease (AD) was significantly worse than that of the control group and tended to worsen with the progression of AD. Tsutsumiuchi et al. (22) discovered that most patients with post-stroke cognitive impairment (PSCI) are malnourished, which is closely linked to their prognosis. Additionally, guidelines from the European Society for Clinical Nutrition and Metabolism (ESPEN) suggest a vicious cycle between malnutrition and cognitive impairment, recommending nutritional care and support as part of dementia management (23). In our study, regardless of whether TCBI was treated as a continuous or categorical variable, the results consistently showed that higher TCBI levels reduced the risk of cognitive impairment, with smooth curve fitting further validated this negative correlation.
However, a recent review suggests that over-nutrition leads to cognitive decline by affecting insulin resistance, gut-brain axis, and neuroinflammation (24). The contrasting conclusions regarding the impact of undernutrition or overnutrition on cognition mirror debates surrounding BMI in the context of the obesity paradox or reverse epidemiology. A study by Dramé and Godaert (25) found that obesity in older adults may be associated with a lower risk of death, particularly among individuals with chronic diseases. While BMI as a measurement has limitations, as it fails to reflect differences in body fat and muscle mass. Bosello and Vanzo (26) suggested that traditional weight indicators (such as BMI) fail to accurately reflect the health status of elderly individuals, leading to an underestimation of the impact of obesity on morbidity and mortality. Similarly, current studies lack consistent methods for screening nutritional status, uniform assessment tools for cognitive function, and large-scale randomized controlled trials, hindering the establishment of a causal relationship between nutritional status and cognitive impairment. Extensive research is warranted to determine the most beneficial nutritional status for health, chronic diseases prevention, and longevity.
The mechanisms linking nutritional status and cognitive function remain unclear. Better nutritional status can provide a variety of amino acids to improve cognitive function by synthesizing neurotransmitter precursors, maintaining brain function, reducing brain inflammation, and increasing muscle protein synthesis (27). Nutrients, such as omega-3 fatty acids, B vitamins, and antioxidants counteract the pathological processes that cause cognitive impairment (28). Increased nutritional supplementation promotes the activation of neuroprotein synthesis and enhances the formation of new cortical connections and axonal sprouting, thereby facilitating cognitive recovery (29). Sufficient serum albumin can maintain colloid osmotic pressure and blood volume, ensure adequate blood supply to the central nervous system, enhance antioxidant capacity, and reduce the risk of cognitive function impairment (30). On the other hand, undernutrition can induce inflammation and oxidative stress (31), leading to brain neuronal necrosis. Nutritional deficiency may lead to synaptic dysfunction, neuronal loss, and cortical thinning, ultimately resulting in cognitive deficits (6). Moreover, undernutrition may alter the composition of gut microbiota, leading to significant changes in autoimmune and inflammatory responses, which can contribute to the deposition of amyloid-β in AD (32, 33).
This study has several limitations. First, cross-sectional study only provided a snapshot of data at a single point in time, making it difficult to determine whether changes in TCBI precede cognitive impairment or if cognitive impairment influences variations in TCBI. So it could not establish a causal relationship between TCBI and cognitive impairment. More robust longitudinal studies are needed. Second, the assessment of cognitive function lacked brain MRI parameters. Third, our study was limited to China, and ethnic differences may have affected the generalizability of the results. Finally, the confounding factors considered in this study may not encompass all potential influencing factors.
TCBI is negatively correlated with cognitive impairment in the Chinese middle-aged and elderly population, particularly among participants aged ≥60, non-current drinkers, and those engaged in social activities.
The datasets presented in this study can be found in online repositories. The names of the repository/repositories and accession number(s) can be found at: https://charls.pku.edu.cn.
The studies involving humans were approved by the Biomedical Ethics Committee of Peking University (IRB00001052-11015). The studies were conducted in accordance with the local legislation and institutional requirements. Written informed consent for participation was not required from the participants or the participants’ legal guardians/next of kin in accordance with the national legislation and institutional requirements.
GL: Conceptualization, Data curation, Formal analysis, Investigation, Methodology, Resources, Software, Validation, Visualization, Writing – original draft. JZ: Conceptualization, Data curation, Formal analysis, Investigation, Methodology, Project administration, Resources, Software, Supervision, Validation, Writing – review & editing.
The author(s) declare that financial support was received for the research, authorship, and/or publication of this article. This research was funded by grants from the Qingdao Clinical Research Center for Rare Diseases of Nervous System (22-3-7-lczx-3-nsh) and the Qingdao Technology Program for Health and Welfare (20-3-4-42-nsh).
The authors would like to thank all the participants and researchers of CHARLS.
The authors declare that the research was conducted in the absence of any commercial or financial relationships that could be construed as a potential conflict of interest.
All claims expressed in this article are solely those of the authors and do not necessarily represent those of their affiliated organizations, or those of the publisher, the editors and the reviewers. Any product that may be evaluated in this article, or claim that may be made by its manufacturer, is not guaranteed or endorsed by the publisher.
1. Jia, L, Du, Y, Chu, L, Zhang, Z, Li, F, Lyu, D, et al. Prevalence, risk factors, and management of dementia and mild cognitive impairment in adults aged 60 years or older in China: a cross-sectional study. Lancet Public Health. (2020) 5:e661–71. doi: 10.1016/s2468-2667(20)30185-7
2. Kalaria, RN, Maestre, GE, Arizaga, R, Friedland, RP, Galasko, D, Hall, K, et al. Alzheimer’s disease and vascular dementia in developing countries: prevalence, management, and risk factors. Lancet Neurol. (2008) 7:812–26. doi: 10.1016/s1474-4422(08)70169-8
3. Langa, KM, Larson, EB, Crimmins, EM, Faul, JD, Levine, DA, Kabeto, MU, et al. A comparison of the prevalence of dementia in the United States in 2000 and 2012. JAMA Intern Med. (2017) 177:51–8. doi: 10.1001/jamainternmed.2016.6807
4. Penninkilampi, R, Casey, A-N, Singh, MF, and Brodaty, H. The association between social engagement, loneliness, and risk of dementia: a systematic review and meta-analysis. J Alzheimers Dis. (2018) 66:1619–33. doi: 10.3233/jad-180439
5. Pendlebury, ST, and Rothwell, PM. Incidence and prevalence of dementia associated with transient ischaemic attack and stroke: analysis of the population-based Oxford Vascular Study. Lancet Neurol. (2019) 18:248–58. doi: 10.1016/s1474-4422(18)30442-3
6. Yu, W, Yu, W, Liu, X, Wan, T, Chen, C, Xiong, L, et al. Associations between malnutrition and cognitive impairment in an elderly Chinese population: an analysis based on a 7-year database. Psychogeriatrics. (2020) 21:80–8. doi: 10.1111/psyg.12631
7. Carey, S, Deng, J, and Ferrie, S. The impact of malnutrition on cognition in older adults: a systematic review. Clin Nutr ESPEN. (2024) 63:177–83. doi: 10.1016/j.clnesp.2024.06.014
8. He, M, Lian, T, Liu, Z, Li, J, Qi, J, Li, J, et al. An investigation into the potential association between nutrition and Alzheimer’s disease. Front Nutr. (2024) 11:1306226. doi: 10.3389/fnut.2024.1306226
9. Loda, I, D’Angelo, E, Marzetti, E, and Kerminen, H. Prevention, assessment, and management of malnutrition in older adults with early stages of cognitive disorders. Nutrients. (2024) 16:1566. doi: 10.3390/nu16111566
10. Buzby, GP, Mullen, JL, Matthews, DC, Hobbs, CL, and Rosato, EF. Prognostic nutritional index in gastrointestinal surgery. Am J Surg. (1980) 139:160–7. doi: 10.1016/0002-9610(80)90246-9
11. Ignacio de Ulíbarri, J, González-Madroño, A, de Villar, N, González, P, González, B, Mancha, A, et al. CONUT: a tool for controlling nutritional status. First validation in a hospital population. Nutr Hosp. (2005) 20:38–45.
12. Bouillanne, O, Morineau, G, Dupont, C, Coulombel, I, Vincent, J-P, Nicolis, I, et al. Geriatric Nutritional Risk Index: a new index for evaluating at-risk elderly medical patients. Am J Clin Nutr. (2005) 82:777–83. doi: 10.1093/ajcn/82.4.777
13. Doi, S, Iwata, H, Wada, H, Funamizu, T, Shitara, J, Endo, H, et al. A novel and simply calculated nutritional index serves as a useful prognostic indicator in patients with coronary artery disease. Int J Cardiol. (2018) 262:92–8. doi: 10.1016/j.ijcard.2018.02.039
14. Minami-Takano, A, Iwata, H, Miyosawa, K, Kubota, K, Kimura, A, Osawa, S, et al. A novel nutritional index serves as a useful prognostic indicator in cardiac critical patients requiring mechanical circulatory support. Nutrients. (2019) 11:1420. doi: 10.3390/nu11061420
15. Ishiwata, S, Yatsu, S, Kasai, T, Sato, A, Matsumoto, H, Shitara, J, et al. Prognostic effect of a novel simply calculated nutritional index in acute decompensated heart failure. Nutrients. (2020) 12:3311. doi: 10.3390/nu12113311
16. Shi, Y, Wang, X, Yu, C, Zhou, W, Wang, T, Zhu, L, et al. Association of a novel nutritional index with stroke in Chinese population with hypertension: insight from the China H-type hypertension registry study. Front Nutr. (2023) 10:997180. doi: 10.3389/fnut.2023.997180
17. Liu, Y, Chen, Y, Zhi, Z, Wang, P, Wang, M, Li, Q, et al. Association between TCBI (triglycerides, total cholesterol, and body weight index) and stroke-associated pneumonia in acute ischemic stroke patients. Clin Interv Aging. (2024) 19:1091–101. doi: 10.2147/cia.S467577
18. Zhao, Y, Hu, Y, Smith, JP, Strauss, J, and Yang, G. Cohort profile: the China Health and Retirement Longitudinal Study (CHARLS). Int J Epidemiol. (2012) 43:61–8. doi: 10.1093/ije/dys203
19. Crimmins, EM, Kim, JK, Langa, KM, and Weir, DR. Assessment of cognition using surveys and neuropsychological assessment: the health and retirement study and the aging, demographics, and memory study. J Gerontol B. (2011) 66B:i162–71. doi: 10.1093/geronb/gbr048
20. Zhou, S, Song, S, Jin, Y, and Zheng, Z-J. Prospective association between social engagement and cognitive impairment among middle-aged and older adults: evidence from the China Health and Retirement Longitudinal Study. BMJ Open. (2020) 10:e040936. doi: 10.1136/bmjopen-2020-040936
21. Bianchi, VE, Herrera, PF, and Laura, R. Effect of nutrition on neurodegenerative diseases. A systematic review. Nutr Neurosci. (2019) 24:810–34. doi: 10.1080/1028415x.2019.1681088
22. Tsutsumiuchi, K, Wakabayashi, H, Maeda, K, and Shamoto, H. Impact of malnutrition on post-stroke cognitive impairment in convalescent rehabilitation ward inpatients. Eur Geriatr Med. (2020) 12:167–74. doi: 10.1007/s41999-020-00393-0
23. Volkert, D, Chourdakis, M, Faxen-Irving, G, Frühwald, T, Landi, F, Suominen, MH, et al. ESPEN guidelines on nutrition in dementia. Clin Nutr. (2015) 34:1052–73. doi: 10.1016/j.clnu.2015.09.004
24. Zhang, Q, Jin, K, Chen, B, Liu, R, Cheng, S, Zhang, Y, et al. Overnutrition induced cognitive impairment: insulin resistance, gut-brain axis, and neuroinflammation. Front Neurosci. (2022) 16:884579. doi: 10.3389/fnins.2022.884579
25. Dramé, M, and Godaert, L. The obesity paradox and mortality in older adults: a systematic review. Nutrients. (2023) 15:1780. doi: 10.3390/nu15071780
26. Bosello, O, and Vanzo, A. Obesity paradox and aging. Eat Weight Disord. (2019) 26:27–35. doi: 10.1007/s40519-019-00815-4
27. Nagao, K. Cognition and nutrition: the role of dietary protein and amino acids in cognitive health. Curr Opin Clin Nutr Metab Care. (2024) 27:40–6. doi: 10.1097/mco.0000000000000987
28. Kamphuis, PJGH, Scheltens, P, and de la Torre, JC. Can nutrients prevent or delay onset of Alzheimer’s disease? J Alzheimers Dis. (2010) 20:765–75. doi: 10.3233/jad-2010-091558
29. Aquilani, R, Scocchi, M, Boschi, F, Viglio, S, Iadarola, P, Pastoris, O, et al. Effect of calorie-protein supplementation on the cognitive recovery of patients with subacute stroke. Nutr Neurosci. (2013) 11:235–40. doi: 10.1179/147683008x301586
30. Mustafa Khalid, N, Haron, H, Shahar, S, and Fenech, M. Current evidence on the association of micronutrient malnutrition with mild cognitive impairment, frailty, and cognitive frailty among older adults: a scoping review. Int J Environ Res Public Health. (2022) 19:15722. doi: 10.3390/ijerph192315722
31. Ciancarelli, I, Morone, G, Iosa, M, Cerasa, A, Calabrò, RS, Iolascon, G, et al. Influence of oxidative stress and inflammation on nutritional status and neural plasticity: new perspectives on post-stroke neurorehabilitative outcome. Nutrients. (2022) 15:108. doi: 10.3390/nu15010108
32. Belkaid, Y, and Hand, TW. Role of the microbiota in immunity and inflammation. Cell. (2014) 157:121–41. doi: 10.1016/j.cell.2014.03.011
Keywords: nutritional index, TCBI, cognitive impairment, CHARLS, cross-sectional study
Citation: Liu G and Zhang J (2025) Association of a novel nutritional index with cognitive impairment in middle-aged and elderly Chinese adults: a cross-sectional analysis from the China Health and Retirement Longitudinal Study. Front. Nutr. 12:1486917. doi: 10.3389/fnut.2025.1486917
Edited by:
Luisa Lampignano, Local Health Authority of Bari, ItalyReviewed by:
Miriam Longo, University of Campania Luigi Vanvitelli, ItalyCopyright © 2025 Liu and Zhang. This is an open-access article distributed under the terms of the Creative Commons Attribution License (CC BY). The use, distribution or reproduction in other forums is permitted, provided the original author(s) and the copyright owner(s) are credited and that the original publication in this journal is cited, in accordance with accepted academic practice. No use, distribution or reproduction is permitted which does not comply with these terms.
*Correspondence: Jianyuan Zhang, emp5MDI4NjA1QHFseXlxZC5jb20=
Disclaimer: All claims expressed in this article are solely those of the authors and do not necessarily represent those of their affiliated organizations, or those of the publisher, the editors and the reviewers. Any product that may be evaluated in this article or claim that may be made by its manufacturer is not guaranteed or endorsed by the publisher.
Research integrity at Frontiers
Learn more about the work of our research integrity team to safeguard the quality of each article we publish.