Abstract
Objective:
This study examines the relationship between several anthropometric indices-Body Roundness Index (BRI), A Body Shape Index (ABSI), Waist-to-Weight Index (WWI), Waist Circumference (WC), and Body Mass Index (BMI)-and the prevalence of Obstructive Sleep Apnea (OSA) using data from the National Health and Nutrition Examination Survey (NHANES) spanning 2015 to 2018.
Methods:
A retrospective cross-sectional analysis of 7,004 adult participants was conducted using NHANES 2015–2018 data. Multivariable-adjusted logistic regression models were employed to assess the association between BRI, ABSI, and OSA. Non-linear relationships were explored via smooth curve fitting and threshold effect analysis using a two-part linear regression model. Subgroup analyses identified sensitive populations, and the discriminatory power of the indices in screening OSA was assessed using Receiver Operating Characteristic (ROC) curves.
Results:
The analysis revealed a significant positive association between BRI and OSA, with a threshold effect observed at a BRI of 4.3. Below this threshold, OSA risk increased with higher BRI; however, no significant association was found above this threshold. Similarly, ABSI demonstrated a threshold effect at 8.2, with OSA risk positively associated to the left and negatively associated to the right. Subgroup analyses indicated stronger associations in younger and non-diabetic populations. ROC analysis identified BRI as a promising predictive tool for OSA, with an AUC of 0.64 (95% CI: 0.62–0.65).
Conclusion:
BRI demonstrates significant potential as a predictive index for OSA incidence, warranting further large-scale prospective studies to validate these findings.
1 Introduction
Obstructive Sleep Apnea (OSA) is a common disorder characterized by repetitive episodes of upper airway obstruction during sleep, leading to intermittent hypoxemia and frequent arousals. A study published in The Lancet estimates that approximately 936 million adults worldwide, aged 30–69, suffer from mild to severe OSA, with 425 million experiencing moderate to severe forms of the condition (1). OSA is closely associated with several serious health complications, including hypertension (2), diabetes (3), stroke (4), and cognitive decline (5). The morbidity and mortality associated with OSA are largely attributable to the increased burden of cardiovascular disease, including arrhythmias (6), underscoring the importance of identifying new and more precise biomarkers for early OSA diagnosis.
Obesity is one of the strongest predictors of OSA, with weight loss often recommended as an initial treatment for patients with mild OSA (7, 8). Excessive fat deposition in the pharyngeal airway and central fat accumulation can contribute to airway narrowing, thereby increasing the likelihood of OSA (9–11). The relationship between obesity and OSA is further complicated by obesity-related hormones and cytokines, such as leptin, which may exacerbate respiratory instability during sleep (12). Notably, visceral fat, rather than total body fat, plays a pivotal role in the development of OSA, emphasizing the need for accurate assessment of fat distribution in evaluating OSA risk (13, 14).
Traditional obesity indices, such as Waist Circumference (WC) and Body Mass Index (BMI), have limitations in accurately predicting fat distribution, particularly visceral fat. To address these gaps, new indices such as the Body Roundness Index (BRI) and A Body Shape Index (ABSI) have been developed. The BRI, developed by Thomas et al. in 2013, integrates height and waist circumference to provide a more nuanced assessment of body fat distribution. Research has demonstrated that BRI more accurately reflects visceral fat and overall body fat percentage compared to conventional measurements like WC and BMI. Furthermore, recent studies have identified BRI as a predictor of various health conditions, including cardiovascular diseases, gallstones (15), hypertension (16), bone mineral density (17), and all-cause mortality (18). Conversely, the ABSI, proposed by Krakauer et al., has proven effective in predicting mortality independently of BMI in the U.S. population (19). It has also been significantly associated with various metabolic syndromes across multiple studies (20, 21). While both indices incorporate elements of WC and height, their applications differ. The BRI is primarily used to evaluate an individual’s overall physical fitness, whereas ABSI is more focused on identifying health risks associated with abdominal obesity. Despite their unique roles in assessing body composition, the relationship between BRI and ABSI and the prevalence of OSA remains largely unexplored.
This study aims to address this gap by investigating the association between BRI, along with other novel Anthropometric Indices (AHIs) like A Body Shape Index (ABSI), and the prevalence of OSA using data from the 2015–2018 National Health and Nutrition Examination Survey (NHANES). The hypothesis is that BRI is a strong predictor of OSA, and that managing AHIs could play a critical role in preventing and treating OSA. By leveraging the extensive and representative data from NHANES, this study seeks to provide valuable insights into the potential clinical utility of AHIs in the context of OSA.
2 Methods
2.1 Study design and population
This cross-sectional study sought to examine the relationship between the BRI and other novel anthropometric indices with OSA using data from the NHANES from 2015 to 2018. NHANES, managed by the National Center for Health Statistics (NCHS), employs a complex, stratified, multistage probability sampling design to generate a nationally representative sample of the U.S. population. Each survey cycle includes demographic data, physical measurements, laboratory tests, and dietary information. Detailed methodologies and documentation can be accessed at NHANES website. This study focused on participants aged 20 and older, excluding those with incomplete data on OSA, height, waist circumference, or other key variables. This study ultimately included 7,004 participants. The specific inclusion and exclusion criteria are detailed in Figure 1.
Figure 1
2.2 Calculation of anthropometric indices
The Body Roundness Index (BRI) was calculated using the following formula:
A Body Shape Index (ABSI) was calculated based on WC, height, and weight using the formula:
The Waist-to-Weight Index (WWI) was calculated by dividing WC (in centimeters) by the square root of body weight (in kilograms).
2.3 Diagnosis of probable OSA
Probable OSA (pOSA) was identified based on participants’ responses to three dichotomous questions in the NHANES survey. Participants were classified as having pOSA if they answered “Yes” to at least one of the following questions (22, 23):
“Despite sleeping approximately 7 h or more per night, do you feel excessively sleepy during the day 16–30 times a month on weekdays or workdays?”
“Do you experience gasping for breath, snoring, or stopping breathing 3 or more nights per week?”
“Do you snore 3 or more nights per week?”
2.4 Covariates
To adjust for potential confounding factors, several covariates were included in the multivariable-adjusted models. These covariates included demographic variables (age, gender, race/ethnicity, marital status, education level, and poverty income ratio), lifestyle factors (smoking status and alcohol consumption), and health conditions (hypertension, diabetes, and history of cardiovascular disease) (Supplementary Table 1). Detailed measurement methods for these variables are available on the CDC’s NHANES website: www.cdc.gov/nchs/nhanes/.
2.5 Statistical analysis
Weighted statistical analyses were performed for each participant according to the sample weighting associated with NHANES’s intricate multistage cluster sampling design. Group differences were assessed using chi-square test for categorical variables and analysis of variance (ANOVA) for continuous variables. To assess the relationship between BRI and pOSA, multivariable logistic regression models were utilized. Three models were applied: Model I with no covariates adjusted, Model II adjusted for age, gender, and race/ethnicity, and Model III further adjusted for marital status, education level, Poverty Income Ratio (PIR), smoking status, alcohol use, hypertension, cardiovascular disease, and history of diabetes. Subgroup analyses were conducted by stratifying the population based on gender, age, and other key variables.
Smoothing curve fitting was employed to detect nonlinear relationships between pOSA and the indices. A two-segment linear regression model was then employed to investigate threshold effects. The predictive power of BRI, ABSI, and other indices for pOSA was assessed using the corresponding Area Under Curve (AUC) and Receiver Operating Characteristic (ROC) curves. Statistical analyses were performed using R software (version 4.0.5) and EmpowerStats (version 2.0). Sample interview weights were applied to adjust for the survey design, and a p-value of <0.05 was considered statistically significant.
3 Results
3.1 Baseline characteristics of participants
The study included 7,004 participants with a mean age of 48.27 ± 17.30 years (Figure 1). Of these participants, 49.30% were male and 50.70% were female. The mean value of BRI index was 2.16 ± 1.20. The overall prevalence of pOSA in the cohort was 49.39%. BRI quartiles were categorized as follows: ≤1.32 (Quartile 1), 1.33–1.98 (Quartile 2), 1.99–2.80 (Quartile 3), and > 2.80 (Quartile 4). Participants in Quartile 4 of the BRI tended to be older, had a higher proportion of females, lower PIR, lower educational attainment, and exhibited higher rates of smoking, alcohol consumption, hypertension, diabetes, cardiovascular disease, and pOSA compared to those in Quartile 1. Table 1 provides a detailed overview of the weighted demographic baseline characteristics of the study participants.
Table 1
| Variables | Quartiles of BRI | p-Value | |||
|---|---|---|---|---|---|
| Q1 | Q2 | Q3 | Q4 | ||
| Age (year) | 39.06 ± 0.67 | 48.22 ± 0.62 | 50.62 ± 0.59 | 50.06 ± 0.74 | <0.0001 |
| BMI (kg/m2) | 22.59 ± 0.11 | 27.04 ± 0.12 | 30.99 ± 0.12 | 38.54 ± 0.22 | <0.0001 |
| PIR | 3.18 ± 0.08 | 3.29 ± 0.07 | 3.12 ± 0.09 | 2.93 ± 0.09 | 0.0088 |
| Gender (%) | <0.0001 | ||||
| Male | 49.22 | 55.73 | 54.08 | 36.15 | |
| Female | 50.78 | 44.27 | 45.92 | 63.85 | |
| Race (%) | <0.0001 | ||||
| Mexican American | 5.56 | 8.25 | 11.84 | 11.12 | |
| Other Hispanic | 4.82 | 7.17 | 7.34 | 5.83 | |
| Non-Hispanic White | 66.11 | 65.86 | 63.53 | 65.58 | |
| Non-Hispanic Black | 12.45 | 8.07 | 9.27 | 12.19 | |
| Other races | 11.06 | 10.66 | 8.01 | 5.28 | |
| Educational level (%) | <0.0001 | ||||
| Under high school | 7.68 | 12.00 | 12.15 | 12.09 | |
| High school or equivalent | 19.01 | 21.14 | 26.41 | 25.97 | |
| Above high school | 73.31 | 66.86 | 61.43 | 61.94 | |
| Marital status (%) | <0.0001 | ||||
| Married | 59.17 | 68.04 | 67.17 | 61.26 | |
| Single | 10.76 | 17.90 | 18.64 | 21.79 | |
| With partner | 30.07 | 14.06 | 14.19 | 16.95 | |
| Smoking status(%) | <0.0001 | ||||
| Never smoker | 61.71 | 57.62 | 53.90 | 54.89 | |
| Former smoker | 18.44 | 22.65 | 28.95 | 29.27 | |
| Current smoker | 19.85 | 19.72 | 17.15 | 15.85 | |
| Alcohol (%) | 0.0105 | ||||
| Never | 71.56 | 71.55 | 70.26 | 66.22 | |
| Drinks | 28.44 | 28.45 | 29.74 | 33.78 | |
| Diabetes (%) | <0.0001 | ||||
| No | 97.11 | 91.77 | 82.88 | 73.59 | |
| Yes | 2.89 | 8.23 | 17.12 | 26.41 | |
| Hypertension (%) | <0.0001 | ||||
| No | 79.07 | 66.22 | 63.06 | 54.15 | |
| Yes | 20.93 | 33.78 | 36.94 | 45.85 | |
| CVD (%) | <0.0001 | ||||
| No | 97.97 | 94.93 | 93.16 | 89.98 | |
| Yes | 2.03 | 5.07 | 6.84 | 10.02 | |
| pOSA (%) | <0.0001 | ||||
| No | 71.20 | 52.01 | 46.51 | 38.89 | |
| Yes | 28.80 | 47.99 | 53.49 | 61.11 | |
Baseline characteristics of participants in the NHANES 2015–2018.
NHANES, National Health and Nutrition Examination Survey; BMI, Body Mass Index; PIR, Poverty Income Ratio; CVD, Cardiovascular Disease; pOSA, Probable Obstructive Sleep Apnea.
3.2 Association between AHIs and pOSA prevalence
BRI and WWI exhibited a more robust association with pOSA than other anthropometric measures, including ABSI, WC, and BMI. In the fully adjusted model, a positive association was observed between BRI and pOSA (OR 1.50; 95% CI: 1.42, 1.58; p < 0.0001), indicating that each unit increase in BRI corresponded to a 50% higher prevalence of pOSA in the subjects. Similarly, WWI was also positively correlated with pOSA (OR 1.51; 95% CI: 1.40, 1.63; p < 0.0001). The correlation between BRI and pOSA remained robust even when BRI was categorized into quartiles. Participants in Quartile 4 were 267% more likely to develop pOSA compared to those in Quartile 1. Notably, ABSI did not demonstrate a significant association with pOSA in the fully adjusted model (Table 2).
Table 2
| OR (95% CI), p-value | |||
|---|---|---|---|
| Model I | Model II | Model III | |
| pOSA | |||
| BRI | 1.49 (1.43, 1.56) <0.0001 | 1.51 (1.44, 1.58) <0.0001 | 1.50 (1.42, 1.58) <0.0001 |
| ABSI | 1.38 (1.25, 1.52) <0.0001 | 1.12 (1.00, 1.26) 0.0523 | 1.07 (0.94, 1.21) 0.3184 |
| WC | 1.07 (1.06, 1.08) <0.0001 | 1.08 (1.07, 1.08) <0.0001 | 1.07 (1.06, 1.08) <0.0001 |
| BMI | 1.03 (1.03, 1.04) <0.0001 | 1.03 (1.03, 1.03) <0.0001 | 1.03 (1.03, 1.03) <0.0001 |
| WWI | 1.46 (1.38, 1.54) <0.0001 | 1.53 (1.43, 1.64) <0.0001 | 1.51 (1.40, 1.63) <0.0001 |
| Categories | |||
| Quartile1 | Ref | Ref | Ref |
| Quartile2 | 2.07 (1.81, 2.38) <0.0001 | 1.93 (1.67, 2.22) <0.0001 | 1.82 (1.57, 2.12) <0.0001 |
| Quartile3 | 2.58 (2.25, 2.96) <0.0001 | 2.40 (2.07, 2.78) <0.0001 | 2.32 (1.98, 2.71) <0.0001 |
| Quartile4 | 3.72 (3.23, 4.27) <0.0001 | 3.85 (3.31, 4.47) <0.0001 | 3.67 (3.12, 4.32) <0.0001 |
Multivariable logistic regression models for the association between anthropometric indices and pOSA.
OR, Odds Ratio; CI, Confidence Interval; pOSA, Probable Obstructive Sleep Apnea; BRI, Body Roundness Index; ABSI, A Body Shape Index; WC, Waist Circumference; BMI, Body Mass Index; WWI, Waist-to-Weight index.
3.3 Curve fitting and threshold effect analysis
The smoothed curve fitting results from Model 3 revealed a saturation effect in the relationship between BRI and pOSA prevalence. Specifically, the analysis indicated an inverted U-shaped curve between ABSI and pOSA, with a distinct inflection point (Figure 2). The smoothed curve fitting for the remaining indicators was similar to that of BRI index with pOSA (Supplementary Figures 1–3).
Figure 2
Threshold effect analysis identified an inflection point of 4.3 for BRI. Below this threshold, a significant association with pOSA prevalence was observed (OR 1.59; 95% CI: 1.50, 1.69; p < 0.0001). However, beyond this point, the association was not statistically significant (OR 1.02; 95% CI: 0.85, 1.24; p = 0.8076), with a log-likelihood ratio test yielding a p-value of <0.001 (Table 3). For ABSI, an inflection point of 8.2 was identified. The association with pOSA prevalence was positive below this inflection point (OR 1.40; 95% CI: 1.14, 1.73; p = 0.0013) and negative above it (OR 0.78; 95% CI: 0.62, 0.97; p = 0.0279), with a log-likelihood ratio test p-value of <0.001 (Table 4).
Table 3
| OR (95% CI), p-value | |
|---|---|
| Fitting by the standard linear model | 1.50 (1.42, 1.58) <0.0001 |
| Fitting by the two-piecewise linear model | |
| Inflection point | 4.3 |
| BRI < 4.3 | 1.59 (1.50, 1.69) <0.0001 |
| BRI > 4.3 | 1.02 (0.85, 1.24) 0.8076 |
| p for log-likelihood ratio | <0.001 |
The threshold effect analysis of the BRI on pOSA risk.
OR, Odds Ratio; CI, Confidence Interval; pOSA, Probable Obstructive Sleep Apnea; BRI, Body Roundness Index.
Table 4
| OR (95% CI), p-value | |
|---|---|
| Fitting by the standard linear model | 1.07 (0.94, 1.21) 0.3184 |
| Fitting by the two-piecewise linear model | |
| Inflection point | 8.2 |
| ABSI<8.2 | 1.40 (1.14, 1.73) 0.0013 |
| ABSI>8.2 | 0.78 (0.62, 0.97) 0.0279 |
| p for log-likelihood ratio | <0.001 |
The threshold effect analysis of the ABSI on pOSA risk.
OR, Odds Ratio; CI, Confidence Interval; pOSA, Probable Obstructive Sleep Apnea; ABSI, A Body Shape Index.
3.4 Subgroup analysis
Multiple subgroup analyses and interaction tests were performed to evaluate the stability of the BRI-pOSA relationship and to detect any subgroup variations (Table 5). The findings from these analyses revealed a consistent relationship between BRI and pOSA across most subgroups. Notably, age modified the relationship between BRI and pOSA prevalence (p for interaction <0.0001), highlighting the importance of monitoring BRI even in individuals under 60 years of age. Additionally, the relationship between BRI and pOSA varied within the diabetic population (p for interaction = 0.0057). While a significant correlation was observed in the diabetic group (OR 1.28; 95% CI: 1.14, 1.42; p < 0.0001), the relationship was even stronger in those without diabetes (OR 1.55; 95% CI: 1.47, 1.65; p < 0.0001).
Table 5
| Subgroup analysis | Foerst plot | pOSA, OR (95%CI), p-value | p for interaction |
|---|---|---|---|
| Age (year) | 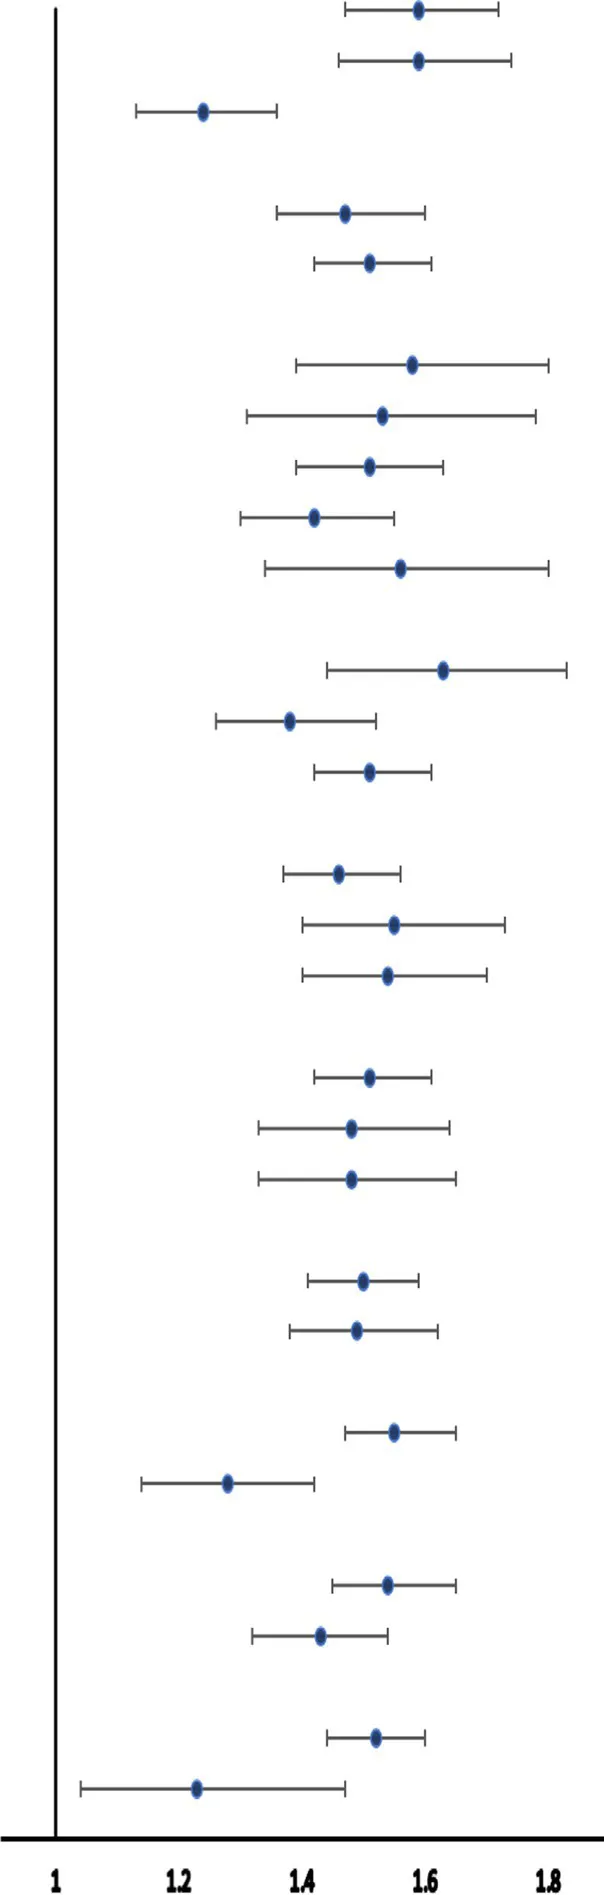 | <0.0001 | |
| <=40 | 1.59 (1.47, 1.72) <0.0001 | ||
| >40, <=60 | 1.59 (1.46, 1.74) <0.0001 | ||
| >60 | 1.24 (1.13, 1.36) <0.0001 | ||
| Gender (%) | 0.5998 | ||
| Male | 1.47 (1.36, 1.60) <0.0001 | ||
| Female | 1.51 (1.42, 1.61) <0.0001 | ||
| Race (%) | 0.6252 | ||
| Mexican American | 1.58 (1.39, 1.80) <0.0001 | ||
| Other Hispanic | 1.53 (1.31, 1.78) <0.0001 | ||
| Non-Hispanic White | 1.51 (1.39, 1.63) <0.0001 | ||
| Non-Hispanic Black | 1.42 (1.30, 1.55) <0.0001 | ||
| Other races | 1.56 (1.34, 1.80) <0.0001 | ||
| Educational level (%) | 0.0883 | ||
| Under high school | 1.63 (1.44, 1.83) <0.0001 | ||
| High school or equivalent | 1.38 (1.26, 1.52) <0.0001 | ||
| Above high school | 1.51 (1.42, 1.61) <0.0001 | ||
| Marital status (%) | 0.4957 | ||
| Married | 1.46 (1.37, 1.56) <0.0001 | ||
| Single | 1.55 (1.40, 1.73) <0.0001 | ||
| With partner | 1.54 (1.40, 1.70) <0.0001 | ||
| Smoking status (%) | 0.9048 | ||
| Never smoker | 1.51 (1.42, 1.61) <0.0001 | ||
| Former smoker | 1.48 (1.33, 1.64) <0.0001 | ||
| Current smoker | 1.48 (1.33, 1.65) <0.0001 | ||
| Alcohol (%) | 0.9258 | ||
| Drinks | 1.50 (1.41, 1.59) <0.0001 | ||
| Never | 1.49 (1.38, 1.62) <0.0001 | ||
| Diabetes (%) | 0.0057 | ||
| No | 1.55 (1.47, 1.65) <0.0001 | ||
| Yes | 1.28 (1.14, 1.42) <0.0001 | ||
| Hypertension (%) | 0.1025 | ||
| No | 1.54 (1.45, 1.65) <0.0001 | ||
| Yes | 1.43 (1.32, 1.54) <0.0001 | ||
| CVD (%) | 0.0017 | ||
| No | 1.52 (1.44, 1.60) <0.0001 | ||
| Yes | 1.23 (1.04, 1.47) 0.0174 |
Stratified analysis of the correlation between BRI and pOSA.
OR, Odds Ratio; CI, Confidence Interval; pOSA, Probable Obstructive Sleep Apnea; BRI, Body Roundness Index; CVD, Cardiovascular Disease.
3.5 ROC curve analysis
Compared to WWI and ABSI, BRI demonstrates slightly higher specificity, though it falls short of WC and BMI (Figure 3). However, considering the overall findings, BRI emerges as a highly promising indicator, showing a strong association with the occurrence of pOSA and consequently holding significant predictive value for OSA. Specific results from ROC analysis, including AUC, cutoff values, sensitivity, and specificity, are available in Supplementary Table 2.
Figure 3
4 Discussion
This study aimed to evaluate the association between several anthropometric indices-BRI, ABSI, WWI, WC, BMI and the prevalence of pOSA in a large, diverse population. Our findings indicate that BRI is significantly associated with pOSA, with this association remaining robust even after extensive adjustment for potential confounders. The identified threshold effect at a BRI of 4.3 suggests that individuals with higher BRI values are at substantially increased risk for pOSA, underscoring the importance of implementing targeted interventions for these high-risk populations. Interestingly, the ABSI inflection point of 8.2 reveals a positive association with pOSA prevalence on the left side of the inflection point; however, on the right side, a negative association emerges. This observation may explain the nonsignificant association between ABSI and pOSA occurrence in the fully adjusted model. Notably, BRI demonstrated superior predictive performance for pOSA risk compared to other indices such as ABSI and WWI, indicating that BRI could be a more effective tool for identifying individuals at risk for this condition.
Obesity is a recognized risk factor for OSA, with a notable correlation between the extent of obesity and the severity of the condition. Traditional anthropometric measures, such as BMI, WC, and WWI, are frequently utilized in clinical and research contexts to assess this relationship. Among these measures, BMI is the most commonly used due to its simplicity, but its effectiveness is often debated because it does not account for fat distribution (24). While WC partially mitigates this issue by addressing waist size, it fails to consider an individual’s height and weight, leading to inaccurate assessments of obesity prevalence, especially in individuals of varying heights. The WWI, calculated by dividing WC by body weight, has been found to have a positive correlation with fat mass, particularly in geriatric populations. Given these limitations, it is essential to identify the most accurate obesity indices for effective diagnosis and management of OSA.
Traditional obesity measures have been extensively studied in OSA. A prospective study involving 247 children found that BMI and WC were elevated in those with OSA, with strong correlations between these indices, inflammatory markers, and leptin (25). However, longitudinal studies indicate that while general obesity indices do not significantly correlate with OSA improvement, changes in visceral fat indices do (26). These findings may indirectly support our study’s conclusions. Nonetheless, the literature presents conflicting evidence. A meta-analysis encompassing 19 studies found no significant relationship between OSA and BMI, WC, or waist-hip ratio (27). Additionally, studies on adolescents and children revealed no connection between OSA and abdominal obesity, although central sleep apnea was related to increased abdominal fat levels (28). These inconsistencies may be attributed to variations in study populations, ethnicities, and OSA evaluation criteria.
Visceral obesity is a well- recognized risk factor for cardiovascular events and all-cause mortality. Given the challenges of directly measuring visceral fat, new AHIs like ABSI and BRI have been developed through algorithmic modeling. ABSI is more effective than both BMI and waist circumference in predicting all-cause mortality, but it is less reliable for forecasting chronic diseases (28, 29). BRI, which represents the body as an ellipse with height as the major axis and waist circumference as the minor axis, provides insights into fat distribution in obese individuals. The eccentricity of this ellipse defines the BRI, making it a more effective index for estimating abdominal obesity. The robust association between BRI and pOSA identified in this study highlights its potential as a valuable screening tool for pOSA.
Our findings align with previous research demonstrating the link between obesity-related metrics and pOSA. However, the present study adds to the literature by highlighting the superiority of BRI over other commonly used indices. While BMI has traditionally been the most widely used measure for assessing obesity-related health risks, our results suggest that BRI, which incorporates both body shape and fat distribution, may provide a more accurate reflection of pOSA risk. The comparative analysis highlighting that BRI has a higher predictive ability for pOSA than ABSI and WWI is particularly noteworthy. This suggests that BRI’s incorporation of both waist and height measurements offers a more detailed evaluation of body fat distribution, which is crucial in the development of pOSA. Research has demonstrated that BRI is superior to ABSI in predicting metabolic syndrome (30), hypertension and hyperuricemia (31). Moreover, the association between obesity and OSA is largely attributed to the accumulation of abdominal fat. This visceral fat exerts a greater influence on the upper airway than peripheral fat. These factors together elucidate why BRI is more effective than other indices in predicting pOSA.
The results of this study carry important clinical implications. Given the increasing prevalence of OSA and its associated health risks, there is a pressing need for effective screening tools. BRI, with its strong predictive ability and ease of calculation, could be integrated into routine clinical practice to pinpoint individuals at elevated risk for pOSA. Early identification and intervention are essential to mitigate the complications associated with pOSA, such as cardiovascular disease, metabolic disorders, and diminished quality of life.
The study’s strengths include its large and diverse sample size, as well as the use of a comprehensive set of covariates, which bolster the generalizability of our findings. Additionally, the application of advanced statistical methods allowed for a detailed exploration of the relationship between BRI and OSA, including the identification of non-linear associations. However, several limitations should be noted. First, the cross-sectional design limits the ability to draw causal inferences. Second, OSA diagnosis relied on self-reported data, which may be subject to reporting bias. Finally, while BRI appears to be a promising tool for predicting OSA, further research is required to validate these findings in different populations and to explore the potential of BRI in guiding clinical decision-making.
In conclusion, this study shows that BRI has a significant association with OSA prevalence and may provide advantages over other anthropometric measures in predicting OSA risk. Integrating BRI into clinical practice could improve early detection of OSA, especially in high-risk populations. Future research should aim to validate these results in longitudinal studies and investigate the potential of BRI as a foundation for targeted interventions to reduce the impact of OSA.
Statements
Data availability statement
Publicly available datasets were analyzed in this study. This data can be found at: https://www.cdc.gov/nchs/nhanes/.
Ethics statement
The studies involving humans were approved by NCHS Research Ethics Review Committee. The studies were conducted in accordance with the local legislation and institutional requirements. The participants provided their written informed consent to participate in this study.
Author contributions
XP: Conceptualization, Funding acquisition, Methodology, Project administration, Resources, Software, Supervision, Validation, Visualization, Writing – original draft, Writing – review & editing. FL: Conceptualization, Data curation, Formal analysis, Visualization, Writing – original draft, Writing – review & editing, Resources, Software, Supervision. JF: Data curation, Formal analysis, Writing – original draft. QG: Formal analysis, Writing – original draft. MG: Formal analysis, Funding acquisition, Methodology, Software, Writing – review & editing. YC: Project administration, Resources, Software, Supervision, Writing – review & editing. JS: Project administration, Resources, Software, Writing – review & editing. XC: Conceptualization, Project administration, Software, Supervision, Validation, Visualization, Writing – original draft, Writing – review & editing.
Funding
The author(s) declare that financial support was received for the research, authorship, and/or publication of this article. This work was funded by National Natural Science Foundation of China (No. 82471287).
Acknowledgments
Appreciation is extended to the person who generously provided the original dataset for this research.
Conflict of interest
The authors declare that the research was conducted in the absence of any commercial or financial relationships that could be construed as a potential conflict of interest.
Publisher’s note
All claims expressed in this article are solely those of the authors and do not necessarily represent those of their affiliated organizations, or those of the publisher, the editors and the reviewers. Any product that may be evaluated in this article, or claim that may be made by its manufacturer, is not guaranteed or endorsed by the publisher.
Supplementary material
The Supplementary material for this article can be found online at: https://www.frontiersin.org/articles/10.3389/fnut.2024.1492673/full#supplementary-material
Abbreviations
BRI, Body Roundness Index; ABSI, A Body Shape Index; WC, Waist Circumference; BMI, Body Mass Index; WWI, Waist-to-Weight Index; NHANES, National Health and Nutrition Examination Survey; CVD, Cardiovascular Disease; PIR, Poverty Income Ratio; OR, Odds Ratio; pOSA, Probable Obstructive Sleep Apnea; CI, Confidence Interval; ROC, Receiver Operating Characteristic; AUC, Area Under Curve.
References
1.
BenjafieldAVAyasNTEastwoodPRHeinzerRIpMSMMorrellMJet al. Estimation of the global prevalence and burden of obstructive sleep apnoea: a literature-based analysis. Lancet Respir Med. (2019) 7:687–98. doi: 10.1016/S2213-2600(19)30198-5
2.
O'ConnorGTCaffoBNewmanABQuanSFRapoportDMRedlineSet al. Prospective study of sleep-disordered breathing and hypertension the sleep heart health study. Am J Respir Crit Care Med. (2009) 179:1159–64. doi: 10.1164/rccm.200712-1809OC
3.
AbelleiraRZamarrónCRiveiroVCasalAToubesMERábadeCet al. Relationship between obstructive sleep apnea and type 2 diabetes mellitus. Med Clin (Barc). (2024) 162:363–9. doi: 10.1016/j.medcli.2023.11.014
4.
Pérez-CarbonellL. Bashir S narrative review of sleep and stroke. J Thorac Dis. (2020) 12:S176–90. doi: 10.21037/jtd-cus-2020-002
5.
LiMFSunZRSunHRZhaoGCLengBShenTQet al. Paroxysmal slow wave events are associated with cognitive impairment in patients with obstructive sleep apnea. Alzheimers Res Ther. (2022) 14:14. doi: 10.1186/s13195-022-01153-x
6.
MehraRBenjaminEJShaharEGottliebDJNawabitRKirchnerHLet al. Association of nocturnal arrhythmias with sleep-disordered breathing - the sleep heart health study. Am J Respir Crit Care Med. (2006) 173:910–6. doi: 10.1164/rccm.200509-1442OC
7.
López-PadrósCSalordNAlvesCVilarrasaNGasaMPlanasRet al. Effectiveness of an intensive weight-loss program for severe OSA in patients undergoing CPAP treatment: a randomized controlled trial. J Clin Sleep Med. (2020) 16:503–14. doi: 10.5664/jcsm.8252
8.
TuomilehtoHPISeppaJMPartinenMMPeltonenMGyllingHTuomilehtoJOIet al. Lifestyle intervention with weight reduction first-line treatment in mild obstructive sleep apnea. Am J Respir Crit Care Med. (2009) 179:320–7. doi: 10.1164/rccm.200805-669OC
9.
WenX-LWuB-ZLiYYiBPengX. Analysis of the aerodynamic characteristics of the upper airway in obstructive sleep apnea patients. J. Dent. Sci. (2024) 19:329–37. doi: 10.1016/j.jds.2023.03.013
10.
FengYKeenanBTWangSLeinwandSWiemkenAPackAIet al. Dynamic upper airway imaging during wakefulness in obese subjects with and without sleep apnea. Am J Respir Crit Care Med. (2018) 198:1435–43. doi: 10.1164/rccm.201711-2171OC
11.
HeinzerRCStanchinaMLMalhotraAFogelRBPatelSRJordanASet al. Lung volume and continuous positive airway pressure requirements in obstructive sleep apnea. Am J Respir Crit Care Med. (2005) 172:114–7. doi: 10.1164/rccm.200404-552OC
12.
DragerLFTogeiroSMPolotskyVYLorenziG. Obstructive sleep apnea a Cardiometabolic risk in obesity and the metabolic syndrome. J Am Coll Cardiol. (2013) 62:569–76. doi: 10.1016/j.jacc.2013.05.045
13.
MolnarVLaknerZMolnarATarnokiDLTarnokiADKunosLet al. The predictive role of subcutaneous adipose tissue in the pathogenesis of obstructive sleep Apnoea. Life-Basel. (2022) 12:12. doi: 10.3390/life12101504
14.
VgontzasANPapanicolaouDABixlerEOHopperKLotsikasALinHMet al. Sleep apnea and daytime sleepiness and fatigue: relation to visceral obesity, insulin resistance, and hypercytokinemia. J Clin Endocrinol Metab. (2000) 85:1151–8. doi: 10.1210/jcem.85.3.6484
15.
ZhangJLiangDXuLLiuYJiangSHanXet al. Associations between novel anthropometric indices and the prevalence of gallstones among 6,848 adults: a cross-sectional study. Front Nutr. (2024) 11:11. doi: 10.3389/fnut.2024.1428488
16.
WuLDKongCHShiYZhangJXChenSL. Associations between novel anthropometric measures and the prevalence of hypertension among 45,853 adults: a cross-sectional study. Front Cardiovasc. Med. (2022) 9:9. doi: 10.3389/fcvm.2022.1050654
17.
DingZZhuangZTangRQuXHuangZSunMet al. Negative association between body roundness index and bone mineral density: insights from NHANES. Front Nutr. (2024) 11:11. doi: 10.3389/fnut.2024.1448938
18.
ZhangXQMaNLinQSChenKNZhengFJYWuJet al. Body roundness index and all-cause mortality among US adults. JAMA Netw Open. (2024) 7:7. doi: 10.1001/jamanetworkopen.2024.15051
19.
KrakauerNYKrakauerJC. A new body shape index predicts mortality Hazard independently of body mass index. PLoS One. (2012) 7:e39504. doi: 10.1371/journal.pone.0039504
20.
ZhangXYeRSunLLiuXWangSMengQet al. Relationship between novel anthropometric indices and the incidence of hypertension in Chinese individuals: a prospective cohort study based on the CHNS from 1993 to 2015. BMC Public Health. (2023) 23:23. doi: 10.1186/s12889-023-15208-7
21.
ChoH-WChungWMoonSRyuO-HKimMKKangJG. Effect of sarcopenia and body shape on cardiovascular disease according to obesity phenotypes. Diabetes Metab J. (2021) 45:209–18. doi: 10.4093/dmj.2019.0223
22.
PanXZhangXWuXZhaoYLiYChenZet al. Association between non-high-density lipoprotein cholesterol to high-density lipoprotein cholesterol ratio and obstructive sleep apnea: a cross-sectional study from NHANES. Lipids Health Dis. (2024) 23:209. doi: 10.1186/s12944-024-02195-w
23.
StrenthCWaniAAllaRKhanSSchneiderFDThakurB. Obstructive sleep apnea and its cardiac implications in the United States: an age-stratified analysis between young and older adults. J Am Heart Assoc. (2024) 13:e033810. doi: 10.1161/JAHA.123.033810
24.
BrayGABeyondBMI. Beyond BMI. Nutrients. (2023) 15:2254. doi: 10.3390/nu15102254
25.
BhattSPGuleriaRKabraSK. Metabolic alterations and systemic inflammation in overweight/obese children with obstructive sleep apnea. PLoS One. (2021) 16:e0252353. doi: 10.1371/journal.pone.0252353
26.
ZhaoXLXuHJQianYJLiuYPZouJJYiHLet al. Abdominal obesity is more strongly correlated with obstructive sleep apnea than general obesity in China: results from two separated observational and longitudinal studies. Obes Surg. (2019) 29:2535–47. doi: 10.1007/s11695-019-03870-z
27.
ChoJHChoiJHSuhJDRyuSChoSH. Comparison of anthropometric data between Asian and Caucasian patients with obstructive sleep apnea: a Meta-analysis. Clin Exp Otorhinolaryngol. (2016) 9:1–7. doi: 10.21053/ceo.2016.9.1.1
28.
VerhulstSLSchrauwenNHaentjensDSuysBRoomanRPVan GaalLet al. Sleep-disordered breathing in overweight and obese children and adolescents: prevalence, characteristics and the role of fat distribution. Arch Dis Child. (2007) 92:205–8. doi: 10.1136/adc.2006.101089
29.
JiMZhangS. An R effectiveness of a body shape index (ABSI) in predicting chronic diseases and mortality: a systematic review and meta-analysis. Obes Rev. (2018) 19:737–59. doi: 10.1111/obr.12666
30.
AntoEOFrimpongJBoaduWIOTamakloeVHughesCAcquahBet al. Prevalence of Cardiometabolic syndrome and its association with body shape index and a body roundness index among type 2 diabetes mellitus patients: a hospital-based cross-sectional study in a Ghanaian population. Front Clin Diabetes Healthc. (2021) 2:807201. doi: 10.3389/fcdhc.2021.807201
31.
LiYZengL. Comparison of seven anthropometric indexes to predict hypertension plus hyperuricemia among U.S. adults. Front Endocrinol. (2024) 15:1301543. doi: 10.3389/fendo.2024.1301543
Summary
Keywords
Body Roundness Index, A Body Shape Index, anthropometric indices, National Health and Nutrition Examination Survey, obesity, Obstructive Sleep Apnea
Citation
Pan X, Liu F, Fan J, Guo Q, Guo M, Chen Y, Sun J and Cao X (2024) Association of Body Roundness Index and A Body Shape Index with Obstructive Sleep Apnea: insights from NHANES 2015–2018 data. Front. Nutr. 11:1492673. doi: 10.3389/fnut.2024.1492673
Received
07 September 2024
Accepted
04 November 2024
Published
18 November 2024
Volume
11 - 2024
Edited by
Amar Hassan Khamis, Mohammed Bin Rashid University of Medicine and Health Sciences, United Arab Emirates
Reviewed by
Mahmoud M. Abulmeaty, King Saud University, Saudi Arabia
Zhenyu Gong, Technical University of Munich, Germany
Updates
Copyright
© 2024 Pan, Liu, Fan, Guo, Guo, Chen, Sun and Cao.
This is an open-access article distributed under the terms of the Creative Commons Attribution License (CC BY). The use, distribution or reproduction in other forums is permitted, provided the original author(s) and the copyright owner(s) are credited and that the original publication in this journal is cited, in accordance with accepted academic practice. No use, distribution or reproduction is permitted which does not comply with these terms.
*Correspondence: Xuezhao Cao, xzcao@cmu.edu.cn
†These authors share first authorship
Disclaimer
All claims expressed in this article are solely those of the authors and do not necessarily represent those of their affiliated organizations, or those of the publisher, the editors and the reviewers. Any product that may be evaluated in this article or claim that may be made by its manufacturer is not guaranteed or endorsed by the publisher.