- 1Student Research Committee, Shahid Sadoughi University of Medical Sciences, Yazd, Iran
- 2Research Center for Food Hygiene and Safety, School of Public Health, Shahid Sadoughi University of Medical Sciences, Yazd, Iran
- 3Department of Nutrition, School of Public Health, Shahid Sadoughi University of Medical Sciences, Yazd, Iran
- 4Yazd Cardiovascular Research Center, Non-communicable Diseases Research Institute, Shahid Sadoughi University of Medical Sciences, Yazd, Iran
Objectives: The effect of non-nutritive sweeteners (NNSs) on long-term satiety is not well understood. This systematic review and meta-analysis were performed to investigate the effect of NNSs on long-term total energy and macronutrients intake.
Methods: Online databases including Scopus, PubMed, ISI Web of Science, and Google Scholar were searched up to September 2024 to find relevant randomized control trials (RCTs). A random effects model was used for estimating the overall effects.
Results: The results showed a reducing effect of NNSs consumption vs. sugar on total energy intake [total energy intake change = −175.26 kcal/day, 95% confidence interval (CI): −296.47 to −54.06, I2 = 61.19%] and carbohydrate intake [Hedges’ g = −0.35, 95% CI: −0.63 to −0.06, I2 = 58.99%]. While, NNSs intake vs. water was not associated with significant change in total energy intake [total energy intake change = 29.94 kcal/day, 95% CI: −70.37 to 130.24, I2 = 34.98%] and carbohydrate intake [Hedges’ g = 0.28, 95% CI: −0.02 to 0.58, I2 = 65.26%]. The Consumption of NNSs compared to the either sugar or water did not have a significant effect on fat intake [Hedges’ g sugar = 0.08, 95% CI: −0.10 to 0.26, I2 = 8.73%/ fat intake change water = 0.20 g/day, 95% CI: −3.48 to 3.88, I2 = 0%] and Protein intake [Hedges’ g sugar = 0.16, 95% CI: −0.11 to 0.42, I2 = 50.83%/Hedges’ g water = 0.00, 95% CI: −0.15 to 0.16, I2 = 0%].
Conclusion: In summary, our findings suggest that NNSs consumption may be effective in reducing total energy and carbohydrate intake compared to sugar.
Systematic Review Registration: https://www.crd.york.ac.uk/prospero/display_record.php?RecordID=432816, CRD42023432816.
1 Introduction
Obesity is a prominent global health concern (1), affecting not only low- and middle-income countries but also high-income countries (2, 3). Based on reports from the World Health Organization (WHO), global obesity rates have experienced a threefold increase since 1975 (4). Obesity leads to inflammatory conditions in adipose tissue, causing metabolic diseases including hypertension, cardiovascular diseases, insulin resistance, and cancers, which are attributable for the death of 17 million people each year worldwide (1, 5).
Diets rich in energy-dense foods and beverages, such as sugar-sweetened beverages, has been linked to an increased risk of obesity and chronic diseases by contributing to enhanced energy intake (6, 7). Moreover, high consumption of free sugar might lead to less intake of essential micronutrients from healthy food choices, reducing diet quality and thus increasing the risk of nutrient deficiencies (8–10). Acknowledging the adverse effects of high sugar consumption, the World Health Organization limits the consumption of sugars to 10% of daily energy intake (11). Due to the disadvantages of sugar-sweetened beverages (SSBs) as a major contributor to the consumption of added sugars, non-nutritive sweeteners (NNSs) were introduced as an alternative. According to the published literature, the consumption of non-nutritive sweeteners has increased in recent years (12, 13). Aspartame, acesulfame-K, neotame, saccharin, sucralose and advantame are approved by the United States Food and Drug Administration (FDA) are used in a wide range of foods and beverages. The FDA guarantees their safety up to acceptable daily intake levels (14). Additionally, stevia has approval of Codex commission which consists of the WHO and the Food Agriculture Organization (FAO) (15).
Although theoretically NNSs should reduce energy and carbohydrate intake, there are controversial results regarding their effect on satiety and energy balance as marker of long-term satiety (16–18). Some RCTs have suggested a reducing effect of diet beverage consumption on energy intake (17, 19). However, Orku et al. reported that NNS consumption was not significantly related to energy and macronutrient intake (16). It has been shown that replacing sugar with artificial sweeteners leads to a decrease in energy and sugar intake in healthy, obese, and overweight people (20). However, there is a hypothesis that the consumption of non-nutritive sweeteners causes disturbances in appetite control (21, 22), and there is a concern that the intake of these sweeteners increases the desire for sweet and energy-containing foods (23, 24).
As far as we are aware, no comprehensive research on the effects of these sweeteners on macronutrients intake has been conducted so far. Therefore, the present study aimed to systematically review the effects of NNSs on total energy and macronutrient intake, with a subsequent meta-analysis to confirm the findings.
2 Materials and methods
This study was done as part of a large project aimed at investigating the effects of non-nutritive sweeteners on various aspects of health in adults. The protocol for the main study was registered in the prospective register of systematic reviews (PROSPERO) database in June 2023 (registration code: CRD42023432816). We followed the Preferred Reporting Items for Systematic Reviews and Meta-Analysis (PRISMA) guideline (25) to report the current study. The ethics committee of Shahid Sadoughi University of Medical Sciences, Yazd, Iran, approved the protocol of the current study (ethical approval code: IR.SSU.SPH.REC.1402.119).
2.1 Study selection criteria
The search strategy was carried out in online databases including PubMed, ISI Web of Science, Scopus, and Google Scholar up to September 2024 using two sets of the following keywords: (1) “Non Nutritive Sweeteners,” “Non Nutritive Sweeteners,” “artificial sweeteners,” “Artificially Sweetened Soda,” “non-caloric sweeteners,” “non caloric sweeteners,” “zero-calorie sweetener,” “high-intensity sweetener,” “sugar substitute,” “Low-calorie sweeteners,” “artificial sugar,” “Sweetening Agents,” Aspartame, Stevia, Saccharin, acetosulfame, “acesulfame K,” “acesulfame potassium,” NutraSweet, Splenda, Cyclamates, “Steviol glycosides,” “rebaudioside A,” newtame, “sugar twin,” “monk fruit,” “rebaudioside D,” and stevioside. (2) intervention, trial, randomized, random, randomly, placebo, assignment, “clinical trial,” RCT, “Clinical Trials as Topic,” cross-over, parallel. There were no language or other limitations. To find possible new articles, the reference lists of the included articles were thoroughly checked (Supplementary Table 1).
Studies with the following criteria were included in the current meta-analysis: (1) Randomized controlled trials (RCTs) with parallel or crossover design, (2) studies with a duration of at least 4 weeks, (3) studies involving individuals aged 18 and older. Trials were excluded if they contained sugar alcohols, were performed on children and adolescents, had a duration of less than 4 weeks, did not provide sufficient data, were animal or in-vitro studies. If there were several articles on a data set, the most complete one was considered. Additionally, to extract data from articles with an additional arm, they were considered as a separate study.
2.2 Data extraction
Two investigators (KR, AHN) independently extracted the data. The accuracy of the extracted data was checked by two other researchers (FM, BS), and any discrepancies were resolved under the supervision of another investigator (ASA). The extracted data included the following items: authors’ names, publication year, type of NNSs and control, sample size, population characteristics (age, gender, body mass index, health status of the participants), type of study (parallel or cross-over), duration of intervention, and mean and standard deviation (SD) values of total energy, sugar, fiber, and macronutrient intake.
2.3 Risk of bias assessment
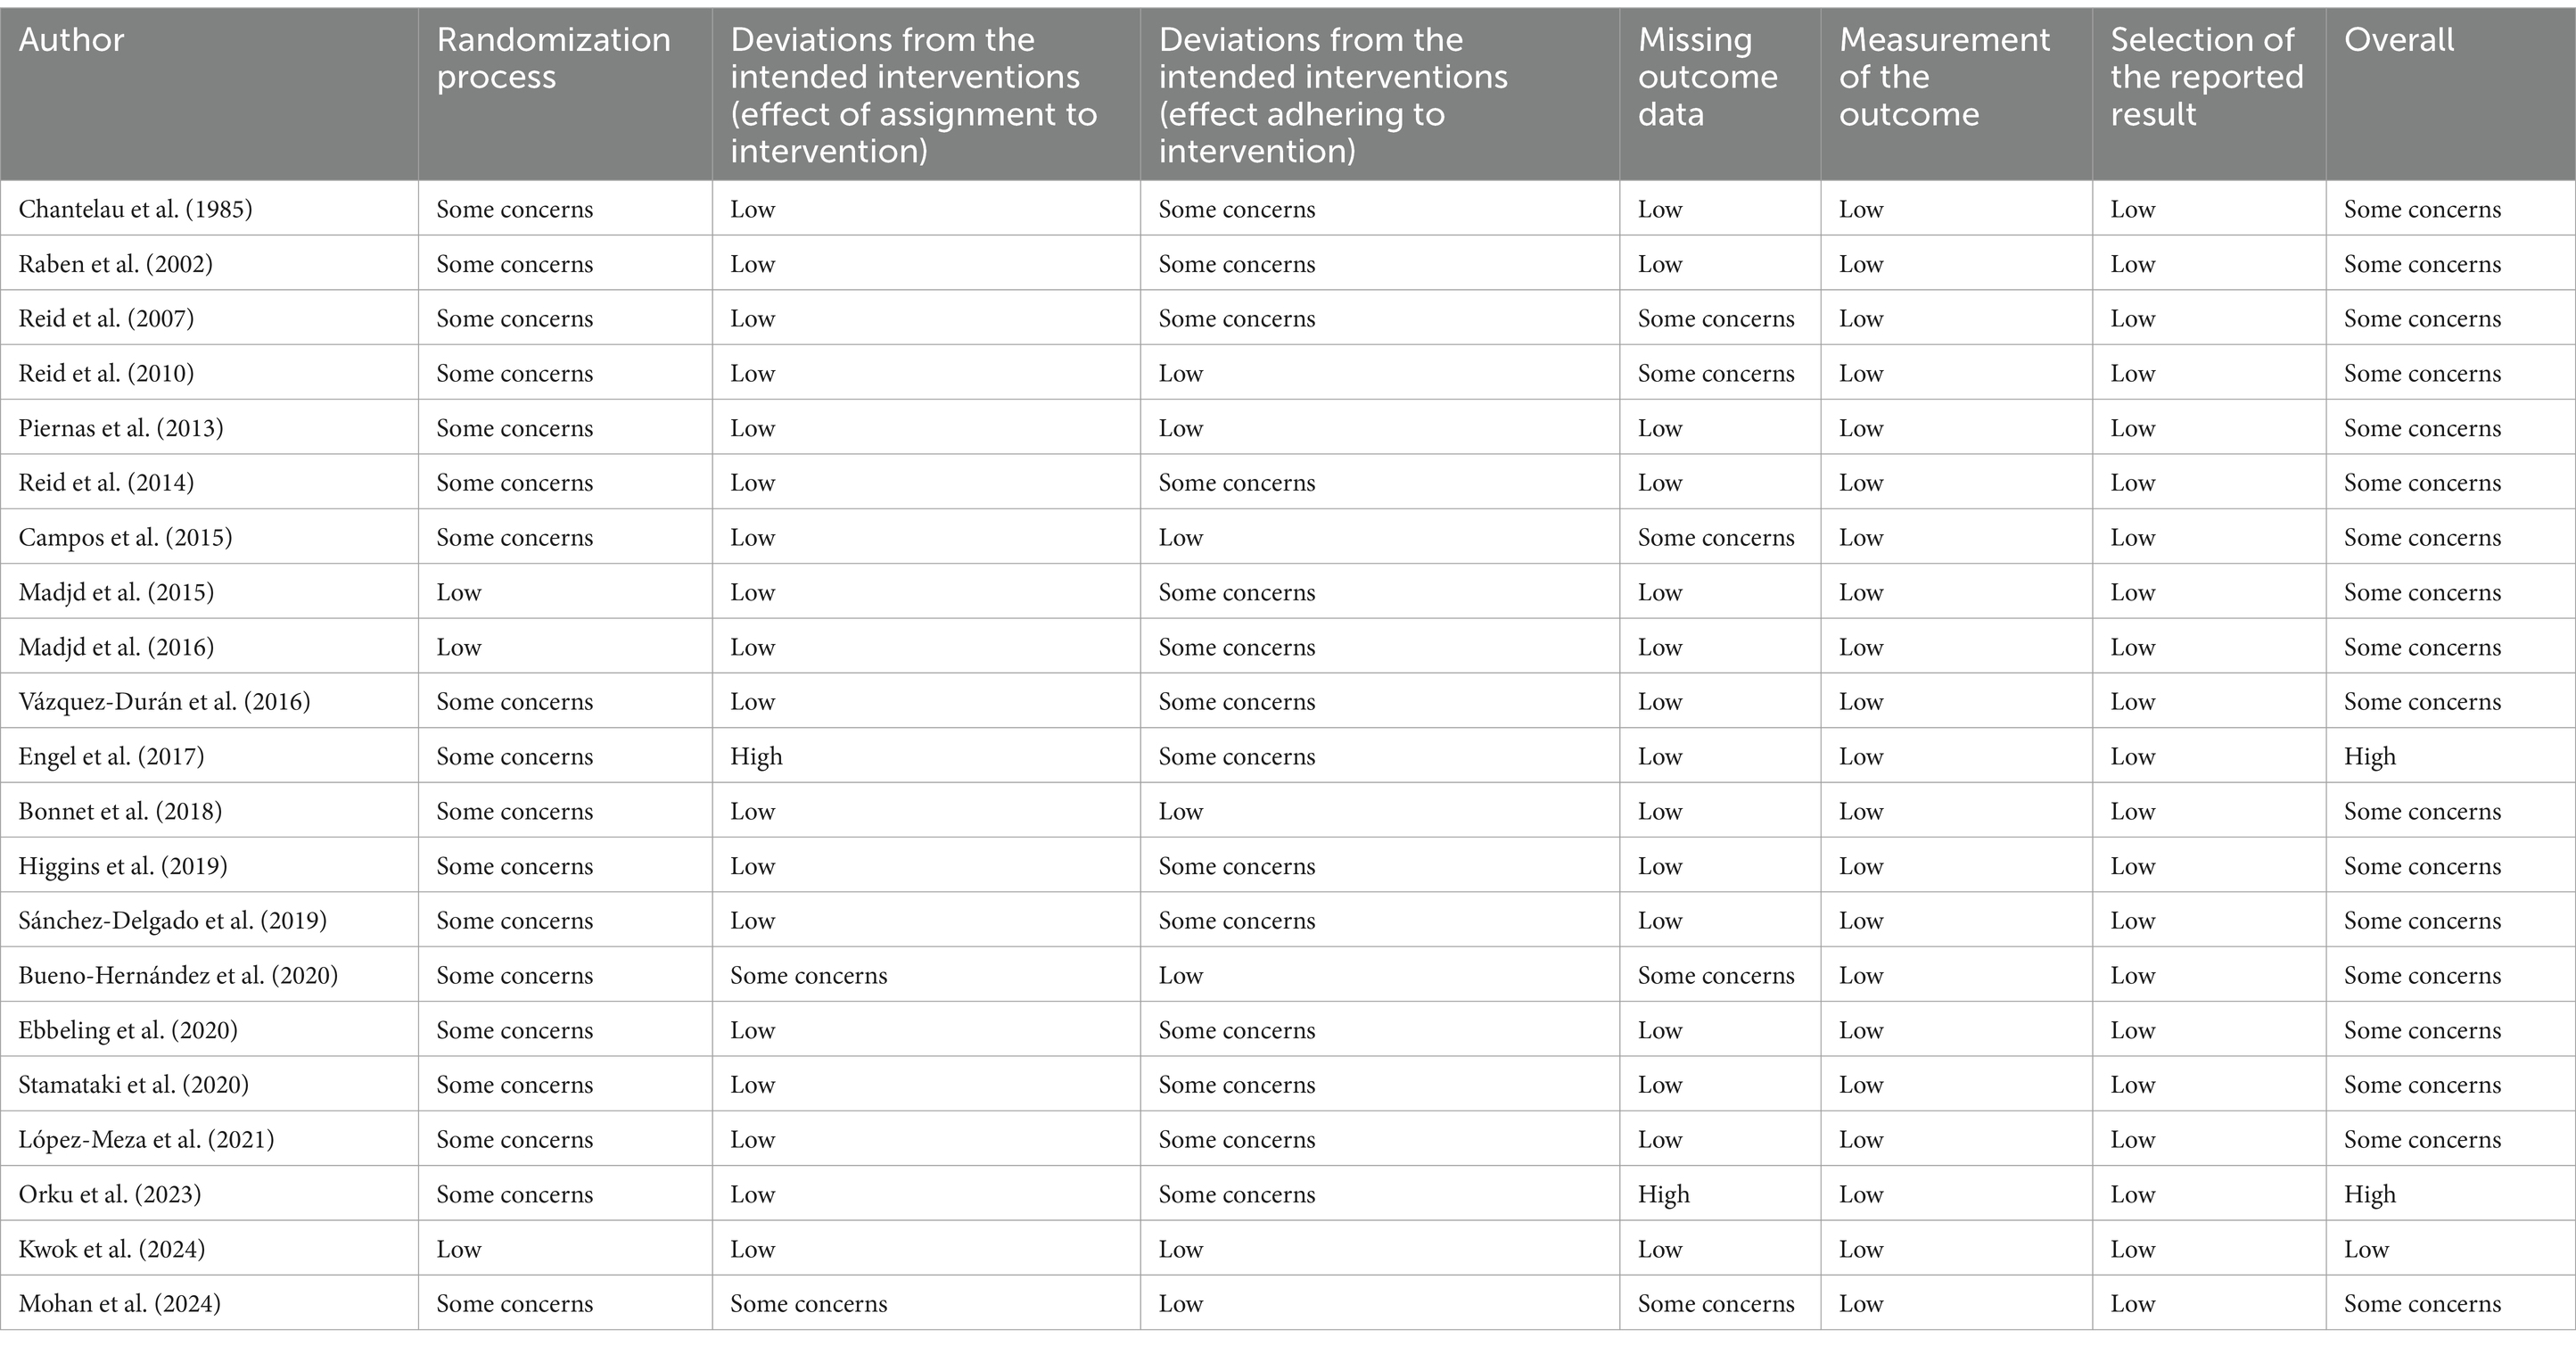
Included studies were evaluated using Version 2 of the Cochrane risk-of-bias tool for randomized trials (RoB2) (26). The following domains were assessed for each study: randomization process, deviations from the intended interventions (effect of assignment to intervention), deviations from the intended interventions (effect of adhering to intervention), missing outcome data, inappropriate measurement of the outcome, and selection of the reported results. Each domain received high, low or some concerns. Overall, each study was categorized as low risk (low risk of bias for all items), some concerns (one or more items with some concerns), or high risk (high risk of bias for one or more items). The assessment was initially conducted by one author (KR), with a second author verifying the risk assessment (FM).
2.4 Statistical analyses
Mean change from baseline and its standard deviation (SD) in total energy and nutrient intake were calculated for both the intervention and comparison groups. The difference in mean change between the intervention and control groups and its corresponding SD was then determined (27, 28). A correlation coefficient (R) of 0.50 was assumed for this calculation. Notably, using a correlation coefficient of 0.1 and 0.9 did not yield significantly different results. Subsequently, we calculated the bias-corrected standardized mean difference (hedges’ g) for the meta-analyses of all nutrients except for the total energy intake which was reported as Kcal/day, and for the effects of NNSs on fiber intake vs water, on sugar intake vs water, and on fat intake vs water which were reported as g/day. Indeed, all analyses were performed separately based on the type of control group intervention (sugar/water). For the effect of non-nutritive sweeteners consumption on sugar intake based on control group intervention (sugar/water), in NNSs vs. sugar subgroup, we calculated the bias-corrected standardized mean difference (hedges’ g) for the meta-analyses of sugar intake as the final effect size due to the varying units reported in different studies, which could not be converted into the same unit. But, for the effect of non-nutritive sweeteners consumption on sugar intake in NNSs vs. water, included studies reported same unit, therefore, we calculated the WMD for the meta-analyses as the effect size. An inverse variance random effects model was selected to calculate pooled estimates. Cochran Q test and I-squared (I2) were used to measure heterogeneity across included studies (29). An I2 > 50% or p < 0.05 for Q test indicated significant heterogeneity between studies. It should be noted that all analyses were performed separately based on the type of control group intervention (sugar/water). Subgroup analysis was conducted based on the type of the intervention (sucralose, stevia, aspartame, saccharine, cyclamate, combined), participant’s health condition (healthy, overweight and obese, diabetic), sex (female, both), type of study (parallel, cross-over), and duration (<12 weeks, ≥12 weeks for total energy intake and <10 weeks, ≥10 weeks for macronutrients intake). Additionally, the subgroup analysis was done based on the type of diet during the intervention (usual diet, low calorie diet) in NNSs vs. water. By performing sensitivity analysis, dependency of the results on the studies was checked. Indeed, to assess the stability of the results, a sensitivity analysis was performed by systematically excluding one study at a time. Evaluation of publication bias was done using Begg’s and Egger’s tests, complemented by a funnel plot depiction. Statistical analyses were carried out in STATA version 17 (Stata Corp, College Station, TX), with statistical significance attributed to p-values less than 0.05.
2.5 Certainty of evidence
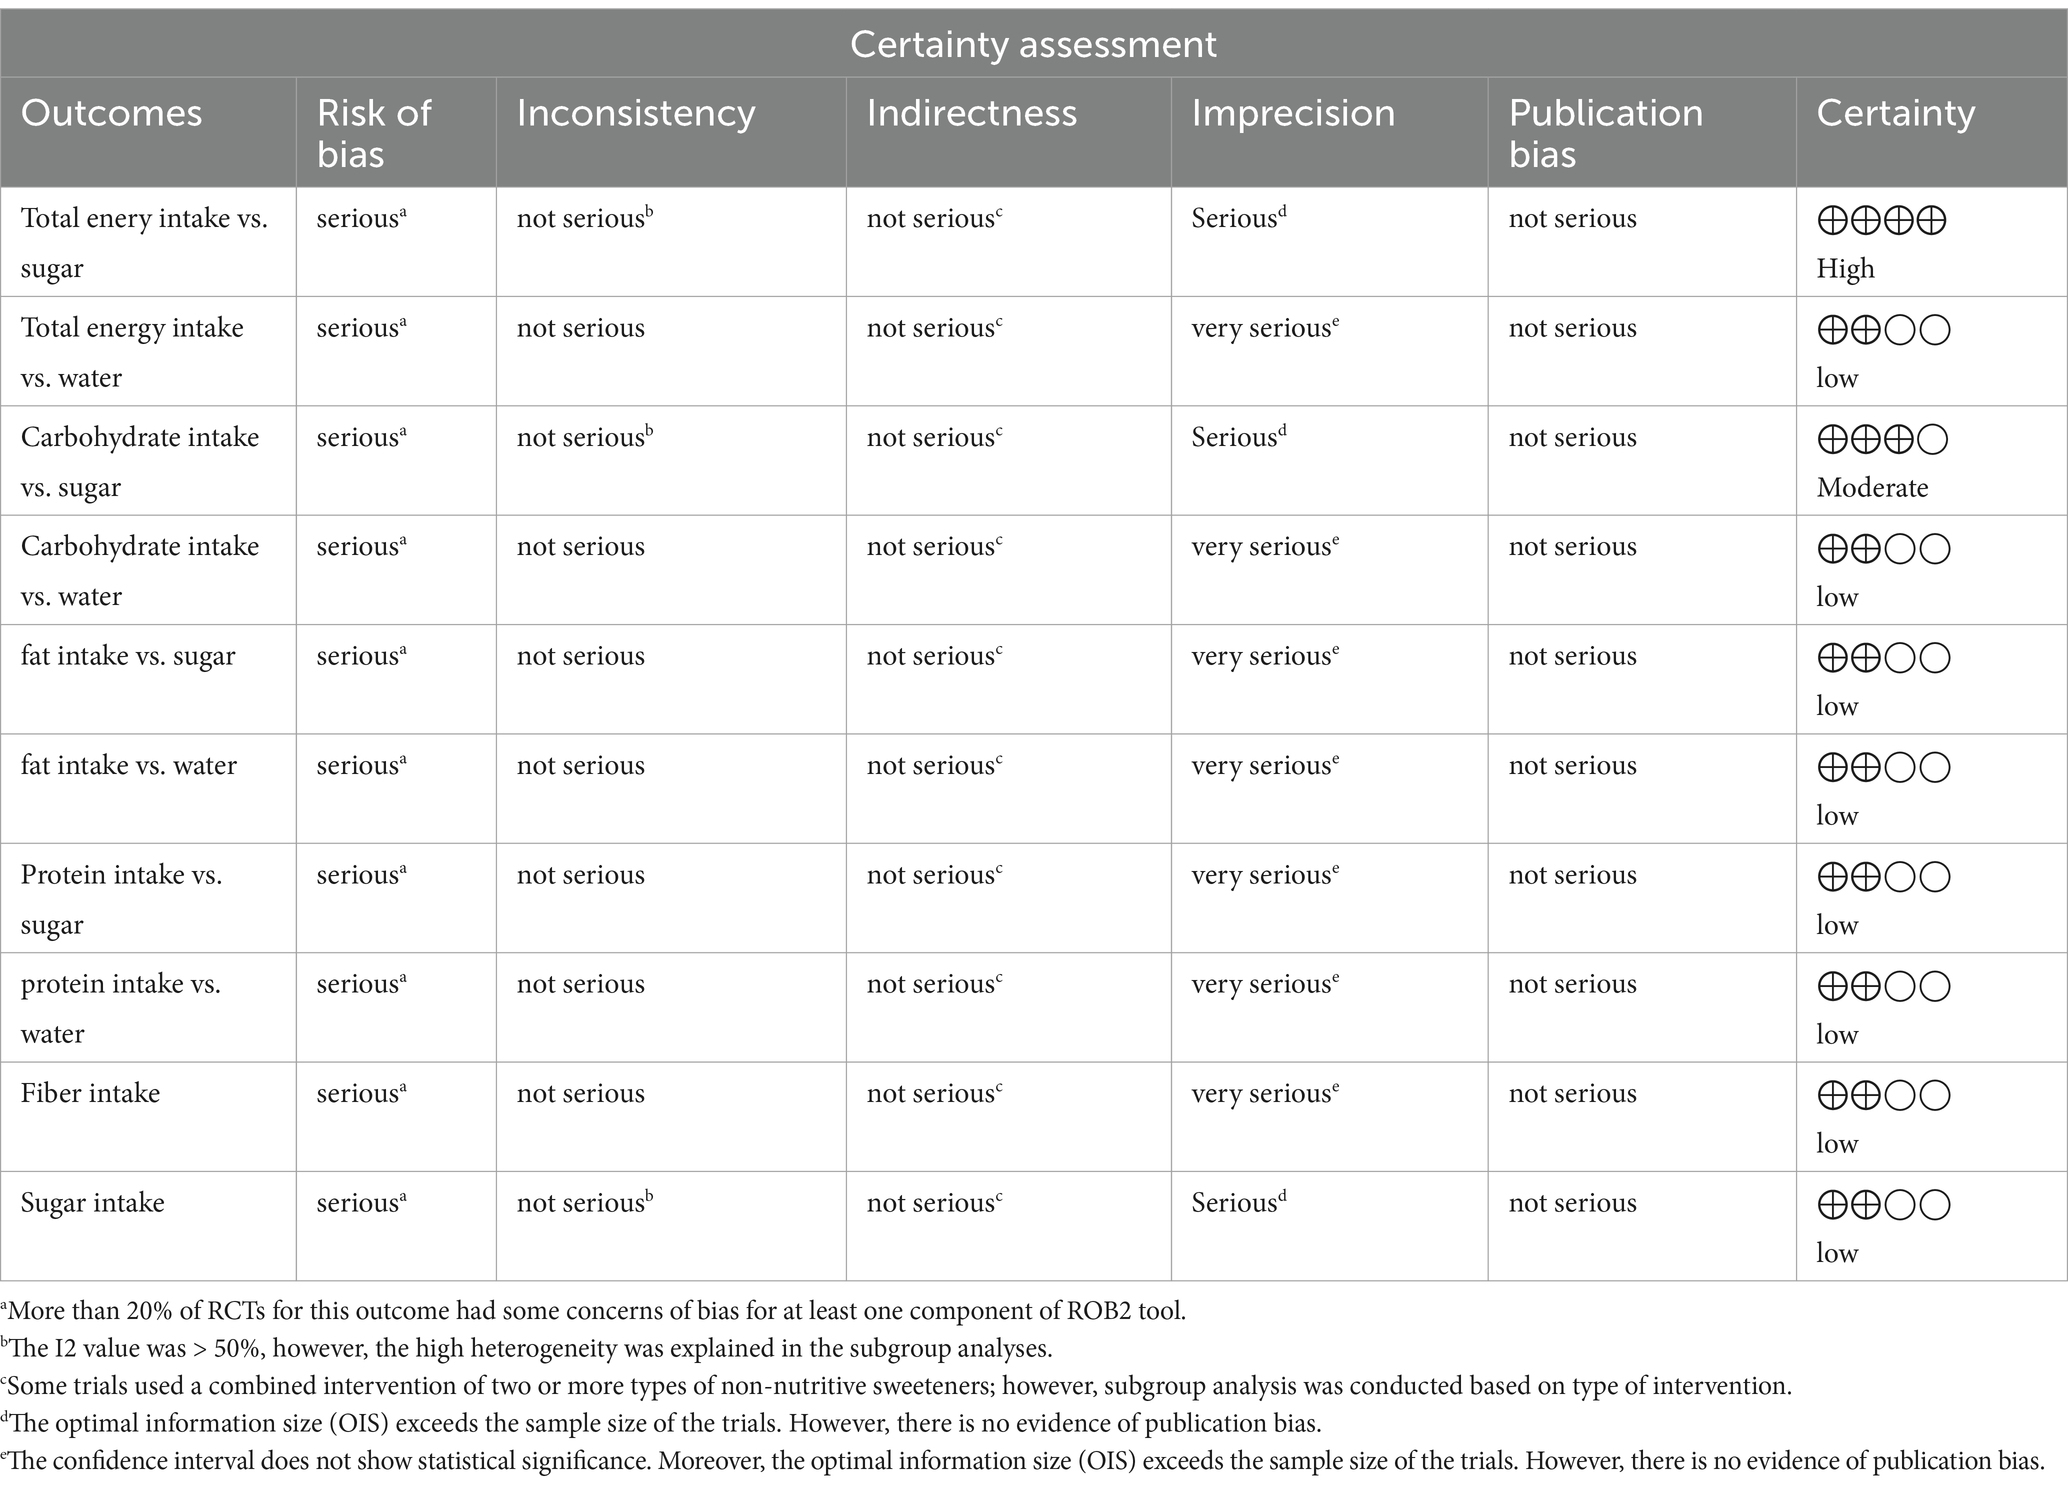
The certainty in evidence was evaluated across trials using the guidelines of the GRADE (Grading of Recommendations Assessment, Development, and Evaluation) working group by two researchers (KR, FM), independently (30). According to the corresponding evaluation criteria, the quality of evidence was divided into high, moderate, low and very low based on risk of bias, inconsistency, indirectness, imprecision, and other considerations such as publication bias, effect size, and potential confounding (31).
3 Results
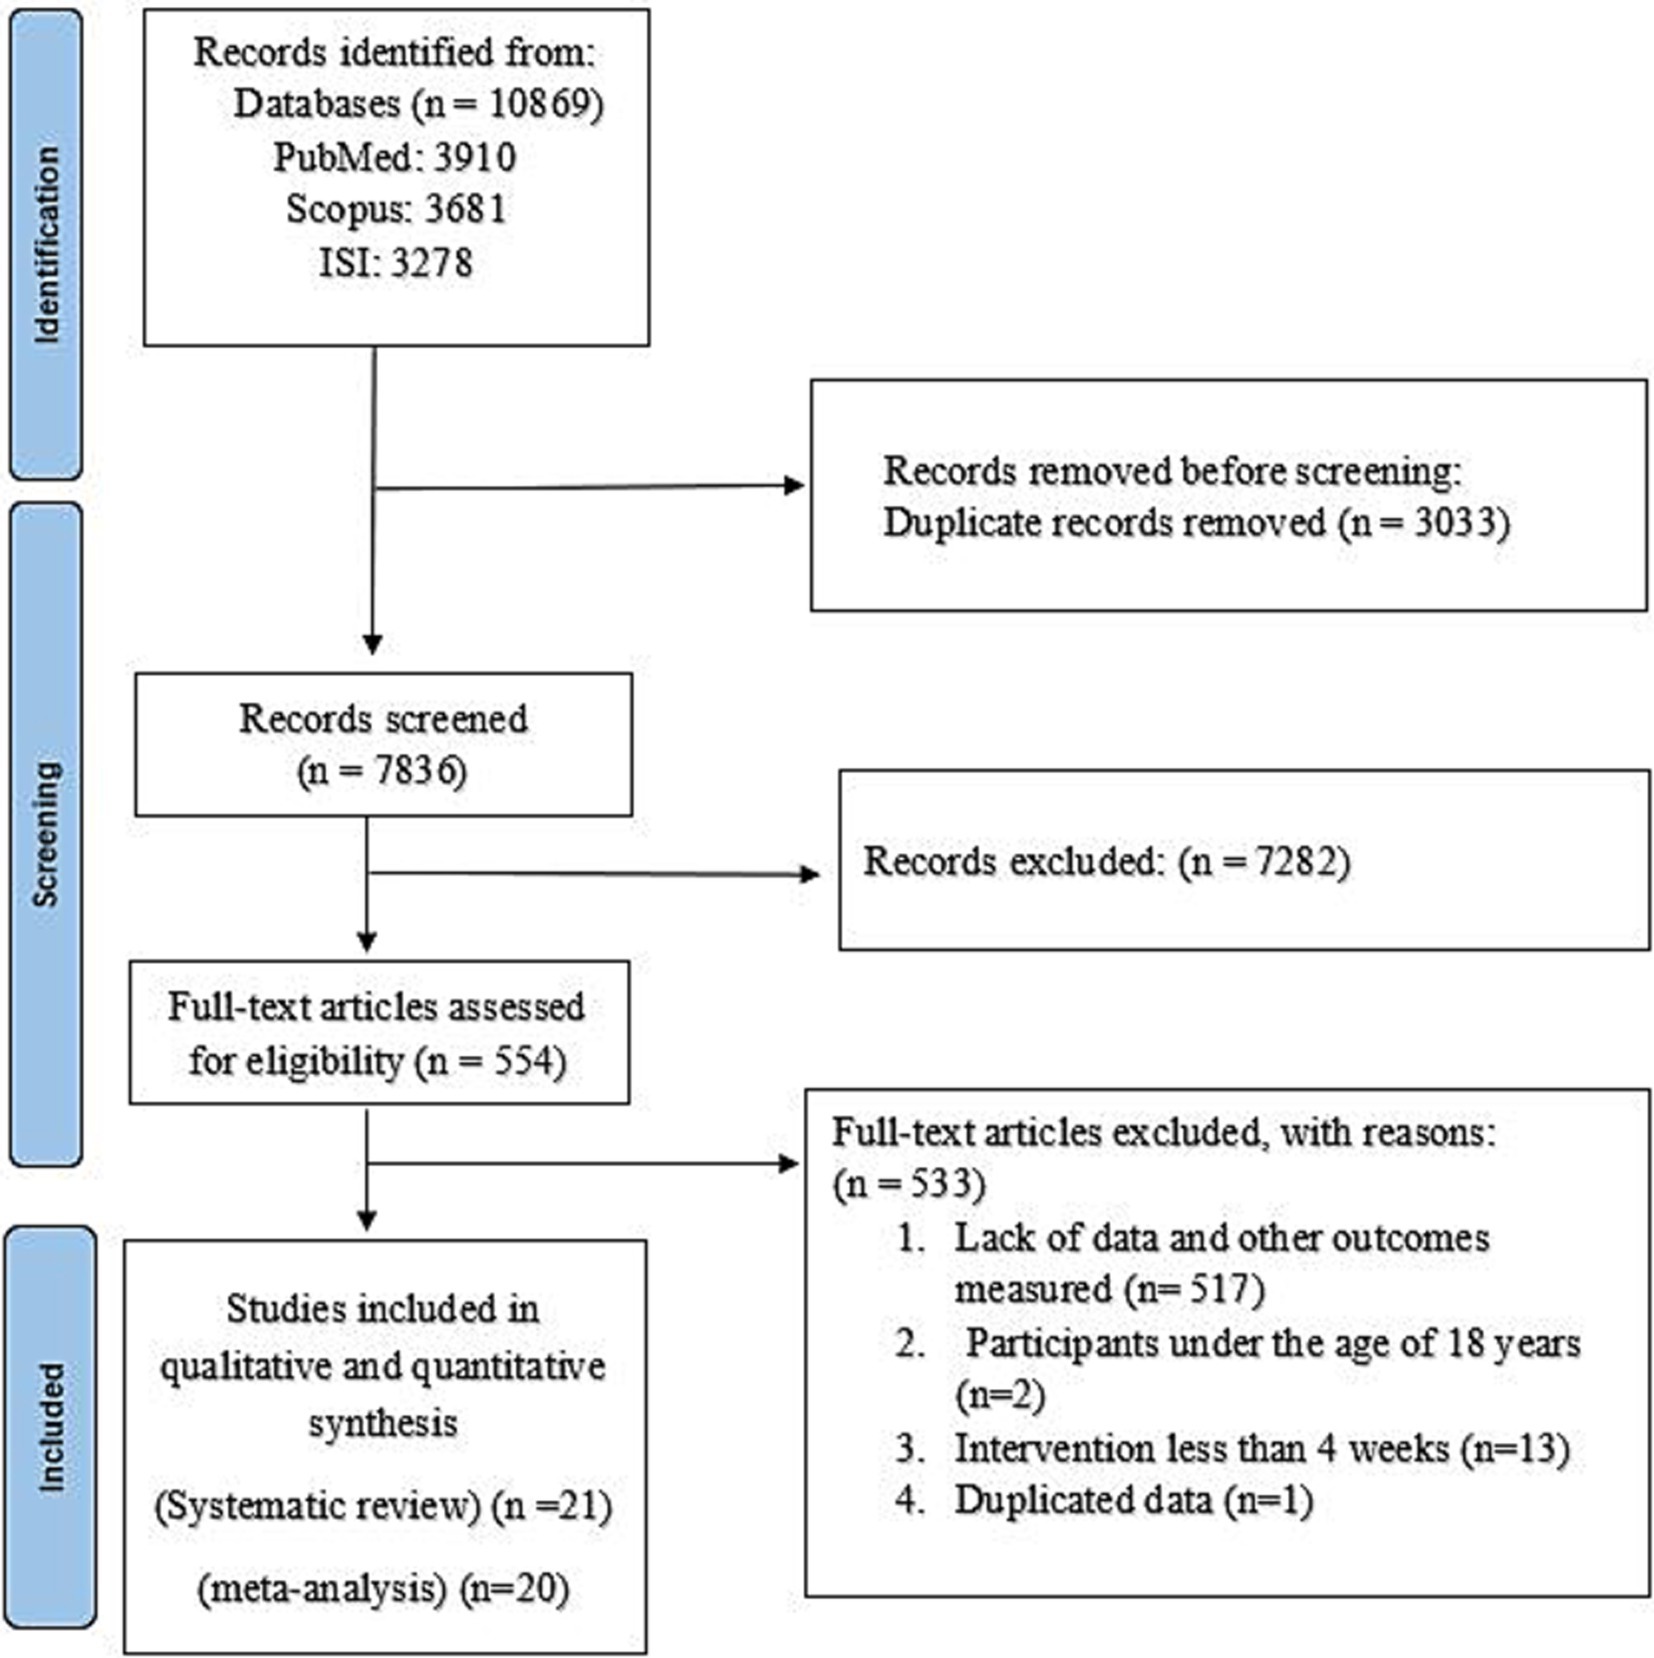
Out of 10,869 references that were found in our primary search, 3,033 duplicate records were excluded. After reviewing the 7,836 remaining articles, 7,282 were discarded as they were deemed irrelevant after examining their titles and abstracts. Finally, after reviewing 554 full-text papers, 533 articles were excluded for the following reasons: 517 studies did not report sufficient or relevant data, 2 studies were conducted on participants under 18 years (32, 33), and 13 studies were assessed the short-term effect of NNSs (less than 4 weeks) (34–46). Two of the included articles had similar datasets (47, 48); therefore, data extraction was done from the most complete one (48). Finally, 21 papers were found to fulfill the inclusion criteria for the systematic review, and 20 papers were appropriate for meta-analysis (16–18, 48–64). The selection process for the study is depicted in Figure 1.
3.1 Study characteristics
The characteristics of 21 included RCTs published between 1985 and 2024 are illustrated in Table 1. Eligible studies were conducted in Mexico (49–51, 65), United Kingdom (18, 57, 60, 61), Iran (55, 56), Denmark (48, 53), United States (17, 52, 64), Turkey (16), Switzerland (62), France (54), Canada (59), India (63), and Germany (58). Two of the studies employed a cross-over design (54, 58), while the others had a parallel design (16–18, 48–53, 55–57, 59–65). Fifteen studies were conducted on both genders (17, 18, 48–54, 58, 59, 62–65), and six studies were performed only on female participants (16, 55–57, 60, 61). The characteristics of the participants were as follow: obese or overweight (17, 48, 52–54, 56, 60–62), healthy (16, 18, 49–51, 57, 59, 64, 65), and type 2 diabetes mellitus (55, 58, 63). The age range of the participants was 18 to 65 years, and the duration of the intervention varied between 4 and 52 weeks. Types of artificial sweeteners used include sucralose (16, 49–52, 63), stevia (18, 49, 51, 52, 59), saccharine (16, 52), aspartame (52, 57, 60, 61), cyclamate (58), and combined nonnutritive sweeteners (16, 17, 48, 53–56, 62, 64, 65).
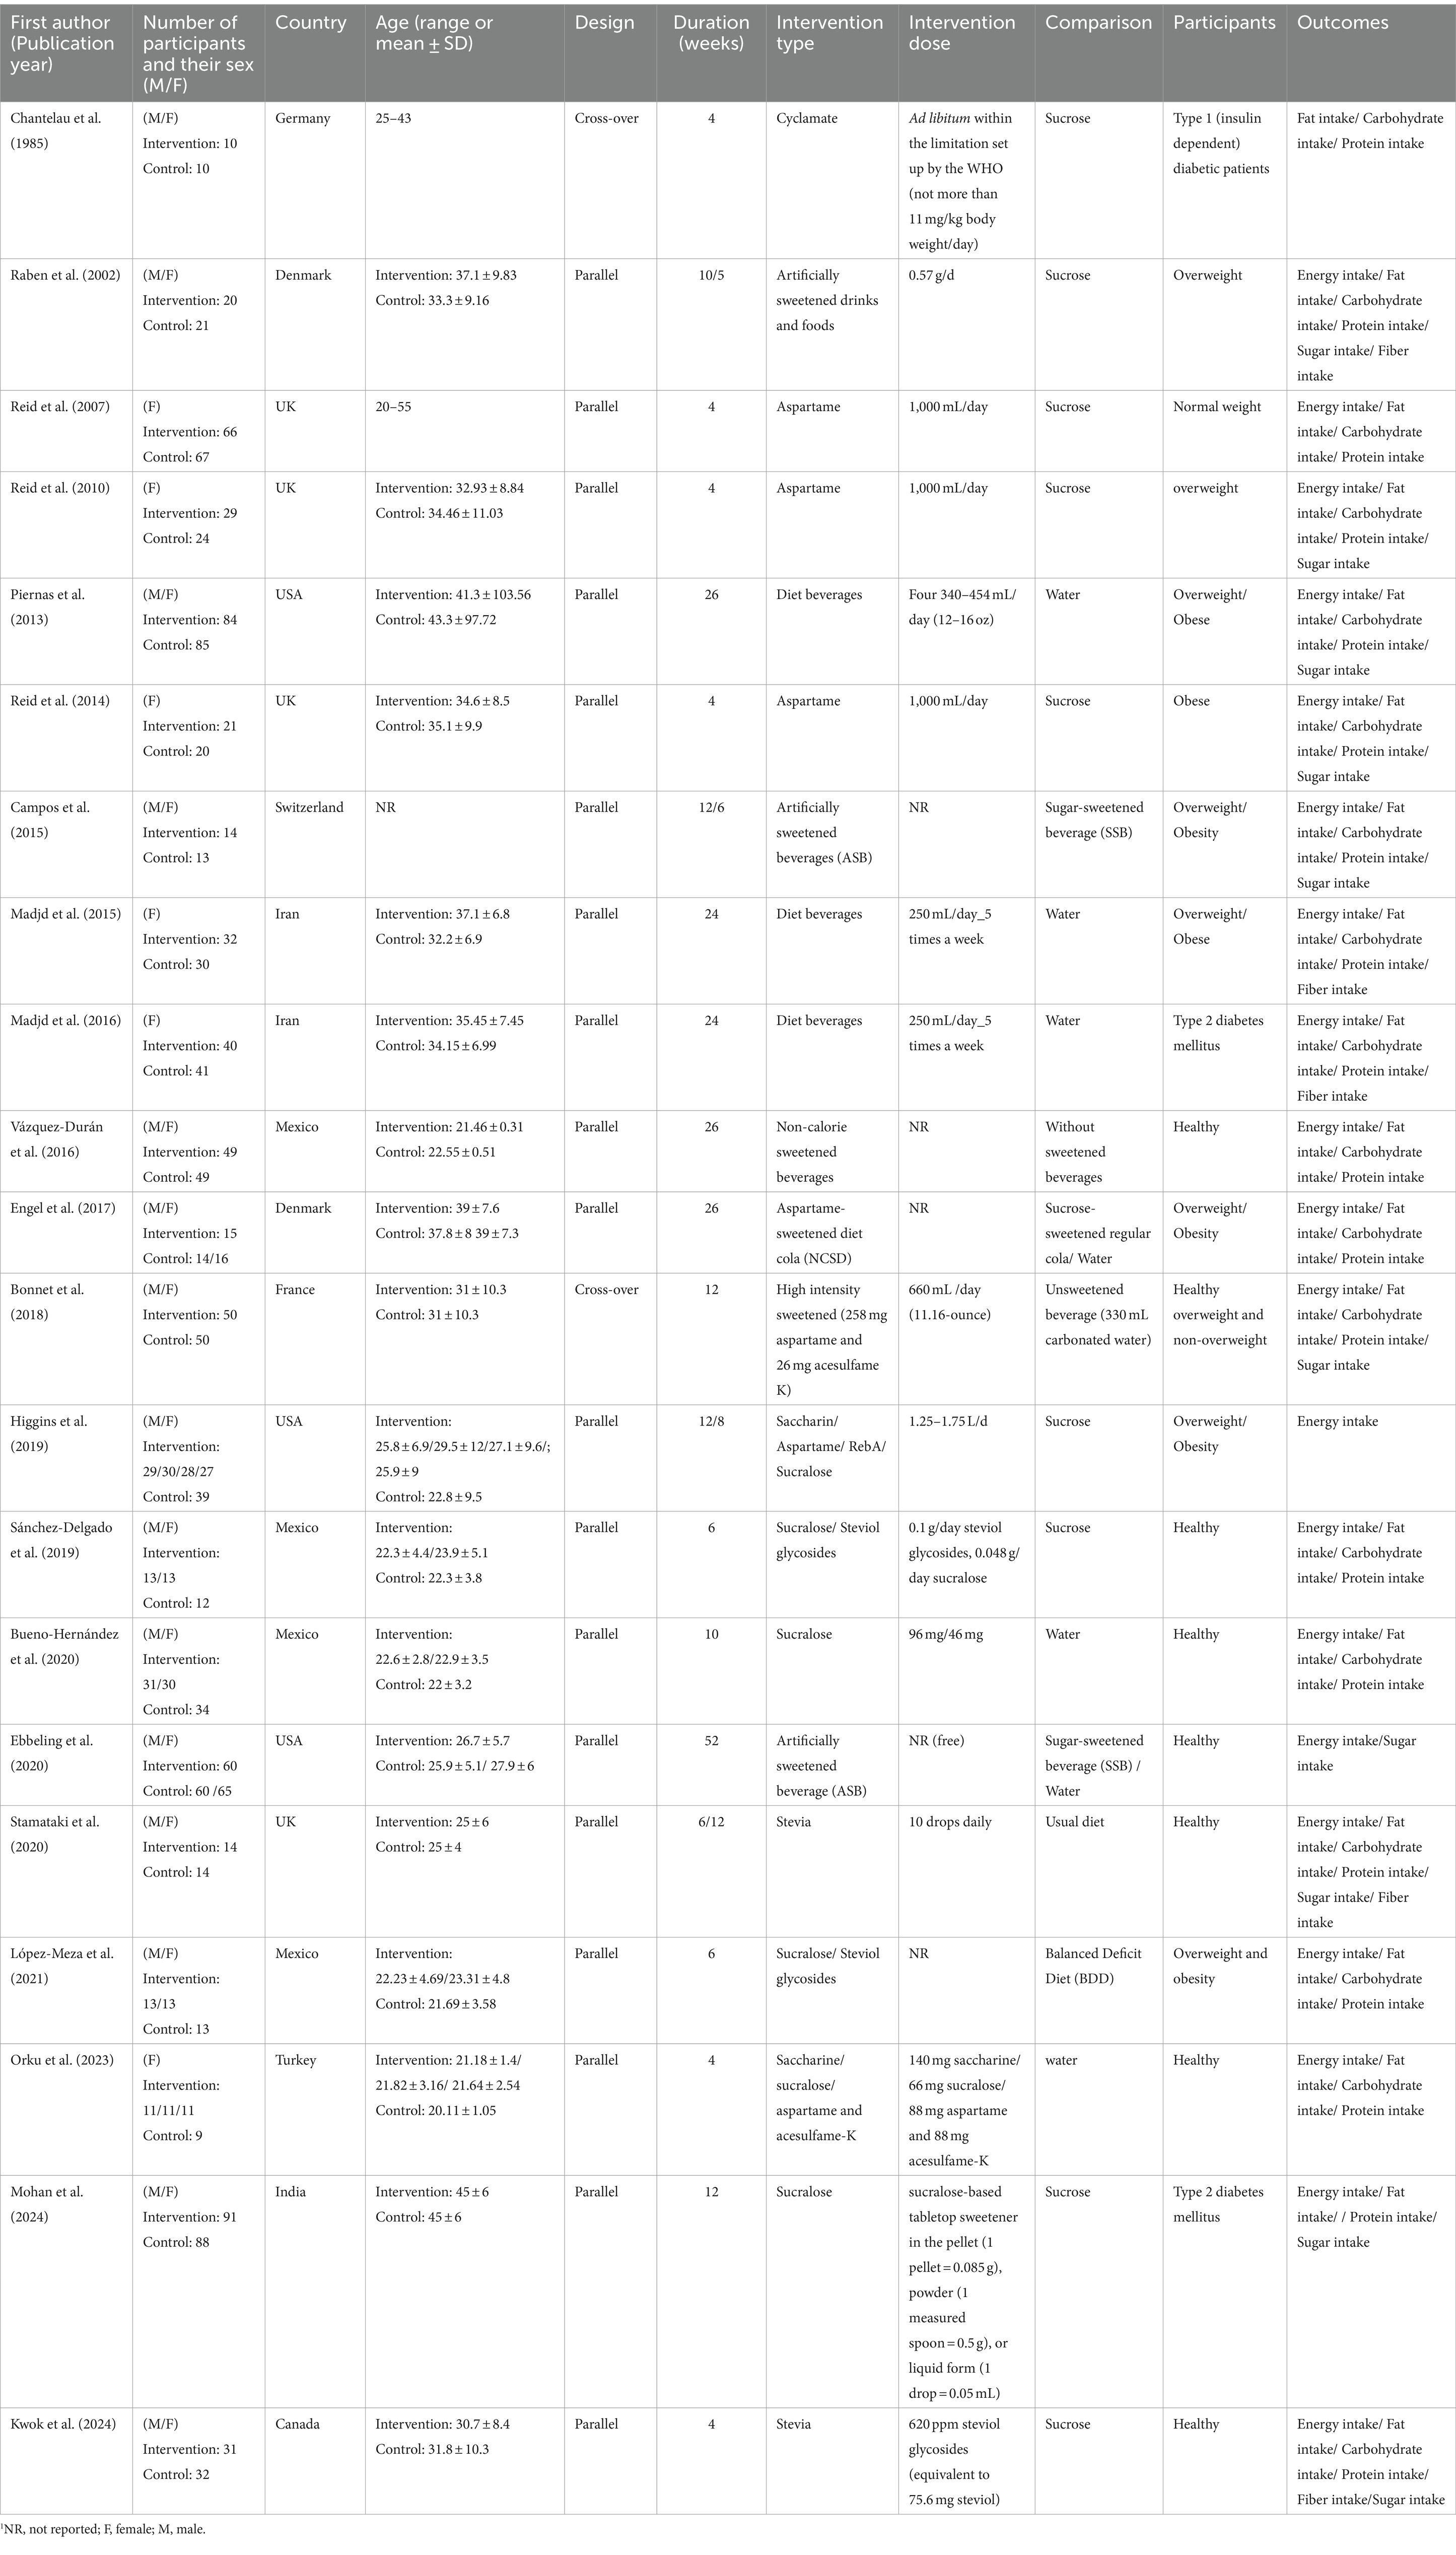
Table 1. Characteristics of randomized clinical trials included in the systematic review.1
3.2 Risk of bias assessment
According to the ROB2 tool, 18 studies were classified as having some concerns (17, 18, 48–52, 54–58, 60–65), two studies were graded as high risk of bias (16, 53), and only one studies had a low risk of bias (59). The quality assessment of the included articles is indicated in Table 2.
3.3 Findings from the meta-analysis
3.3.1 The effects of NNSs consumption on total energy intake
The extracted data from individual studies are provided Supplementary Table 2. The meta-analysis was performed separately based on the type of control group (sugar and water; Figure 2). In total, 13 articles (18 effect sizes, 944 participants) investigated the effect of NNSs consumption on total energy intake in comparison with sugar (18, 48, 49, 51–53, 57, 59–64), and 8 studies (11 effect sizes, 655 Participants) used water as a control (15–17, 50, 53–56, 64). The results showed a significant decrease in total energy intake [total energy intake change = −175.26 kcal/day, 95% confidence interval (CI): −296.47 to −54.06, I2 = 61.19%] after NNS consumption compared to sugar intake. However, there was no significant effect on total energy intake after the NNS intake compared to water (total energy intake change = 29.94 kcal/day, 95% CI: −70.37 to 130.24, I2 = 34.98%). The between-study heterogeneity was notable for total energy intake in NNSs intervention vs. both water and sugar comparison (Q statistic sugar = 43.18, Cochrane Q test, p < 0.001, I2 = 61.19% / Q statistic water = 15.38, Cochrane Q test, p = 0.12, I2 = 34.98%). Therefore, subgroup analyses were performed to detect potential sources of heterogeneity. In NNSs vs. sugar, the result indicated that among different types of NNS as intervention, only combined NNSs significantly decreased total energy intake (p < 0.001). In studies that included both male and female participants together, NNSs vs. sugar demonstrated a significant reduction in total energy intake (total energy intake change: −248.56 kcal/day; 95% CI: −384.69 to −112.44, I2 = 57%). However, this effect was not statistically significant in studies that focused exclusively on female participants (p = 0.12). In NNSs vs. sugar, the result showed a significant decrease in total energy intake among participants with diabetes [Weighted mean difference (WMD): −83.40 kcal/day (95% CI: −161.45 to −5.35, p = 0.04]. Both short-term (shorter than 12 weeks) and long-term intervention (12 weeks and more) with NNSs vs. sugar revealed remarkable reduction in total energy intake (p < 0.05). In NNSs vs. water, the subgroup analysis indicated that only sucralose as NNSs significantly increased total energy intake (WMD = 358.71 kcal/day, 95% CI: 54.59 to 662.83, I2 = 0%), while the other NNSs had no significant effect. Moreover, when NNSs was compared with water in the context of a low-calorie diet, a higher total energy intake was observed in the NNS intake group (p = 0.02). The overall results based on different comparisons are shown in Table 3.
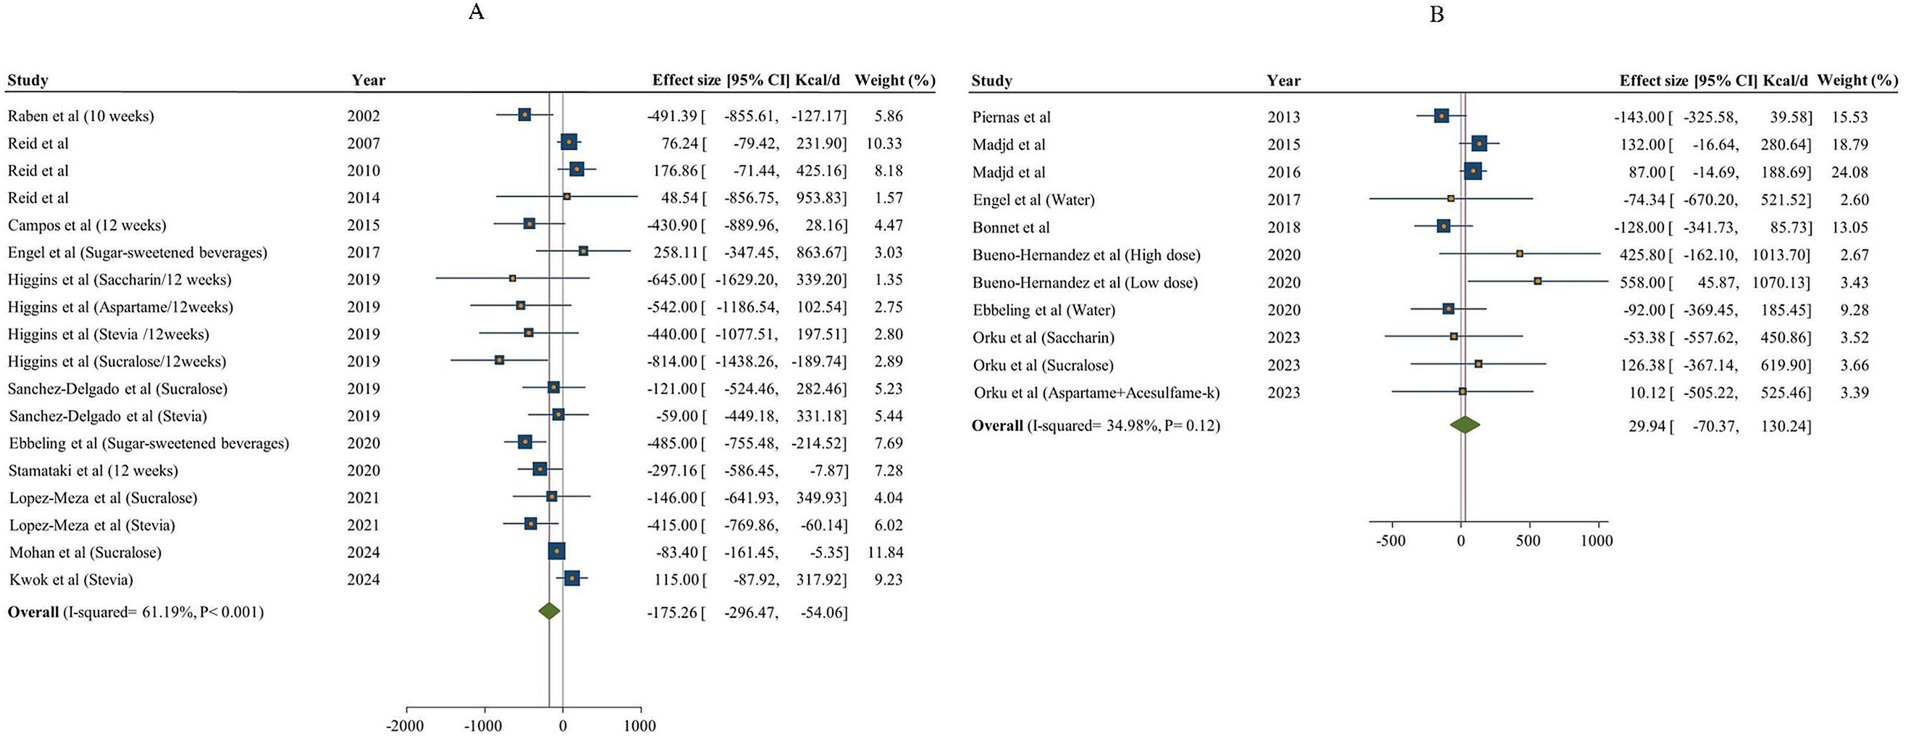
Figure 2. Forest plot expressing the effects of NNSs on energy intake compared to sugar (A) and water (B) intake as control. The analysis was performed using a random effects model.
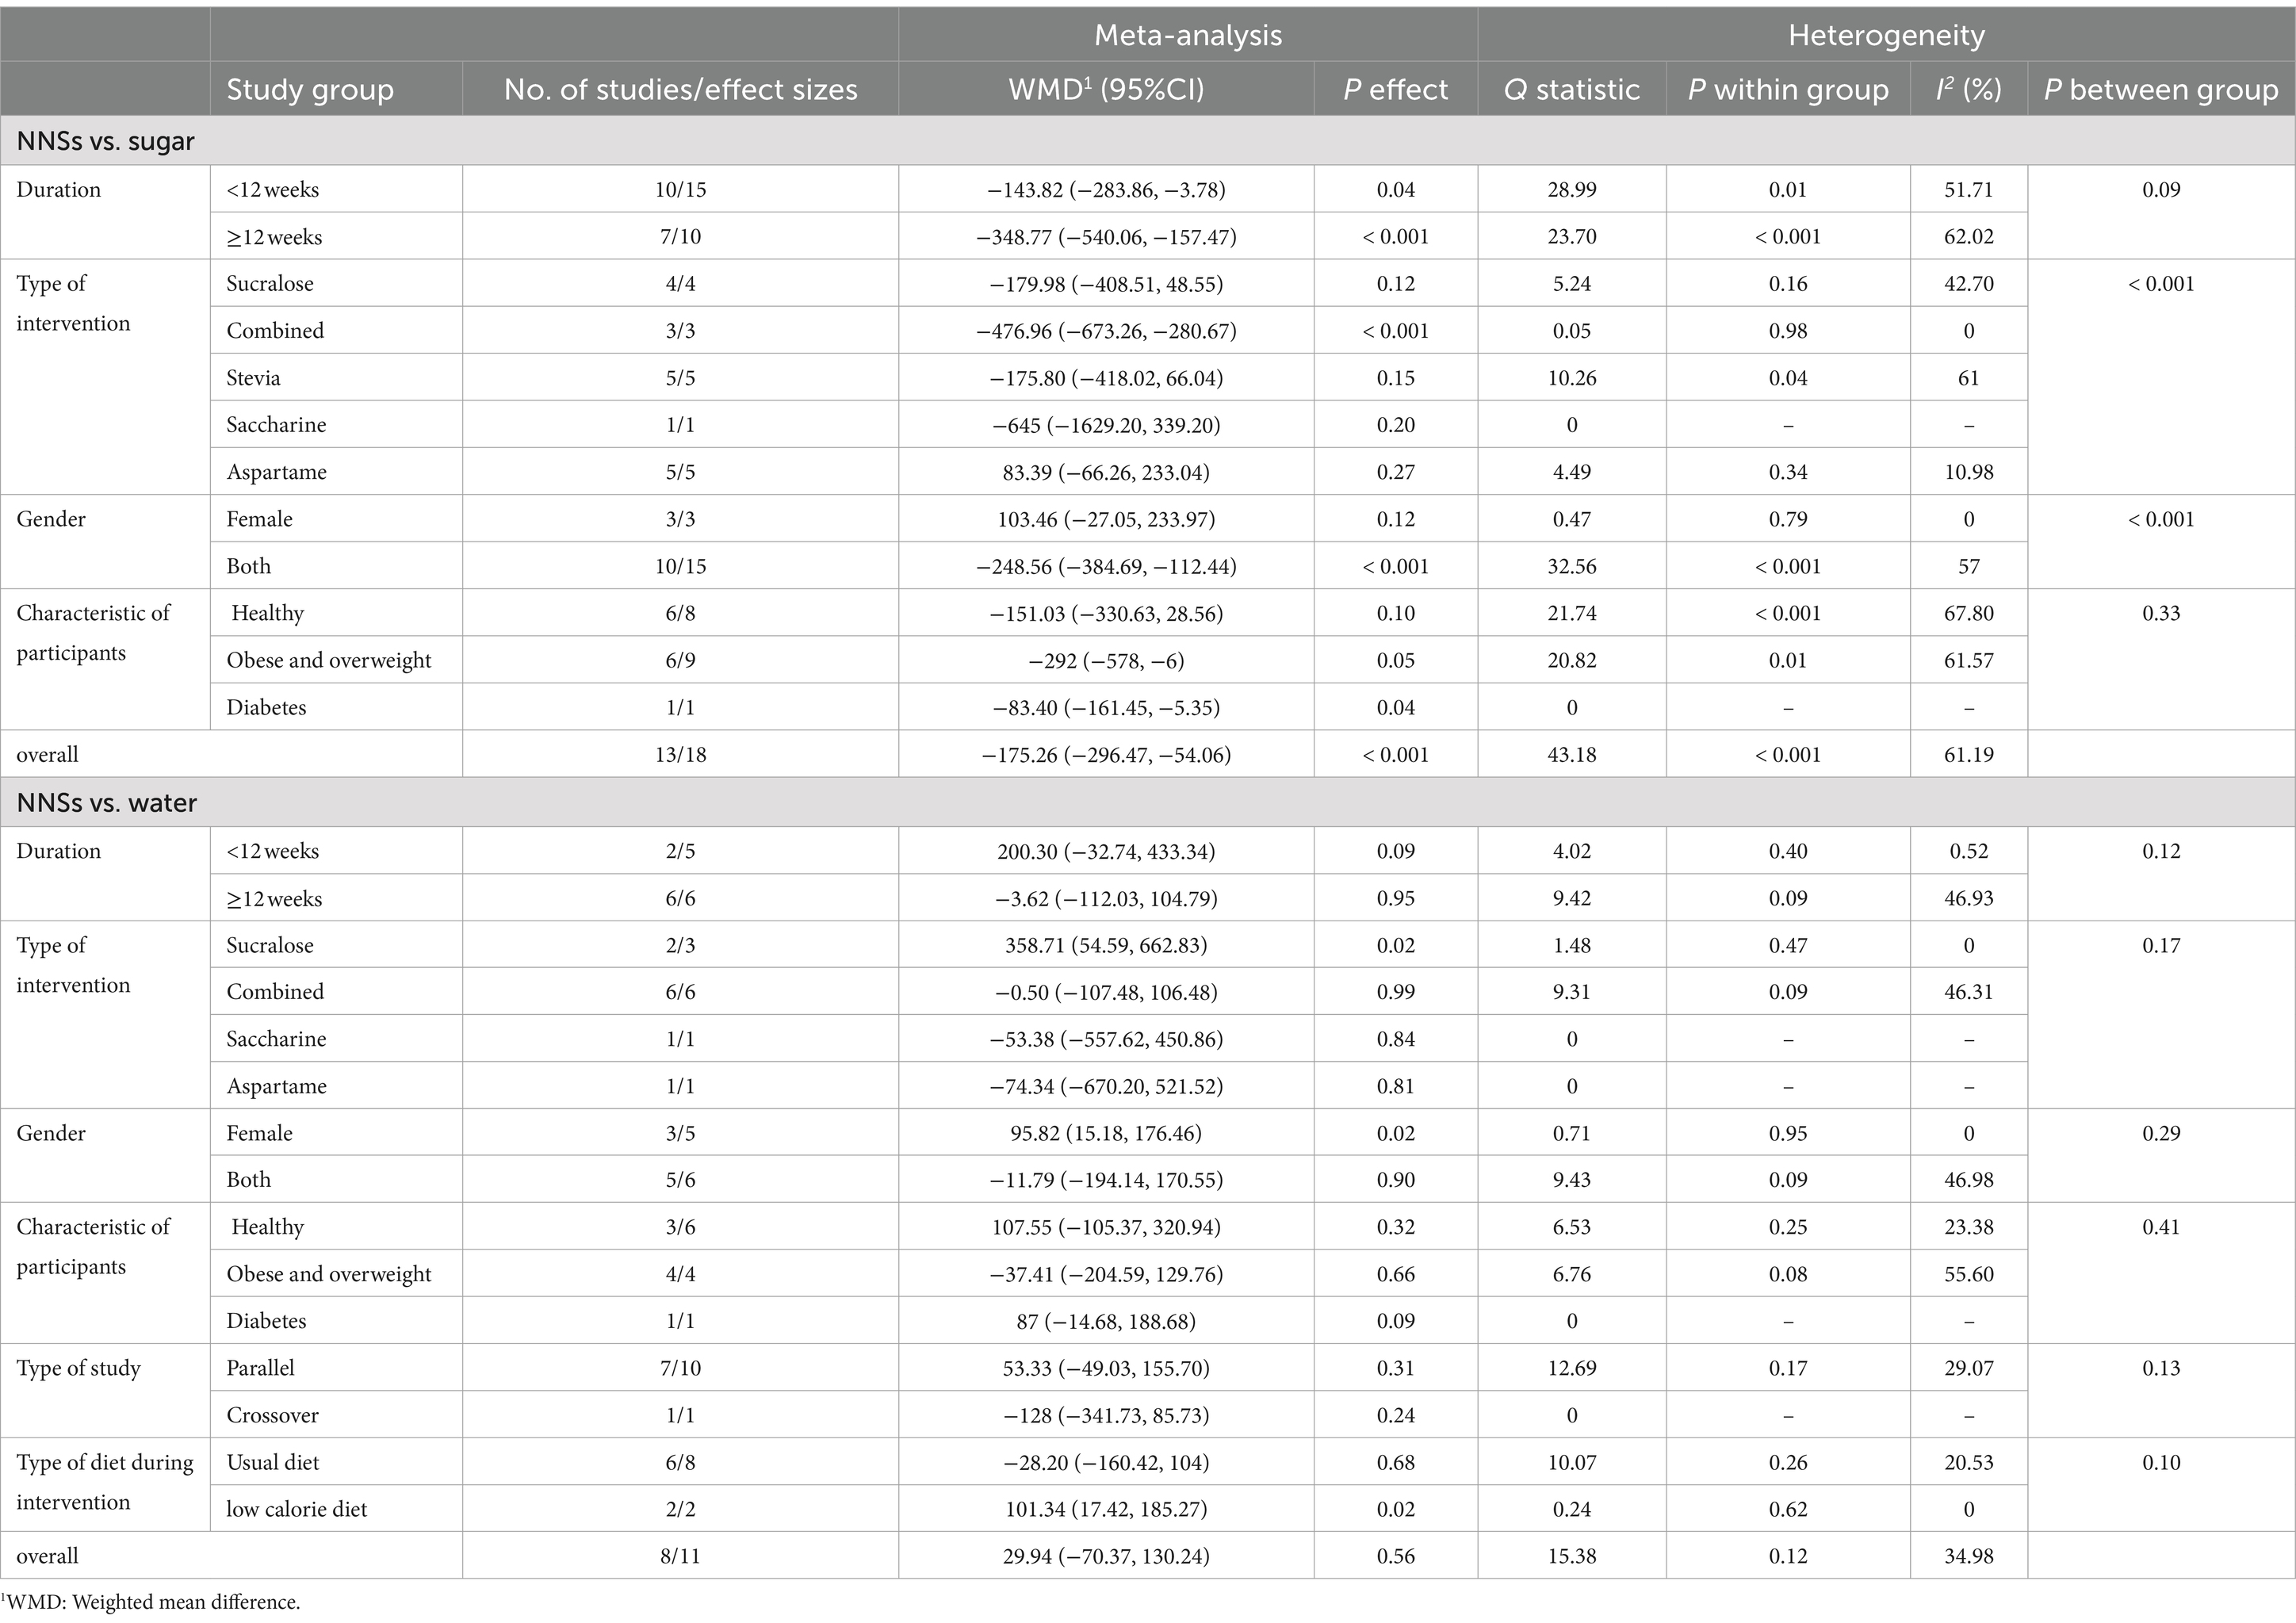
Table 3. Meta-analysis showing the effect of non-nutritive sweeteners consumption on energy intake based on several subgroups (all analyses were conducted using random effects model).
3.3.2 The effects of NNSs consumption on carbohydrate intake
A total of 11 articles with 13 effect sizes and 502 participants assessed the effects of NNSs consumption on carbohydrate intake (18, 48, 49, 51, 53, 57–62). The comparison of NNSs with sugar showed a significant reduction in carbohydrate intake [Hedges’ g = −0.35, 95% CI: −0.63 to −0.06, I2 = 58.99%]. In contrast, the comparison of NNSs with water, based on 7 articles (10 effect sizes, 530 participants) (16, 17, 50, 53–56), indicated no significant effect on carbohydrate intake [Hedges’ g = 0.28, 95% CI: −0.02 to 0.58, I2 = 65.26%, Figure 3]. High between-study heterogeneity was observed for the effect of NNSs intake on carbohydrate intake compared with both sugar and water (Q statistic sugar = 29.26, Cochrane Q test, p < 0.001, I2 = 58.99%/ Q statistic water = 25.91, Cochrane Q test, p < 0.001, I2 = 65.26%). For NNSs vs. sugar, subgroup analysis demonstrated that consuming NNSs for over 10 weeks led to a notable decrease in carbohydrate intake (Hedges’ g = −0.92, 95% CI: −1.42 to −0.43, I2 = 41.35%). Moreover, this significant effect was only seen after consumption of combined NNSs (Hedges’ g = −1.33, 95% CI: −1.85 to −0.82, I2 = 0%), not with other types of NNSs. A significant reduction was also seen in parallel design studies and in studies including both genders. In NNSs vs. water, only sucralose intake had significant effect on carbohydrate intake (Hedges’ g = 0.54, 95% CI: 0.14 to 0.93, I2 = 0%). In NNSs vs. water, the result showed a significant increase in carbohydrate intake among female participants (p < 0.001). The significant effect of NNSs in comparison with water was also seen in healthy and diabetic participants (p = 0.01). Prescribing a low-calorie diet during the intervention significantly affected carbohydrate intake. The result of meta-analysis based on both comparison (sugar and water) is indicated in Table 4.
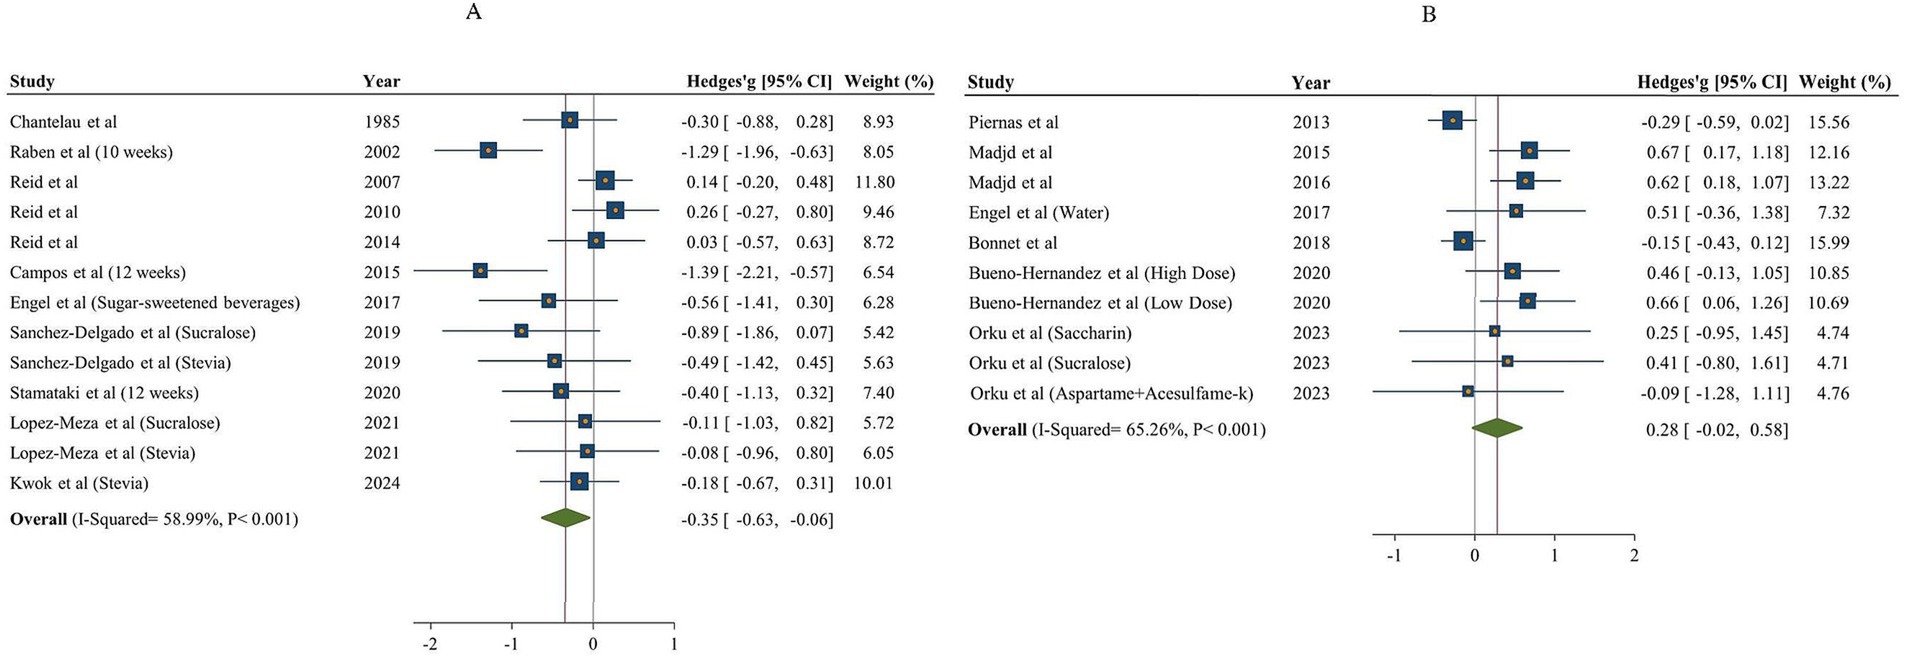
Figure 3. Forest plot indicating the effects of NNSs on carbohydrate intake compared to sugar (A) and water (B) intake as a control. The analysis was performed using a random effects model.
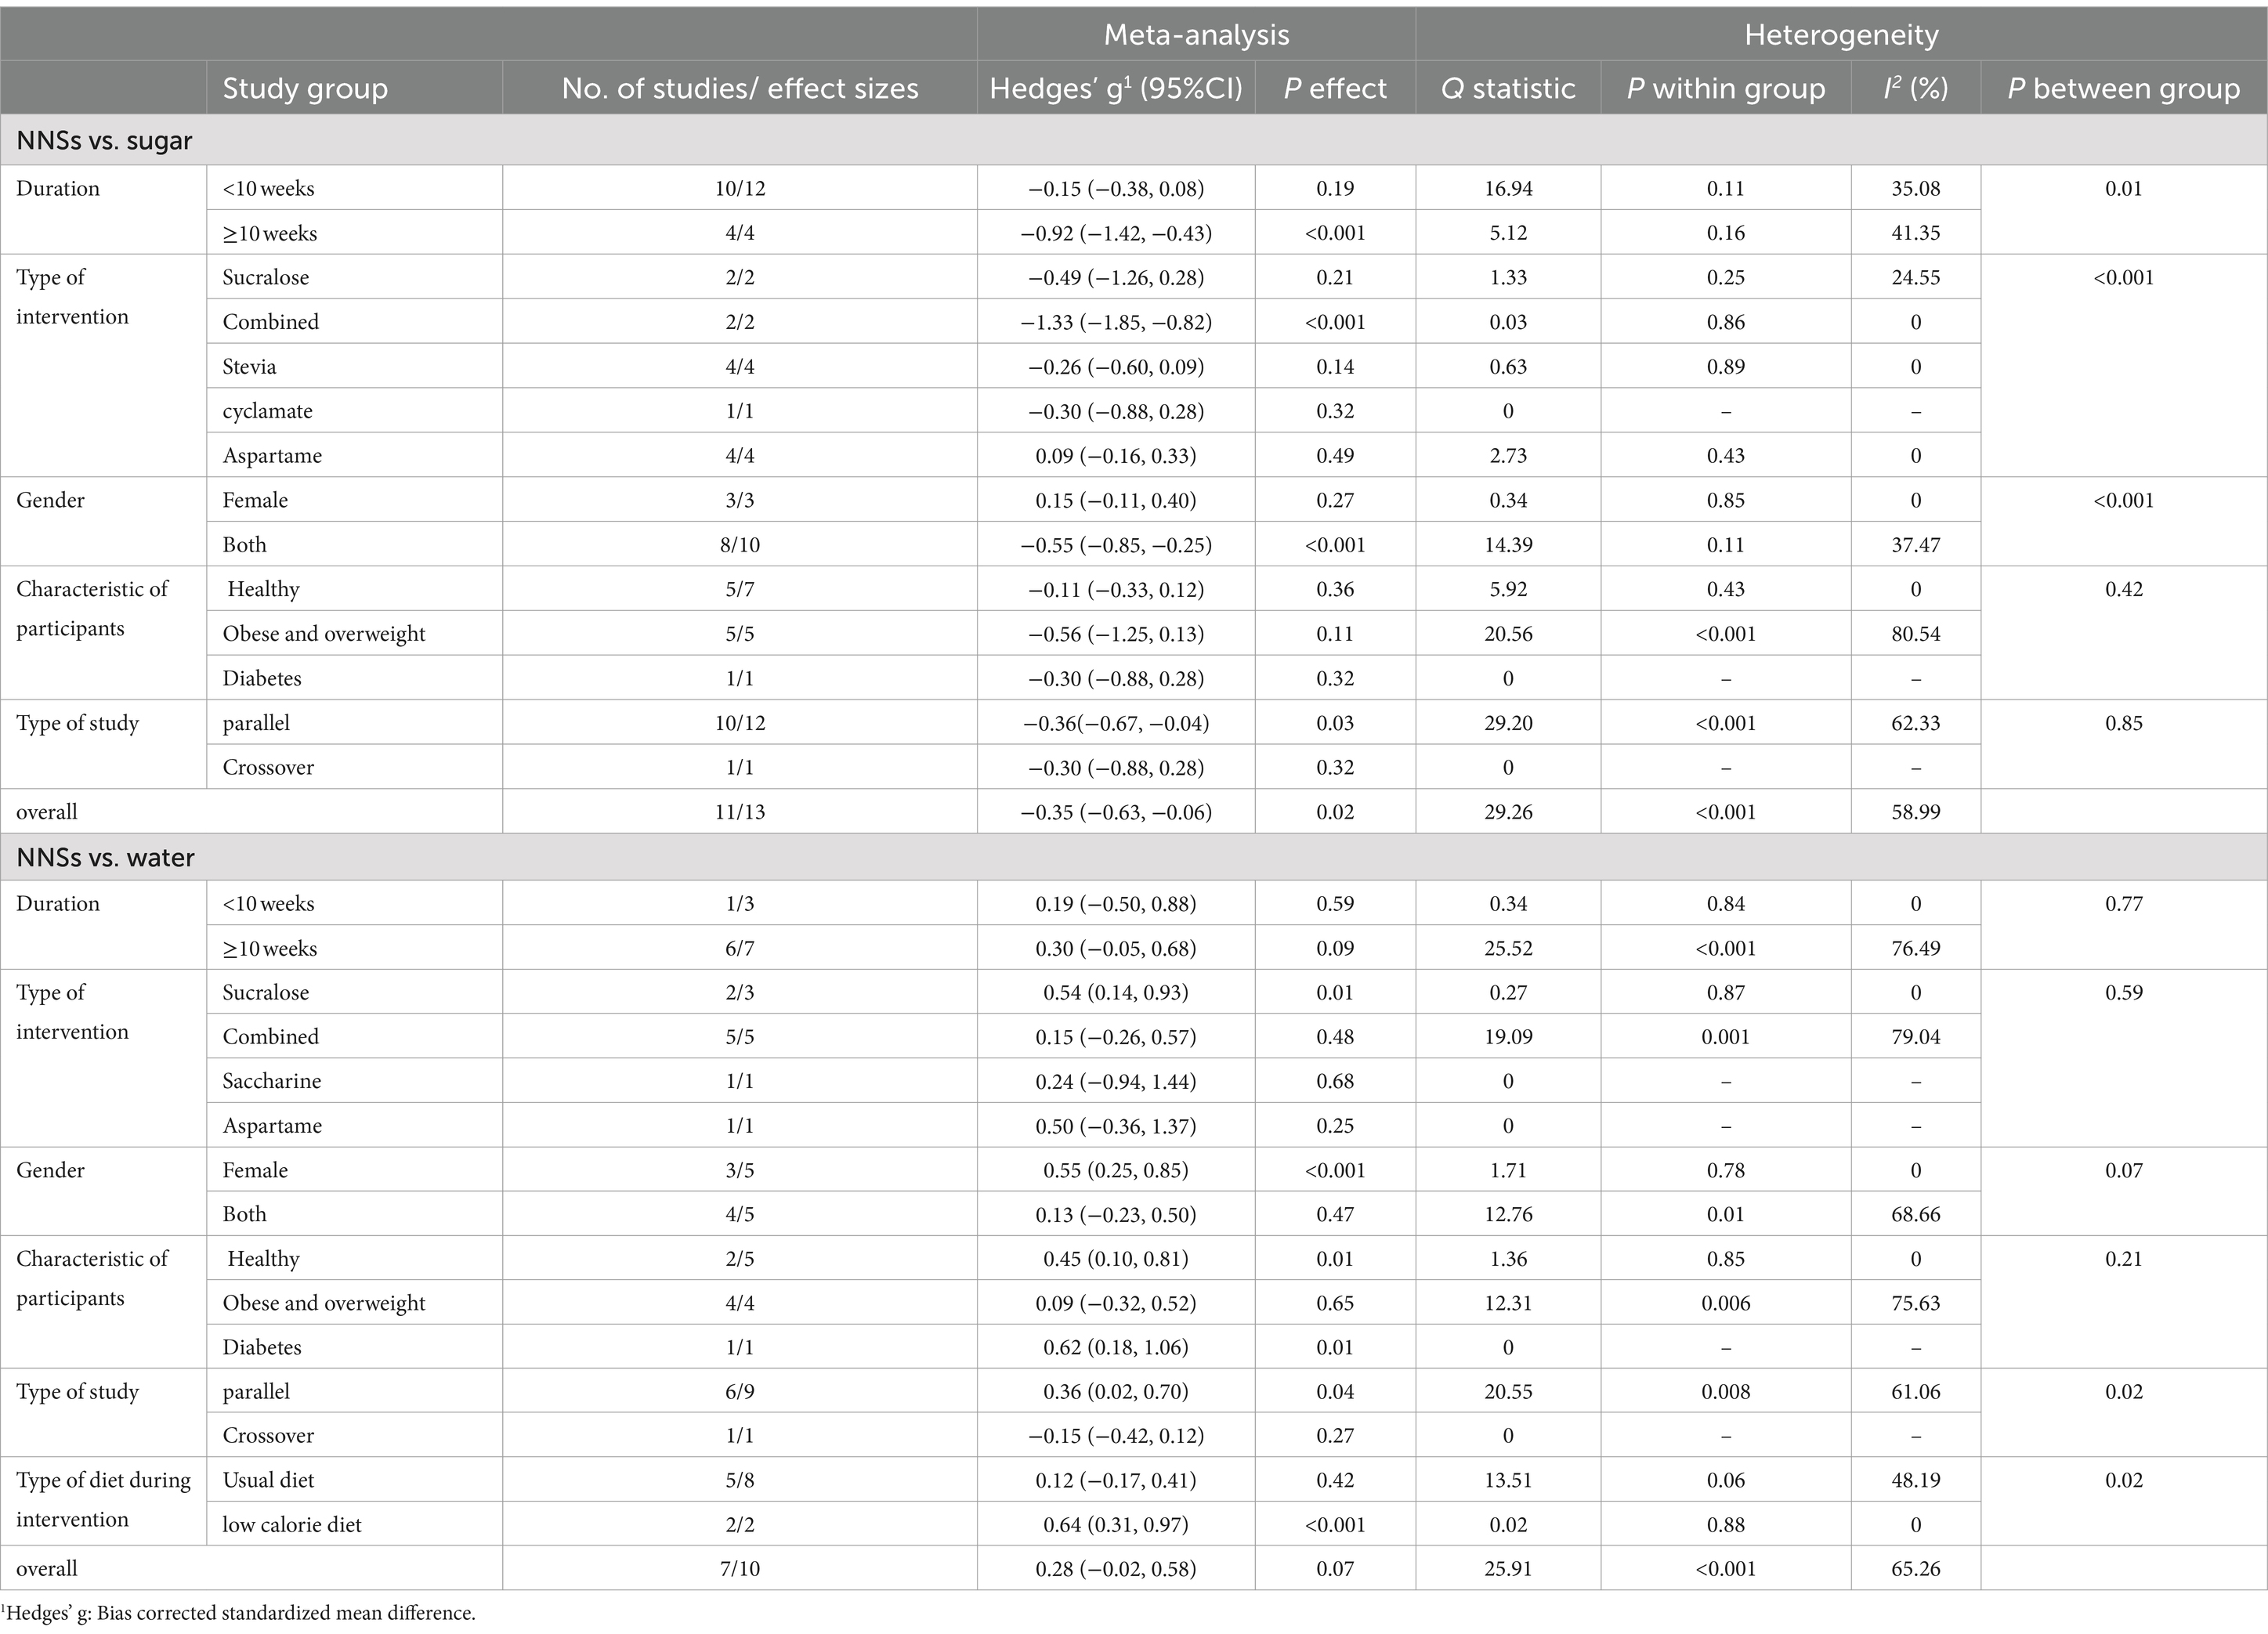
Table 4. Meta-analysis showing the effect of non-nutritive sweeteners consumption on carbohydrate intake based on several subgroups (all analyses were conducted using random effects model).
3.3.3 The effects of NNSs consumption on protein intake
After analyzing the results of 12 studies with 14 effect sizes and 681 participants for NNSs vs. sugar (18, 48, 49, 51, 53, 57–63), and 7 studies (10 effect sizes, 530 participants) for NNSs vs. water (16, 17, 50, 53–56), no significant effect was found on protein intake following NNSs consumption in comparison with both sugar and water intake [Hedges’ g sugar = 0.16, 95% CI: −0.11 to 0.42, I2 = 50.83%] /[Hedges’ g water = 0.00, 95% CI: −0.15 to 0.16, I2 = 0%, Figure 4]. Between-study heterogeneity was observed only for NNSs vs. sugar intake (Q statistic =26.44, Cochrane Q test, p = 0.01, I2 = 50.83%). Subgroup analyses were conducted to find probable source of heterogeneity, but the effect was not significant in any subgroups (Table 5).
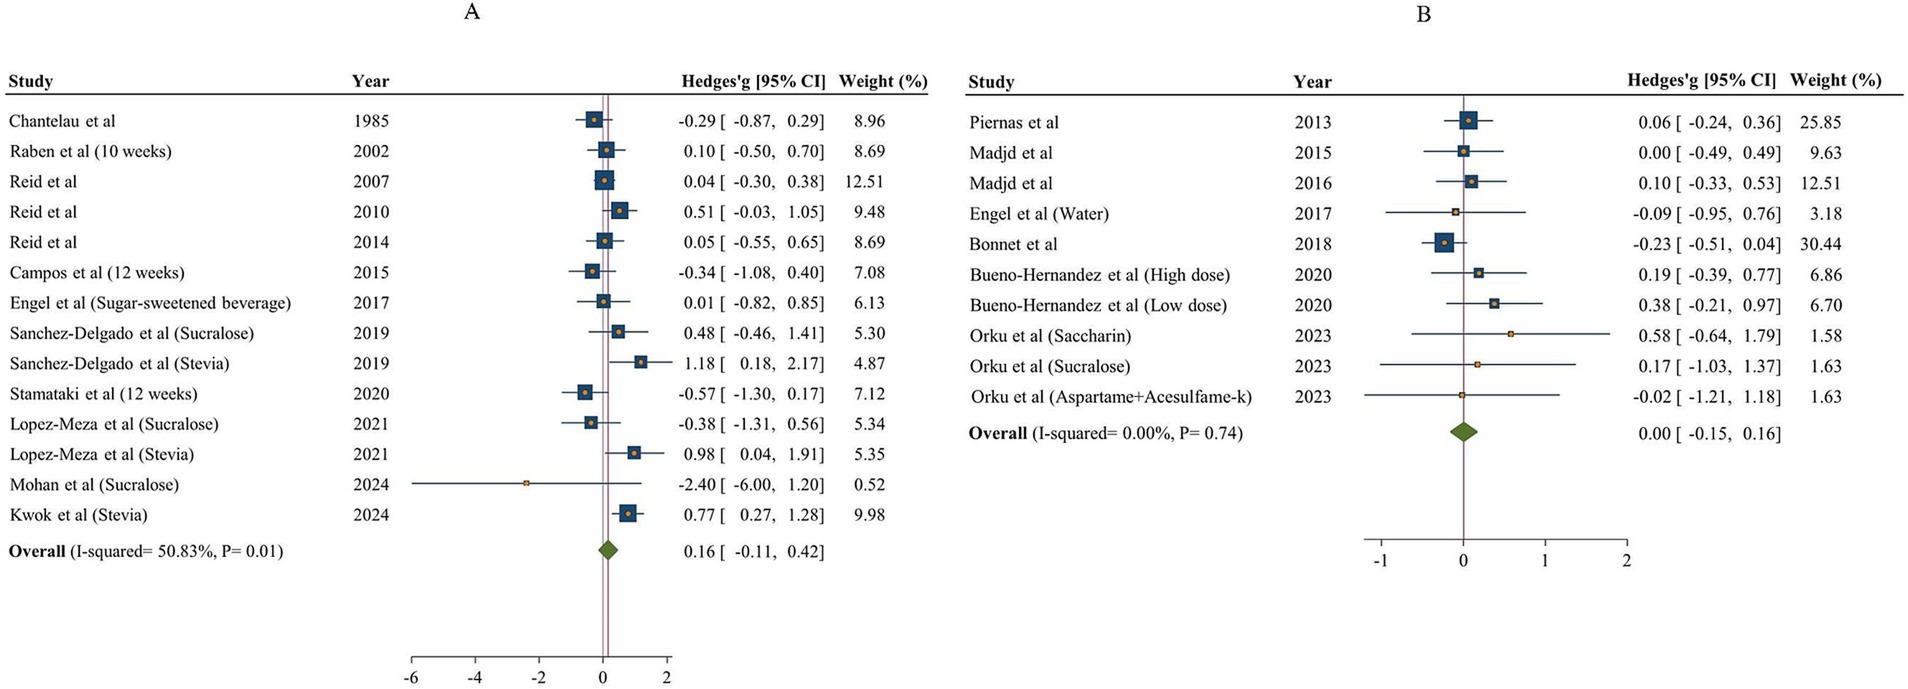
Figure 4. Forest plot showing the effects of NNSs on protein intake compared to sugar (A) and water (B) intake as a control. The analysis was performed using a random effects model.
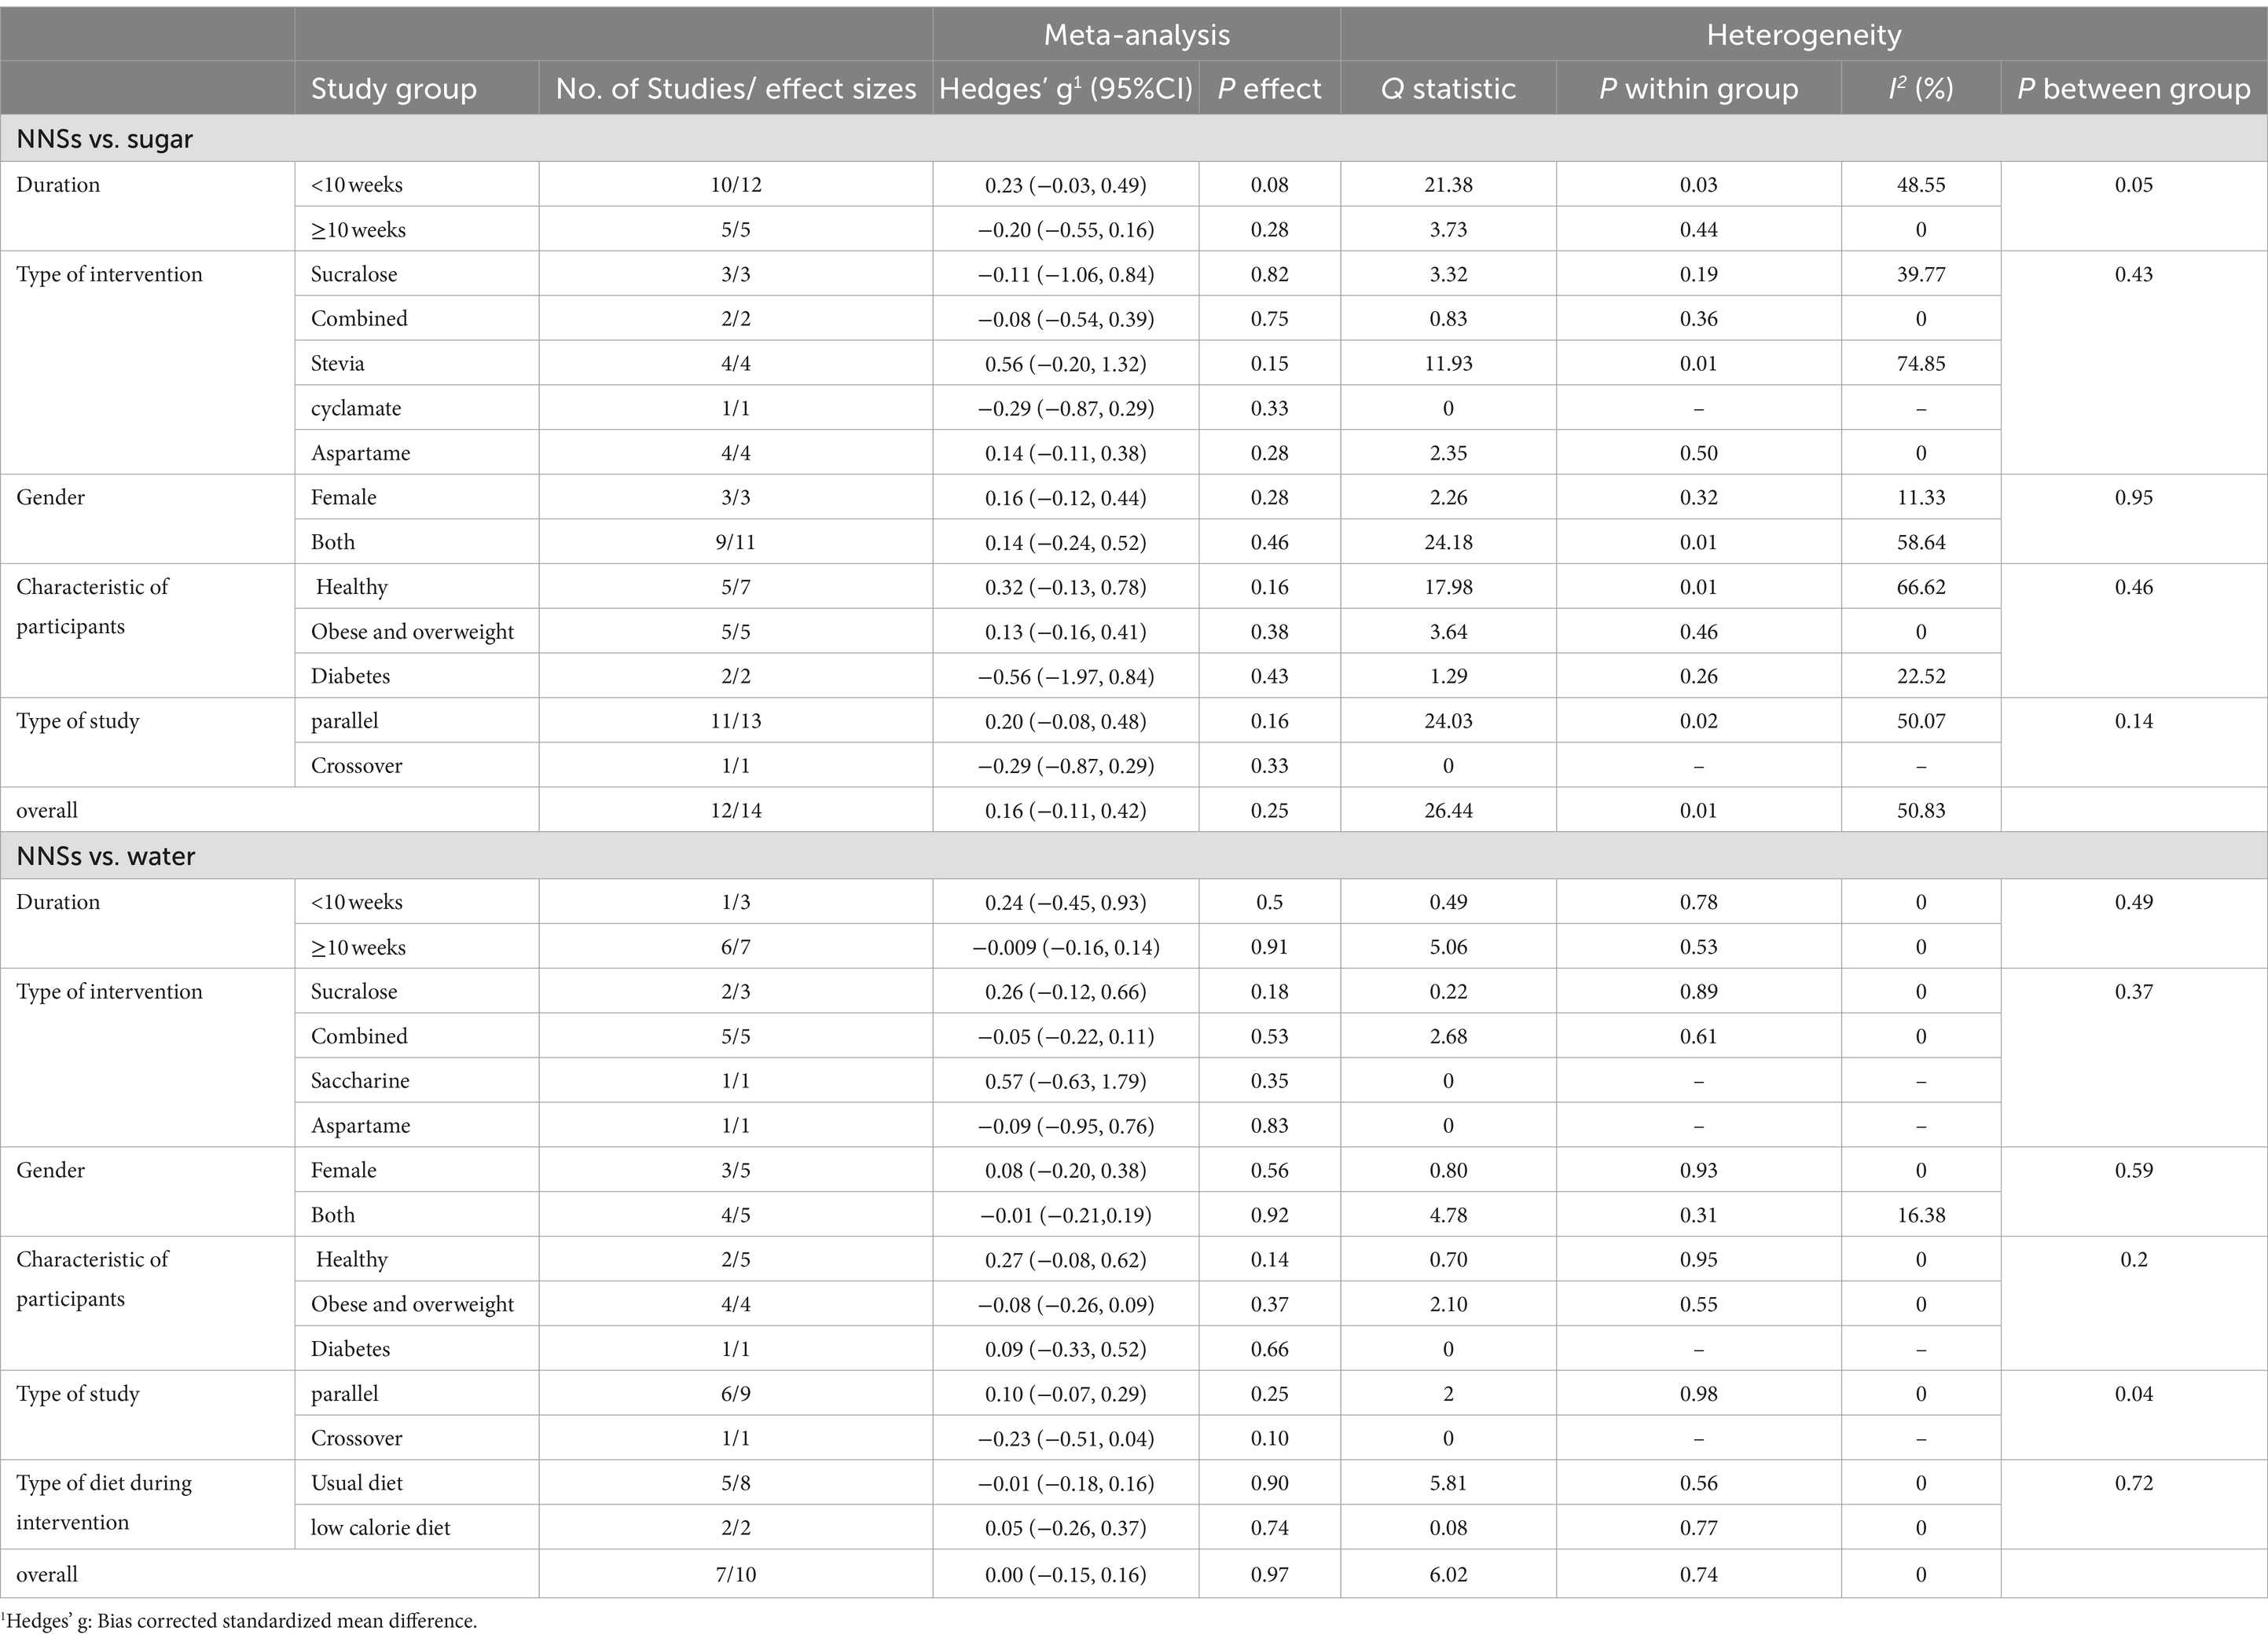
Table 5. Meta-analysis showing the effect of non-nutritive sweeteners consumption on protein intake based on several subgroups (all analyses were conducted using random effects model).
3.3.4 The effect of NNSs consumption on fat intake
The overall result of NNSs consumption on fat intake, based on comparisons with both sugar and water is shown in Figure 5. Totally, 12 articles (14 effect sizes) examined the effects of NNSs intake on fat intake in comparison with sugar (15, 18, 48, 49, 53, 57–63). No significant effect on fat intake was found following NNSs consumption in comparison with sugar [Hedges’ g sugar = 0.08, 95% CI: −0.10 to 0.26, I2 = 8.73%]. Similarly, no significant effect was observed for NNSs vs. water [fat intake change water = 0.20 g/day, 95% CI: −3.48 to 3.88, I2 = 0%]. The between-study heterogeneity was not notable for fat intake in comparisons of NNSs with both sugar and water.
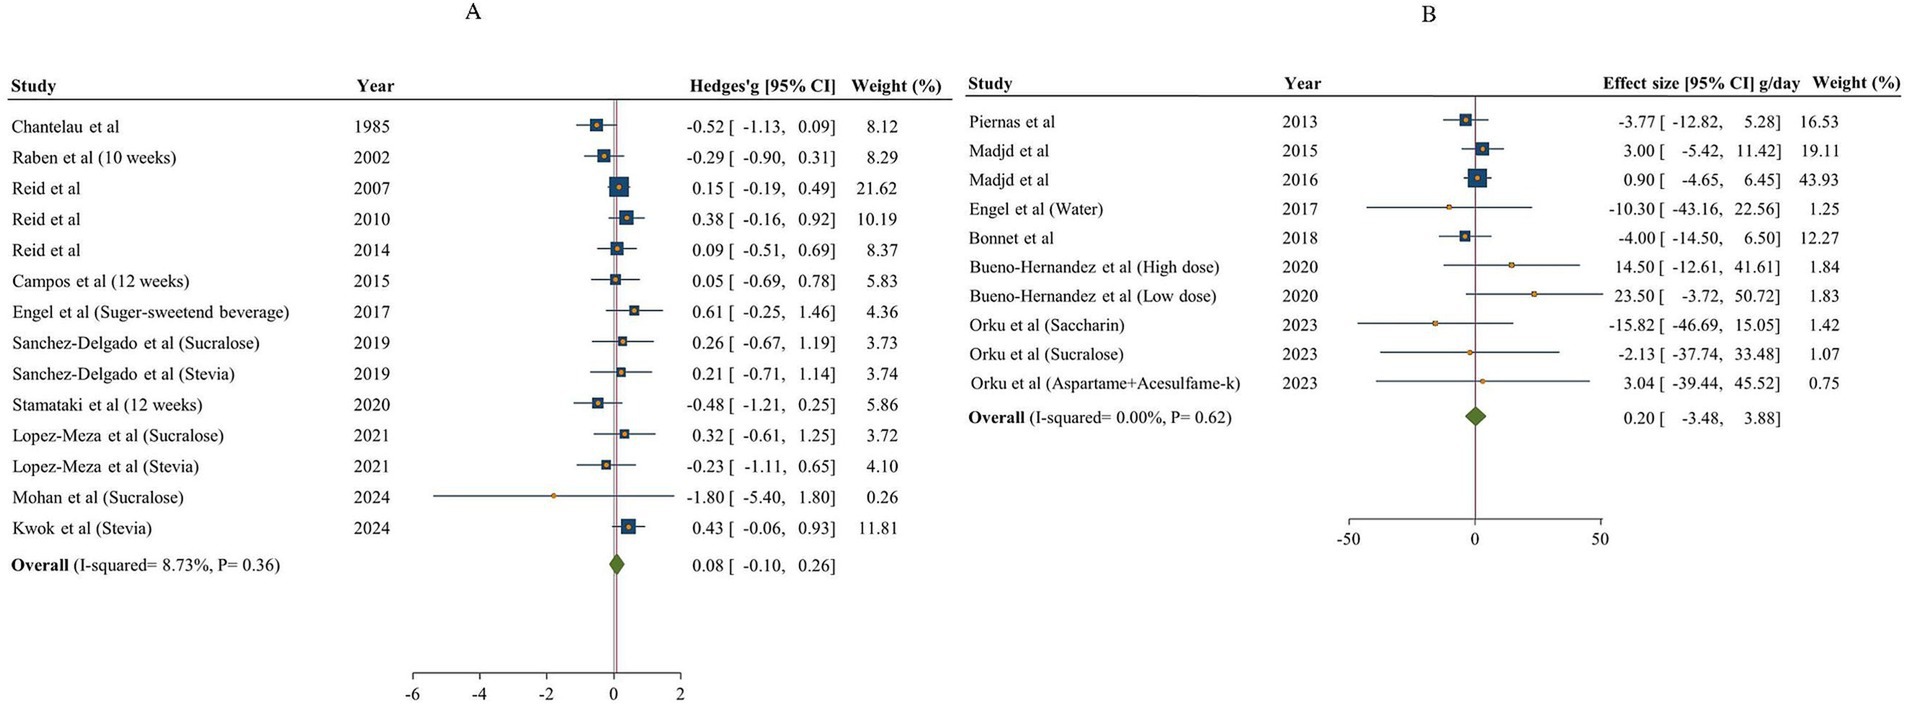
Figure 5. Forest plot showing the effects of NNSs on fat intake compared to sugar (A) and water (B) intake as a control. The analysis was performed using a random effects model.
3.3.5 The effects of NNSs consumption on sugar and fiber intake
The overall findings on the impact of non-nutritive sweeteners (NNSs) on sugar intake, comparing both sugar and water, are illustrated in Figure 6. A total of 8 studies (8 effect sizes and 558 participants) investigated the effects of NNSs on sugar intake compared to sugar (18, 48, 59–64), and 3 studies (3 effect sizes and 339 participants) assessed the effects of NNSs on sugar intake compared to water (17, 54, 64). The results showed a significant reduction in sugar intake when NNSs were consumed instead of sugar (Hedges’ g = −1.78, 95% CI: −2.88 to −0.69, I2 = 95.25%). Conversely, there was no significant effect when comparing NNSs to water (sugar intake change = −6.01 g/day, 95% CI: −15.02 to 3.01, I2 = 24.87%). Additionally, there was notable between-study heterogeneity in sugar intake for NNSs compared to sugar (Q statistic =147.29, Cochrane Q test, p < 0.001, I2 = 95.25%). Type of intervention, duration, characteristics of population, and gender were considered as potential sources of heterogeneity (Table 6).

Figure 6. Forest plot illustrating the effects of NNSs on sugar intake compared to sugar (A) and water (B) intake as a control. The analysis was performed using a random effects model.
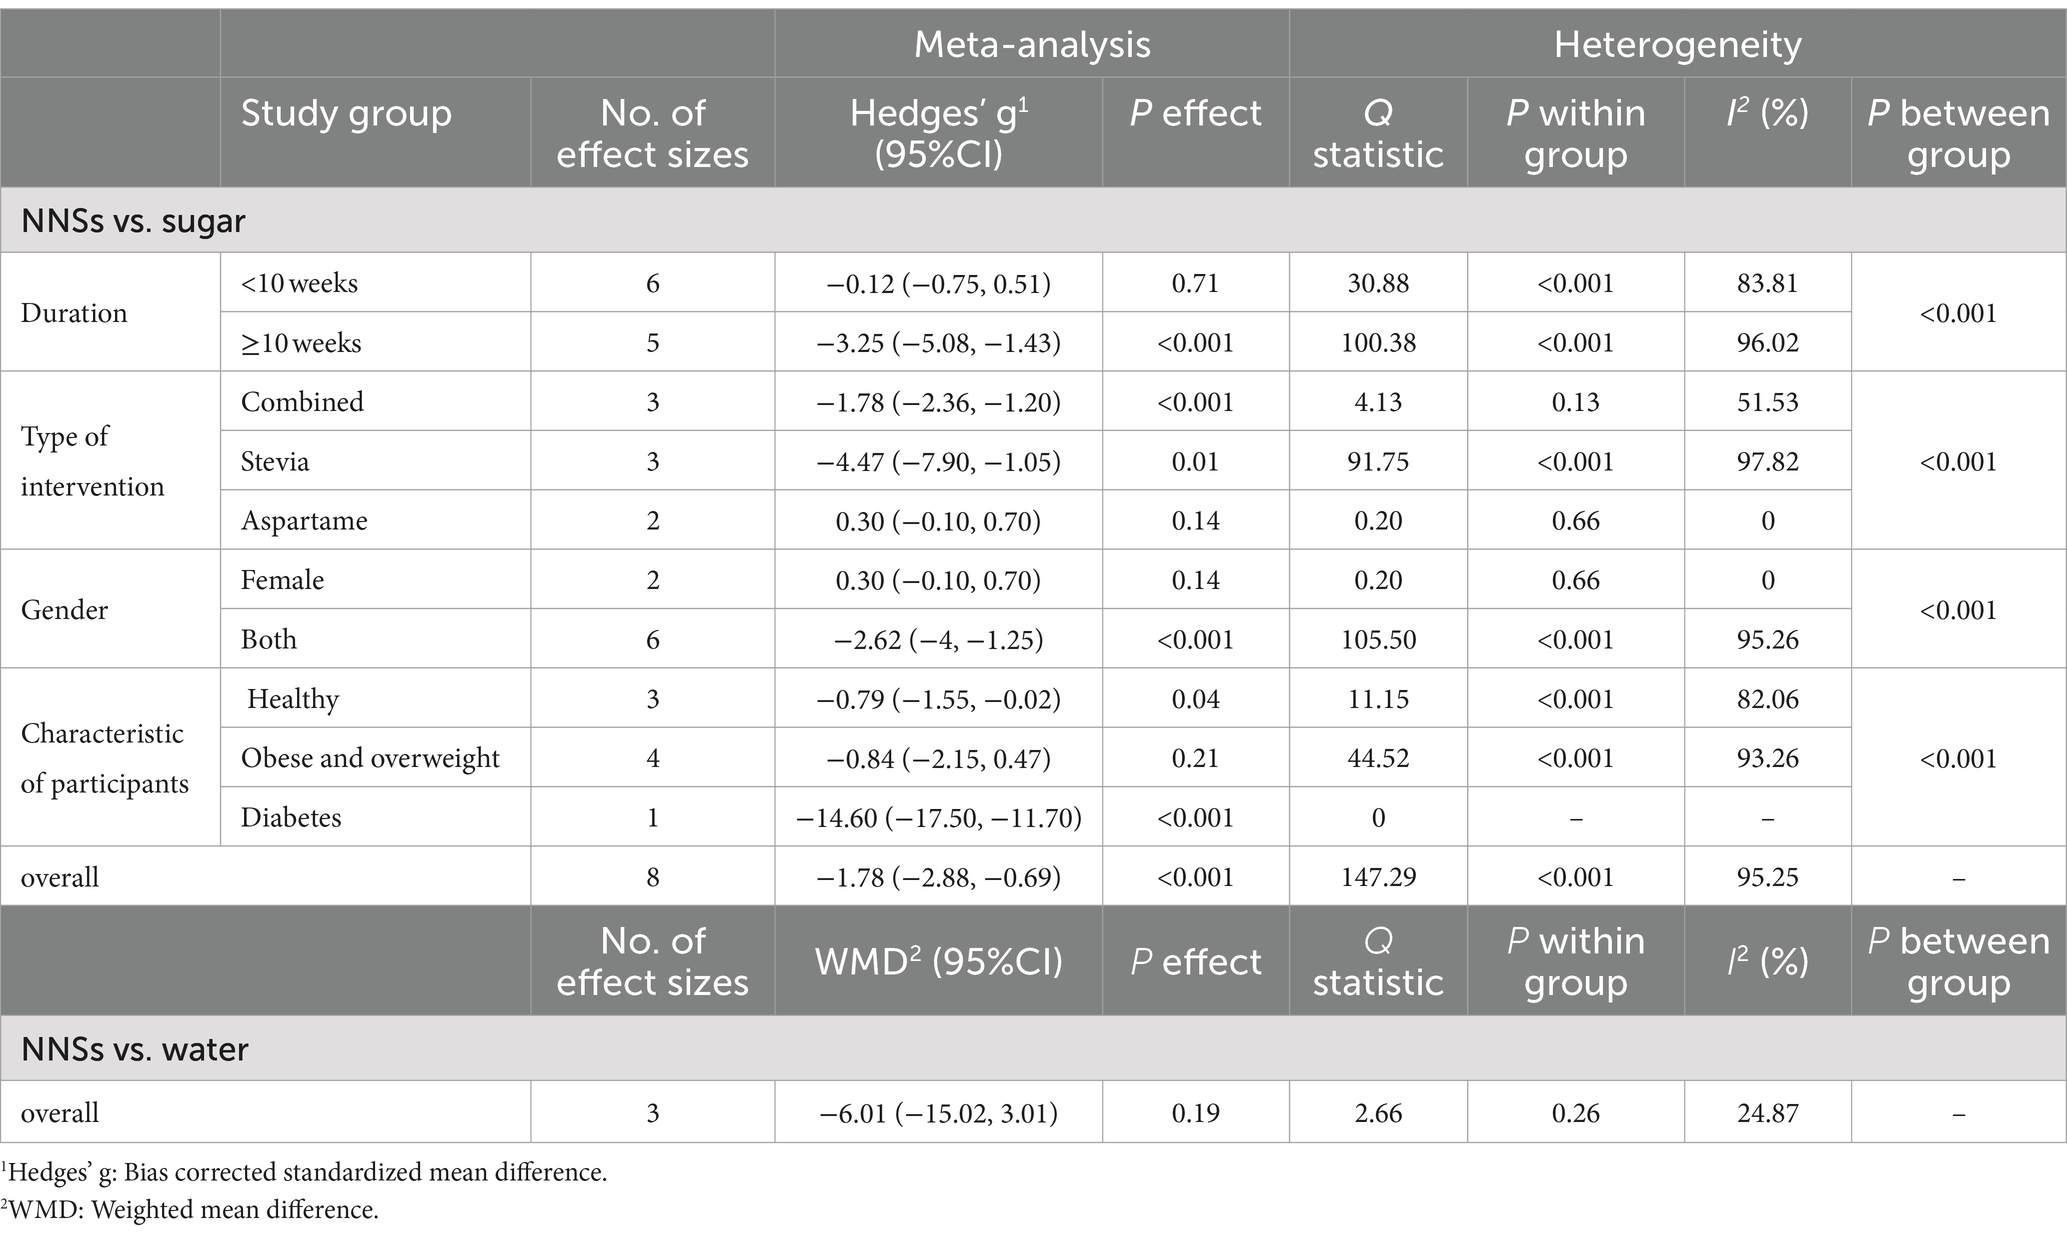
Table 6. Meta-analysis showing the effect of non-nutritive sweeteners consumption on sugar intake based on several subgroups (all analyses were conducted using random effects model).
Five articles (275 participants) provided information on the effects of NNSs on fiber intake (18, 48, 55, 56, 59). The result did not report any significant difference on fiber intake after intervention with NNSs compared to either vs. sugar or water [Hedges’ g sugar = 0.05, 95% CI: −0.28 to 0.39, I2 = 0%/ fiber intake change water = −0.01 g/day, 95% CI: −0.27 to 0.26, I2 = 0%]. Heterogeneity sources were not found on fiber intake.
3.4 Publication bias and sensitivity analysis
Sensitivity analysis revealed that only the overall effect of NNSs vs. sugar on carbohydrate intake changed to non-significant effect after removing the following studies: Raben et al. (48) (Hedges’ g = −0.23; 95% CI: −0.48, 0.01), and Campos et al. (62) (Hedges’ g = −0.26; 95% CI: −0.52, 0.001). No other modification in overall effects was observed after removing each study or studies with a high risk of bias.
Although slight asymmetries were observed in meta-analyses no publication bias was confirmed using asymmetry tests (Begg’s test and Egger’s test, Supplementary Figures 1–11): total energy intake (Begg’s test NNS vs. sugar, p = 0.32/ Begg’s test NNS vs. water, p = 0.64; Egger’s test NNS vs. sugar, p = 0.053/ Egger’s test NNS vs. water, p = 0.44), Carbohydrate intake (Begg’s test NNS vs. sugar, p = 0.07/ Begg’s test NNS vs. water, p = 0.72; Egger’s test NNS vs. sugar, p = 0.03/ Egger’s test NNS vs. water, p = 0.34), Fat intake (Begg’s test NNS vs. sugar, p = 0.66/ Begg’s test NNS vs. water, p = 1; Egger’s test NNS vs. sugar, p = 0.35/ Egger’s test NNS vs. water, p = 0. 86), Protein intake (Begg’s test NNS vs. sugar, p = 1/ Begg’s test NNS vs. water, p = 0.37; Egger’s test NNS vs. sugar, p = 0.48 / Egger’s test NNS vs. water, p = 0.19), Sugar intake (Begg’s test NNS vs. sugar, p = 0.26/Begg’s test NNS vs. water, p = 1; Egger’s test NNS vs. sugar, p = 0.00 /Egger’s test NNS vs. water, p = 0.84). Fiber intake (Begg’s test p = 0.80 / Egger’s test p = 0.73). We utilized the trim and fill method to assess if the publication bias affected the summary effect for carbohydrate and sugar intake, and found that no studies were trimmed. The overall effects remained unchanged, suggesting the absence of publication bias.
3.5 Grading the evidence
The level of confidence after using the GRADE protocol is reported in Table 7. The GRADE assessment for total energy intake vs. sugar was considered as high quality. The level of confidence for carbohydrate intake vs. sugar was evaluated as being moderate due serious limitations in risk of bias and imprecision. However, the evidence relating to other outcomes identified as low due to serious limitations in risk of bias and very serious issues of imprecision.
4 Discussion
This systematic review and meta-analysis were done to observe the effects of NNSs consumption in comparison with sugar and water on long-term total energy, fat, carbohydrate, protein, fiber and sugar intake among adults. Our results support the reduction effect of NNSs consumption on total energy, carbohydrates and sugar intake when NSSs were compared with sugar.
There are several meta-analyses regarding the effects of NNSs on energy intake. In a meta-analysis by Santos et al. (66), it was reported that aspartame consumption had no significant effect on energy intake compared to both sucrose or control. Also, the findings from the subgroup analysis in our study showed that aspartame consumption was not associated with a significant alteration in energy intake compared to sugar or water as a control.
In another meta-analysis of 25 RCTs performed by Montez et al. (67) on adults and children for periods longer than 7 days, a notable decrease in daily energy consumption was shown in individuals using NNSs. Also, in agreement with our result, in the investigation conducted by Rogers et al. (19), encompassing both parallel and cross-over studies with a minimum duration of 1 week, a significant reduction in body weight and energy intake was indicated after low-calorie sweeteners (LCS) consumption vs. sugar. However, this significant effect was not observed in the consumption of NNSs compared to water.
Toews et al. (20) conducted a meta-analysis of four randomized controlled trials (RCTs) consisted a healthy population of both children and adults. The results demonstrated a statistically significant reduction in mean daily caloric intake by approximately 250 kcal in individuals ingesting non-nutritive sweeteners (NNSs) as opposed to those ingesting sucrose. The results of this study are consistent with our study, with the difference that our study was conducted only on the adult population and considering a larger number of articles compared to the study by Toews et al. Existing meta-analyses rarely reached definitive conclusions and mostly examined energy as a secondary factor. In the present meta-analysis, we tried to find all RCT articles related to artificial sweeteners through a comprehensive search. The full text of all related articles was assessed to get the useful results of our opinion. Also, in this study, we examined the effects of NNSs not only on total energy intake but also on the intake of macronutrients, fiber, and sugar. NNSs may have physiological function, affecting nutrition and metabolism in different ways (68). The mechanism of NNSs on energy metabolism is not completely clear, and there are differing opinions on the effect of non-nutritive sweeteners on the energy. The published findings showed that an NNSs pre-load results in energy compensation for the day without leading to overcompensation (38).
The results of current analysis showed that the consumption of non-nutritive sweeteners compared to sugar can lead to a decrease in total energy intake. Supporting our findings, Mohan et al. (63) discovered that consuming sucralose instead of sugar can lead to a reduction in energy intake after a 12-week intervention period. However, the results of this study did not observe any significant effect of sucralose on HbA1c (63). Madjd et al.’s study suggested that substituting diet beverages (DBs) with water after the main meal in obese women with type 2 diabetes may result in greater weight loss during a weight reduction program (55). A network meta-analysis of 36 acute single exposure studies found that NNS beverages can be a suitable alternative to sugar-sweetened beverages (SSBs) in the short-term period after meals (69). A meta-analysis of 29 randomized controlled trials (RCTs), involving 741 participants, investigated the glycemic effects of four non-nutritive sweeteners (NNSs) including saccharin, aspartame, sucralose, and stevia (70), resulting that consuming NNSs did not alter blood glucose levels (70).
The present meta-analysis has certain limitations that should be mentioned. First, according to the Cochrane risk-of-bias tool for randomized trials (RoB2), most of our studies had some concerns, indicating a need for high-quality studies. Second, substantial heterogeneity was observed among studies evaluating the effect of NNS on sugar intake, total energy and carbohydrate intake vs. sugar. Our study also had strengths worth mentioning. We performed a robust and comprehensive search. Also, we examined all types NNSs and compared them in different subgroups. The GRADE assessment was done to better evaluate the quality of the entered articles. Since most evidence suggests that NNSs have no short-term effects on energy intake, we focused on studies examining long-term effects (greater than 4 weeks). Additionally, we examined the effect of NNS consumption on individual macronutrient intake, not just energy intake. In conclusion, the results of the current study suggested that NNSs consumption may be effective in reducing total energy, carbohydrates, and sugar intake vs. sugar. High quality randomized controlled clinical trials are essential to validate our results.
Data availability statement
Publicly available datasets were analyzed in this study. This data can be found here: Information about the data and analysis performed in the present study is available from the corresponding author upon reasonable request.
Author contributions
KR: Investigation, Methodology, Writing – original draft. FM: Data curation, Formal analysis, Investigation, Methodology, Project administration, Writing – review & editing. AN: Investigation, Methodology, Writing – review & editing. BS: Investigation, Methodology, Writing – review & editing. AS-A: Formal analysis, Investigation, Methodology, Project administration, Writing – review & editing.
Funding
The author(s) declare that financial support was received for the research, authorship, and/or publication of this article. This work was supported by the Swiss National Science Foundation (Project scheme: SPIRIT, grant number: SNSF IZSTZ0_190277, http://p3.snf.ch/project-190277). Also, we would like to appreciate the Food Hygiene and Safety research center, Shahid Sadoughi University of Medical Sciences for their scientific support. The funding sources had no role in the design of this study or decision to publish results.
Conflict of interest
The authors declare that the research was conducted in the absence of any commercial or financial relationships that could be construed as a potential conflict of interest.
Publisher’s note
All claims expressed in this article are solely those of the authors and do not necessarily represent those of their affiliated organizations, or those of the publisher, the editors and the reviewers. Any product that may be evaluated in this article, or claim that may be made by its manufacturer, is not guaranteed or endorsed by the publisher.
Supplementary material
The Supplementary material for this article can be found online at: https://www.frontiersin.org/articles/10.3389/fnut.2024.1475962/full#supplementary-material
References
1. Skidmore, P, and Yarnell, J. The obesity epidemic: prospects for prevention. QJM. (2004) 97:817–25. doi: 10.1093/qjmed/hch136
2. Ford, ND, Patel, SA, and Narayan, KV. Obesity in low-and middle-income countries: burden, drivers, and emerging challenges. Annu Rev Public Health. (2017) 38:145–64. doi: 10.1146/annurev-publhealth-031816-044604
5. Alcaraz, A, Pichon-Riviere, A, Palacios, A, Bardach, A, Balan, DJ, Perelli, L, et al. Sugar sweetened beverages attributable disease burden and the potential impact of policy interventions: a systematic review of epidemiological and decision models. BMC Public Health. (2021) 21:1–11. doi: 10.1186/s12889-021-11046-7
6. Hill, JO, Wyatt, HR, and Peters, JC. Energy balance and obesity. Circulation. (2012) 126:126–32. doi: 10.1161/circulationaha.111.087213
7. Malik, VS, Popkin, BM, Bray, GA, Després, J-P, and Hu, FB. Sugar-sweetened beverages, obesity, type 2 diabetes mellitus, and cardiovascular disease risk. Circulation. (2010) 121:1356–64. doi: 10.1161/CIRCULATIONAHA.109.876185
8. Paglia, L. The sweet danger of added sugars. Eur J Paediatr Dent. (2019) 20:89. doi: 10.23804/ejpd.2019.20.02.01
9. Kaartinen, NE, Similä, ME, Kanerva, N, Valsta, LM, Harald, K, and Männistö, S. Naturally occurring and added sugar in relation to macronutrient intake and food consumption: results from a population-based study in adults. J Nutrit Sci. (2017) 6:e7. doi: 10.1017/jns.2017.3
10. Louie, JCY, and Tapsell, LC. Association between intake of Total vs added sugar on diet quality: a systematic review. Nutr Rev. (2015) 73:837–57. doi: 10.1093/nutrit/nuv044
11. Organization WH. Guideline: Sugars intake for adults and children. World Health Organization (2015).
12. Mattes, RD, and Popkin, BM. Nonnutritive sweetener consumption in humans: effects on appetite and food intake and their putative mechanisms. Am J Clin Nutr. (2009) 89:1–14. doi: 10.3945/ajcn.2008.26792
13. Sylvetsky, AC, Jin, Y, Clark, EJ, Welsh, JA, Rother, KI, and Talegawkar, SA. Consumption of low-calorie sweeteners among children and adults in the United States. J Academy of Nutr Diet. (2017) 117:441–448.e2. doi: 10.1016/j.jand.2016.11.004
14. Administration USFAD. Aspartame and other sweeteners in food. (2023). Available from: https://www.fda.gov/food/food-additives-petitions/aspartame-and-other-sweeteners-food (Accessed October 31, 2024).
15. Safety Evaluation of Certain Contaminants in Food. Prepared by the sixty-fourth meeting of the joint Fao/who expert committee on food additives (Jecfa). FAO Food Nutr Pap. (2006) 82:1–778.
16. Orku, SE, Suyen, G, and Bas, M. The effect of regular consumption of four low-or no-calorie sweeteners on glycemic response in healthy women: a randomized controlled trial. Nutrition. (2023) 106:111885. doi: 10.1016/j.nut.2022.111885
17. Piernas, C, Tate, DF, Wang, X, and Popkin, BM. Does diet-beverage intake affect dietary consumption patterns? Results from the choose healthy options consciously everyday (choice) randomized clinical trial. Am J Clin Nutr. (2013) 97:604–11. doi: 10.3945/ajcn.112.048405
18. Stamataki, NS, Crooks, B, Ahmed, A, and McLaughlin, JT. Effects of the daily consumption of Stevia on glucose homeostasis, body weight, and energy intake: a randomised open-label 12-week trial in healthy adults. Nutrients. (2020) 12:3049. doi: 10.3390/nu12103049
19. Rogers, PJ, and Appleton, KM. The effects of low-calorie sweeteners on energy intake and body weight: a systematic review and Meta-analyses of sustained intervention studies. Int J Obes. (2021) 45:464–78. doi: 10.1038/s41366-020-00704-2
20. Toews, I, Lohner, S, de Gaudry, DK, Sommer, H, and Meerpohl, JJ. Association between intake of non-sugar sweeteners and health outcomes: systematic review and Meta-analyses of randomised and non-randomised controlled trials and observational studies. BMJ. (2019) 364:k4718. doi: 10.1136/bmj.k4718
21. Swithers, SE. Not-so-healthy sugar substitutes? Curr Opin Behav Sci. (2016) 9:106–10. doi: 10.1016/j.cobeha.2016.03.003
22. Swithers, SE, Martin, AA, and Davidson, TL. High-intensity sweeteners and energy balance. Physiol Behav. (2010) 100:55–62. doi: 10.1016/j.physbeh.2009.12.021
23. Ludwig, DS. Artificially sweetened beverages: cause for concern. JAMA. (2009) 302:2477–8. doi: 10.1001/jama.2009.1822
24. Yang, Q. Gain weight by “going diet?” artificial sweeteners and the neurobiology of sugar cravings: neuroscience 2010. Yale J Biol Med. (2010) 83:101–8.
25. Page, MJ, McKenzie, JE, Bossuyt, PM, Boutron, I, Hoffmann, TC, Mulrow, CD, et al. The PRISMA 2020 statement: an updated guideline for reporting systematic reviews. BMJ. (2021) 372:n71. doi: 10.1136/bmj.n71
26. Higgins, JP, Savović, J, Page, MJ, Elbers, RG, and Sterne, JA. Assessing risk of Bias in a randomized trial. Cochrane Handbook for Systematic Rev Interventions. (2019):205–28. doi: 10.1002/9781119536604.ch8
27. Borenstein, M, Hedges, LV, Higgins, JP, and Rothstein, HR. Introduction to Meta-analysis. Chichester, United Kingdom: John Wiley & Sons (2021).
28. Higgins, JPT TJ, Chandler, J, Cumpston, M, Li, T, Page, MJ, and Welch, VA (editors). Cochrane handbook for systematic reviews of interventions version 6.5 (updated august 2024). (2024). Available from: https://training.cochrane.org/handbook (Accessed August 22, 2024).
29. Higgins, JP, and Thompson, SG. Quantifying heterogeneity in a Meta-analysis. Stat Med. (2002) 21:1539–58. doi: 10.1002/sim.1186
30. Guyatt, G, Oxman, AD, Akl, EA, Kunz, R, Vist, G, Brozek, J, et al. 1. Introduction-Grade evidence profiles and summary of findings tables. J Clin Epidemiol. (2011) 64:383–94. doi: 10.1016/j.jclinepi.2010.04.026
31. Guyatt, GH, Oxman, AD, Vist, GE, Kunz, R, Falck-Ytter, Y, Alonso-Coello, P, et al. Grade: An emerging consensus on rating quality of evidence and strength of recommendations. BMJ. (2008) 336:924–6. doi: 10.1136/bmj.39489.470347.AD
32. Katan, MB, De Ruyter, JC, Kuijper, LD, Chow, CC, Hall, KD, and Olthof, MR. Impact of masked replacement of sugar-sweetened with sugar-free beverages on body weight increases with initial BMI: secondary analysis of data from an 18 month double–blind trial in children. PLoS One. (2016) 11:e0159771. doi: 10.1371/journal.pone.0159771
33. Sylvetsky, AC, Moore, HR, Zhu, X, Kaidbey, JH, Kang, L, Saeed, A, et al. Effects of low-calorie sweetener restriction on glycemic variability and Cardiometabolic health in children with type 1 diabetes: findings of a pilot and feasibility study. Nutrients. (2023) 15:3867. doi: 10.3390/nu15183867
34. Chern, C, and Tan, S-Y. Energy expenditure, carbohydrate oxidation and appetitive responses to sucrose or sucralose in humans: a pilot study. Nutrients. (2019) 11:1782. doi: 10.3390/nu11081782
35. Gadah, NS, Brunstrom, JM, and Rogers, PJ. Cross-over studies underestimate energy compensation: the example of sucrose-versus sucralose-containing drinks. Appetite. (2016) 107:398–405. doi: 10.1016/j.appet.2016.08.113
36. Tordoff, MG, and Alleva, AM. Effect of drinking soda sweetened with aspartame or high-fructose corn syrup on food intake and body weight. Am J Clin Nutr. (1990) 51:963–9. doi: 10.1093/ajcn/51.6.963
37. Ranawana, D, and Henry, C. Are caloric beverages compensated for in the short-term by young adults? An investigation with particular focus on gender differences. Appetite. (2010) 55:137–46. doi: 10.1016/j.appet.2010.05.046
38. Tey, S, Salleh, N, Henry, J, and Forde, C. Effects of aspartame-, monk fruit-, Stevia-and sucrose-sweetened beverages on postprandial glucose, insulin and energy intake. Int J Obes. (2017) 41:450–7. doi: 10.1038/ijo.2016.225
39. Reid, M, and Hammersley, R. The effects of sucrose on everyday eating in Normal weight men and women. Appetite. (1994) 22:221–32. doi: 10.1006/appe.1994.1021
40. Rodin, J. Comparative effects of fructose, aspartame, glucose, and water preloads on calorie and macronutrient intake. Am J Clin Nutr. (1990) 51:428–35. doi: 10.1093/ajcn/51.3.428
41. King, NA, Appleton, K, Rogers, PJ, and Blundell, JE. Effects of sweetness and energy in drinks on food intake following exercise. Physiol Behav. (1999) 66:375–9. doi: 10.1016/S0031-9384(98)00280-7
42. Black, RM, Leiter, LA, and Anderson, GH. Consuming aspartame with and without taste: differential effects on appetite and food intake of young adult males. Physiol Behav. (1993) 53:459–66. doi: 10.1016/0031-9384(93)90139-7
43. Fantino, M, Fantino, A, Matray, M, and Mistretta, F. Beverages containing low energy sweeteners do not differ from water in their effects on appetite, energy intake and food choices in healthy, non-obese French adults. Appetite. (2018) 125:557–65. doi: 10.1016/j.appet.2018.03.007
44. Van Wymelbeke, V, Beridot-Therond, M, de La Gueronniere, V, and Fantino, M. Influence of repeated consumption of beverages containing sucrose or intense sweeteners on food intake. Eur J Clin Nutr. (2004) 58:154–61. doi: 10.1038/sj.ejcn.1601762
45. Farhat, G, Berset, V, and Moore, L. Effects of Stevia extract on postprandial glucose response, satiety and energy intake: a three-arm crossover trial. Nutrients. (2019) 11:3036. doi: 10.3390/nu11123036
46. Gibbons, C, Beaulieu, K, Almiron-Roig, E, Navas-Carretero, S, Martínez, JA, O'Hara, B, et al. Acute and two-week effects of Neotame, Stevia Rebaudioside M and sucrose-sweetened biscuits on postprandial appetite and endocrine response in adults with overweight/obesity-a randomised crossover trial from the sweet consortium. EBioMedicine. (2024) 102:105005. doi: 10.1016/j.ebiom.2024.105005
47. Sørensen, LB, Raben, A, Stender, S, and Astrup, A. Effect of sucrose on inflammatory markers in overweight humans–. Am J Clin Nutr. (2005) 82:421–7. doi: 10.1093/ajcn/82.2.421
48. Raben, A, Vasilaras, TH, Møller, AC, and Astrup, A. Sucrose compared with artificial sweeteners: different effects on ad libitum food intake and body weight after 10 Wk of supplementation in overweight subjects. Am J Clin Nutr. (2002) 76:721–9. doi: 10.1093/ajcn/76.4.721
49. López-Meza, MS, Otero-Ojeda, G, Estrada, JA, Esquivel-Hernández, FJ, and Contreras, I. The impact of nutritive and non-nutritive sweeteners on the central nervous system: preliminary study. Nutr Neurosci. (2022) 25:1623–32. doi: 10.1080/1028415X.2021.1885239
50. Bueno-Hernández, N, Esquivel-Velázquez, M, Alcántara-Suárez, R, Gómez-Arauz, AY, Espinosa-Flores, AJ, de León-Barrera, KL, et al. Chronic sucralose consumption induces elevation of serum insulin in young healthy adults: a randomized, double blind. Controlled Trial Nutrition J. (2020) 19:1–12. doi: 10.1186/s12937-020-00549-5
51. Sánchez-Delgado, M, Estrada, JA, Paredes-Cervantes, V, Kaufer-Horwitz, M, and Contreras, I. Changes in nutrient and calorie intake, adipose mass, triglycerides and TNF-α concentrations after non-caloric sweetener intake: A pilot study. Int J Vitam Nutr Res. (2021) 91:87–98. doi: 10.1024/0300-9831/a000611
52. Higgins, KA, and Mattes, RD. A randomized controlled trial contrasting the effects of 4 low-calorie sweeteners and sucrose on body weight in adults with overweight or obesity. Am J Clin Nutr. (2019) 109:1288–301. doi: 10.1093/ajcn/nqy381
53. Engel, S, Tholstrup, T, Bruun, JM, Astrup, A, Richelsen, B, and Raben, A. Effect of high Milk and sugar-sweetened and non-caloric soft drink intake on insulin sensitivity after 6 months in overweight and obese adults: a randomized controlled trial. Eur J Clin Nutr. (2018) 72:358–66. doi: 10.1038/s41430-017-0006-9
54. Bonnet, F, Tavenard, A, Esvan, M, Laviolle, B, Viltard, M, Lepicard, EM, et al. Consumption of a carbonated beverage with high-intensity sweeteners has no effect on insulin sensitivity and secretion in nondiabetic adults. J Nutr. (2018) 148:1293–9. doi: 10.1093/jn/nxy100
55. Madjd, A, Taylor, MA, Delavari, A, Malekzadeh, R, Macdonald, IA, and Farshchi, HR. Beneficial effects of replacing diet beverages with water on type 2 diabetic obese women following a hypo-energetic diet: a randomized, 24-week clinical trial. Diabetes Obes Metab. (2017) 19:125–32. doi: 10.1111/dom.12793
56. Madjd, A, Taylor, MA, Delavari, A, Malekzadeh, R, Macdonald, IA, and Farshchi, HR. Effects on weight loss in adults of replacing diet beverages with water during a Hypoenergetic diet: a randomized, 24-Wk clinical trial. Am J Clin Nutr. (2015) 102:1305–12. doi: 10.3945/ajcn.115.109397
57. Reid, M, Hammersley, R, Hill, AJ, and Skidmore, P. Long-term dietary compensation for added sugar: effects of supplementary sucrose drinks over a 4-week period. Br J Nutr. (2007) 97:193–203. doi: 10.1017/S0007114507252705
58. Chantelau, E, Gösseringer, G, Sonnenberg, G, and Berger, M. Moderate intake of sucrose does not impair metabolic control in pump-treated diabetic out-patients. Diabetologia. (1985) 28:204–7. doi: 10.1007/BF00282233
59. Kwok, D, Scott, C, Strom, N, Au-Yeung, F, Lam, C, Chakrabarti, A, et al. Comparison of a daily Steviol glycoside beverage compared with a sucrose beverage for four weeks on gut microbiome in healthy adults (2024) 154:1298–308. doi: 10.1016/j.tjnut.2024.01.032
60. Reid, M, Hammersley, R, and Duffy, M. Effects of sucrose drinks on macronutrient intake, body weight, and mood state in overweight women over 4 weeks. Appetite. (2010) 55:130–6. doi: 10.1016/j.appet.2010.05.001
61. Reid, M, Hammersley, R, Duffy, M, and Ballantyne, C. Effects on obese women of the sugar sucrose added to the diet over 28 D: a quasi-randomised, single-blind, Controlled Trial. Br J Nutr. (2014) 111:563–70. doi: 10.1017/S0007114513002687
62. Campos, V, Despland, C, Brandejsky, V, Kreis, R, Schneiter, P, Chiolero, A, et al. Sugar-and artificially sweetened beverages and intrahepatic fat: a randomized controlled trial. Obesity. (2015) 23:2335–9. doi: 10.1002/oby.21310
63. Mohan, V, Manasa, VS, Abirami, K, Unnikrishnan, R, Gayathri, R, Geetha, G, et al. Effect of replacing sucrose in beverages with nonnutritive sweetener sucralose on Cardiometabolic risk factors among Asian Indian adults with type 2 diabetes: a 12-week randomized controlled trial. Diabetes Therapy. (2024) 15:2061–77. doi: 10.1007/s13300-024-01622-6
64. Ebbeling, CB, Feldman, HA, Steltz, SK, Quinn, NL, Robinson, LM, and Ludwig, DS. Effects of sugar-sweetened, artificially sweetened, and unsweetened beverages on Cardiometabolic risk factors, body composition, and sweet taste preference: a randomized controlled trial. J Am Heart Assoc. (2020) 9:e015668. doi: 10.1161/JAHA.119.015668
65. Vázquez-Durán, M, Orea-Tejeda, A, Castillo-Martínez, L, Cano-García, Á, Téllez-Olvera, L, and Keirns-Davis, C. A randomized control trial for reduction of caloric and non-caloric sweetened beverages in young adults: effects in weight, body composition and blood pressure. Nutr Hosp. (2016) 33:1372–8. doi: 10.20960/nh.797
66. Santos, NC, de Araujo, LM, De Luca, CG, Guerra, ENS, Coelho, MS, and Borin, MF. Metabolic effects of aspartame in adulthood: a systematic review and Meta-analysis of randomized clinical trials. Crit Rev Food Sci Nutr. (2018) 58:2068–81. doi: 10.1080/10408398.2017.1304358
67. Lm, Who R, and Montez, J. Health effects of the use of non-sugar sweeteners: a systematic review and Meta-analysis. World Health Organization. Available at: https://apps who int/iris/handle/10665/353064 (accessed on April 2022) (2022).
68. Burke, MV, and Small, DM. Physiological mechanisms by which non-nutritive sweeteners may impact body weight and metabolism. Physiol Behav. (2015) 152:381–8. doi: 10.1016/j.physbeh.2015.05.036
69. Zhang, R, Noronha, JC, Khan, TA, McGlynn, N, Back, S, Grant, SM, et al. The effect of non-nutritive sweetened beverages on postprandial glycemic and endocrine responses: a systematic review and network Meta-analysis. Nutrients. (2023) 15:1050. doi: 10.3390/nu15041050
Keywords: non-nutritive sweeteners, meta-analysis, nutrients intake, total energy intake, carbohydrate intake
Citation: Rostampour K, Moghtaderi F, Najafi A, Seyedjafari B and Salehi-Abargouei A (2024) The effects of non-nutritive sweeteners on energy and macronutrients intake in adults: a grade-assessed systematic review and meta-analyses of randomized controlled trials. Front. Nutr. 11:1475962. doi: 10.3389/fnut.2024.1475962
Edited by:
Rasheed Ahmad, Dasman Diabetes Institute, KuwaitReviewed by:
Peter Putz, FH Campus Wien University of Applied Sciences, AustriaKeith T. Ayoob, Albert Einstein College of Medicine, United States
Copyright © 2024 Rostampour, Moghtaderi, Najafi, Seyedjafari and Salehi-Abargouei. This is an open-access article distributed under the terms of the Creative Commons Attribution License (CC BY). The use, distribution or reproduction in other forums is permitted, provided the original author(s) and the copyright owner(s) are credited and that the original publication in this journal is cited, in accordance with accepted academic practice. No use, distribution or reproduction is permitted which does not comply with these terms.
*Correspondence: Amin Salehi-Abargouei, YWJhcmdvdWVpQHNzdS5hYy5pcg==; YWJhcmdvdWVpQGdtYWlsLmNvbQ==
 Kimia Rostampour
 Fatemeh Moghtaderi
 AmirHossein Najafi1,2,3
 Amin Salehi-Abargouei