- 1Department of Pharmacy, The First People’s Hospital of Xiaoshan District, Hangzhou, China
- 2Department of Pharmacy, The Second People’s Hospital of Xiaoshan District, Hangzhou, China
Objective: Obesity has emerged as a worldwide problem. In recent years, it has been verified that there is an association between sleep duration and obesity indicators. This provides a new approach to control obesity. In this study, the relationship between duration of sleep and body mass index (BMI), waist circumference (WC), and waist-to-height ratio (WHtR) among Americans ≥45 years old was investigated.
Methods: Data was collected from the National Health and Nutrition Examination Survey (NHANES) between 2005 and 2014. The link between sleep duration and obesity indicators was analysed using multiple regression models and weighted smoothed curve fitting. Subgroup analysis was conducted to assess the consistency of the connection between sleep duration and obesity indicators across various groups.
Results: This study involved 7,118 males and 7,265 females, with an average age of 62.09. After total adjustment, sleep duration was negatively correlated with BMI (β = −0.19, 95%CI: −0.26, −0.12), WC (β = −0.36, 95%CI: −0.53, −0.19) and WHtR (β = −0.27, 95%CI: −0.38, −0.17). Subgroup analyses revealed more significant negative associations between sleep duration and BMI, WC, and WHtR among non-Hispanic White participants, and those without diabetes and hypertension.
Conclusion: Sleep duration was significantly negatively associated with BMI, WC, and WHtR, suggesting that longer sleep duration may contribute to lower obesity indicators in middle-aged and elderly Americans. Subgroup analysis showed that their negative correlation differed between races, diabetes, or hypertension status. However, additional prospective studies are required to validate these findings and investigate potential causal relationships.
Introduction
Over the past few decades, obesity has emerged as a severe health problem in the world since it can increase the incidence of ailments such as cardiovascular disease, diabetes, and cancer, especially among middle-aged and elderly age populations (1). The World Health Organization (WHO) characterizes obesity as the excessive accumulation of adipose tissue beyond normal physiological requirements (2). The Centers for Disease Control and Prevention’s Prevalence of Obesity in Adults 2023 map (3)revealed that middle-aged adults were nearly twice as likely to be obese compared to young adults across all states. Obesity rates were lowest among 18- to 24-year-olds at 19.5% and highest among 45- to 54-year-olds at 39.2%. Slow metabolism, decreased exercise, unbalanced diet and energy intake, as well as life pressure, have led to a greater risk of obesity for middle-aged and elderly people (4). Therefore, it is essential to take suitable actions to prevent and manage obesity. Obesity is characterized by a prolonged imbalance between caloric intake and energy expenditure, typically indicated by a BMI of 30 or higher (5). Adopting habits that decrease energy intake while boosting calorie expenditure might help slow down the advancement of obesity, including following a proper diet and engaging in physical activity (6). In addition, sleep may be another important factor (7).
Sufficient sleep is favorable for regulating the immune system and human metabolism (8). On the contrary, insufficient sleep may result in metabolic disturbances (9). Generally, 7–9 h is deemed as the suitable sleep time for overall physical and mental (10). However, over one-third of American adults get less than 7 h of sleep (11). A similar trend of shorter sleep duration has been observed in some Western countries over the past decades (7). Thus, a comprehensive evaluation of the correlation between sleep duration and obesity is crucial for exploring weight management (12, 13).
Numerous previous researches have confirmed the correlation between the duration of sleep and obesity (14–30). Nevertheless, these articles mainly found a negative relationship between short sleep time and obesity, and the results of long sleep time were unclear. In addition, the amount of sleep required varies at different ages. This study sought to elucidate further the relationship between sleep duration and various anthropometric indices of obesity in middle-aged and elderly Americans, ≥45 years old, using the data from the National Health and Nutrition Examination Surveys (NHANES) 2005–2014. Currently, the indices typically employed for clinical evaluation of obesity include waist circumference (WC), waist-to-hip ratio (WHR), waist-to-height ratio (WHtR), and body mass index (BMI) (31–33). Due to some limitations of the National Health and Nutrition Examination Survey (NHANES) surveys analyzed in this study (missing data on the hip circumference in the cited surveys), we selected BMI, WC, and WHtR as measures of obesity in this paper.
Methods
Targeted population
The National Health and Nutrition Examination Survey (NHANES) refers to a sizeable cross-sectional study to evaluate youths and adults’ health and nutritional condition throughout the U.S. (34). The survey annually assesses a nationally representative sample comprising approximately 5,000 individuals. These participants are distributed across various counties nationwide, with 15 specific counties being visited each year (35). The National Center for Health Statistics Ethics Review Board granted approval for the NHANES protocols, ensuring that all participants provided written informed permission. And that the data could be made publicly available for further analysis. As per the regulation of the National Institutes of Health (NIH), studies that use de-identified data and do not include direct interaction with participants are not classified as human subjects research. They do not require review by the institutional review board. Data from the NHANES 2005–2014 surveys were collected, excluding participants lacking BMI (n = 6,086), WC (n = 1,198), WHtR (n = 427) or sleep duration data (n = 13,982). Additionally, subjects younger than 45 (n = 15,335) were removed. Finally, 14,383 individuals were included in this study (Figure 1).

Figure 1. Participant selection flowchart. NHANES, National Health and Nutrition Examination Survey.
Data and variables
Three obesity indicators and sleep duration were set as the dependent and targeted independent variables, respectively. According to international standards, BMI was calculated as weight divided by height squared, while WHtR was calculated as WC divided by height (36), and in this study was expressed as a percentage, due to more observable effects in regression analyses. NHANES database provides accurate measurements of patients’ BMI, WC and WHtR by professionally tested healthcare professionals. Participants provided self-reported information on their sleep duration. This question determined the duration of sleep time: “How much sleep do you usually get at night on weekdays or workdays?” Based on the expert advice of the American Academy of Sleep Medicine and the Sleep Research Society (37, 38), it was categorized into three categories: short sleep time (<7 h/day), regular sleep time (7–9 h/day) and long sleep time (>9 h/day).
Based on similar studies (12, 28, 39), various covariates that may influence the outcome were considered, including age, gender, race, education, marital status, family PIR (income to poverty ratio), alcohol status, smoke status, moderate work activity, moderate recreational activities, diabetes, and hypertension status. Comprehensive explanations for all variables can be found on the official page of the NHANES website.1
Statistical analysis
Statistical analyses were carried out utilising R (version 4.1.3) and Empower Stats (version 2.0). The Kolmongorow–Smirnow test was used to test if the numeric variables were normally distributed or not. Parametric numeric data were presented as mean (SD, standard deviation), non-parametric numeric data were presented as median (IQR), and categorical variables were presented as a number (percentage). Differences between subgroups of subjects classified by sleep duration were evaluated using an analysis of variance (ANOVA) with Bonferroni post hoc test (parametric numeric data), Kruskal-Wallis test with post hoc Dunn’s test (non-parametric numeric data), or chi-square test (categorical data). The linear association between sleep duration and obesity indicators were examined using multiple regression models, and their relationship was further analysed by a weighted smoothed curve fitting method. Subgroup analyses were adopted to determine whether the associations of sleep duration with BMI, WC, and WHtR were stable in different populations (classified by gender, race, diabetes, or hypertension status). For covariates with more missing data, median interpolation was carried out for continuous variables, and logistic regression interpolation was carried out for categorical variables. For other covariates with less missing data, the subjects with missing values were removed from the analyses.
Results
Baseline characteristics
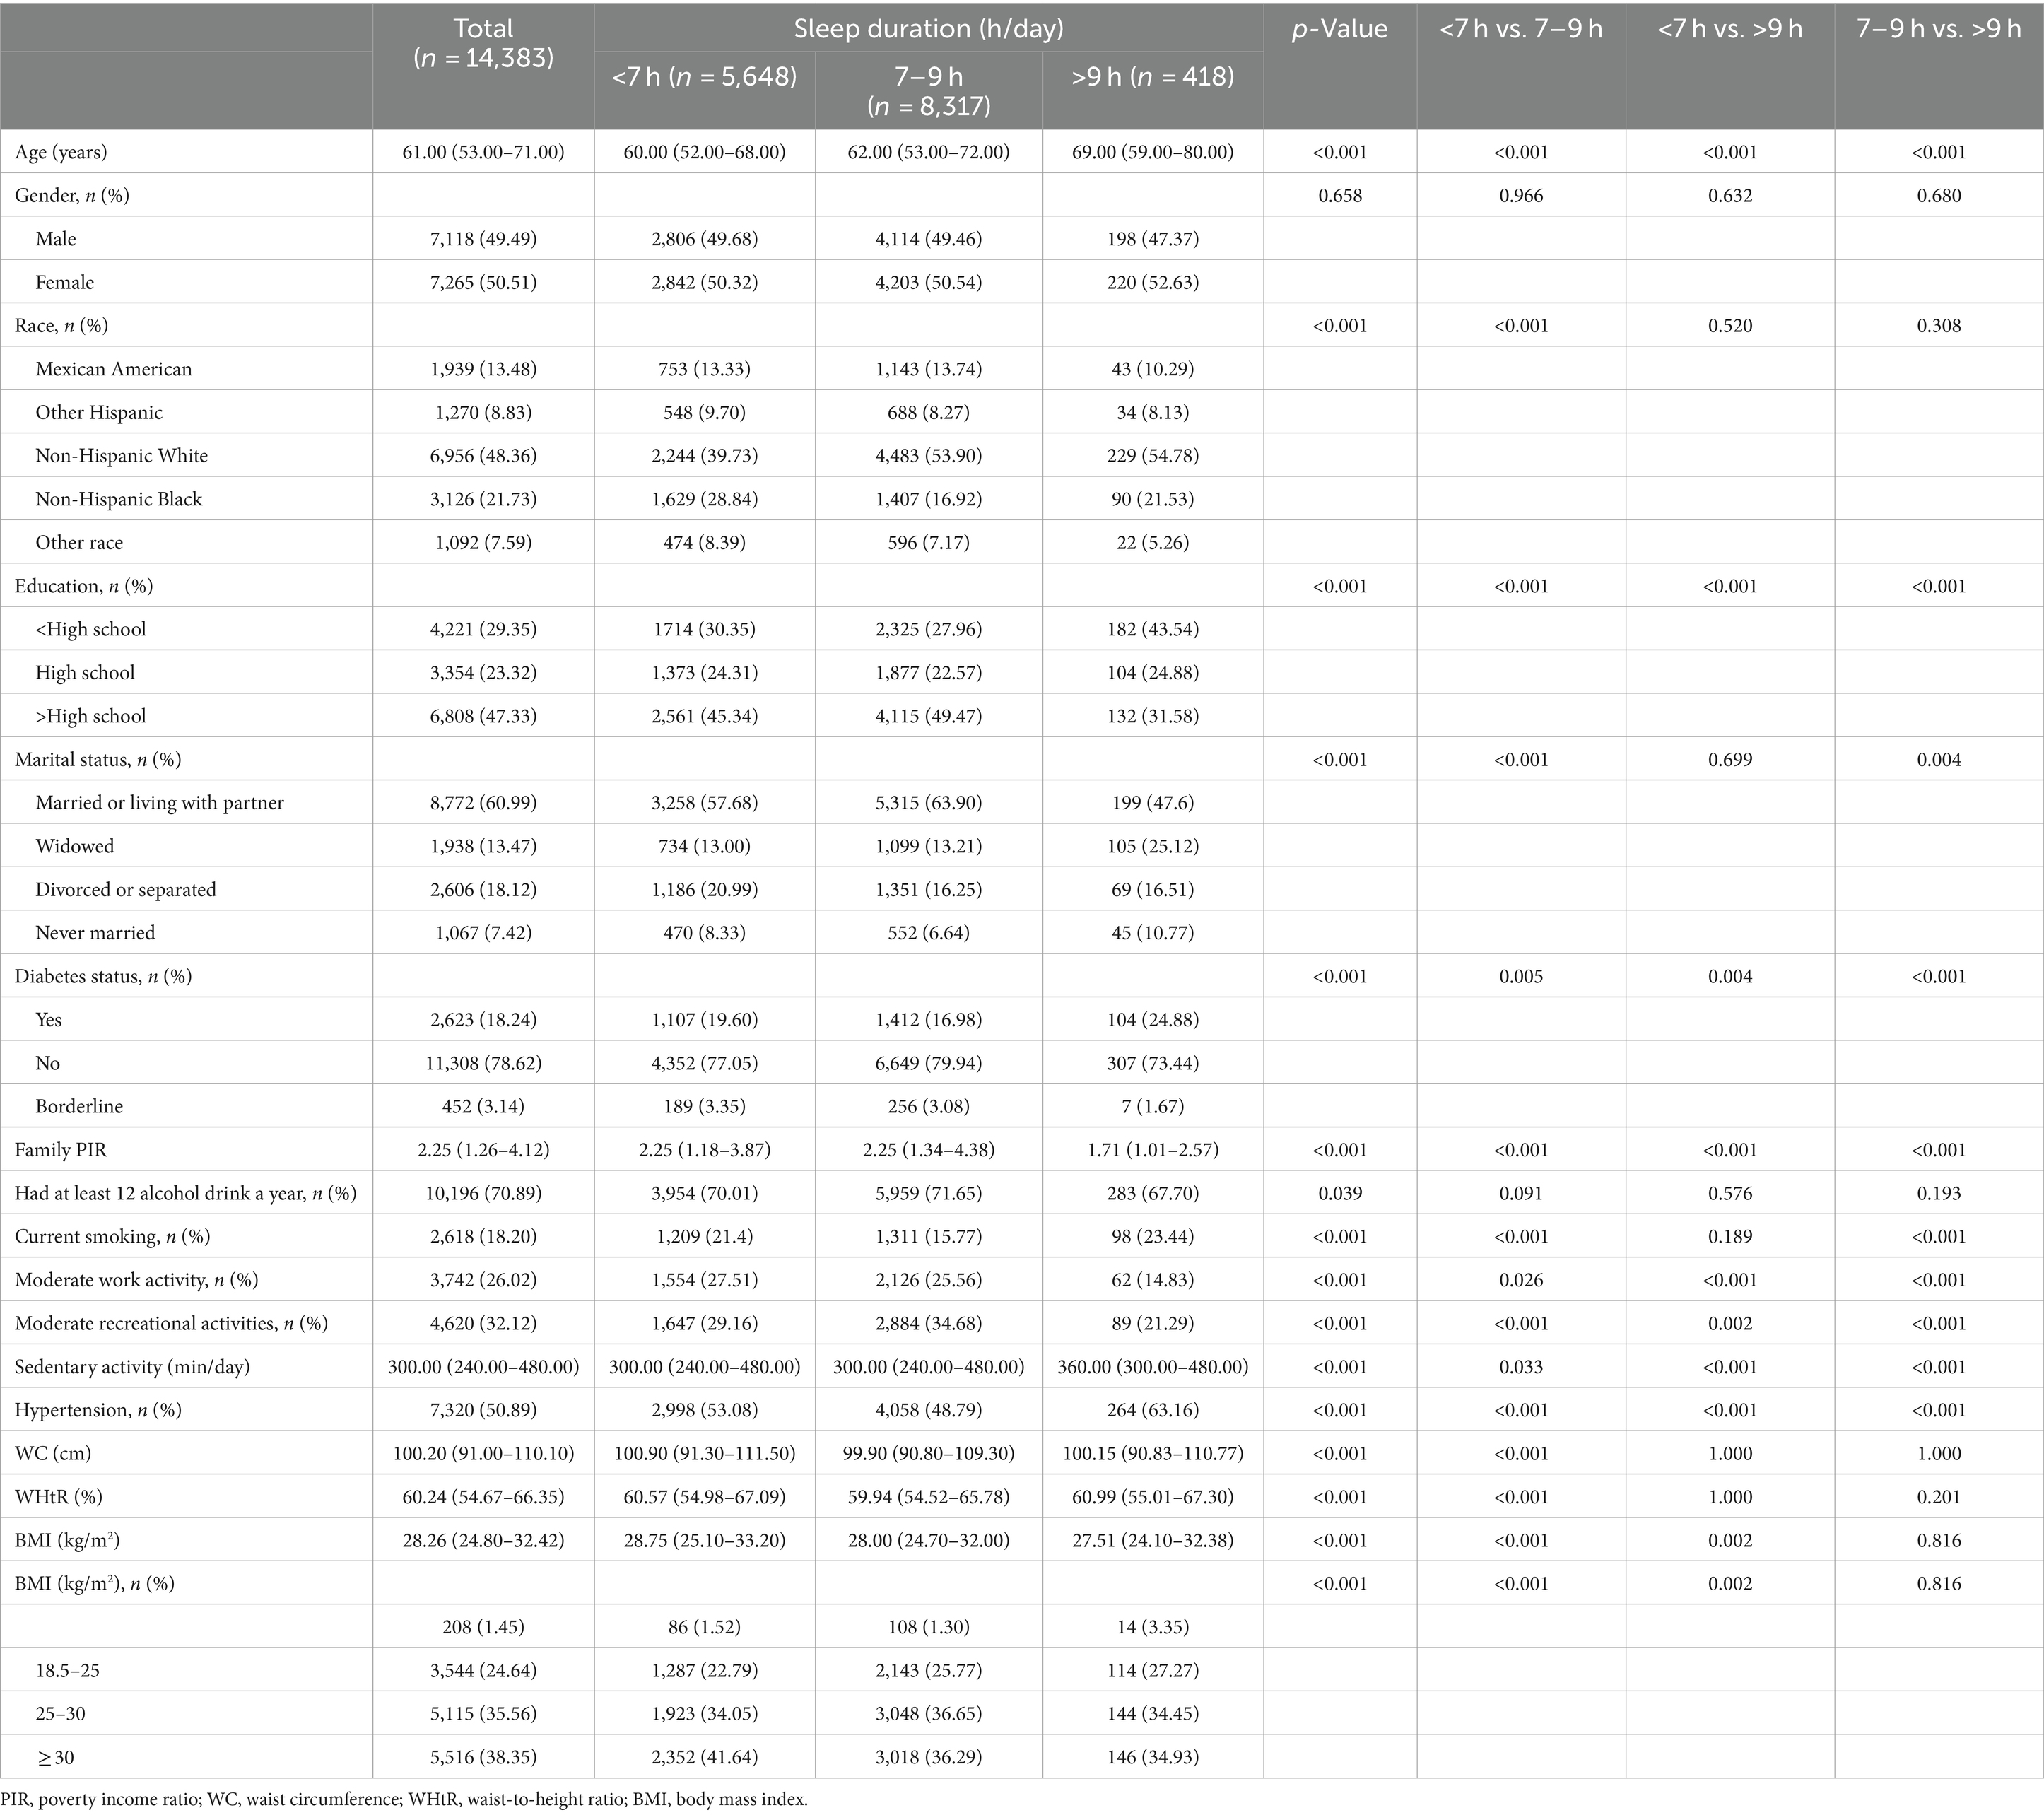
This study involved a total of 14,383 participants, consisting of 7,118 males and 7,265 females, with an average age of 62.09 ± 10.97 years. Their average BMI, WC, WHtR and sleep duration were 29.20 ± 6.40 kg/m2, 101.28 ± 15.12 cm, 0.61 ± 0.09, and 6.85 ± 1.48 h/day, respectively. The group with the shortest sleep duration had the highest obesity rates (BMI ≥ 30). Those who slept more than 9 h were older, had fewer work and leisure activities, were more sedentary, and had higher rates of diabetes and hypertension compared to those who slept less than 9 h. Meanwhile, people who slept 7–9 h had the highest levels of education, the lowest rates of smoking, diabetes and hypertension, and the most moderate work and leisure activities (Table 1).
The association between sleep duration and obesity indicators (BMI, WC, WHtR)
The outcomes of the multivariate logistic regression analysis with the three models are displayed in Tables 2–4. Sleep duration was negatively associated with BMI in all three models. In the multivariate model (Model 3), after full adjustment, a one-hour increase in sleep duration was associated with a 0.19 kg/m2 decrease in BMI (β = −0.19, 95%CI: −0.26, −0.12). The duration of sleep was divided into three groups for detailed analysis, converting it from a continuous variable to a categorical variable. Compared to the control group (<7 h), the group with the maximum sleep duration (>9 h) had a decrease in BMI of 1.28 kg/m2 (β = −1.28, 95%CI: −1.93, −0.62), which was significantly higher than the decrease of 0.51 kg/m2 (β = −0.51, 95%CI: −0.72, −0.31) in the 7–9 h group (Table 2).
There was also a significant negative association between sleep duration and WC (β = −0.36, 95%CI: −0.53, −0.19). After full adjustment, a one-hour increase in sleep duration was associated with a 0.36 cm decrease in WC. Similar to the BMI, the most extended sleep duration group (>9 h) had a significantly higher decline (β = −2.78, 95%CI: −4.33, −1.24) in WC compared to the control group (<7 h) than the 7–9 h group (β = −0.80, 95%CI: −1.28, −0.31) (Table 3).
There was also a significant negative association between sleep duration and WHtR (β = −0.27, 95%CI: −0.38, −0.17). After full adjustment, a one-hour increase in sleep duration was associated with a 0.27% decrease in WHtR expressed as a percentage. The >9 h group had a significantly higher decline (β = −1.88, 95%CI: −2.80, −0.96) in WHtR compared to the <7 h group than the 7–9 h group (β = −0.63, 95%CI: −0.92, −0.34) (Table 4).
Furthermore, the smoothed curve further verified the negative correlation between sleep duration and BMI, WC and WHtR (Figures 2–4). The curve seemed to show a cut-off point at 7 h or 8 h, before which the association was stronger (with a higher slope), after which the effect was less pronounced (with a lower slope), but the p-value was nonsignificant.
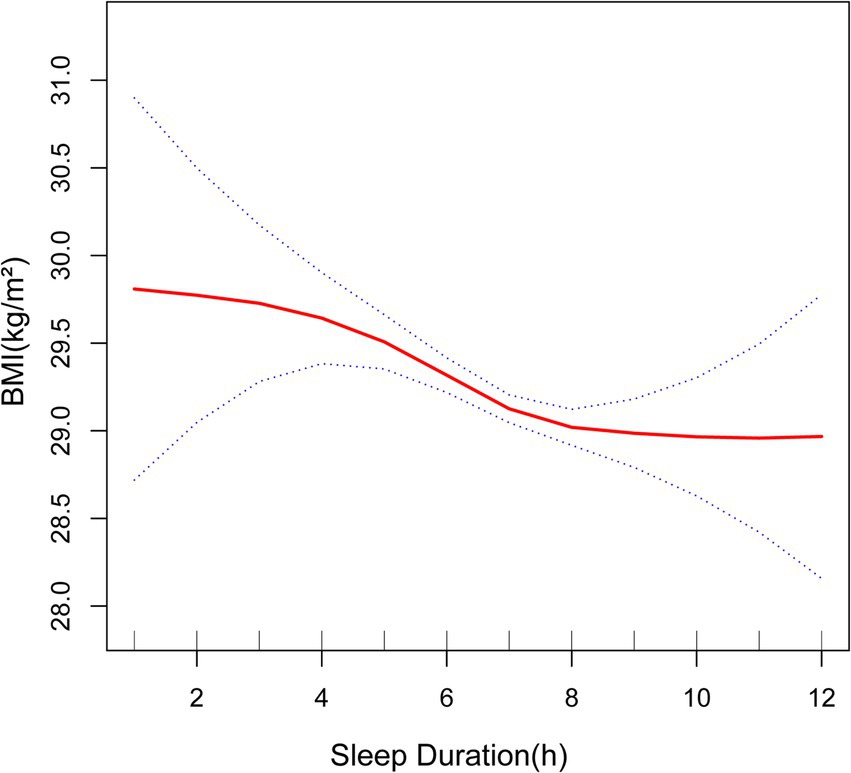
Figure 2. Association between sleep duration and BMI. The solid red line represents the smooth curve fit between variables. Blue bands represent the 95% of confidence interval from the fit. BMI, body mass index.
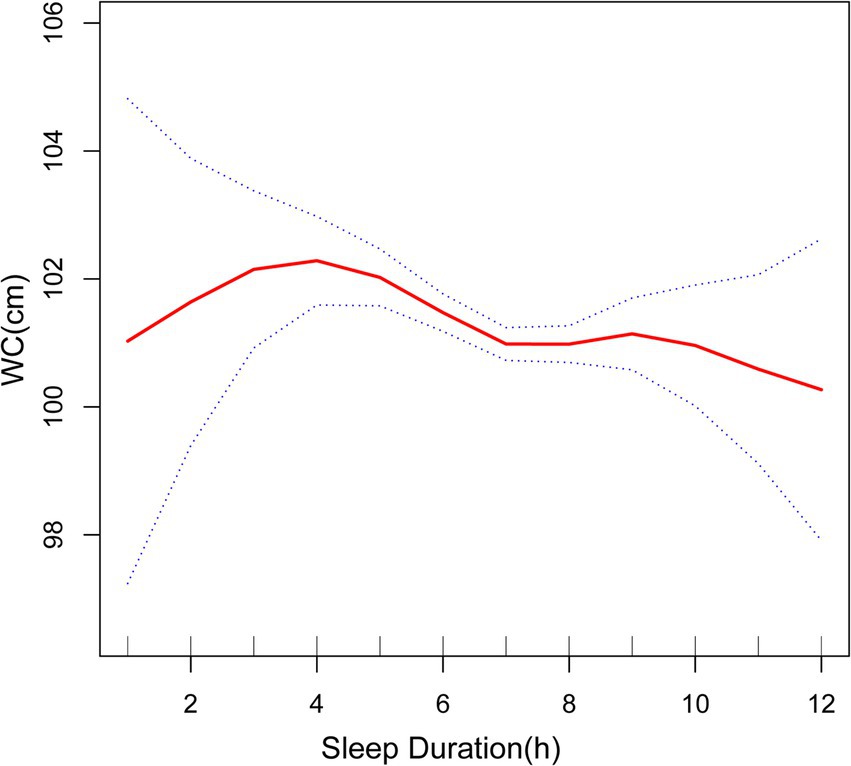
Figure 3. Association between sleep duration and WC. The solid red line represents the smooth curve fit between variables. Blue bands represent the 95% of confidence interval from the fit. WC, waist circumference.
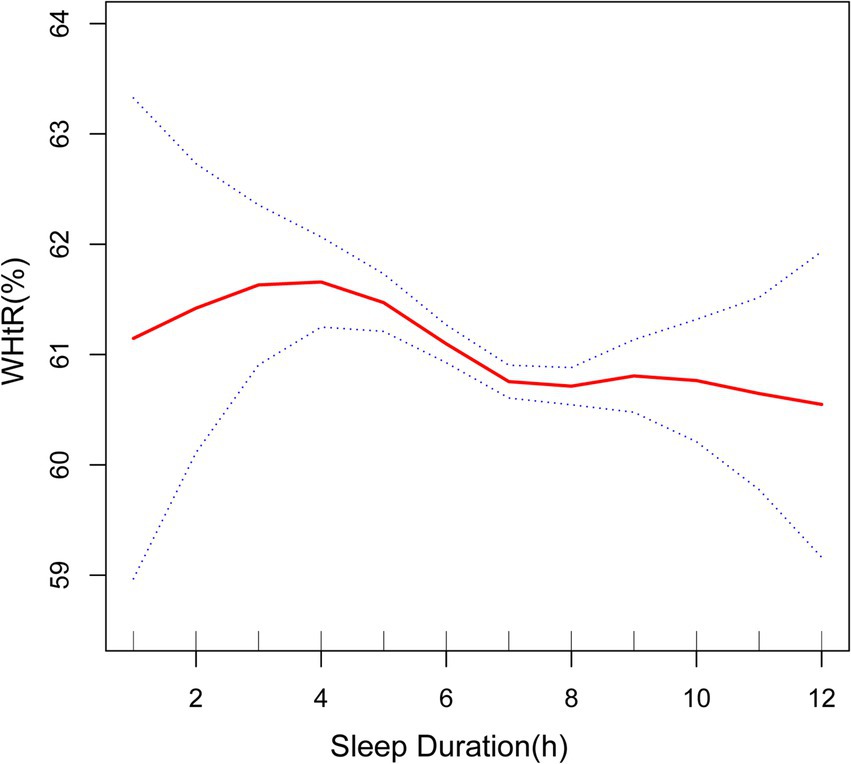
Figure 4. Association between sleep duration and WHtR. The solid red line represents the smooth curve fit between variables. Blue bands represent the 95% of confidence interval from the fit. WHtR, waist-to-height ratio.
Subgroup analyses
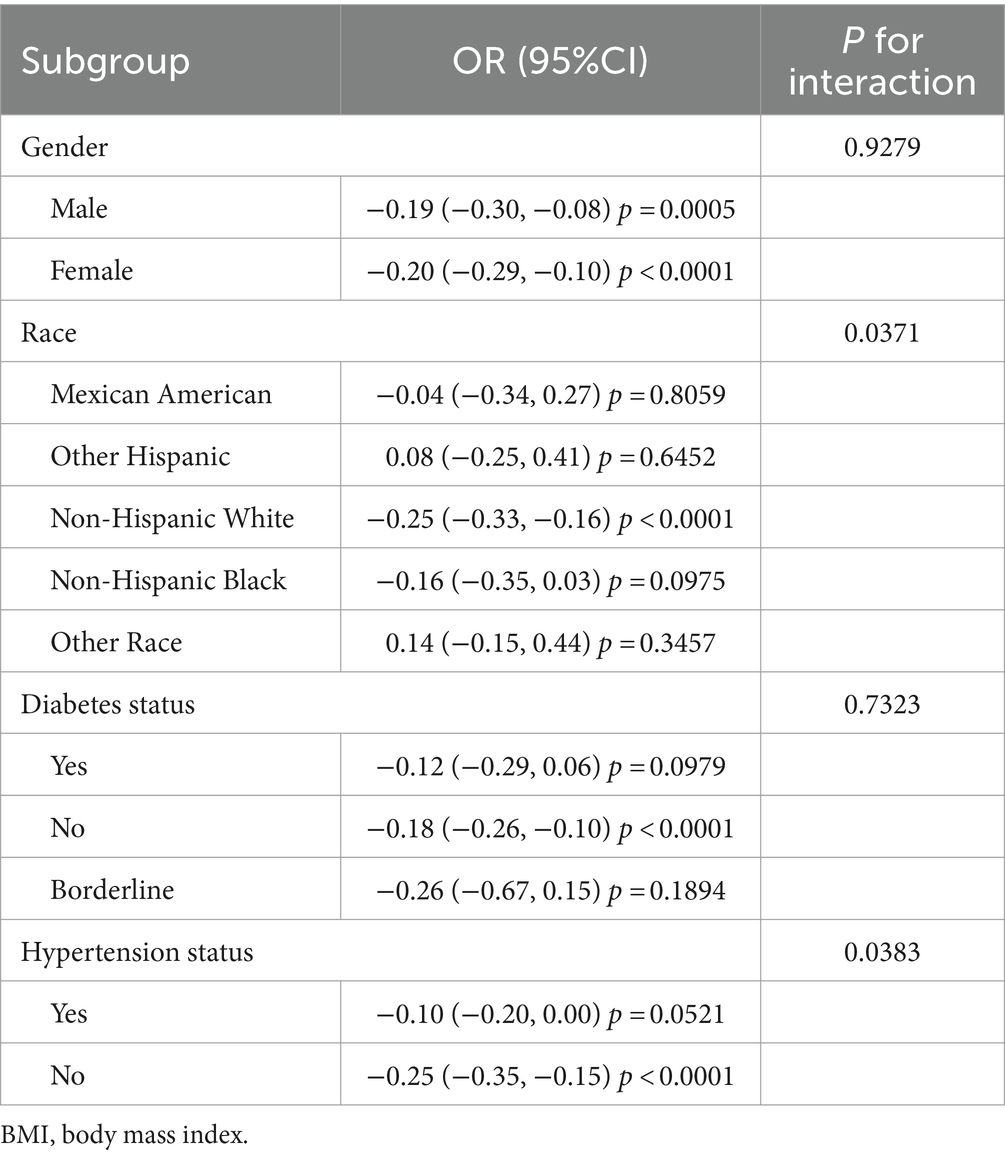
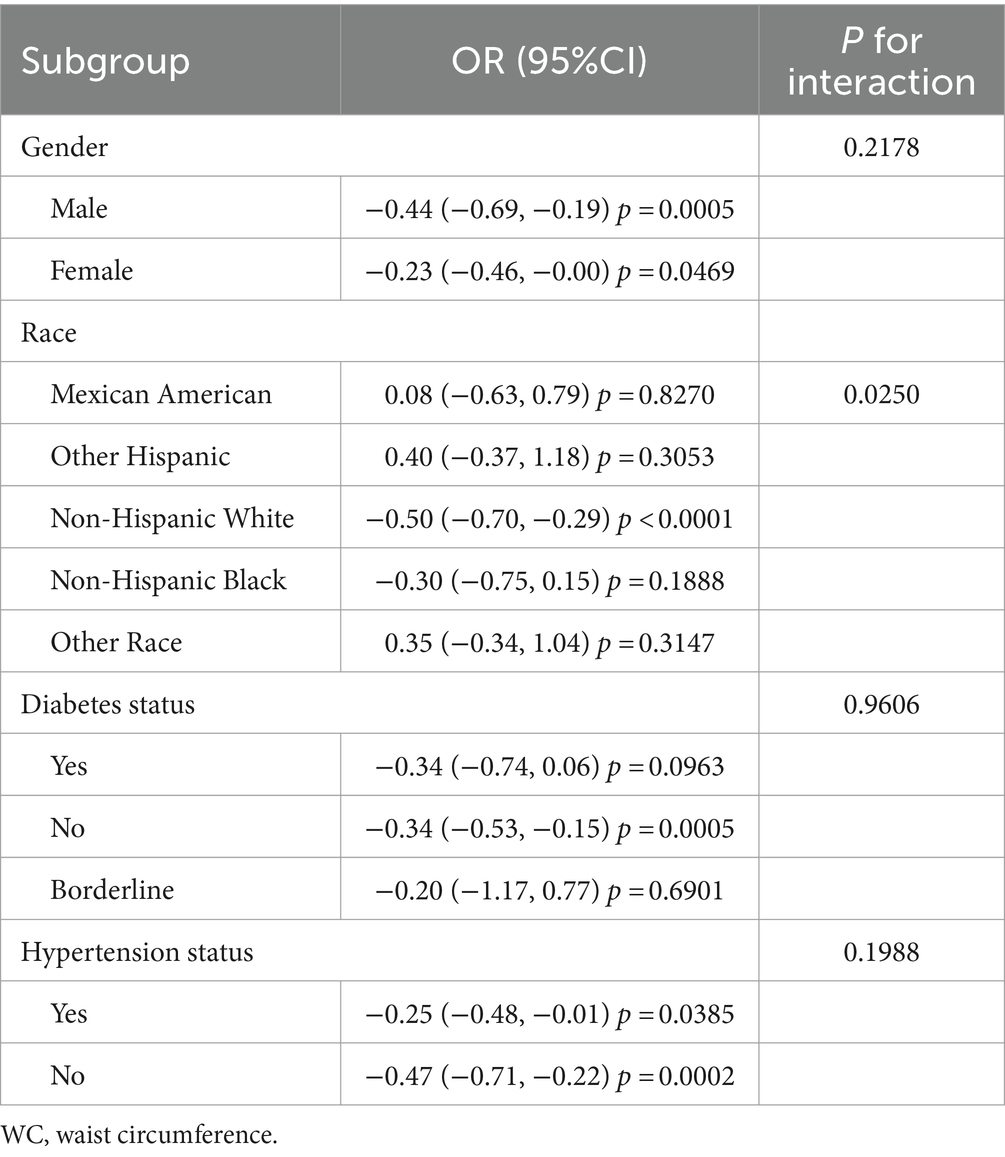
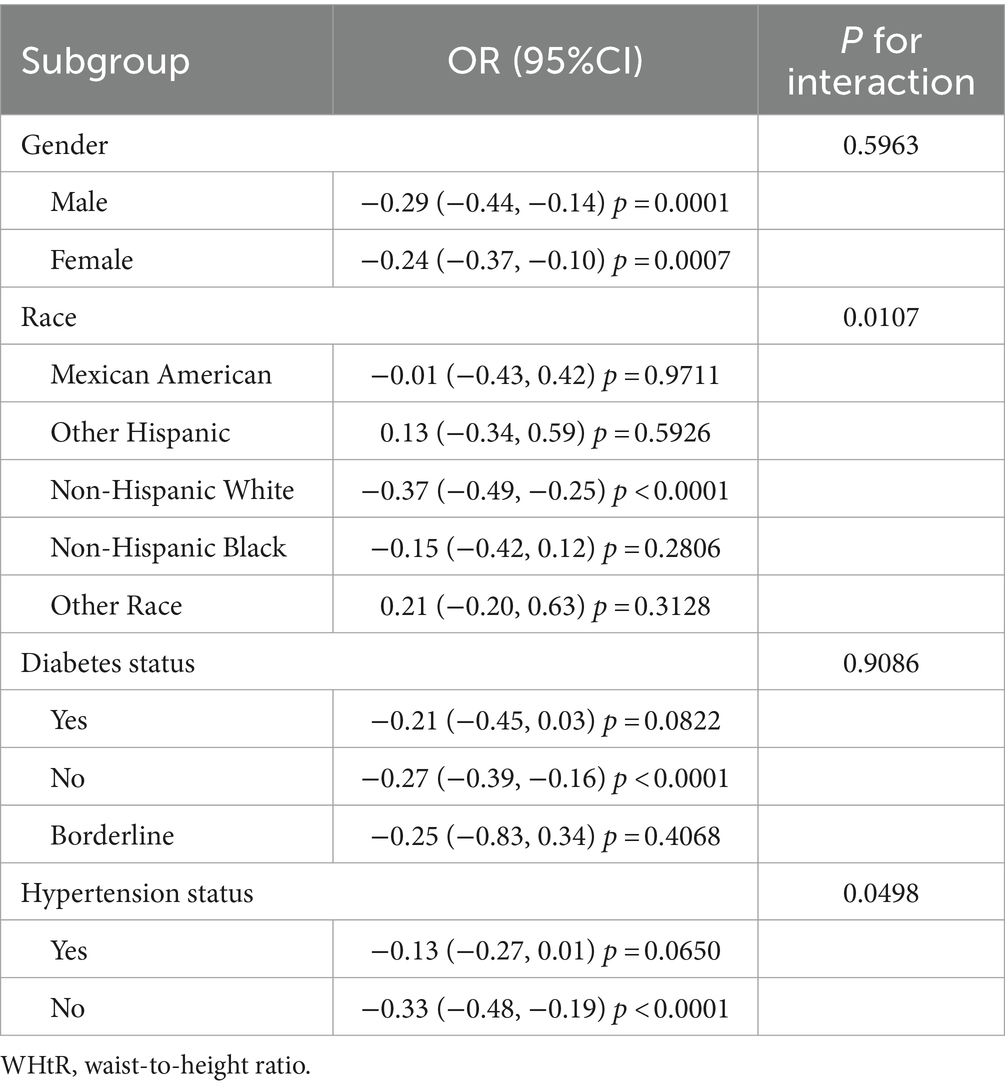
The subgroup analyses revealed that sleep duration was negatively associated with BMI, WC, and WHtR in both genders, but particularly among Non-Hispanic White, non-diabetic, and non-hypertensive subjects (Tables 5–7).
Discussion
The purpose of this research was to assess the correlation between sleep duration and three obesity indicators among middle-aged and elderly individuals in the United States. Our cross-sectional study included 14,383 middle-aged and elderly Americans from NHANES. After multiple data analyses, it was concluded that sleep duration was significantly negatively correlated with BMI, WC and WHtR in this population.
Examining three obesity indicators and sleep duration enhanced our conclusions and their applicability. BMI is commonly used for assessing body measurements due to its simplicity, but it cannot differentiate between fat and muscle. WC is proposed as a complementary metric that is particularly effective for detecting central obesity. However, excluding height in the WC measurement may result in inaccuracies when estimating abdominal obesity across individuals of varying statures, thereby underscoring its limitations (5). Thus, we included WHtR analysis. In the fully adjusted model, a one-hour increase in sleep time was associated with a 0.19 kg/m2 decrease in BMI (β = −0.19, 95%CI: −0.26, −0.12). After full adjustment, each additional hour of sleep was associated with a 0.36 cm decrease in WC (β = −0.36, 95%CI: −0.53, −0.19). After full adjustment, a one-hour increase in sleep duration was associated with a 0.27% decrease in WHtR expressed as a percentage (β = −0.27, 95%CI: −0.38, −0.17). The subgroup analysis results suggested that statistically significant differences were observed regarding race, diabetes, or hypertension status. Thus, the above findings apply more to middle-aged and elderly Non-Hispanic White in the U.S. However, we found that the number of participants in specific races was much lower than that in other subgroups, which may decrease the power of significant effect detection.
Previous studies, including meta-analyses and systematic reviews, have consistently shown a correlation between sleep duration and obesity indicators (14–27, 39–41). According to the Korean Health and Nutrition Survey study conducted by Kim et al. (28), those who slept less than 5 h per day had an increased likelihood of obesity, as determined by their BMI. In a large number of wearable sensor participants, the higher the body mass index, the shorter the sleep duration (29). Another study by Yazdanpanah et al. (41) found that BMI, WC and WHtR were in a significant negative association with nighttime sleep in an Iranian population. Furthermore, a meta-analysis conducted by Bacaro et al. (30) discovered that adults with a shorter sleep duration were more prone to a heightened susceptibility to obesity, but results on long sleep were still inconclusive. These studies reveal a negative correlation between sleep duration and obesity indicators in the case of short sleep duration, although the effects of long sleep remain uncertain. Our results are consistent with theirs on short sleep conditions. At the same time, we found that in the case of appropriate and long sleep, sleep duration and BMI, WC still showed a negative correlation, which is a new finding. The shape of the curve suggested that the critical value of sleeping is 7 h (even though this cut-off value was not significant) and that sleeping less than 7 h can be more associated with worse anthropometric indicators. In a comparable cross-sectional study, the associations between sleep duration and obesity indicators were more pronounced in young adults than in older adults (40), so studies tend to target younger groups. Our article, which focuses on the middle-aged and elderly population in the United States, strengthens the research analysis on older adults.
Multiple mechanisms elucidate the associations between sleep duration and obesity indicators (42). Several researches have shown that during sleep the secretion of various hormones varies, contributing to the metabolism and energy balance of our body (43–47). Cortisol secretion has a pronounced circadian rhythm, reaching a trough at midnight (48). However, sleep deprivation disrupts the hypothalamic–pituitary–adrenal (HPA) axis and the circadian rhythm of cortisol, increasing cortisol levels and promoting increased fat storage (43–45). Thyroid hormones regulate basal metabolic rate and energy expenditure (49). Short sleep duration disrupts thyroid function, reducing its levels and slowing metabolism, leading to an energy surplus and weight gain (47). Additionally, short sleep duration decreases leptin levels and increases ghrelin, enhancing appetite (46). Additionally, people with short sleep duration may increase eating possibilities because of the longer period of wakefulness (50, 51). Some studies have found no significant relationship between sleep duration and energy consumption (47, 52, 53). However, other studies have shown that shorter sleep times increase their energy expenditure, but at the same time, their energy intake may be higher (54–57). Many other researchers have also investigated the link between long sleep and obesity, but there are limited mechanisms to explain this relationship (58).
Our study has several strengths. First, an extensive dataset obtained from NHANES produced a representative sample of middle-aged and elderly Americans, to which we can generalise our findings to the broader U.S. population. Second, the confounding covariates were adjusted to make the results more reliable. Third, more detailed statistical analyses were employed, including multiple logistic regression models with corresponding adjustment ranges, smooth curve fitting, and subgroup analysis, to fully assess the correlation between sleep duration and obesity indicators. However, our research still has some shortcomings. Due to the limitations of cross-sectional studies, there is a correlation between the duration of sleep and obesity indicators without causation. In addition, most of the published studies, including ours, relied on self-reported sleep measures (i.e., memory and subjective estimations, which can be imprecise and inaccurate). Subsequent studies could consider introducing other sleep indicators, such as the Pittsburgh Sleep Quality Index, to evaluate sleep quality better (59). Finally, the use of weighting in regression analysis made the conclusions more relevant to the US population but less relevant to the general population.
Conclusion
Sleep duration was significantly negatively associated with BMI and WC, suggesting that longer sleep duration may contribute to lower obesity indicators in middle-aged and elderly Americans. Subgroup analysis showed that their negative correlation differed between races or hypertension status. However, additional prospective studies are required to validate these findings and investigate potential causal relationships. These findings may facilitate exploring novel weight loss strategies tailored to more specific demographic groups.
Data availability statement
The data presented in the study are deposited in the National Center for Health Statistics(NHANES)repository, accession number NHANES 2005-2014. Link: https://wwwn.cdc.gov/nchs/nhanes/Default.aspx.
Ethics statement
The studies involving humans were approved by the National Center for Health Statistics Ethics Review Board. The studies were conducted in accordance with the local legislation and institutional requirements. The participants provided their written informed consent to participate in this study.
Author contributions
MJ: Data curation, Software, Writing – original draft. BS: Formal analysis, Writing – original draft. LS: Methodology, Writing – original draft. MH: Conceptualization, Writing – review & editing.
Funding
The author(s) declare that no financial support was received for the research, authorship, and/or publication of this article.
Conflict of interest
The authors declare that the research was conducted in the absence of any commercial or financial relationships that could be construed as a potential conflict of interest.
Publisher’s note
All claims expressed in this article are solely those of the authors and do not necessarily represent those of their affiliated organizations, or those of the publisher, the editors and the reviewers. Any product that may be evaluated in this article, or claim that may be made by its manufacturer, is not guaranteed or endorsed by the publisher.
Footnotes
References
1. Heymsfield, SB, and Wadden, TA. Mechanisms, pathophysiology, and Management of Obesity. N Engl J Med. (2017) 376:254–66. doi: 10.1056/NEJMra1514009
2. Obesity: preventing and managing the global epidemic. Report of a WHO consultation. World Health Organ Tech Rep Ser. (2000) 894:i–253.
3. CDC. Adult obesity prevalence maps 2023. Available at: https://www.cdc.gov/obesity/php/data-research/adult-obesity-prevalence-maps.html?CDC_AAref_Val=https://www.cdc.gov/obesity/data/prevalence-maps.html.
4. Safaei, M, Sundararajan, EA, Driss, M, Boulila, W, and Shapi’i, A. A systematic literature review on obesity: understanding the causes & consequences of obesity and reviewing various machine learning approaches used to predict obesity. Comput Biol Med. (2021) 136:104754. doi: 10.1016/j.compbiomed.2021.104754
5. Zhao, J, Cai, X, Hu, J, Song, S, Zhu, Q, Shen, D, et al. J-shaped relationship between weight-adjusted-waist index and cardiovascular disease risk in hypertensive patients with obstructive sleep apnea: a cohort study. Diabetes Metab Syndr Obes. (2024) 17:2671–81. doi: 10.2147/DMSO.S469376
6. González-Muniesa, P, Mártinez-González, MA, Hu, FB, Després, JP, Matsuzawa, Y, Loos, RJF, et al. Obesity, Obesity. Nat Rev Dis Primers. (2017) 3:17034. doi: 10.1038/nrdp.2017.34
7. Ogilvie, RP, and Patel, SR. The epidemiology of sleep and obesity. Sleep Health. (2017) 3:383–8. doi: 10.1016/j.sleh.2017.07.013
8. Broussard, JL, Ehrmann, DA, van Cauter, E, Tasali, E, and Brady, MJ. Impaired insulin signaling in human adipocytes after experimental sleep restriction: a randomized, crossover study. Ann Intern Med. (2012) 157:549–57. doi: 10.7326/0003-4819-157-8-201210160-00005
9. Besedovsky, L, Lange, T, and Haack, M. The sleep-immune crosstalk in health and disease. Physiol Rev. (2019) 99:1325–80. doi: 10.1152/physrev.00010.2018
10. Watson, NF, Badr, MS, Belenky, G, Bliwise, DL, Buxton, OM, Buysse, D, et al. Recommended amount of sleep for a healthy adult: a joint consensus statement of the American Academy of Sleep Medicine and Sleep Research Society. Sleep. (2015) 38:843–4. doi: 10.5665/sleep.4716
11. Liu, Y, Wheaton, AG, Chapman, DP, Cunningham, TJ, Lu, H, and Croft, JB. Prevalence of Healthy Sleep Duration among Adults--United States, 2014. MMWR Morb Mortal Wkly Rep. (2016) 65:137–41. doi: 10.15585/mmwr.mm6506a1
12. Xu, C, Zhao, S, Yu, S, Tang, J, Zhang, H, Xu, B, et al. Short sleep duration was associated with increased regional body fat in US adults: the NHANES from 2011 to 2018. Nutrients. (2022) 14:2840. doi: 10.3390/nu14142840
13. Dong, L, Xie, Y, and Zou, X. Association between sleep duration and depression in US adults: a cross-sectional study. J Affect Disord. (2022) 296:183–8. doi: 10.1016/j.jad.2021.09.075
14. Krističević, T, Štefan, L, and Sporiš, G. The associations between sleep duration and sleep quality with body-mass index in a large sample of Young adults. Int J Environ Res Public Health. (2018) 15:758. doi: 10.3390/ijerph15040758
15. Rahe, C, Czira, ME, Teismann, H, and Berger, K. Associations between poor sleep quality and different measures of obesity. Sleep Med. (2015) 16:1225–8. doi: 10.1016/j.sleep.2015.05.023
16. Xiao, Q, Arem, H, Moore, SC, Hollenbeck, AR, and Matthews, CE. A large prospective investigation of sleep duration, weight change, and obesity in the NIH-AARP diet and health study cohort. Am J Epidemiol. (2013) 178:1600–10. doi: 10.1093/aje/kwt180
17. Chaput, JP, McNeil, J, Després, JP, Bouchard, C, and Tremblay, A. Short sleep duration as a risk factor for the development of the metabolic syndrome in adults. Prev Med. (2013) 57:872–7. doi: 10.1016/j.ypmed.2013.09.022
18. Guo, X, Zheng, L, Wang, J, Zhang, X, Zhang, X, Li, J, et al. Epidemiological evidence for the link between sleep duration and high blood pressure: a systematic review and meta-analysis. Sleep Med. (2013) 14:324–32. doi: 10.1016/j.sleep.2012.12.001
19. Knutson, KL, van Cauter, E, Rathouz, PJ, Yan, LL, Hulley, SB, Liu, K, et al. Association between sleep and blood pressure in midlife: the CARDIA sleep study. Arch Intern Med. (2009) 169:1055–61. doi: 10.1001/archinternmed.2009.119
20. Iftikhar, IH, Donley, MA, Mindel, J, Pleister, A, Soriano, S, and Magalang, UJ. Sleep duration and metabolic syndrome. An updated dose-risk metaanalysis. Ann Am Thorac Soc. (2015) 12:1364–72. doi: 10.1513/AnnalsATS.201504-190OC
21. Taheri, S, Lin, L, Austin, D, Young, T, and Mignot, E. Short sleep duration is associated with reduced leptin, elevated ghrelin, and increased body mass index. PLoS Med. (2004) 1:e62. doi: 10.1371/journal.pmed.0010062
22. Chaput, JP, Després, JP, Bouchard, C, and Tremblay, A. Short sleep duration is associated with reduced leptin levels and increased adiposity: results from the Quebec family study. Obesity (Silver Spring). (2007) 15:253–61. doi: 10.1038/oby.2007.512
23. Gangwisch, JE, Heymsfield, SB, Boden-Albala, B, Buijs, RM, Kreier, F, Pickering, TG, et al. Sleep duration as a risk factor for diabetes incidence in a large U.S. sample. Sleep. (2007) 30:1667–73. doi: 10.1093/sleep/30.12.1667
24. Wu, Y, Zhai, L, and Zhang, D. Sleep duration and obesity among adults: a meta-analysis of prospective studies. Sleep Med. (2014) 15:1456–62. doi: 10.1016/j.sleep.2014.07.018
25. Patel, SR, and Hu, FB. Short sleep duration and weight gain: a systematic review. Obesity (Silver Spring). (2008) 16:643–53. doi: 10.1038/oby.2007.118
26. Bixler, E. Sleep and society: an epidemiological perspective. Sleep Med. (2009) 10:S3–6. doi: 10.1016/j.sleep.2009.07.005
27. Magee, L, and Hale, L. Longitudinal associations between sleep duration and subsequent weight gain: a systematic review. Sleep Med Rev. (2012) 16:231–41. doi: 10.1016/j.smrv.2011.05.005
28. Kim, K, Shin, D, Jung, GU, Lee, D, and Park, SM. Association between sleep duration, fat mass, lean mass and obesity in Korean adults: the fourth and fifth Korea National Health and Nutrition Examination Surveys. J Sleep Res. (2017) 26:453–60. doi: 10.1111/jsr.12504
29. Jaiswal, SJ, Quer, G, Galarnyk, M, Steinhubl, SR, Topol, EJ, and Owens, RL. Association of Sleep Duration and Variability with Body Mass Index: sleep measurements in a large US population of wearable sensor users. JAMA Intern Med. (2020) 180:1694–6. doi: 10.1001/jamainternmed.2020.2834
30. Bacaro, V, Ballesio, A, Cerolini, S, Vacca, M, Poggiogalle, E, Donini, LM, et al. Sleep duration and obesity in adulthood: an updated systematic review and meta-analysis. Obes Res Clin Pract. (2020) 14:301–9. doi: 10.1016/j.orcp.2020.03.004
31. Lu, CY, Chen, HH, Chi, KH, and Chen, PC. Obesity indices and the risk of total and cardiovascular mortality among people with diabetes: a long-term follow-up study in Taiwan. Cardiovasc Diabetol. (2023) 22:345. doi: 10.1186/s12933-023-02072-3
32. Orsi, E, Solini, A, Penno, G, Bonora, E, Fondelli, C, Trevisan, R, et al. Body mass index versus surrogate measures of central adiposity as independent predictors of mortality in type 2 diabetes. Cardiovasc Diabetol. (2022) 21:266. doi: 10.1186/s12933-022-01706-2
33. Khan, I, Chong, M, le, A, Mohammadi-Shemirani, P, Morton, R, Brinza, C, et al. Surrogate adiposity markers and mortality. JAMA Netw Open. (2023) 6:e2334836. doi: 10.1001/jamanetworkopen.2023.34836
34. Johnson, CL, Dohrmann, SM, Burt, VL, and Mohadjer, LK. National health and nutrition examination survey: sample design, 2011-2014. Vital Health Stat 2. (2014) 2014:1–33.
35. National Center for Health Statistics. Available at: https://www.cdc.gov/nchs/nhanes/Index.htm.
36. Cai, X, Song, S, Hu, J, Zhu, Q, Yang, W, Hong, J, et al. Body roundness index improves the predictive value of cardiovascular disease risk in hypertensive patients with obstructive sleep apnea: a cohort study. Clin Exp Hypertens. (2023) 45:2259132. doi: 10.1080/10641963.2023.2259132
37. Hirshkowitz, M, Whiton, K, Albert, SM, Alessi, C, Bruni, O, DonCarlos, L, et al. National Sleep Foundation’s sleep time duration recommendations: methodology and results summary. Sleep Health. (2015) 1:40–3. doi: 10.1016/j.sleh.2014.12.010
38. Watson, NF, Badr, MS, Belenky, G, Bliwise, DL, Buxton, OM, Buysse, D, et al. Joint consensus statement of the American Academy of sleep medicine and Sleep Research Society on the recommended amount of sleep for a healthy adult: methodology and discussion. Sleep. (2015) 38:1161–83. doi: 10.5665/sleep.4886
39. Sperry, SD, Scully, ID, Gramzow, RH, and Jorgensen, RS. Sleep duration and waist circumference in adults: a meta-analysis. Sleep. (2015) 38:1269–76. doi: 10.5665/sleep.4906
40. Ford, ES, Li, C, Wheaton, AG, Chapman, DP, Perry, GS, and Croft, JB. Sleep duration and body mass index and waist circumference among U.S. adults. Obesity (Silver Spring). (2014) 22:598–607. doi: 10.1002/oby.20558
41. Yazdanpanah, MH, Farjam, M, Naghizadeh, MM, Jedi, F, Mohebi, K, and Homayounfar, R. Sleep duration and anthropometric indices in an Iranian population: the FASA PERSIAN cohort study. Sci Rep. (2021) 11:16249. doi: 10.1038/s41598-021-95796-9
42. Zimberg, IZ, Dâmaso, A, del Re, M, Carneiro, AM, de Sá Souza, H, de Lira, FS, et al. Short sleep duration and obesity: mechanisms and future perspectives. Cell Biochem Funct. (2012) 30:524–9. doi: 10.1002/cbf.2832
43. Anderson, T, Corneau, G, Wideman, L, Eddington, K, and Vrshek-Schallhorn, S. The impact of prior day sleep and physical activity on the cortisol awakening response. Psychoneuroendocrinology. (2021) 126:105131. doi: 10.1016/j.psyneuen.2021.105131
44. van Dalfsen, JH, and Markus, CR. The influence of sleep on human hypothalamic-pituitary-adrenal (HPA) axis reactivity: a systematic review. Sleep Med Rev. (2018) 39:187–94. doi: 10.1016/j.smrv.2017.10.002
45. Abell, JG, Shipley, MJ, Ferrie, JE, Kivimäki, M, and Kumari, M. Recurrent short sleep, chronic insomnia symptoms and salivary cortisol: a 10-year follow-up in the Whitehall II study. Psychoneuroendocrinology. (2016) 68:91–9. doi: 10.1016/j.psyneuen.2016.02.021
46. Shlisky, JD, Hartman, TJ, Kris-Etherton, PM, Rogers, CJ, Sharkey, NA, and Nickols-Richardson, SM. Partial sleep deprivation and energy balance in adults: an emerging issue for consideration by dietetics practitioners. J Acad Nutr Diet. (2012) 112:1785–97. doi: 10.1016/j.jand.2012.07.032
47. Klingenberg, L, Sjödin, A, Holmbäck, U, Astrup, A, and Chaput, JP. Short sleep duration and its association with energy metabolism. Obes Rev. (2012) 13:565–77. doi: 10.1111/j.1467-789X.2012.00991.x
48. Lightman, SL, Birnie, MT, and Conway-Campbell, BL. Dynamics of ACTH and cortisol secretion and implications for disease. Endocr Rev. (2020) 41:bnaa002. doi: 10.1210/endrev/bnaa002
49. Walczak, K, and Sieminska, L. Obesity and thyroid Axis. Int J Environ Res Public Health. (2021) 18:9434. doi: 10.3390/ijerph18189434
50. Shi, Z, McEvoy, M, Luu, J, and Attia, J. Dietary fat and sleep duration in Chinese men and women. Int J Obes. (2008) 32:1835–40. doi: 10.1038/ijo.2008.191
51. Hart, CN, Carskadon, MA, Considine, RV, Fava, JL, Lawton, J, Raynor, HA, et al. Changes in children’s sleep duration on food intake, weight, and leptin. Pediatrics. (2013) 132:e1473–80. doi: 10.1542/peds.2013-1274
52. Hairston, KG, Bryer-Ash, M, Norris, JM, Haffner, S, Bowden, DW, and Wagenknecht, LE. Sleep duration and five-year abdominal fat accumulation in a minority cohort: the IRAS family study. Sleep. (2010) 33:289–95. doi: 10.1093/sleep/33.3.289
53. Schmid, SM, Hallschmid, M, Jauch-Chara, K, Wilms, B, Benedict, C, Lehnert, H, et al. Short-term sleep loss decreases physical activity under free-living conditions but does not increase food intake under time-deprived laboratory conditions in healthy men. Am J Clin Nutr. (2009) 90:1476–82. doi: 10.3945/ajcn.2009.27984
54. Bayon, V, Leger, D, Gomez-Merino, D, Vecchierini, MF, and Chennaoui, M. Sleep debt and obesity. Ann Med. (2014) 46:264–72. doi: 10.3109/07853890.2014.931103
55. Duan, D, Kim, LJ, Jun, JC, and Polotsky, VY. Connecting insufficient sleep and insomnia with metabolic dysfunction. Ann N Y Acad Sci. (2023) 1519:94–117. doi: 10.1111/nyas.14926
56. Patterson, RE, Emond, JA, Natarajan, L, Wesseling-Perry, K, Kolonel, LN, Jardack, P, et al. Short sleep duration is associated with higher energy intake and expenditure among African-American and non-Hispanic white adults. J Nutr. (2014) 144:461–6. doi: 10.3945/jn.113.186890
57. Calvin, AD, Carter, RE, Adachi, T, Macedo, PG, Albuquerque, FN, van der Walt, C, et al. Effects of experimental sleep restriction on caloric intake and activity energy expenditure. Chest. (2013) 144:79–86. doi: 10.1378/chest.12-2829
58. Knutson, KL. Does inadequate sleep play a role in vulnerability to obesity? Am J Hum Biol. (2012) 24:361–71. doi: 10.1002/ajhb.22219
Keywords: body mass index (BMI), waist circumference (WC), waist-to-height ratio (WHtR), sleep duration, obesity, middle-aged and elderly people, NHANES
Citation: Jiang M, Shou B, Shi L and He M (2024) Association between sleep duration and three obesity indicators among middle-aged and elderly adults: findings from the NHANES 2005–2014. Front. Nutr. 11:1464851. doi: 10.3389/fnut.2024.1464851
Edited by:
Ivana Šarac, University of Belgrade, SerbiaReviewed by:
Tamara Popović, University of Belgrade, SerbiaKatja Weiss, University of Zurich, Switzerland
Jing Hong, Hypertension Center of People’s Hospital of Xinjiang Uygur Autonomous Region, China
Copyright © 2024 Jiang, Shou, Shi and He. This is an open-access article distributed under the terms of the Creative Commons Attribution License (CC BY). The use, distribution or reproduction in other forums is permitted, provided the original author(s) and the copyright owner(s) are credited and that the original publication in this journal is cited, in accordance with accepted academic practice. No use, distribution or reproduction is permitted which does not comply with these terms.
*Correspondence: Min He, MjgxMzIwMjMzQHFxLmNvbQ==
 Mengjin Jiang1
 Min He