 Rui Xiao
 Li Dong2
94% of researchers rate our articles as excellent or good
Learn more about the work of our research integrity team to safeguard the quality of each article we publish.
Find out more
ORIGINAL RESEARCH article
Front. Nutr. , 25 July 2024
Sec. Nutritional Epidemiology
Volume 11 - 2024 | https://doi.org/10.3389/fnut.2024.1414678
Background: Traditional clinical studies have indicated a link between certain food intakes and type 2 diabetes (T2D), but the causal relationships between different dietary habits and T2D remain unknown. Using Mendelian randomization (MR) approaches, we investigated the potential causal association between dietary habits and T2D risk.
Methods: We collected publicly available genome-wide association studies’ summary statistics for 18 dietary habits from the UK Biobank and T2D data from the DIAbetes Genetics Replication And Meta-analysis (DIAGRAM) consortium. We applied the inverse variance weighted (IVW) method, supplemented with the MR-Egger method, weighted median method (WMM), simple method, weighted mode, MR-Egger regression, and the MR pleiotropy residual sum and outlier test to determine whether a particular diet was causal for T2D.
Results: Reliable and robust MR estimates demonstrated that poultry intake has a causal effect on a higher risk of T2D (IVW: OR 6.30, 95% CI 3.573–11.11, p = 2.02e − 10; WMM: OR 5.479, 95% CI 0.2758–10.88, p = 1.19e − 06). Conversely, dried fruit intake (IVW: OR 0.380, 95% CI 0.237–0.608, p = 5.57e − 05; WMM: OR 0.450, 95% CI 0.321–0.630, p = 3.33e − 06) and cereal intake (IVW: OR 0.455, 95% CI 0.317–0.653, p = 1.924e − 05; WMM: OR 0.513, 95% CI 0.379–0.694, p = 1.514e − 05) were causally associated with T2D as protective factors. Sensitivity analyses confirmed the reliability and robustness of these findings.
Discussion: Our study established the causal effects of poultry intake, dried fruit intake, and cereal intake on T2D, identifying poultry intake as a risk factor and the other two as protective factors. Further research into potential mechanisms is required to validate these novel findings.
With the rise in obesity, the decline in physical activity, a sedentary lifestyle, and poor eating habits, type 2 diabetes (T2D) is becoming more and more prevalent worldwide. In 2015, T2D was estimated to affect 415 million people, projected to reach 642 million by 2040 (1). Diabetes significantly impacts morbidity and mortality, contributing to risks such as stroke, renal failure, leg amputation, cardiovascular illnesses, vision loss, and neuropathy (2).
Lifestyle therapies aimed at modifying diet and physical activity levels have consistently been used to reduce T2D risk in the short and long term (3). Implementing effective T2D prevention initiatives as well as early detection programs is critical to lessen the disease’s health burden (4). The proper selection of food and dietary components has been recognized to play a significant role in preventing early-onset T2D and reducing the lifelong risk of developing the disease. However, the exact types of foods that are most beneficial remain unclear.
Previous studies have identified various relationships between different dietary habits and T2D. For instance, no statistically significant associations were found between the consumption of eggs, fish, nuts, vegetables, or refined grains and T2D. Conversely, dairy products, fruits, and whole grains showed a negative correlation with the incidence of T2D, while red and processed meats, as well as sugar-sweetened beverages, exhibited a positive correlation (5–10).
Dietary fiber has been shown to play a role in the etiology of chronic diseases, including type 2 diabetes (T2D), with its effects potentially mediated through the modulation of gut microbiota, making this a growing topic of research and interest (2).
While specific food risk factors for T2D progression have been identified in a few studies, there is inadequate evidence to substantiate their causal significance in T2D incidence, and the variety of diets examined is limited. Several genome-wide association studies (GWAS) have recently revealed that dietary habits are heritable features (11, 12). Therefore, Mendelian randomization (MR), which utilizes genetic instruments to mitigate potential confounding biases, is an appropriate study design to investigate the effects of nutrition on disease or health outcomes (13). The goal of this study is to use a two-sample MR technique to evaluate the causal links between eating habits and the risk of T2D. To mitigate selective reporting bias, all available dietary habit variables from the UK Biobank (UKBB) GWAS data provided by the Neale lab were evaluated for their potential causal association with T2D in this exploratory investigation.
Table 1 shows a brief description of dietary habits data sources. GWAS summary statistics of 18 kinds of dietary habits were from the MRC-IEU consortium and UK-Biobank, all participants are European (14, 15). UK Biobank database, a population-scale prospective cohort in the United Kingdom, >500,000 participants aged 40–69 years from 2006 to 2010 were included.
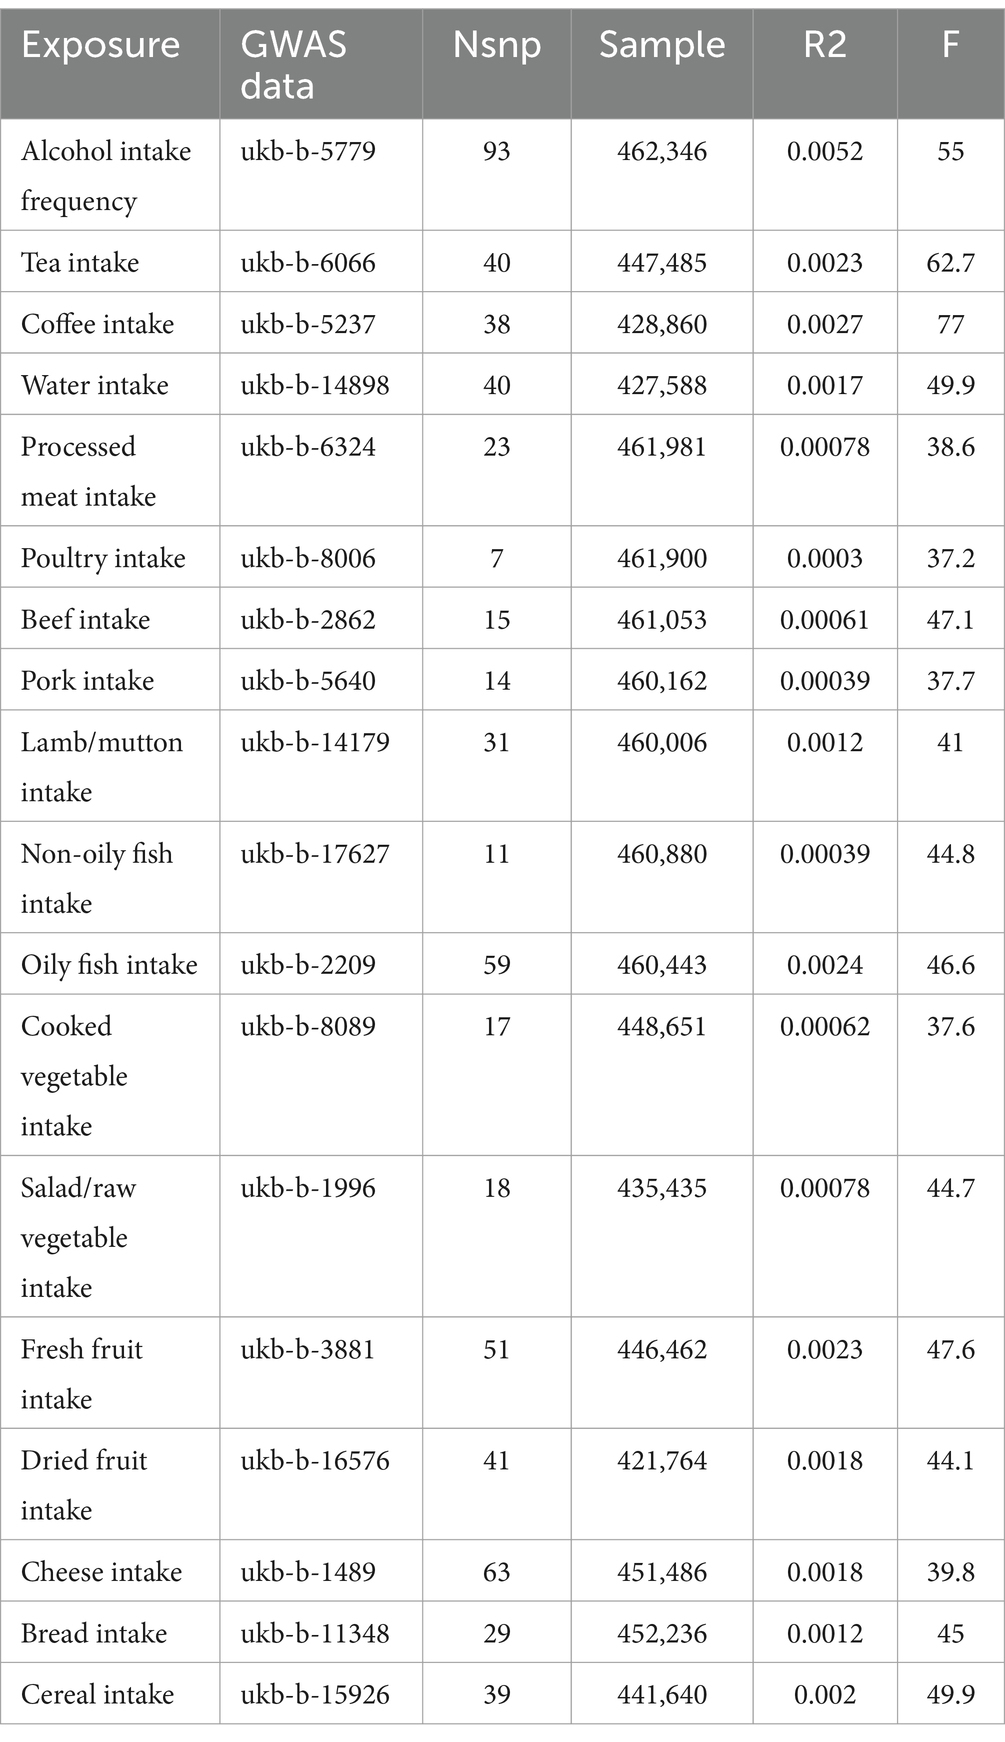
Table 1. Summary of dietary habits.
For T2D, we downloaded the 2022 summary statistics of T2D in the European population from the DIAbetes Genetics Replication And Meta-analysis (DIAGRAM) consortium which is combined with a lot of T2D researchers, larger scale studies were performed to explore genetic characteristics of T2D (16). For this summary statistics, 122 GWAS including 180,834 T2D cases and 1,159,055 controls from 5 ancestry groups were used, and we only applied the summary statistics of European ancestry with 51.1% of the total effective sample size in this study (17).
To ensure the reliability of the instrumental variables, several statistical control steps were taken. Firstly, only single nucleotide polymorphism (SNP) with genome-wide significance ( ) were extracted from the whole dataset. Secondly, linkage disequilibrium was removed using the clumping process ( , window size 10,000 kb) with the European population. Thirdly, SNPs were eliminated if minor allele frequency (MAF) 0.01.
F statistic was calculated for every single instrumental variable to ensure there was no weak instrumental variable basis. The calculation formula is ; is the proportion of the variation for instrumental variable; is sample size; is the number of instrumental variables. The likelihood of a weak instrumental variable is considered very small if the F statistic is greater than 10 (18).
The IVW method was chosen as the primary approach in this study due to its ability to aggregate Wald ratios from individual SNPs, allowing for an exploration of the causal effect between dietary habits and type 2 diabetes (T2D), provided there is minimal horizontal pleiotropy (19). On the other hand, heterogeneity effects can be accounted for in the random effects model of the IVW method (19, 20). In the MR-Egger method, we account for the presence of an intercept term and use it to assess pleiotropic effects. If the intercepted item is very close to 0, then the MR-Egger regression model is very close to IVW, but if the intercepted item is very different from 0, it means that there may be horizontal pleiotropic effects among these IVs (21). The weighted median method can produce accurate estimates even if 50% of the genetic variation violates the core assumptions of MR (22).
MR Egger regression was applied to detect horizontal pleiotropy by testing the intercept (21). MR-PRESSO method was applied to detect outliers that related to horizontal pleiotropy; horizontal pleiotropy was removed by eliminating the outliers; a distortion test was used to test whether there was a significant difference before and after removing outliers (23, 24). And, heterogeneity was tested by Cochran’s Q test (IVW and MR-Egger, means heterogeneity existing) (24). Finally, we performed a “leave-one-out” analysis to identify the potential influential SNPs.
was considered statistically significant in MR analysis. After Bonferroni correction, was considered significant (18 exposures) in this MR study.
Figure 1 shows our study flow chart. Table 2 shows the MR estimates from different methods of detecting the casual association of 18 kinds of dietary habits on T2D. Sensitivity analysis results are presented in Supplementary Table S1. According to the MR results, coffee intake, poultry intake, dried fruit intake, cheese intake, and cereal intake are genetically associated with T2D. Scatter plots, forest plots, “leave-one-out” analysis plots, and funnel plots for all 18 kinds of dietary habits are shown in Supplementary Figure S1.
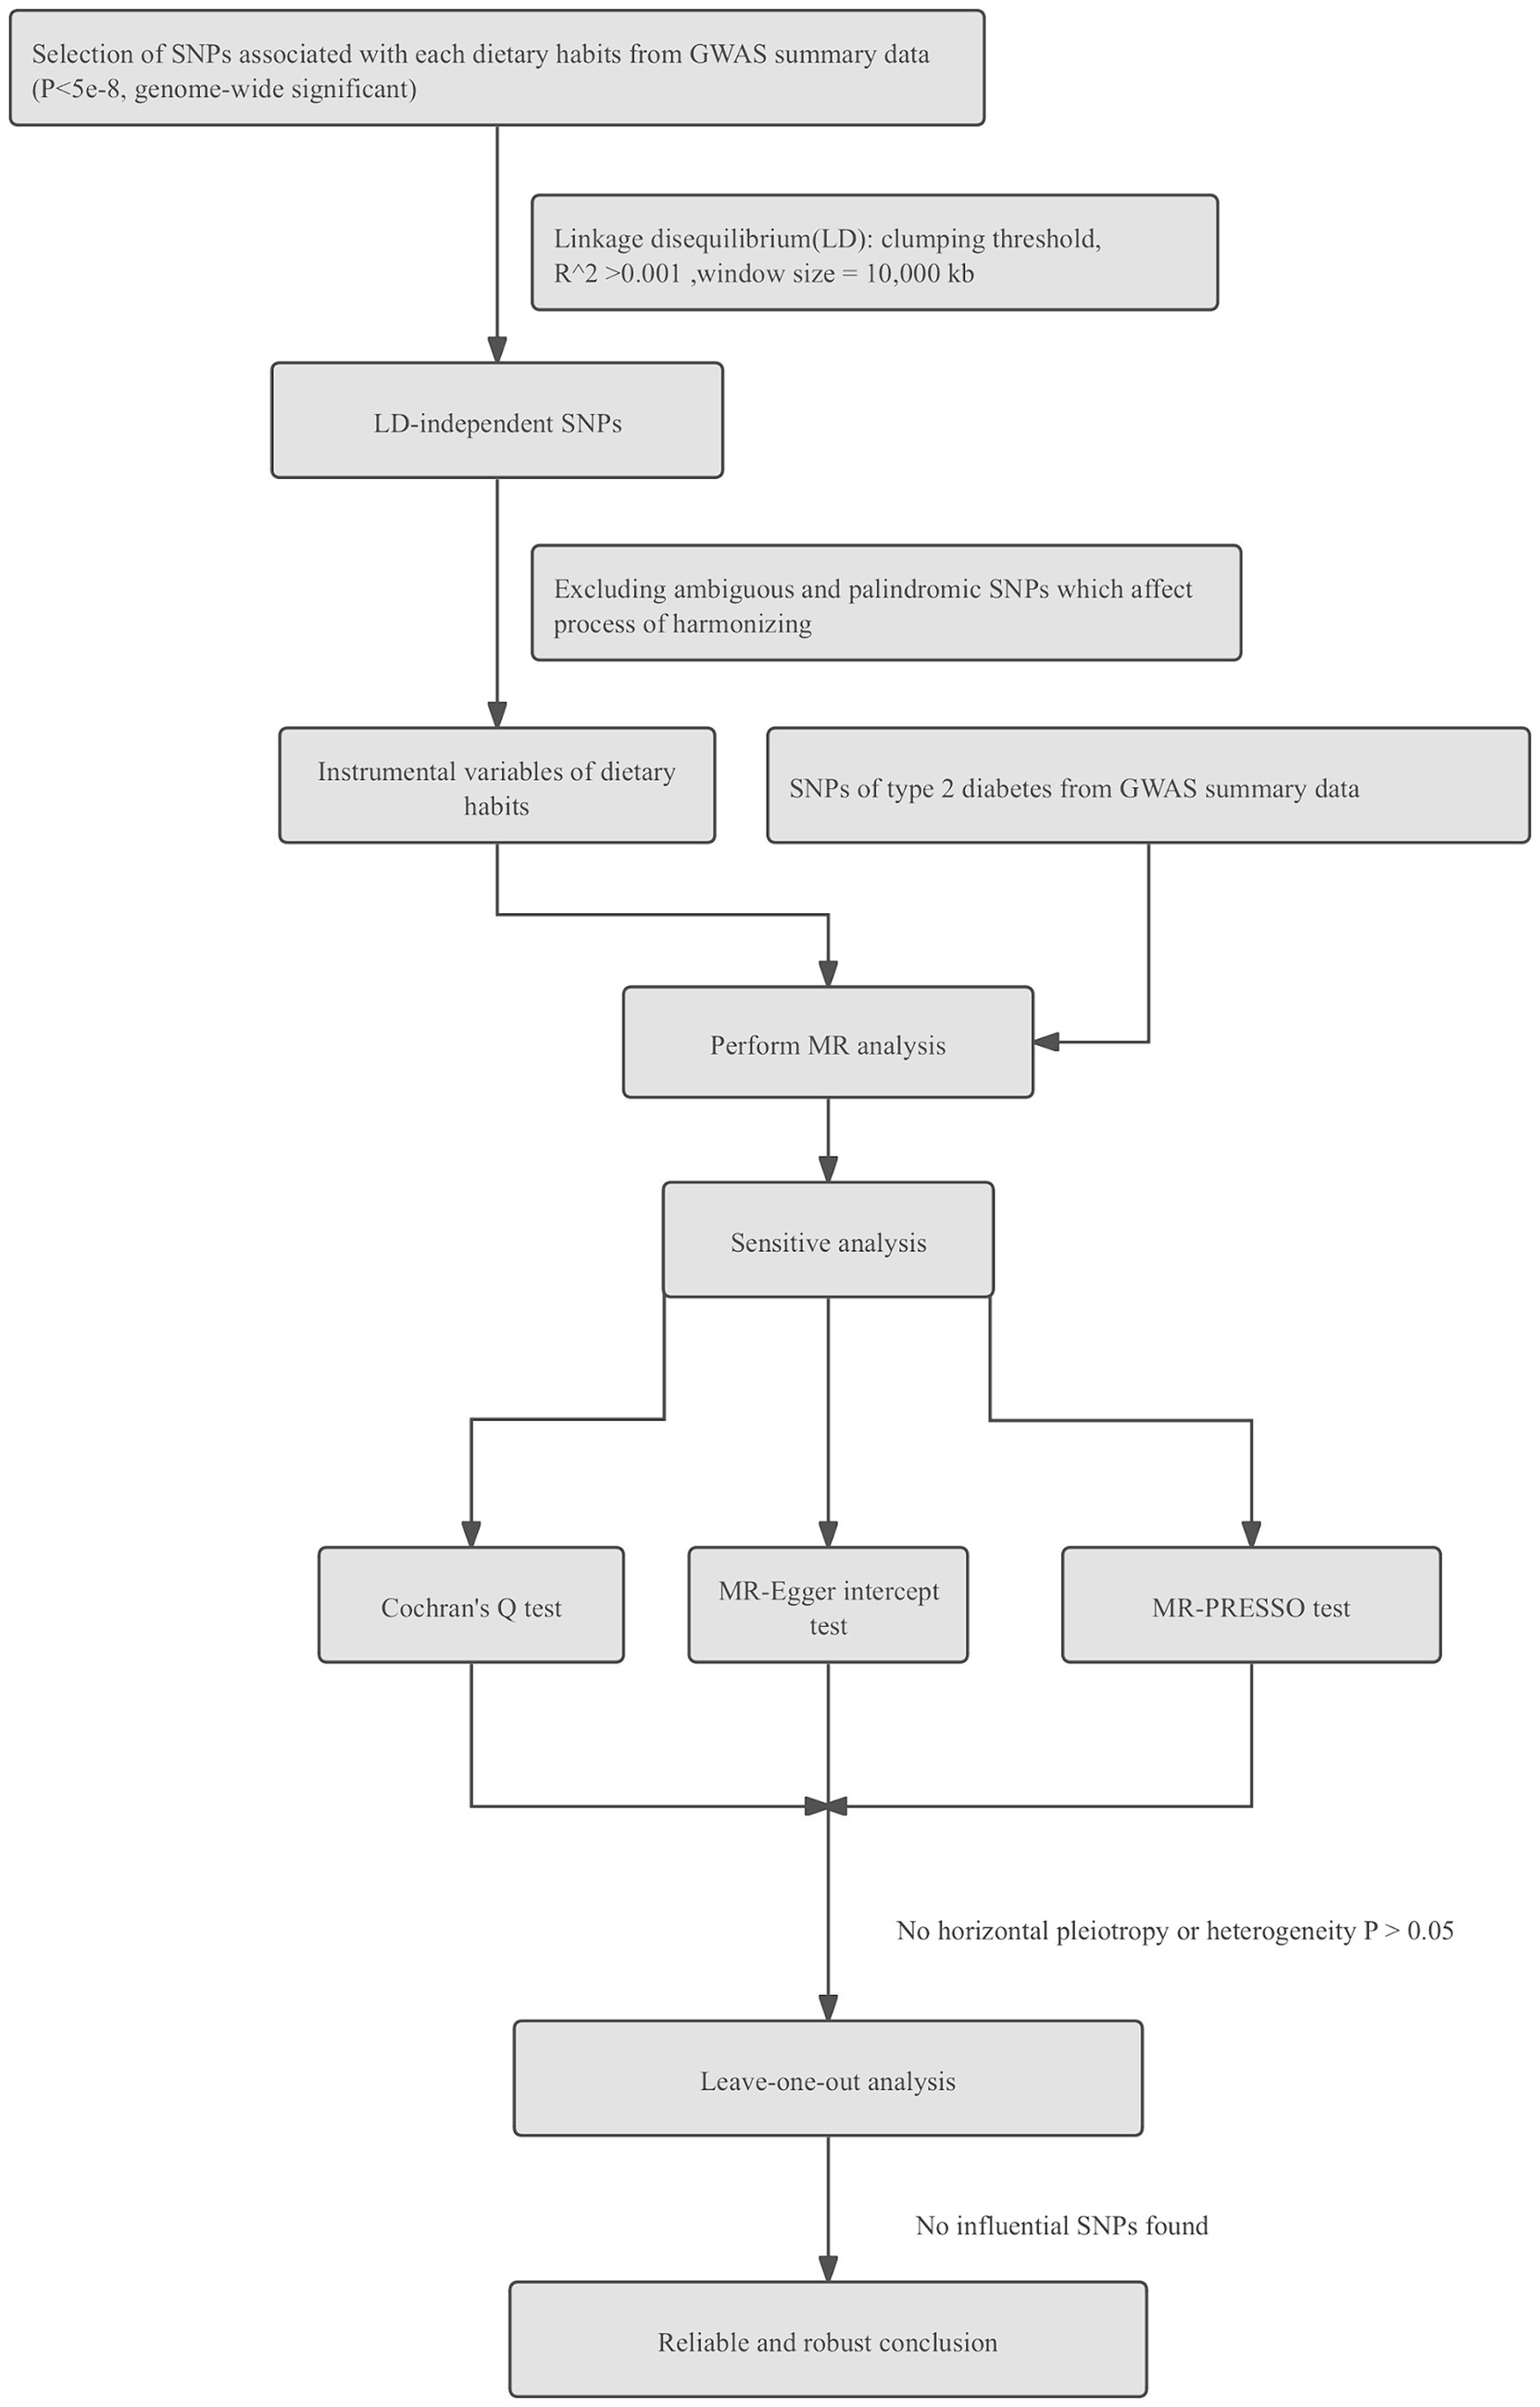
Figure 1. Flow chart of steps for Mendelian randomization analysis in this study.
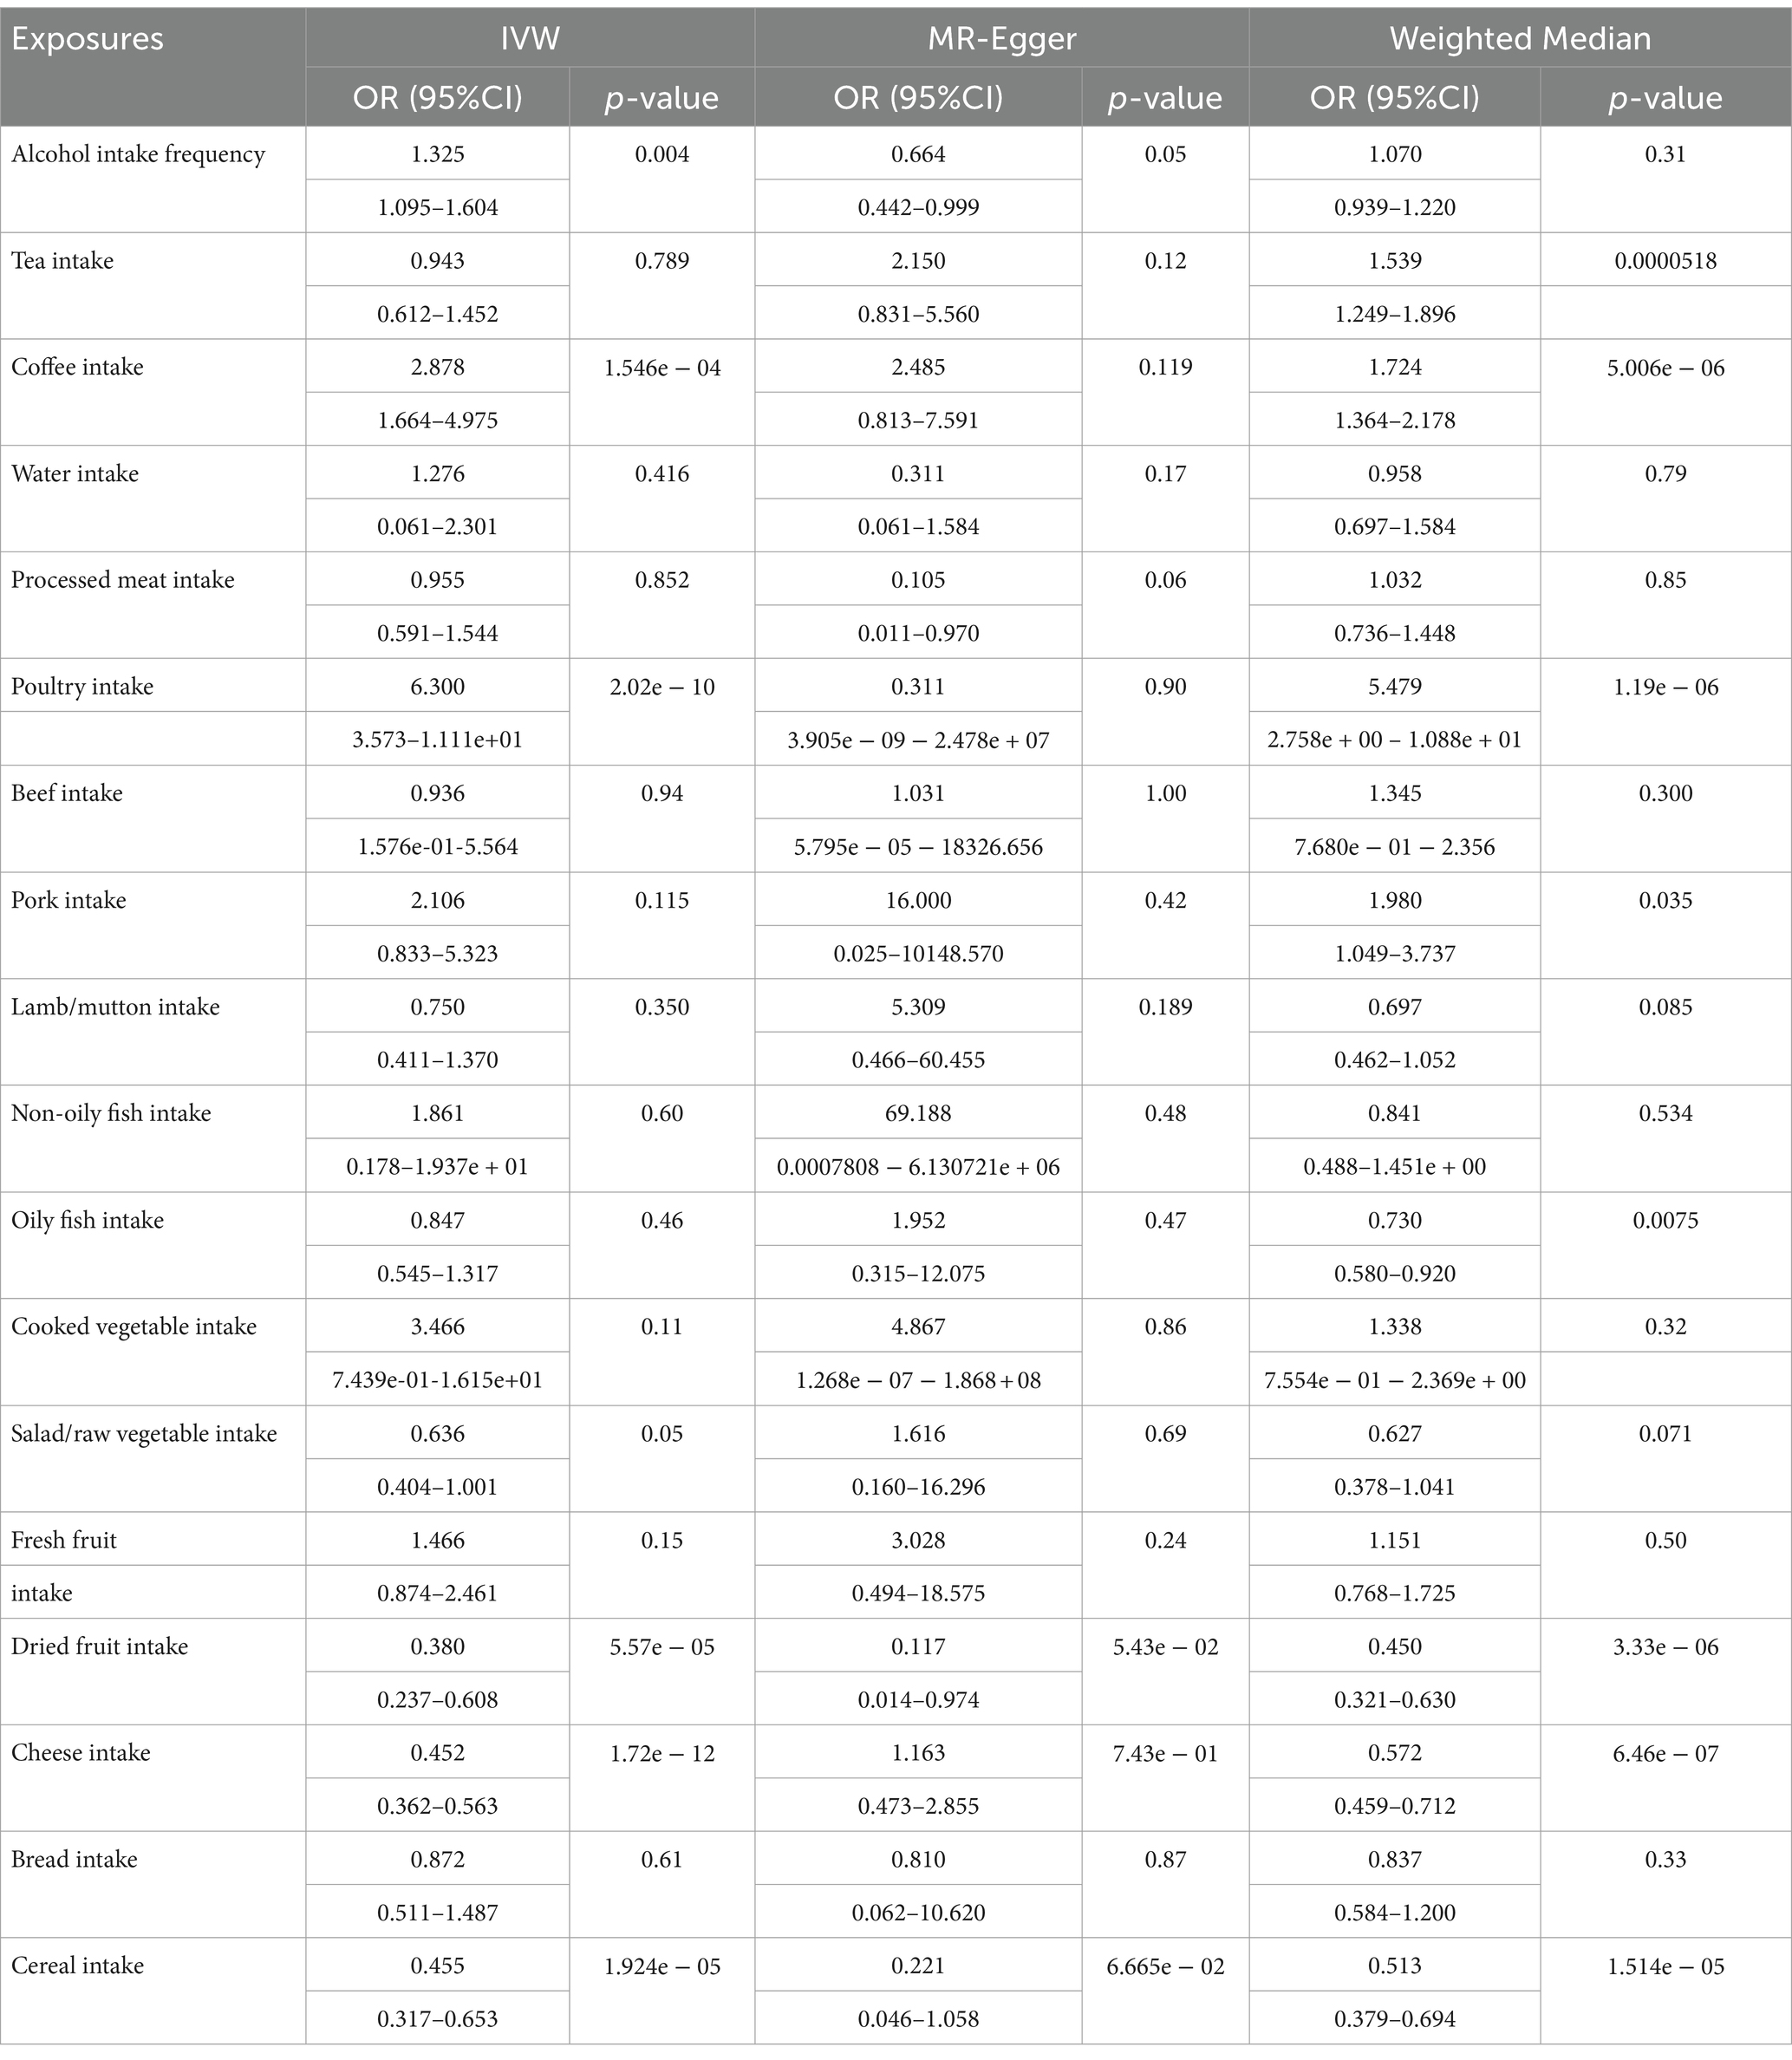
Table 2. MR analysis results of different methods for evaluating the causality between dietary habits and T2D.
Coffee intake was considered as a risk factor and genetically associated with increasing risk of T2D (IVW: OR, 2.878, 95%CI, 1.664–4.975, p = 1.546e − 04; WMM: OR, 1.724, 95%CI, 1.364–2.178, p = 5.006e − 06). Heterogeneity tests showed there was obvious heterogeneity (IVW, Cochran’s Q test, p = 2.187e-84; MR-Egger, Cochran’s Q test p = 1.029e − 84). No horizontal pleiotropy was found (p = 0.768 for the MR-Egger intercept test). Based on the MR-PRESSO method, outliers were removed to reduce heterogeneity and horizontal pleiotropy, but the correction result was distorted (p < 2e − 04). Thus, we cannot get a reliable and robust causal effect between coffee intake and T2D.
Poultry intake was related to a higher risk of T2D according to the MR estimate results (IVW: OR,6.30,95%CI,3.573–11.11, p = 2.02e-10; WMM: OR,5.479,95%CI,0.2758–10.88, p = 1.19e-06). Heterogeneity and horizontal pleiotropy were not significant in sensitive analysis (IVW, Cochran’s Q test, p = 0.172; MR-Egger, Cochran’s Q test, p = 0.115; MR-Egger intercept test: p = 0.756). MR-PRESSO method did not find outliers and no influential SNPs in the “leave-one-out” analysis (Figure 2). We can get a robust and reliable causal association genetically between poultry intake and T2D that poultry intake was a risk factor for T2D.
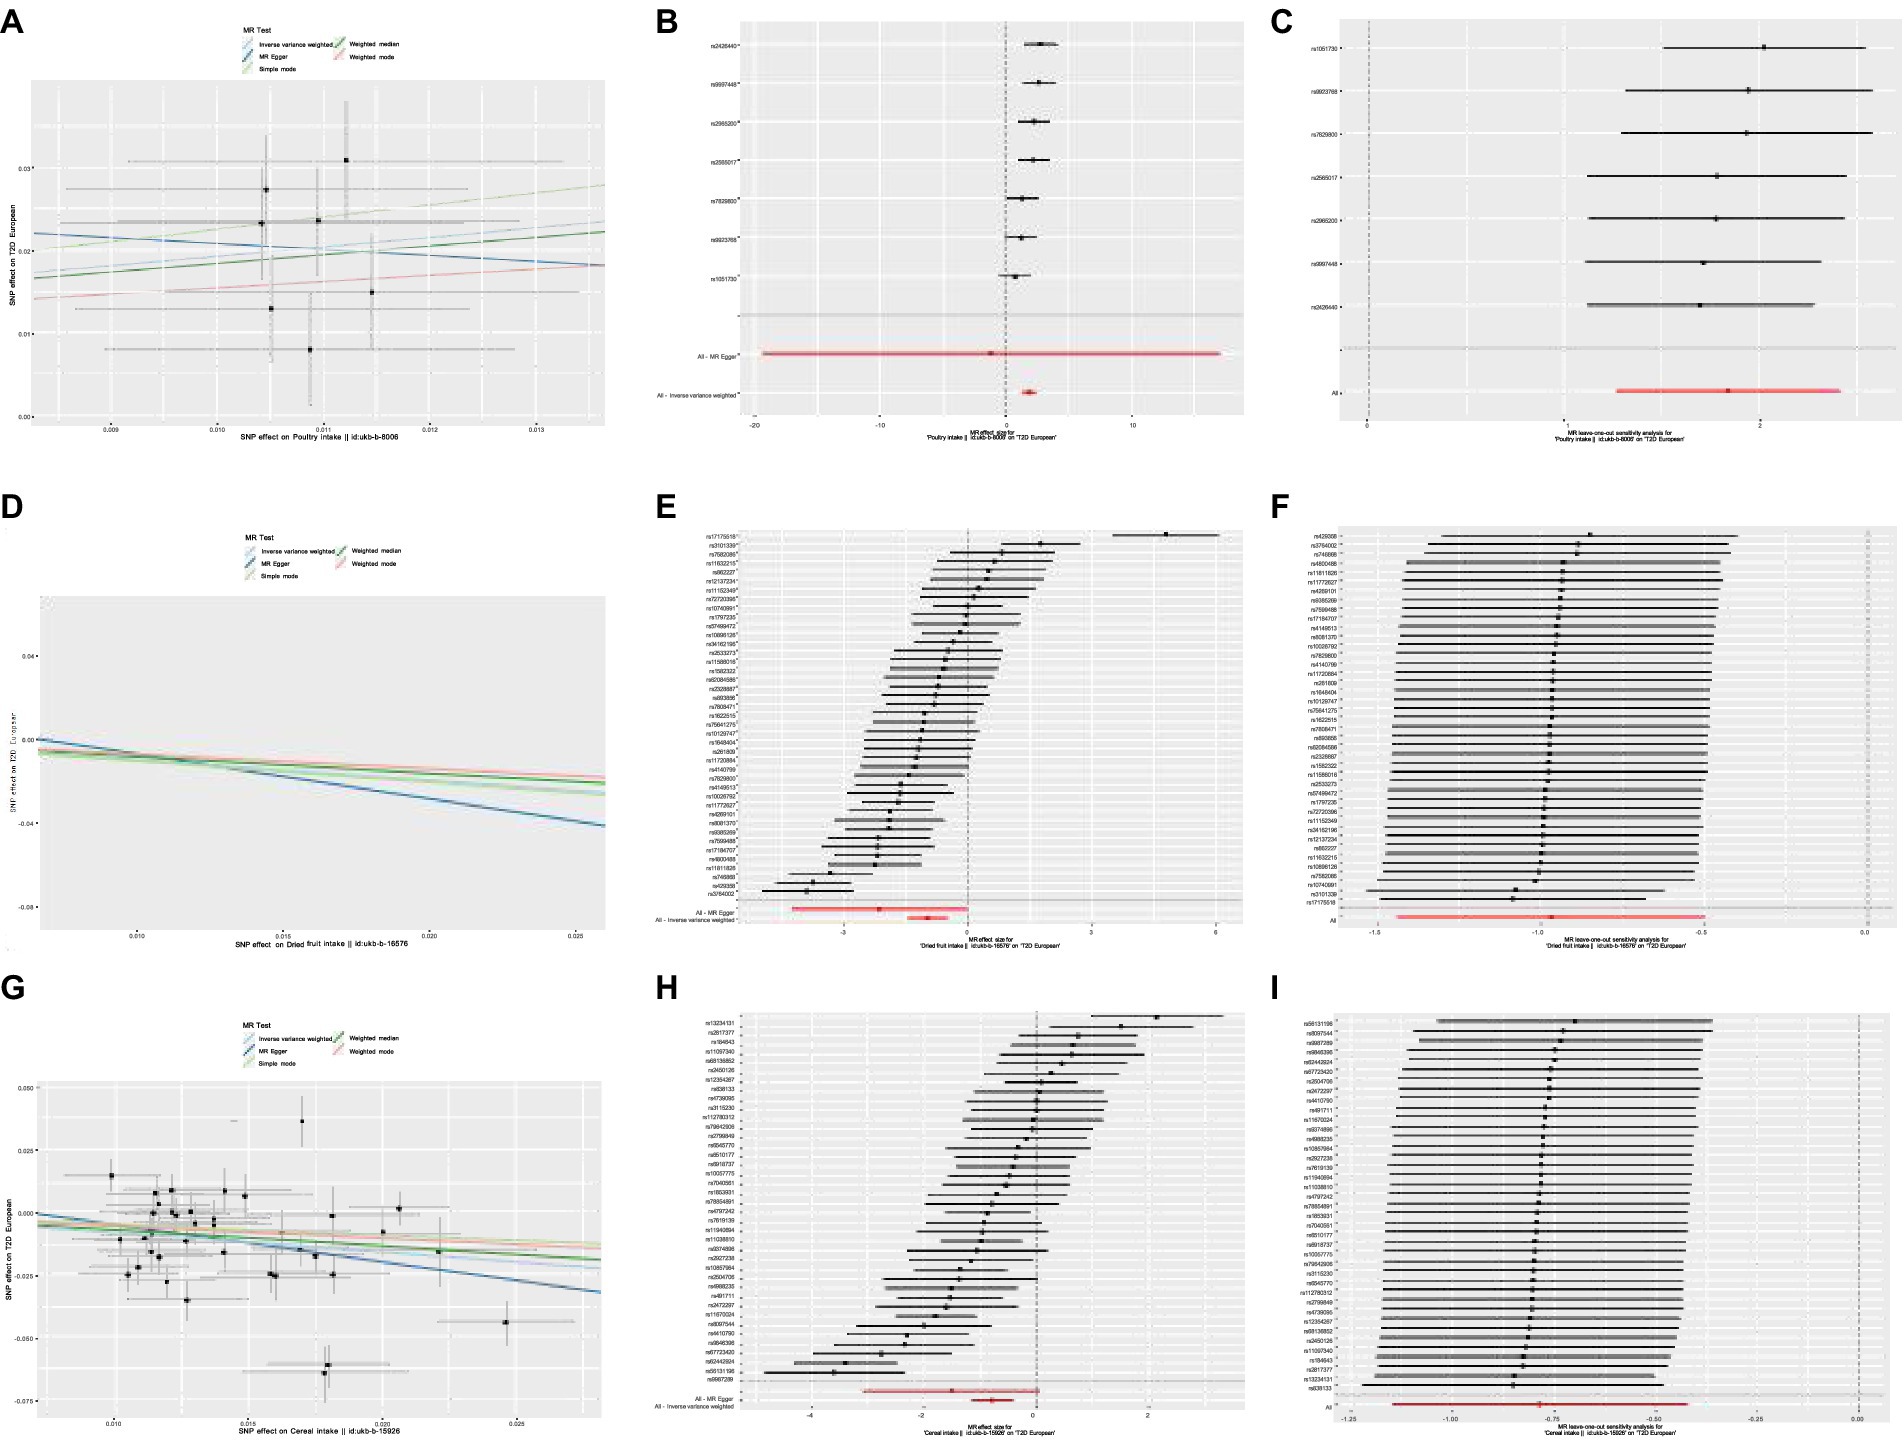
Figure 2. (A) Scatter plot showing the effect of SNPs on Poultry intake vs. T2D. (B) Forest plot of Mendelian randomization effect size for Poultry intake on T2D. (C) Leave-one-out analysis of the effect of Poultry intake on T2D. (D) Scatter plot showing the effect of SNPs on Dried fruit intake vs. T2D. (E) Forest plot of Mendelian randomization effect size for Dried fruit intake on T2D. (F) Leave-one-out analysis of the effect of Dried fruit on T2D. (G) Scatter plot showing the effect of SNPs on Cereal intake vs. T2D. (H) Forest plot of Mendelian randomization effect size for Cereal intake on T2D. (I) Leave-one-out analysis of the effect of Cereal intake on T2D.
Dried fruit intake decreased the risk of T2D genetically (IVW: OR,0.380,95%CI,0.237–0.608, p = 5.57e − 05; WMM: OR,0.450,95%CI,0.321–0.630, p = 3.33e − 06). The existence of heterogeneity had been proved in heterogeneity tests (IVW, Cochran’s Q test, p = 3.523e − 36; MR-Egger, Cochran’s Q test, p = 4.939e − 35); no significant evidence of horizontal pleiotropy existed in (MR-Egger intercept close to 0). Outliers were removed in the MR-PRESSO test and there were no significant differences in effect association estimation after correction (p = 0.69). “Leave-one-out” analysis did not suggest any influential SNPs (Figure 2). A reliable causal relationship between dried fruit intake and T2D can be drawn.
Cheese intake was associated with T2D genetically (IVW: OR,0.452,95%CI,0.362–0.563, p = 1.72e − 12; WMM: OR,0.572,95%CI,0.459–0.712, p = 6.46e − 07). However, there was significant horizontal pleiotropy in the MR-Egger intercept test (p = 0.038). We cannot draw firm conclusions about a causal relationship between cheese consumption and T2D.
The results of MR analysis showed that cereal intake was closely related to T2D, and cereal intake could reduce the risk of T2D (IVW: OR,0.455,95%CI,0.317–0.653, p = 1.924e − 05; WMM: OR,0.513,95%CI,0.379–0.694, p = 1.514e − 05). The heterogeneity test demonstrated there was significant heterogeneity (IVW, Cochran’s Q test, p = 5.061e − 20; MR-Egger, Cochran’s Q test, p = 1.171e − 19). No horizontal pleiotropy was detected (MR-Egger intercept test: p = 0.358). The correction after removing outliers was not distorted in the MR-PRESSO test (p = 0.461). “Leave-one-out” suggested no influential SNPs existing (Figure 2). A reliable causal association between cereal intake and T2D can be drawn.
We conducted reverse Mendelian randomization (MR) analysis, with T2D as exposures and dietary habits as outcomes. Our findings indicated no significant association of T2D with poultry intake, dried fruit intake, and cereal intake, affirming the robustness of our previous results. Reverse MR estimates and sensitivity analysis outcomes are detailed in Supplementary Tables S2, S3.
In this two-sample MR, we systemically evaluated the causal associations of 18 dietary habits with T2D using the most extensive diet GWAS results accessible to date. Our study identified potential protective effects of dried fruit intake and cereal intake against T2D. Conversely, poultry intake was associated with an increased risk of T2D, while other dietary habits showed no significant effects on T2D risk. These findings remained consistent and robust following sensitivity analyses. Additionally, we observed genetic associations of T2D with coffee consumption and cheese consumption; however, definitive causal conclusions were limited due to the presence of horizontal pleiotropy.
In our study, we employed a two-sample MR design to investigate the causal association between various types of meat intake and T2D. Genetic variations served as instrumental variables for assessing meat intake. We examined five distinct exposures to meat, each representing different types: poultry, processed meat, beef, pork, lamb/mutton, and non-oily/oily fish. Previous studies that did not consistently differentiate between these types of meat may have contributed to conflicting findings. Our findings suggested a protective effect of poultry intake against T2D, whereas no significant associations were observed for processed meat, beef, pork, lamb/mutton, and non-oily/oily fish consumption in relation to T2D risk.
Based on its impact on obesity development, individuals who consume poultry generally have a lower incidence of type 2 diabetes compared to those who consume other types of meat (25). A reduced risk of type 2 diabetes was observed among individuals in Denmark when they replaced processed red meats (such as beef, veal, pork, lamb/mutton) with chicken, substituted whole or processed red meats with fish, and exchanged processed red meats for unprocessed red meats (26). Diabetes and poultry consumption were not significantly correlated in the Chinese cohort study of the China Kadoorie Biobank (27). These differences may be due to the mean consumption of poultry in the current study population being significantly lower than that of red meat (28). A meta-analysis of 12 different dietary groups was carried out and found a positive relationship between red, processed meat and the risk of T2D (10, 29, 30). However, in Japanese, higher red meat intake is connected with an increased risk of T2D in males but not in women (31). In Chinese adults, especially in urban participants, intake of red meat is linked to a higher risk of T2D and cardiometabolic illnesses (27). Unlike previous studies, we did a more detailed classification of red meat, for example, beef, pork, and lamb/mutton, and found that there was no significant relationship between red meat and T2D. Possible reasons include the breeding process, where commercially bred chickens may be exposed to hormones and antibiotics, which can act as endocrine disruptors and potentially affect glucose metabolism. Additionally, processed chicken products often contain high levels of sodium and preservatives. Cooking methods also play a role, as fried or fat-added chicken products can be high in saturated and trans fats. These cooking methods can lead to the formation of advanced glycation end products (AGEs) through frying, grilling, and high-temperature baking. These fats and compounds are known to increase oxidative stress and inflammation, which are contributing factors to the onset and progression of type 2 diabetes (T2D) (32). Therefore, both the nutritional and non-nutritional components of poultry may have dual effects on human health, potentially influencing outcomes positively or negatively. Different studies have yielded inconclusive results regarding the impact of meat consumption on T2D, which could be attributed to differences in study designs and methodologies, such as variations in food frequency surveys and varying levels of residual confounding. These differences may also reflect potential distinctions between Eastern and Western dietary habits.
Fish intake and the risk of T2D remain controversial. In our study, we did not find a causal relationship between non-oily/oily fish and T2D. However, some studies have reported a positive association between fish intake and T2D risk. Fish intake has been found to be positively correlated with diabetes risk, particularly among urban participants, and with cardiometabolic illnesses in Chinese adults (27). However, Some research results do not support the fish for the beneficial effect of T2D (33, 34). There was also a study that found fish/seafood and marine LC n-3 PUFA intake had no significant impact on the risk of T2D, whereas oily fish intake had a significant impact (35). The varying research results may be attributed to several factors: the potential influence of dietary toxins in fish on the association with T2D (36), differences in the types of fish consumed (lean, fatty, and shellfish), variations in dietary factors found in fish, differences in preparation methods, and varying levels of contamination across different countries (8, 37).
Wholegrain cereals have been reported to alleviate metabolic symptoms associated with T2D, including insulin resistance, lipid disorders, and obesity, by improving oxidative status, inflammatory markers, and gut microbiota (38–41). The current study provided robust evidence that cereal intake may reduce the risk of T2D, consistent with findings from previous research (42). However, both the bioactive components in cereal and the processing affect the glycemic response (38). The anti-diabetic properties of whole grains synergistically leverage their distinct bioactivities rather than relying on any single component (38). More research is needed to confirm this concept. Although specific information on cereal kinds, such as bran, oat, biscuit, and other kinds, was available in UK Biobank, GWAS summary statistics of these particular cereal types were all underpowered and found very few or no significant variants (43). As a result, we were unable to do MR analysis to determine the effect of different cereal kinds on the risk of T2D because reliable IVs were unavailable.
Previous studies found a higher diet of specific whole fruits, particularly blueberries, grapes, and apples, is connected with a significantly lower risk of type 2 diabetes (6, 44, 45). Conversely, greater consumption of fruit juice is linked with a higher risk (46, 47). However, evidence suggests a non-linear dose–response relationship; increasing fruit intake to 200–300 g/day reduces the risk of T2D by 10%, with no additional benefit observed beyond this level (10). In our study, we observed a significant association between dried fruit intake and T2D risk. Traditional dried fruits (i.e., those without added sugar), such as grapes, have been shown to reduce the risk of diabetes, likely due to the modulation of insulin resistance status by grape polyphenol extracts (48–51).
It has been suggested by some evidence that intakes of coffee, tea, and plain water were inversely associated with glucose and obesity (52–55), but several other studies have failed to replicate these associations (54, 56, 57). Confounding factors, such as differences in study design, methods of consumption quantification, beverage temperatures, and cigarette smoking, as well as variations in genetic and environmental factors such as race, sex, age, lifestyle, gut microbiota, and genetic polymorphisms, could potentially explain these discrepancies (56).
MR study, a carefully designed study with a large sample size, could help resolve this controversial issue. This is consistent with the results of other studies (13, 58). The inverse relationship between genetically proxied coffee consumption and plasma caffeine levels (i.e., the genetic variants with the strongest association with higher coffee consumption are associated with lower plasma caffeine levels) and the lack of association (e.g., from fat mass or other hot beverages or caffeine-containing drinks) may be caused by pleiotropic effects of the SNPs used (59, 60). We found no significant causal association between alcohol frequency intake, tea intake, coffee intake water intake, and T2D.
There are some limitations of our study. Firstly, due to the limitations of publicly accessible GWAS summary statistics, we only assessed the overall effects of food on T2D that were adjusted for sex and age. Secondly, the current study only included people of European ancestry, the findings may not be generalizable to other populations. Furthermore, some specific dietary patterns, for example, Mediterranean diet and Western diet, were not studied in our study, due to a lack of data. A subsample of UKBB was given repeated dietary evaluations every 3–4 months, and the results demonstrated moderate to substantial agreement with the answers to the dietary touchscreen questions at baseline (43). Thus, recall bias and seasonal variation could be ruled out.
However, this study represents one of the most comprehensive MR investigations to date into the causal role of dietary habits on the risk of T2D. To enhance statistical power, we utilized summary statistics from large-scale GWAS meta-analyses. Furthermore, sensitivity analyses demonstrated the reliability and robustness of our findings. Importantly, the primary exposure variables in our study exhibited good reproducibility and validity. Identifying protective dietary habits for T2D is critical for primary prevention. However, caution is warranted in interpreting the evidence of causality from our study. We emphasize the necessity for further research to validate and generalize our findings across different populations and settings.
Nutritional advice should be tailored to individual circumstances, including socioeconomic status, cultural background, personal preferences, and health conditions. For instance, adopting a low-carbohydrate, high-fiber diet can enhance glycemic control and optimize the effectiveness of medications like metformin and insulin (61). Certain foods rich in specific nutrients can interact with medications; for instance, foods high in vitamin K can influence the efficacy of anticoagulants used by diabetics with cardiovascular disease (62) Additionally, dietary patterns that facilitate weight loss can enhance insulin sensitivity, potentially reducing the required dosage of medications (63). Therefore, consulting with a certified dietitian or healthcare professional is recommended to create a personalized diet plan that aligns with individual needs and health goals.
Based on our findings, we offer the following dietary recommendations: Firstly, avoid choosing to consume poultry that has been overexposed to hormones and antibiotics during the feeding process. In addition, avoid choosing poultry that is overly processed with too much-added sodium and preservatives. Choose simple cooking methods such as baking or steaming and avoid frying and grilling (32). Secondly, moderate intake of dried fruits with simple ingredients is recommended in daily life; many dried fruits are rich in antioxidant vitamins, and the dietary fiber in dried fruits modulates gut microbiology and influences lipid and glucose metabolism and immune homeostasis (48, 64–66). Finally, in terms of staple foods in the diet, choosing the right amount of cereals—typically low in added sugars and high in fiber—can be beneficial in preventing T2D (67). Most importantly, adopting a combination of low-risk lifestyle behaviors—including maintaining a healthy weight, consuming a balanced diet, engaging in regular physical activity, refraining from smoking or excessive alcohol consumption, and drinking alcohol in moderation—has been associated with a lower risk of developing type 2 diabetes (68).
This two-sample MR study demonstrated a causal effect of poultry intake, dried fruit intake, and cereal intake on T2D. Specifically, poultry intake was identified as a genetic risk factor for T2D, whereas dried fruit intake and cereal intake were found to be protective factors. Further validation of these novel findings and investigation into potential underlying mechanisms are warranted.
The original contributions presented in the study are included in the article/Supplementary material, further inquiries can be directed to the corresponding author.
The studies involving humans were approved by All GWAS summary data came from a public database, no raw data was used for this study. UK Biobank has approval from the North West Multi-centre Research Ethics Committee (MREC) as a Research Tissue Bank (RTB) approval, detailed information can be found in 241 https://www.ukbiobank.ac.uk/learn-more-about-uk-biobank/about-us/ethics. DIAGRAM Consortium is available from: http://www.diagram-consortium.org/pub.html. Thus, there are no ethical problems in this article. The studies were conducted in accordance with the local legislation and institutional requirements. The participants provided their written informed consent to participate in this study.
RX: Conceptualization, Methodology, Software, Writing – original draft. LD: Investigation, Visualization, Writing – review & editing. BX: Supervision, Writing – review & editing. BL: Supervision, Writing – review & editing.
The author(s) declare that financial support was received for the research, authorship, and/or publication of this article. This study was supported by the Postgraduate Innovation Fund of the Fifth Clinical College of Chongqing Medical University (Grant ID: YJSCX202301, project leader: RX) and the Natural Science Foundation of Yongchuan District Science and Technology Bureau (Grant ID: 2022yc-jckx20012, project leader: LD).
The authors would like to express their gratitude to Zhenming Liu for his guidance and expertise in R language programming.
The authors declare that the research was conducted in the absence of any commercial or financial relationships that could be construed as potential conflicts of interest.
All claims expressed in this article are solely those of the authors and do not necessarily represent those of their affiliated organizations, or those of the publisher, the editors and the reviewers. Any product that may be evaluated in this article, or claim that may be made by its manufacturer, is not guaranteed or endorsed by the publisher.
The Supplementary material for this article can be found online at: https://www.frontiersin.org/articles/10.3389/fnut.2024.1414678/full#supplementary-material
1. Ogurtsova, K, da Rocha Fernandes, JD, Huang, Y, Linnenkamp, U, Guariguata, L, Cho, NH, et al. IDF diabetes atlas: global estimates for the prevalence of diabetes for 2015 and 2040. Diabetes Res Clin Pract. (2017) 128:40–50. doi: 10.1016/j.diabres.2017.03.024
2. Ojo, O. Recent advances in nutrition and diabetes. Nutrients. (2021) 13:1573. doi: 10.3390/nu13051573
3. Amercian Diabetes Association. 5. Prevention or delay of type 2 diabetes: standards of medical Care in Diabetes-2018. Diabetes Care. (2018) 41:S51–s54. doi: 10.2337/dc18-S005
4. Tuomilehto, J, Lindström, J, Eriksson, JG, Valle, TT, Hämäläinen, H, Ilanne-Parikka, P, et al. Prevention of type 2 diabetes mellitus by changes in lifestyle among subjects with impaired glucose tolerance. N Engl J Med. (2001) 344:1343–50. doi: 10.1056/NEJM200105033441801
5. Aune, D, Norat, T, Romundstad, P, and Vatten, LJ. Whole grain and refined grain consumption and the risk of type 2 diabetes: a systematic review and dose-response meta-analysis of cohort studies. Eur J Epidemiol. (2013) 28:845–58. doi: 10.1007/s10654-013-9852-5
6. Li, M, Fan, Y, Zhang, X, Hou, W, and Tang, Z. Fruit and vegetable intake and risk of type 2 diabetes mellitus: meta-analysis of prospective cohort studies. BMJ Open. (2014) 4:e005497. doi: 10.1136/bmjopen-2014-005497
7. Wallin, A, Forouhi, NG, Wolk, A, and Larsson, SC. Egg consumption and risk of type 2 diabetes: a prospective study and dose-response meta-analysis. Diabetologia. (2016) 59:1204–13. doi: 10.1007/s00125-016-3923-6
8. Xun, P, and He, K. Fish consumption and incidence of diabetes: meta-analysis of data from 438,000 individuals in 12 independent prospective cohorts with an average 11-year follow-up. Diabetes Care. (2012) 35:930–8. doi: 10.2337/dc11-1869
9. Luo, C, Zhang, Y, Ding, Y, Shan, Z, Chen, S, Yu, M, et al. Nut consumption and risk of type 2 diabetes, cardiovascular disease, and all-cause mortality: a systematic review and meta-analysis. Am J Clin Nutr. (2014) 100:256–69. doi: 10.3945/ajcn.113.076109
10. Schwingshackl, L, Hoffmann, G, Lampousi, AM, Knüppel, S, Iqbal, K, Schwedhelm, C, et al. Food groups and risk of type 2 diabetes mellitus: a systematic review and meta-analysis of prospective studies. Eur J Epidemiol. (2017) 32:363–75. doi: 10.1007/s10654-017-0246-y
11. Cole, JB, Florez, JC, and Hirschhorn, JN. Comprehensive genomic analysis of dietary habits in UK biobank identifies hundreds of genetic associations. Nat Commun. (2020) 11:1467. doi: 10.1038/s41467-020-15193-0
12. Matoba, N, Akiyama, M, Ishigaki, K, Kanai, M, Takahashi, A, Momozawa, Y, et al. GWAS of 165,084 Japanese individuals identified nine loci associated with dietary habits. Nat Hum Behav. (2020) 4:308–16. doi: 10.1038/s41562-019-0805-1
13. Yuan, S, and Larsson, SC. An atlas on risk factors for type 2 diabetes: a wide-angled Mendelian randomisation study. bioRxiv. (2019). doi: 10.1101/2020.08.10.244293
14. Ben Elsworth, M.L., Alexander, Tessa, Liu, Yi, Matthews, Peter, Hallett, Jon, et al. The MRC IEU OpenGWAS data infrastructure. Diabetologia. (2020) 63:2359–71. doi: 10.1007/s00125-020-05253-x
15. Collins, R. What makes UK biobank special? Lancet. (2012) 379:1173–4. doi: 10.1016/S0140-6736(12)60404-8
16. DIAGRAM Consortium. (2022). Available at: http://www.diagram-consortium.org/pub.html
17. Mahajan, A, Spracklen, CN, Zhang, W, Ng, MCY, Petty, LE, Kitajima, H, et al. Multi-ancestry genetic study of type 2 diabetes highlights the power of diverse populations for discovery and translation. Nat Genet. (2022) 54:560–72. doi: 10.1038/s41588-022-01058-3
18. Burgess, S, Small, DS, and Thompson, SG. A review of instrumental variable estimators for Mendelian randomization. Stat Methods Med Res. (2017) 26:2333–55. doi: 10.1177/0962280215597579
19. Bowden, J, del Greco M, F, Minelli, C, Zhao, Q, Lawlor, DA, Sheehan, NA, et al. Improving the accuracy of two-sample summary-data Mendelian randomization: moving beyond the NOME assumption. Int J Epidemiol. (2019) 48:728–42. doi: 10.1093/ije/dyy258
20. Burgess, S, Butterworth, A, and Thompson, SG. Mendelian randomization analysis with multiple genetic variants using summarized data. Genet Epidemiol. (2013) 37:658–65. doi: 10.1002/gepi.21758
21. Burgess, S, and Thompson, SG. Interpreting findings from Mendelian randomization using the MR-egger method. Eur J Epidemiol. (2017) 32:377–89. doi: 10.1007/s10654-017-0255-x
22. Bowden, J, Davey Smith, G, Haycock, PC, and Burgess, S. Consistent estimation in Mendelian randomization with some Invalid instruments using a weighted median estimator. Genet Epidemiol. (2016) 40:304–14. doi: 10.1002/gepi.21965
23. Verbanck, M, Chen, CY, Neale, B, and do, R. Detection of widespread horizontal pleiotropy in causal relationships inferred from Mendelian randomization between complex traits and diseases. Nat Genet. (2018) 50:693–8. doi: 10.1038/s41588-018-0099-7
24. Ong, JS, and MacGregor, S. Implementing MR-PRESSO and GCTA-GSMR for pleiotropy assessment in Mendelian randomization studies from a practitioner's perspective. Genet Epidemiol. (2019) 43:609–16. doi: 10.1002/gepi.22207
25. Boonpor, J, Petermann-Rocha, F, Parra-Soto, S, Pell, JP, Gray, SR, Celis-Morales, C, et al. Types of diet, obesity, and incident type 2 diabetes: findings from the UK biobank prospective cohort study. Diabetes Obes Metab. (2022) 24:1351–9. doi: 10.1111/dom.14711
26. Ibsen, DB, Warberg, CK, Würtz, AML, Overvad, K, and Dahm, CC. Substitution of red meat with poultry or fish and risk of type 2 diabetes: a Danish cohort study. Eur J Nutr. (2019) 58:2705–12. doi: 10.1007/s00394-018-1820-0
27. on behalf of the China Kadoorie Biobank collaborative groupdu, H, Guo, Y, Bennett, DA, Bragg, F, Bian, Z, et al. Red meat, poultry and fish consumption and risk of diabetes: a 9 year prospective cohort study of the China Kadoorie biobank. Diabetologia. (2020) 63:767–79. doi: 10.1007/s00125-020-05091-x
28. Feskens, EJ, Sluik, D, and van Woudenbergh, GJ. Meat consumption, diabetes, and its complications. Curr Diab Rep. (2013) 13:298–306. doi: 10.1007/s11892-013-0365-0
29. Pan, A, Sun, Q, Bernstein, AM, Schulze, MB, Manson, JAE, Willett, WC, et al. Red meat consumption and risk of type 2 diabetes: 3 cohorts of US adults and an updated meta-analysis. Am J Clin Nutr. (2011) 94:1088–96. doi: 10.3945/ajcn.111.018978
30. Villegas, R, Shu, XO, Gao, YT, Yang, G, Cai, H, Li, H, et al. The association of meat intake and the risk of type 2 diabetes may be modified by body weight. Int J Med Sci. (2006) 3:152–9. doi: 10.7150/ijms.3.152
31. Kurotani, K, Nanri, A, Goto, A, Mizoue, T, Noda, M, Oba, S, et al. Red meat consumption is associated with the risk of type 2 diabetes in men but not in women: a Japan public health center-based prospective study. Br J Nutr. (2013) 110:1910–8. doi: 10.1017/S0007114513001128
32. Connolly, G, and Campbell, WW. Poultry consumption and human Cardiometabolic health-related outcomes: a narrative review. Nutrients. (2023) 15:550. doi: 10.3390/nu15163550
33. Kaushik, M, Mozaffarian, D, Spiegelman, D, Manson, JAE, Willett, WC, and Hu, FB. Long-chain omega-3 fatty acids, fish intake, and the risk of type 2 diabetes mellitus. Am J Clin Nutr. (2009) 90:613–20. doi: 10.3945/ajcn.2008.27424
34. van Woudenbergh, GJ, van Ballegooijen, AJ, Kuijsten, A, Sijbrands, EJG, van Rooij, FJA, Geleijnse, JM, et al. Eating fish and risk of type 2 diabetes: a population-based, prospective follow-up study. Diabetes Care. (2009) 32:2021–6. doi: 10.2337/dc09-1042
35. Zhang, M, Picard-Deland, E, and Marette, A. Fish and marine omega-3 polyunsatured fatty acid consumption and incidence of type 2 diabetes: a systematic review and meta-analysis. Int J Endocrinol. (2013) 2013:501015. doi: 10.1155/2013/501015
36. Marushka, L, Batal, M, David, W, Schwartz, H, Ing, A, Fediuk, K, et al. Association between fish consumption, dietary omega-3 fatty acids and persistent organic pollutants intake, and type 2 diabetes in 18 first nations in Ontario, Canada. Environ Res. (2017) 156:725–37. doi: 10.1016/j.envres.2017.04.034
37. Wallin, A, di Giuseppe, D, Orsini, N, Patel, PS, Forouhi, NG, and Wolk, A. Fish consumption, dietary long-chain n-3 fatty acids, and risk of type 2 diabetes: systematic review and meta-analysis of prospective studies. Diabetes Care. (2012) 35:918–29. doi: 10.2337/dc11-1631
38. Wu, W, Qiu, J, Wang, A, and Li, Z. Impact of whole cereals and processing on type 2 diabetes mellitus: a review. Crit Rev Food Sci Nutr. (2020) 60:1447–74. doi: 10.1080/10408398.2019.1574708
39. Weickert, MO, and Pfeiffer, AF. Metabolic effects of dietary fiber consumption and prevention of diabetes. J Nutr. (2008) 138:439–42. doi: 10.1093/jn/138.3.439
40. Liese, AD, Roach, AK, Sparks, KC, Marquart, L, D'Agostino, RB Jr, and Mayer-Davis, EJ. Whole-grain intake and insulin sensitivity: the insulin resistance atherosclerosis study. Am J Clin Nutr. (2003) 78:965–71. doi: 10.1093/ajcn/78.5.965
41. Nettleton, JA, McKeown, N, Kanoni, S, Lemaitre, RN, Hivert, MF, Ngwa, J, et al. Interactions of dietary whole-grain intake with fasting glucose-and insulin-related genetic loci in individuals of European descent: a meta-analysis of 14 cohort studies. Diabetes Care. (2010) 33:2684–91. doi: 10.2337/dc10-1150
42. Cho, SS, Qi, L, Fahey Jr, GC, and Klurfeld, DM. Consumption of cereal fiber, mixtures of whole grains and bran, and whole grains and risk reduction in type 2 diabetes, obesity, and cardiovascular disease. Am J Clin Nutr. (2013) 98:594–619. doi: 10.3945/ajcn.113.067629
43. Chen, TT, Chen, CY, Fang, CP, Cheng, YC, and Lin, YF. Causal influence of dietary habits on the risk of major depressive disorder: a diet-wide Mendelian randomization analysis. J Affect Disord. (2022) 319:482–9. doi: 10.1016/j.jad.2022.09.109
44. Wang, PY, Fang, JC, Gao, ZH, Zhang, C, and Xie, SY. Higher intake of fruits, vegetables or their fiber reduces the risk of type 2 diabetes: a meta-analysis. J Diabetes Investig. (2016) 7:56–69. doi: 10.1111/jdi.12376
45. Boeing, H, Bechthold, A, Bub, A, Ellinger, S, Haller, D, Kroke, A, et al. Critical review: vegetables and fruit in the prevention of chronic diseases. Eur J Nutr. (2012) 51:637–63. doi: 10.1007/s00394-012-0380-y
46. Bondonno, NP, Davey, RJ, Murray, K, Radavelli-Bagatini, S, Bondonno, CP, Blekkenhorst, LC, et al. Associations between fruit intake and risk of diabetes in the AusDiab cohort. J Clin Endocrinol Metab. (2021) 106:e4097–108. doi: 10.1210/clinem/dgab335
47. Muraki, I, Imamura, F, Manson, JE, Hu, FB, Willett, WC, van Dam, RM, et al. Fruit consumption and risk of type 2 diabetes: results from three prospective longitudinal cohort studies. BMJ. (2013) 347:f5001. doi: 10.1136/bmj.f5001
48. Hernández-Alonso, P, Camacho-Barcia, L, Bulló, M, and Salas-Salvadó, J. Nuts and dried fruits: An update of their beneficial effects on type 2 diabetes. Nutrients. (2017) 9:673. doi: 10.3390/nu9070673
49. Overman, A, Bumrungpert, A, Kennedy, A, Martinez, K, Chuang, CC, West, T, et al. Polyphenol-rich grape powder extract (GPE) attenuates inflammation in human macrophages and in human adipocytes exposed to macrophage-conditioned media. Int J Obes. (2010) 34:800–8. doi: 10.1038/ijo.2009.296
50. Aoun, M, Michel, F, Fouret, G, Schlernitzauer, A, Ollendorff, V, Wrutniak-Cabello, C, et al. A grape polyphenol extract modulates muscle membrane fatty acid composition and lipid metabolism in high-fat–high-sucrose diet-fed rats. Br J Nutr. (2011) 106:491–501. doi: 10.1017/S0007114511000602
51. Adam, SH, Giribabu, N, Kassim, N, Kumar, KE, Brahmayya, M, Arya, A, et al. Protective effect of aqueous seed extract of Vitis Vinifera against oxidative stress, inflammation and apoptosis in the pancreas of adult male rats with diabetes mellitus. Biomed Pharmacother. (2016) 81:439–52. doi: 10.1016/j.biopha.2016.04.032
52. Kondo, Y, Goto, A, Noma, H, Iso, H, Hayashi, K, and Noda, M. Effects of coffee and tea consumption on glucose metabolism: a systematic review and network Meta-analysis. Nutrients. (2019) 11:48. doi: 10.3390/nu11010048
53. Ma, L, Hu, Y, Alperet, DJ, Liu, G, Malik, V, Manson, JAE, et al. Beverage consumption and mortality among adults with type 2 diabetes: prospective cohort study. BMJ. (2023) 381:e073406. doi: 10.1136/bmj-2022-073406
54. Kim, HJ, Cho, S, Jacobs, DR Jr, and Park, K. Instant coffee consumption may be associated with higher risk of metabolic syndrome in Korean adults. Diabetes Res Clin Pract. (2014) 106:145–53. doi: 10.1016/j.diabres.2014.07.007
55. Knott, C, Bell, S, and Britton, A. Alcohol consumption and the risk of type 2 diabetes: a systematic review and dose-response Meta-analysis of more than 1.9 million individuals from 38 observational studies. Diabetes Care. (2015) 38:1804–12. doi: 10.2337/dc15-0710
56. Ohishi, T, Fukutomi, R, Shoji, Y, Goto, S, and Isemura, M. The beneficial effects of principal polyphenols from green tea, coffee, wine, and curry on obesity. Molecules. (2021) 26:453. doi: 10.3390/molecules26020453
57. Lee, J, Kim, HY, and Kim, J. Coffee consumption and the risk of obesity in Korean women. Nutrients. (2017) 9:340. doi: 10.3390/nu9121340
58. Wang, X, Jia, J, and Huang, T. Coffee types and type 2 diabetes mellitus: large-scale cross-phenotype association study and Mendelian randomization analysis. Front Endocrinol. (2022) 13:818831. doi: 10.3389/fendo.2022.818831
59. Cornelis, MC, and Munafo, MR. Mendelian randomization studies of coffee and caffeine consumption. Nutrients. (2018) 10:343. doi: 10.3390/nu10101343
60. Yuan, S, Merino, J, and Larsson, SC. Causal factors underlying diabetes risk informed by Mendelian randomisation analysis: evidence, opportunities and challenges. Diabetologia. (2023) 66:800–12. doi: 10.1007/s00125-023-05879-7
61. Chandalia, M, Garg, A, Lutjohann, D, von Bergmann, K, Grundy, SM, and Brinkley, LJ. Beneficial effects of high dietary fiber intake in patients with type 2 diabetes mellitus. N Engl J Med. (2000) 342:1392–8. doi: 10.1056/NEJM200005113421903
62. Goldstein, R, Jacobs, AR, Zighan, L, Gronich, N, Bialer, M, and Muszkat, M. Interactions between direct Oral anticoagulants (DOACs) and Antiseizure medications: potential implications on DOAC treatment. CNS Drugs. (2023) 37:203–14. doi: 10.1007/s40263-023-00990-0
63. Pașc, P. Descriptive analysis of real-world medication patterns and one-year outcomes of acute coronary syndrome patients with metabolic syndrome in a tertiary CARE HOSPITAL. Farmacia. (2021) 69:498–508. doi: 10.31925/farmacia.2021.3.12
64. Kim, K, Vance, TM, Chen, MH, and Chun, OK. Dietary total antioxidant capacity is inversely associated with all-cause and cardiovascular disease death of US adults. Eur J Nutr. (2018) 57:2469–76. doi: 10.1007/s00394-017-1519-7
65. McRae, MP. Dietary Fiber is beneficial for the prevention of cardiovascular disease: An umbrella review of Meta-analyses. J Chiropr Med. (2017) 16:289–99. doi: 10.1016/j.jcm.2017.05.005
66. Zeng, Y, Cao, S, and Yang, H. Causal associations between dried fruit intake and cardiovascular disease: a Mendelian randomization study. Front Cardiovasc Med. (2023) 10:1080252. doi: 10.3389/fcvm.2023.1080252
67. Chen, Z, Khandpur, N, Desjardins, C, Wang, L, Monteiro, CA, Rossato, SL, et al. Ultra-processed food consumption and risk of type 2 diabetes: three large prospective U.S. cohort studies. Diabetes Care. (2023) 46:1335–44. doi: 10.2337/dc22-1993
Keywords: dietary habits, risk factors, type 2 diabetes, Mendelian randomization analysis, causal effects
Citation: Xiao R, Dong L, Xie B and Liu B (2024) A diet-wide Mendelian randomization analysis: causal effects of dietary habits on type 2 diabetes. Front. Nutr. 11:1414678. doi: 10.3389/fnut.2024.1414678
Edited by:
Alessandra Bordoni, University of Bologna, ItalyReviewed by:
Cosmin Mihai Vesa, University of Oradea, RomaniaCopyright © 2024 Xiao, Dong, Xie and Liu. This is an open-access article distributed under the terms of the Creative Commons Attribution License (CC BY). The use, distribution or reproduction in other forums is permitted, provided the original author(s) and the copyright owner(s) are credited and that the original publication in this journal is cited, in accordance with accepted academic practice. No use, distribution or reproduction is permitted which does not comply with these terms.
*Correspondence: Bo Xie, Y3FtdXhpZWJvQDE2My5jb20=; Beizhong Liu, bGl1YmVpemhvbmdAY3FtdS5lZHUuY24=
Disclaimer: All claims expressed in this article are solely those of the authors and do not necessarily represent those of their affiliated organizations, or those of the publisher, the editors and the reviewers. Any product that may be evaluated in this article or claim that may be made by its manufacturer is not guaranteed or endorsed by the publisher.
Research integrity at Frontiers
Learn more about the work of our research integrity team to safeguard the quality of each article we publish.