 Tao Yu
 Shu Zhang2
 Ryota Wakayama
 Tomohito Horimoto
 Chikako Tange
 Yukiko Nishita
 Rei Otsuka
94% of researchers rate our articles as excellent or good
Learn more about the work of our research integrity team to safeguard the quality of each article we publish.
Find out more
ORIGINAL RESEARCH article
Front. Nutr. , 03 July 2024
Sec. Nutritional Epidemiology
Volume 11 - 2024 | https://doi.org/10.3389/fnut.2024.1413980
This article is part of the Research Topic Preventative Medicine: Nutritional and Lifestyle Interventions for Healthy Ageing and Chronic Diseases View all 35 articles
Background: Nutritional profiling system (NPS) holds promise as a public health tool for companies to measure product healthiness and for individuals in making healthier food choices. The Meiji NPS for adults specifically targets lifestyle-related diseases prevalent among Japan’s adult population, including overweight/obesity, hypertension, diabetes, and dyslipidemia. This study examined the cross-sectional association between the Meiji NPS for adults Dietary Index (MNfA-DI) and indicators of lifestyle-related diseases in a population.
Methods: The study comprised 1,272 middle-aged individuals (40–64 years, 50.1% male) who participated in the seventh wave (2010–2012) of the National Institute for Longevity Sciences—Longitudinal Study of Aging project, with no missing data on three-day dietary records. The MNfA-DI was computed at the individual diet level (accounting for the whole diet) using arithmetic energy-weighted means. A higher MNfA-DI indicated a greater nutritional quality of an individual’s overall diet. Lifestyle-related disease indicators included body mass index (BMI, kg/m2), body fat (%), systolic and diastolic blood pressure (mmHg), fasting plasma glucose (mg/dL), HbA1c (%), triglyceride levels (mg/dL), LDL, and HDL cholesterol levels (mg/dL). A multiple regression model was used to assess the association between the MNfA-DI and lifestyle-related disease indicators, adjusting for demographics, socioeconomic status, lifestyle factors, disease history, and energy intake as covariates, depending on the outcome.
Results: The median (interquartile range) age and MNfA-DI were 53.0 (46.0, 59.0) years and 10.1 (6.0, 14.0) points, respectively. MNfA-DI was negatively associated with body fat [partial regression coefficient (95% confidence interval) −0.04 (−0.07, −0.01)], diastolic blood pressure [−0.08 (−0.17, −0.002)], fasting plasma glucose [−0.18 (−0.33, −0.01)], and triglyceride [−1.36 (−2.16, −0.55)]. Additionally, MNfA-DI was also associated with almost indicators (except for LDL and HDL cholesterol) among participants with a BMI between 18.5 and 24.9 kg/m2.
Conclusion: These findings suggest that the Meiji NPS for adults could be associated with a lower risk of lifestyle-related diseases. In addition, from a public health nutrition perspective, the Meiji NPS for adults may be useful to assess the food healthiness of the adult population.
Japan is often recognized worldwide for healthy eating habits, characterized by a relatively balanced diet and low-fat intake (1–3). However, according to the Global Burden of Disease Report (GBD) 2017, approximately 30% of mortality is attributable to diet (excessive salt consumption and inadequate intake of fruits, whole grains, nuts, and seaweed) in East Asia, including Japan, which is higher than the global average of 22% (4). Rigorous research from Japan recommends increasing calcium, dietary fiber, iron, and potassium intake (5). Despite Japan’s reputation as one of the healthiest dietary nations in the world, there are many opportunities for improvement (6, 7). According to the GBD Study 2019, unhealthy eating habits rank as the third most important risk factor for death in Japan and remain a factor that needs to be improved (8). Lifestyle-related diseases are defined as a group of diseases (such as overweight/obesity, hypertension, diabetes and hyperlipidemia) in which lifestyle habits such as dietary habits, exercise habits, rest, smoking, and alcohol consumption are involved in the development and progression of the disease, and the concept is similar to non-communicable diseases (in Japan, they are sometimes referred to as lifestyle-related diseases, a group of diseases excluding chronic obstructive pulmonary disease from non-communicable diseases) (9–11). These diseases are acknowledged as critical health concerns, especially in adulthood, echoing global trends (6, 12–17). Data from a survey performed on 2,467 people across 300 randomly selected districts in Japan (National Health and Nutrition Examination Survey, called NIPPON data80) revealed that approximately 40% of Japanese adults experienced hypertension, more than 10% presented diabetes, 41% had hypercholesterolemia, and approximately 7% presented low HDL cholesterol (18, 19).
In this context, European countries have implemented front-of-pack labeling (FoPL) to promote healthier diets, and the core concept is the Nutrition Profiling Systems (NPS) (20–24). According to the World Health Organization definition, nutritional profiling is defined as “the science of categorizing or ranking foods according to their nutritional composition.” In other words, the NPS allow various foods and products to be characterized as healthy or unhealthy according to predefined criteria, and the FoPL aims to contribute to the food environment and people’s eating behavior (25–28). In some studies, FoPL has potentially guided people’s purchasing behavior toward healthier products, with its potential usefulness being discussed (29–32).
Food companies are encouraged to develop NPS for product reform, which can directly contribute to people’s health (33–37). Whether the NPS used for FoPL or the NPS developed by companies, the aims are different, but the contribution to people’s health challenges is no different. Besides creating an NPS, NPS creator are required to verify whether the developed NPS are related to the health outcomes they previously set, which could be considered of even greater importance (23, 38, 39). The validity of some NPS, such as the Nutri-score and healthy star rating (HSR), is supported by several studies using established NPS, which have been carefully examined in relation to non-communicable diseases and clinical data representative of each disease (38–40). However, the use of established overseas NPS could not consider the differences in eating habits and health issues between overseas and Japan, and the possibility of misclassification of healthiness in foods cannot be ignored (41–44). Despite lifestyle-related diseases being an important health issue in Japan, there are no NPS that have been confirmed to be associated with health outcomes in Japan worldwide. Therefore, Meiji developed the Meiji NPS for adults, focusing on the health issues (lifestyle-related diseases) of the Japanese adult population.
This study aimed to confirm the predictive validity of the Meiji NPS for adults by cross-sectionally examining its association with clinical indicators for each lifestyle-related disease from an epidemiological perspective. Confirming the predictive validity of the Meiji NPS for adults will enhance its credibility and ensure its validity in the targeted age group.
This study is a cross-sectional study comprised data from the seventh wave of the National Institute for Longevity Sciences-Longitudinal Study of Aging (NILS-LSA), which was conducted between July 2010 and July 2012 (45, 46). The NILS-LSA is an ongoing longitudinal cohort study that involves a wide range of fields related to aging and geriatric diseases, including medicine, psychology, exercise, body composition, and nutrition. Various experts collaborated to conduct detailed surveys (basic questionnaires, medical examinations, and anthropometric, physical, and nutritional assessments), data collection, and analyses. Participants of the NILS-LSA were randomly selected based on age and sex, from the local populations of Obu City and Higashiura Town, in the neighborhood of the National Center for Geriatrics and Gerontology in Aichi Prefecture, Japan. Among the 1,369 participants (aged 40–64 years) in the seventh wave (2010–2012) survey, 97 (7.1%) had missing data on 3-day dietary records. For power and study design, those with missing outcome variables (lifestyle-related disease indicators) were not excluded. The reason was that the study was designed as an exploratory study examining associations with multiple outcomes, and therefore it was not considered necessary to limit the participants with all outcomes (47).
Participants completed a three-day dietary record in order to assess food consumption and nutrient intakes (48). Food records were completed over three consecutive days (two weekdays and one weekend day) since eating habits differ between weekdays and weekends. Food items were weighed individually using a scale (1-kg kitchen scales, Sekisui Jushi, Tokyo, Japan) prior to cooking or with portion sizes estimated. Additionally, participants documented their dietary intake using a disposable camera (27 shots, Fuji Film, Tokyo, Japan), capturing images of meals before and after consumption. Dietitians utilized these photographs to address any missing data and contacted participants via telephone to resolve discrepancies or gather additional information as needed. Mean nutrient and energy intake over a 3-day period were calculated based on the Standard Tables of Food Composition 2010 in Japan and other relevant sources (48). After categorizing food items following the Japan National Health and Nutrition Examination Survey (e.g., legumes, seeds, vegetables, fruits, and dairy), the food items included in each food group were carefully rechecked to match the assessment items in the Meiji NPS (49). Food items with significantly different nutritional characteristics were subsequently excluded from the corresponding food group. For instance, cream or milk coffee were excluded from dairy and dairy products group. This approach supports the validity of the Meiji NPS scoring for adults. Finally, the total consumption of each food group was determined by aggregating the consumption of all foods within the group. For dried foods (e.g., dried wakame), their actual weight after water absorption was used. However, the total nutrient intakes for dried foods were calculated based on their dried state.
The Meiji NPS for adults considers differences in eating habits between Japan and other countries, as well as differences in the applicability of epidemiological studies (50). It places significant emphasis on evidence from the Japanese population, particularly in addressing lifestyle-related diseases as a major health concern for adults. The Meiji NPS for adults includes recommended nutritional intake levels such as protein, dietary fiber, calcium, iron, and vitamin D, along with recommended food groups, including fruits, vegetables, nuts, legumes, and dairy. Additionally, it outlines restricted nutrient intake, including energy, saturated fatty acids, sugar (glucose, fructose, galactose, sucrose, maltose, and lactose), and salt equivalents. Detailed protocols for the creation of the Meiji NPS for adults and its correlation with existing NPS are available in other studies (50). The study initially assessed each food consumed by the participants using the Meiji NPS for adults. The Meiji NPS for Adults Dietary Index (MNfA-DI) was then calculated using the following formula (20).
where i is the food (or beverage) consumed by the participant, FSi is the food (or beverage) score. Score is determined by adding or subtracting points for items listed in the Meiji NPS for adults. Ei is the mean daily energy intake from the food (or beverage), and n is the number of different foods consumed. A higher MNfA-DI reflects the higher nutritional quality of an individual’s overall diet.
Lifestyle-related diseases in this study were limited to four diseases closely related to diet: overweight/obesity, hypertension, type 2 diabetes, and dyslipidemia. BMI (kg/m2) and body fat (%) were used as indicators of overweight/obesity, systolic and diastolic blood pressure (mmHg) as indicators of hypertension, fasting blood glucose (mg/dL) and HbA1c (%) as indicators of type 2 diabetes, triglycerides (mg/dL), LDL and HDL cholesterol (mg/dL), which were employed as outcomes of the study, respectively (LDL cholesterol is calculated using the Friedewald formula. That is, LDL cholesterol = total cholesterol − HDL cholesterol − triglycerides/5) (51). Weight and height were measured in the fasting state (approximately 9–10 a.m.) to the nearest 0.1 kg and 0.1 cm, respectively, with participants wearing light clothing and no shoes.
Self-administered questionnaires were used to assess marital status (never married/ married/ divorced, bereaved, separate), household income (10 levels), years of education, living situation (living alone or no), occupation (not employed, housewife or house husband, employed, other), smoking status (never, stopped, smoking), depression status (assessment by the Center for Epidemiologic Studies Depression Scale). Participants’ daily steps were recorded using a uniaxial accelerometer (Lifecorder; Suzuken, Aichi, Japan). Participants wore the accelerometer for seven consecutive days (sleeping, bathing, or traveling were not included in the seven-day measurement duration). The average number of steps taken over the 7-day period was employed for this study.
The BMI was used as the criterion for determining overweight, even if the BMI ≥ 25 kg/m2. The blood pressure (systolic and diastolic) obtained from that measurement was used to identify the presence of the abnormal of blood pressure (defined as a systolic blood pressure ≥ 140 mmHg, or diastolic blood pressure ≥ 85 mmHg). Abnormal blood glucose was determined using fasting plasma glucose and HbA1c, with fasting plasma glucose ≥126 mg/dL or HbA1c ≥ 6.0%. Lipids were considered abnormal if the TG ≥ 140 mg/dL or the HDL < 40 mg/dL. Lifestyle-related disease scores were created from overweight, abnormal blood pressure, abnormal blood glucose and abnormal lipids (0–4) to characterize the population (mainly used in Table 1). The lifestyle-related disease score was also created with continuous variables of abnormal blood pressure, above blood glucose and abnormal lipids (0–3) as adjustment variables (mainly used in Tables 2, 3).
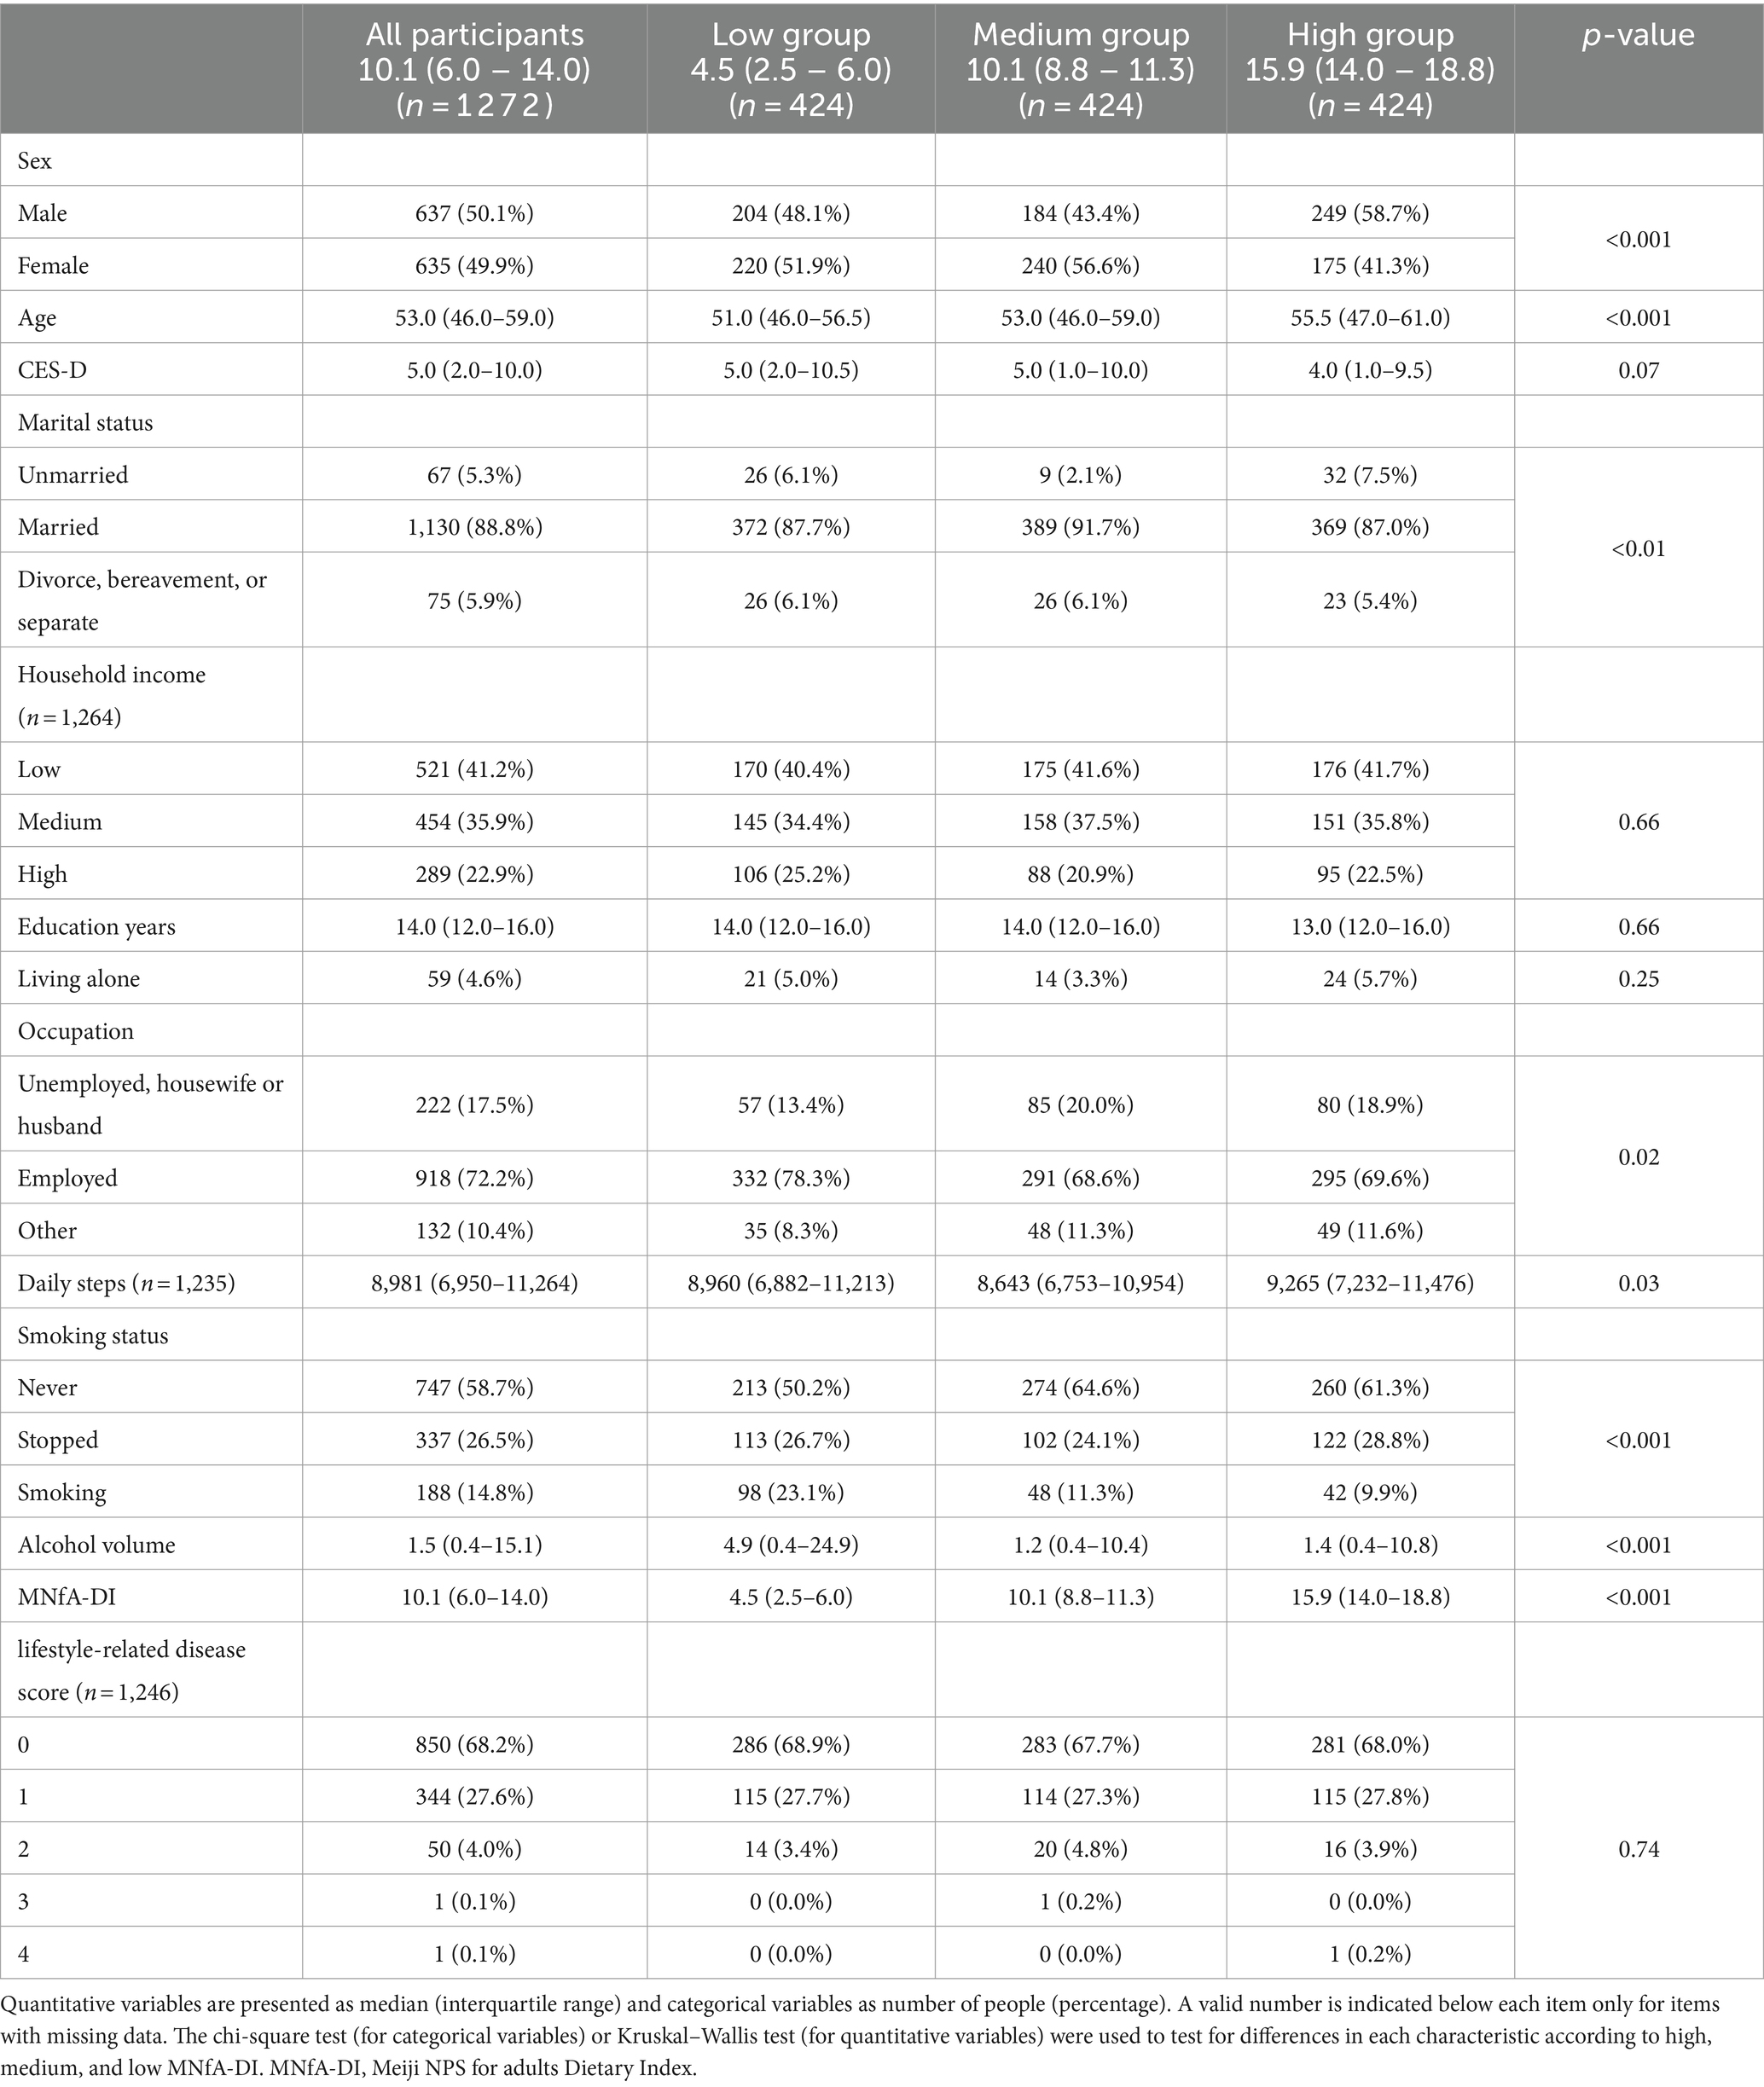
Table 1. The characteristics of all participants and in the three groups of MNfA-DI.
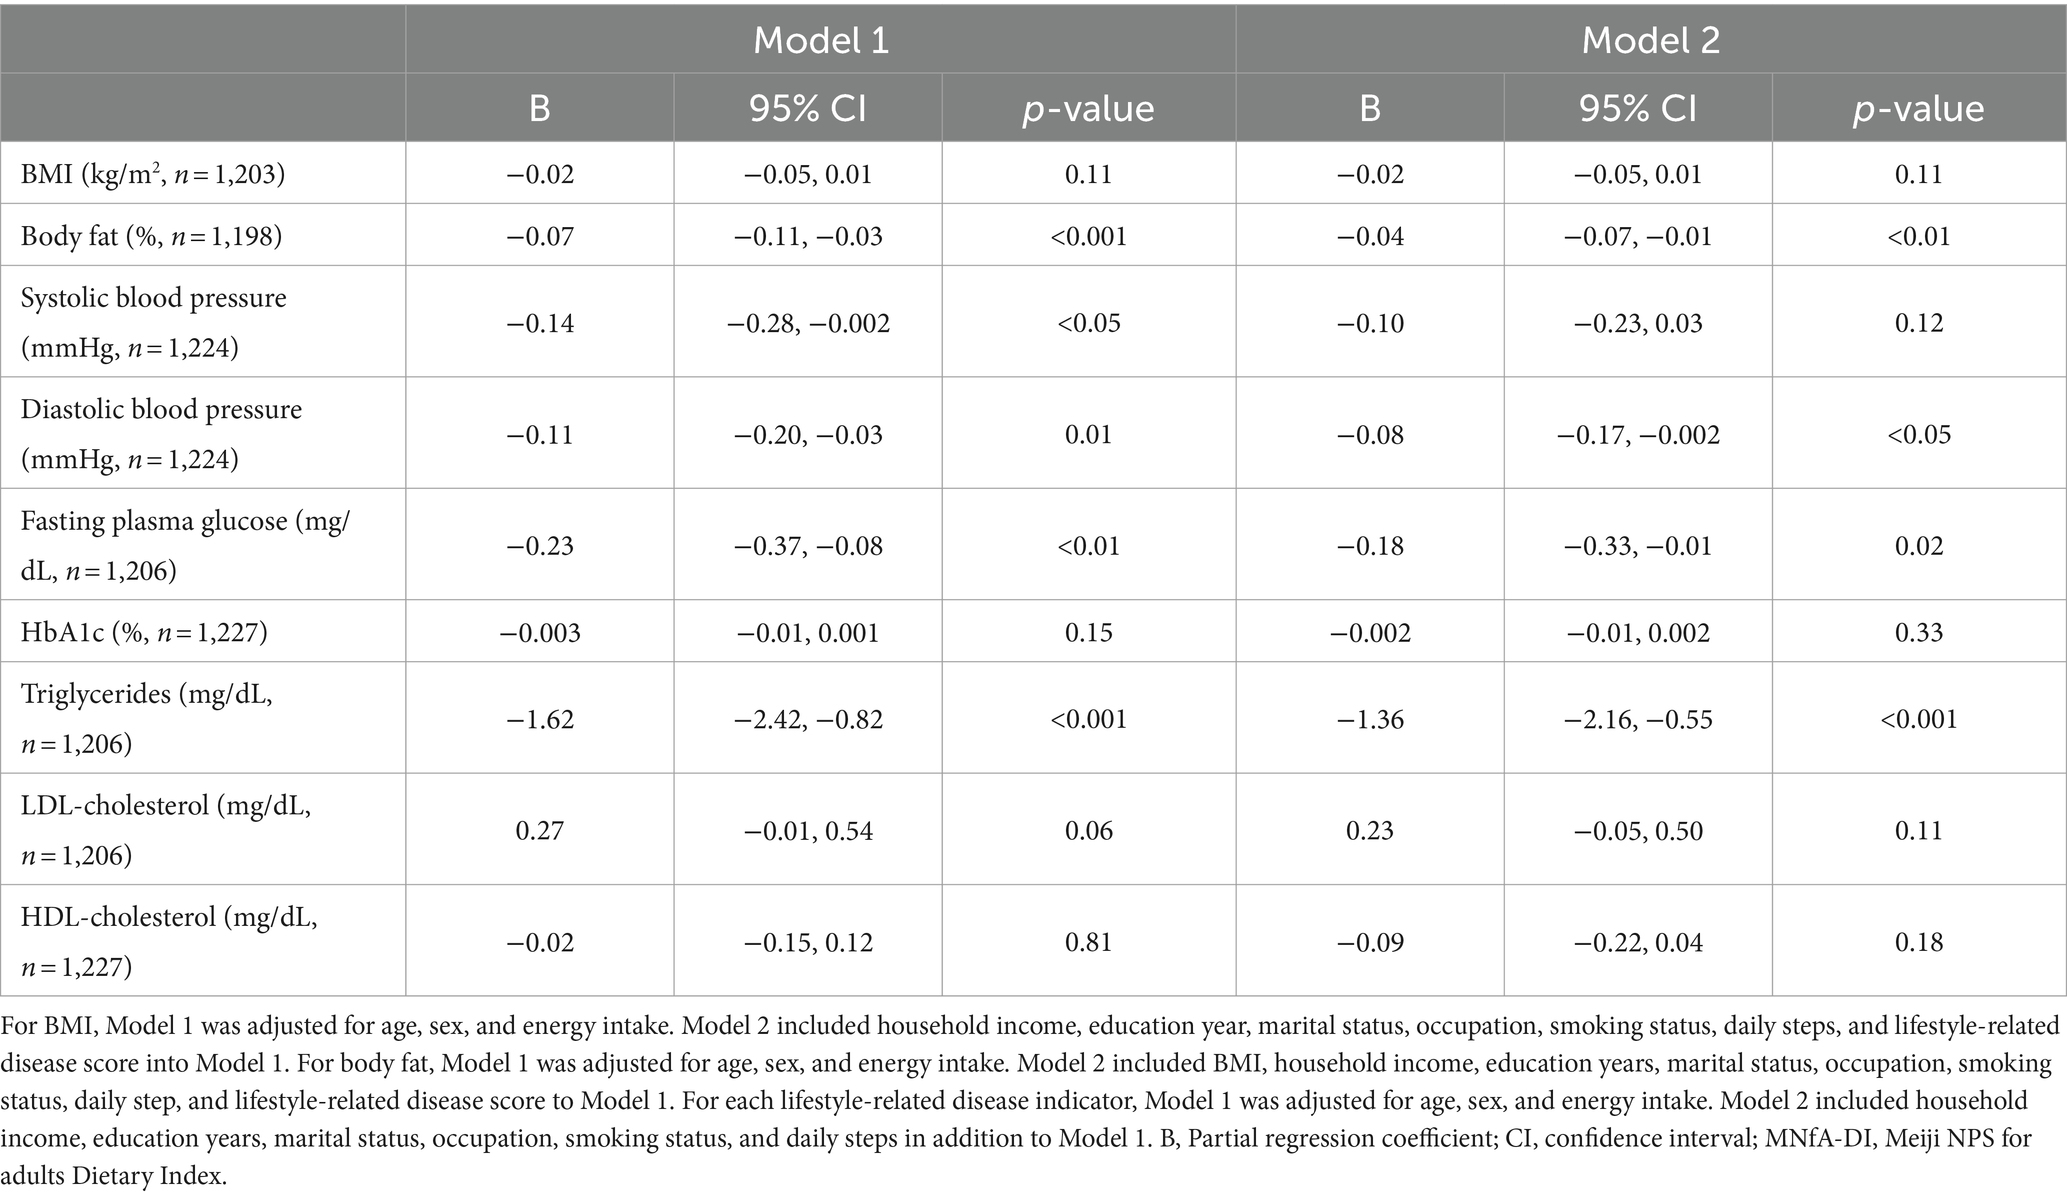
Table 2. Association between the MNfA-DI (continuous variable) and each lifestyle-related disease indicators.
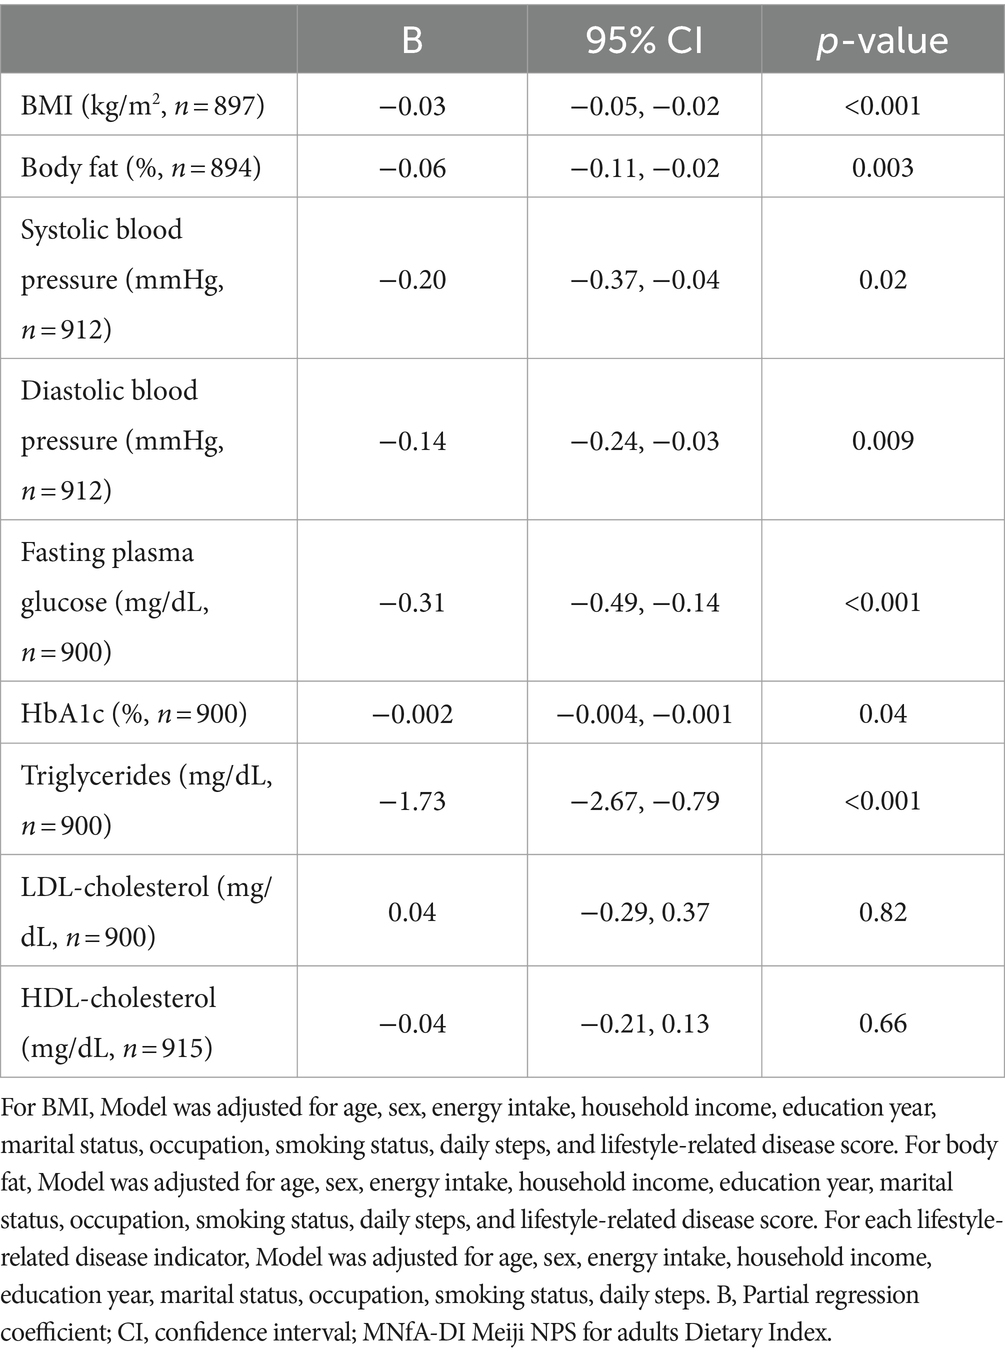
Table 3. Association between the MNfA-DI (continuous variable) and each lifestyle-related disease indicators in participants with BMI between 18.5 and 24.9 kg/m2.
The Kruskal–Wallis test was used to examine differences in each characteristic and nutrient intake status across high, medium, and low MNfA-DI categories. A multiple regression model was used to assess the association between MNfA-DI and lifestyle-related disease indicators while considering demographics, socioeconomic status, lifestyle factors, disease history, and energy intake as covariates, contingent upon the outcome. For BMI, Model 1 was adjusted for age, sex, and energy intake, while Model 2 included household income (the tier from 1 to 10 is divided into low, medium, and high group), education years, marital status, occupation, smoking status, daily steps, and lifestyle diseases score in addition to Model 1. Regarding body fat, Model 1 was adjusted for age, sex, and energy intake, while Model 2 included BMI, household income, education years, marital status, occupation, smoking status, daily steps, and lifestyle diseases score besides Model 1. For each lifestyle-related disease indicator, Model 1 was adjusted for age, sex, and energy intake, and Model 2 included household income, education years, marital status, occupation, smoking status, and daily steps in addition to Model 1. The hypothesis in this analysis is that the MNfA-DI will be significantly negatively associated with each of the lifestyle disease indicators.
All statistical analyses were performed using STATA version 16.0 (Stata Corp LLC, Texas, United States). All reported p-values were two-sided, and a p-value <0.05 was considered significant.
The NILS-LSA was approved by the Conflict of Interest and Ethics Review at the National Center for Geriatrics and Gerontology, and written informed consent was obtained from all participants (No. 1665–2). The conduct of this study was approved by the Conflict of Interest and Ethics Review at the National Center for Geriatrics and Gerontology (No. 1757).
This study included 1,272 individuals, with a median age of 53.0 (46.0–59.0) years and an MNfA-DI of 10.1 (6.0–14.0) points; 88.8% of the individuals were married, and 82.6% were working. Household income was divided into three groups, with 41.2% belonging to the low group and 22.9% to the high group. The median number of daily steps was 8,981, and 14.8% of individuals reported being smokers. Additionally, 68.2% of participants had no lifestyle-related disease score. Significant differences were observed in sex, age, marital status, occupation, daily steps, smoking status, and alcohol volume across high, medium, and low MNfA-DI scores. Detailed information on the analyzed population is shown in Table 1.
Table 4 shows the differences in unadjusted nutrient and food intake across low, medium, and high MNfA-DI, while Table 5 shows the differences for each nutrient and food adjusted by the density method according to low, medium, and high MNfA-DI. Most nutrients and foods showed significant differences among the low, medium, and high MNfA-DI. The salt intake showed significantly higher values across MNfA-DI categories in Table 4, while Table 5 shows fewer differences. In addition, the intake of nuts showed no significant differences either with or without energy adjustment.
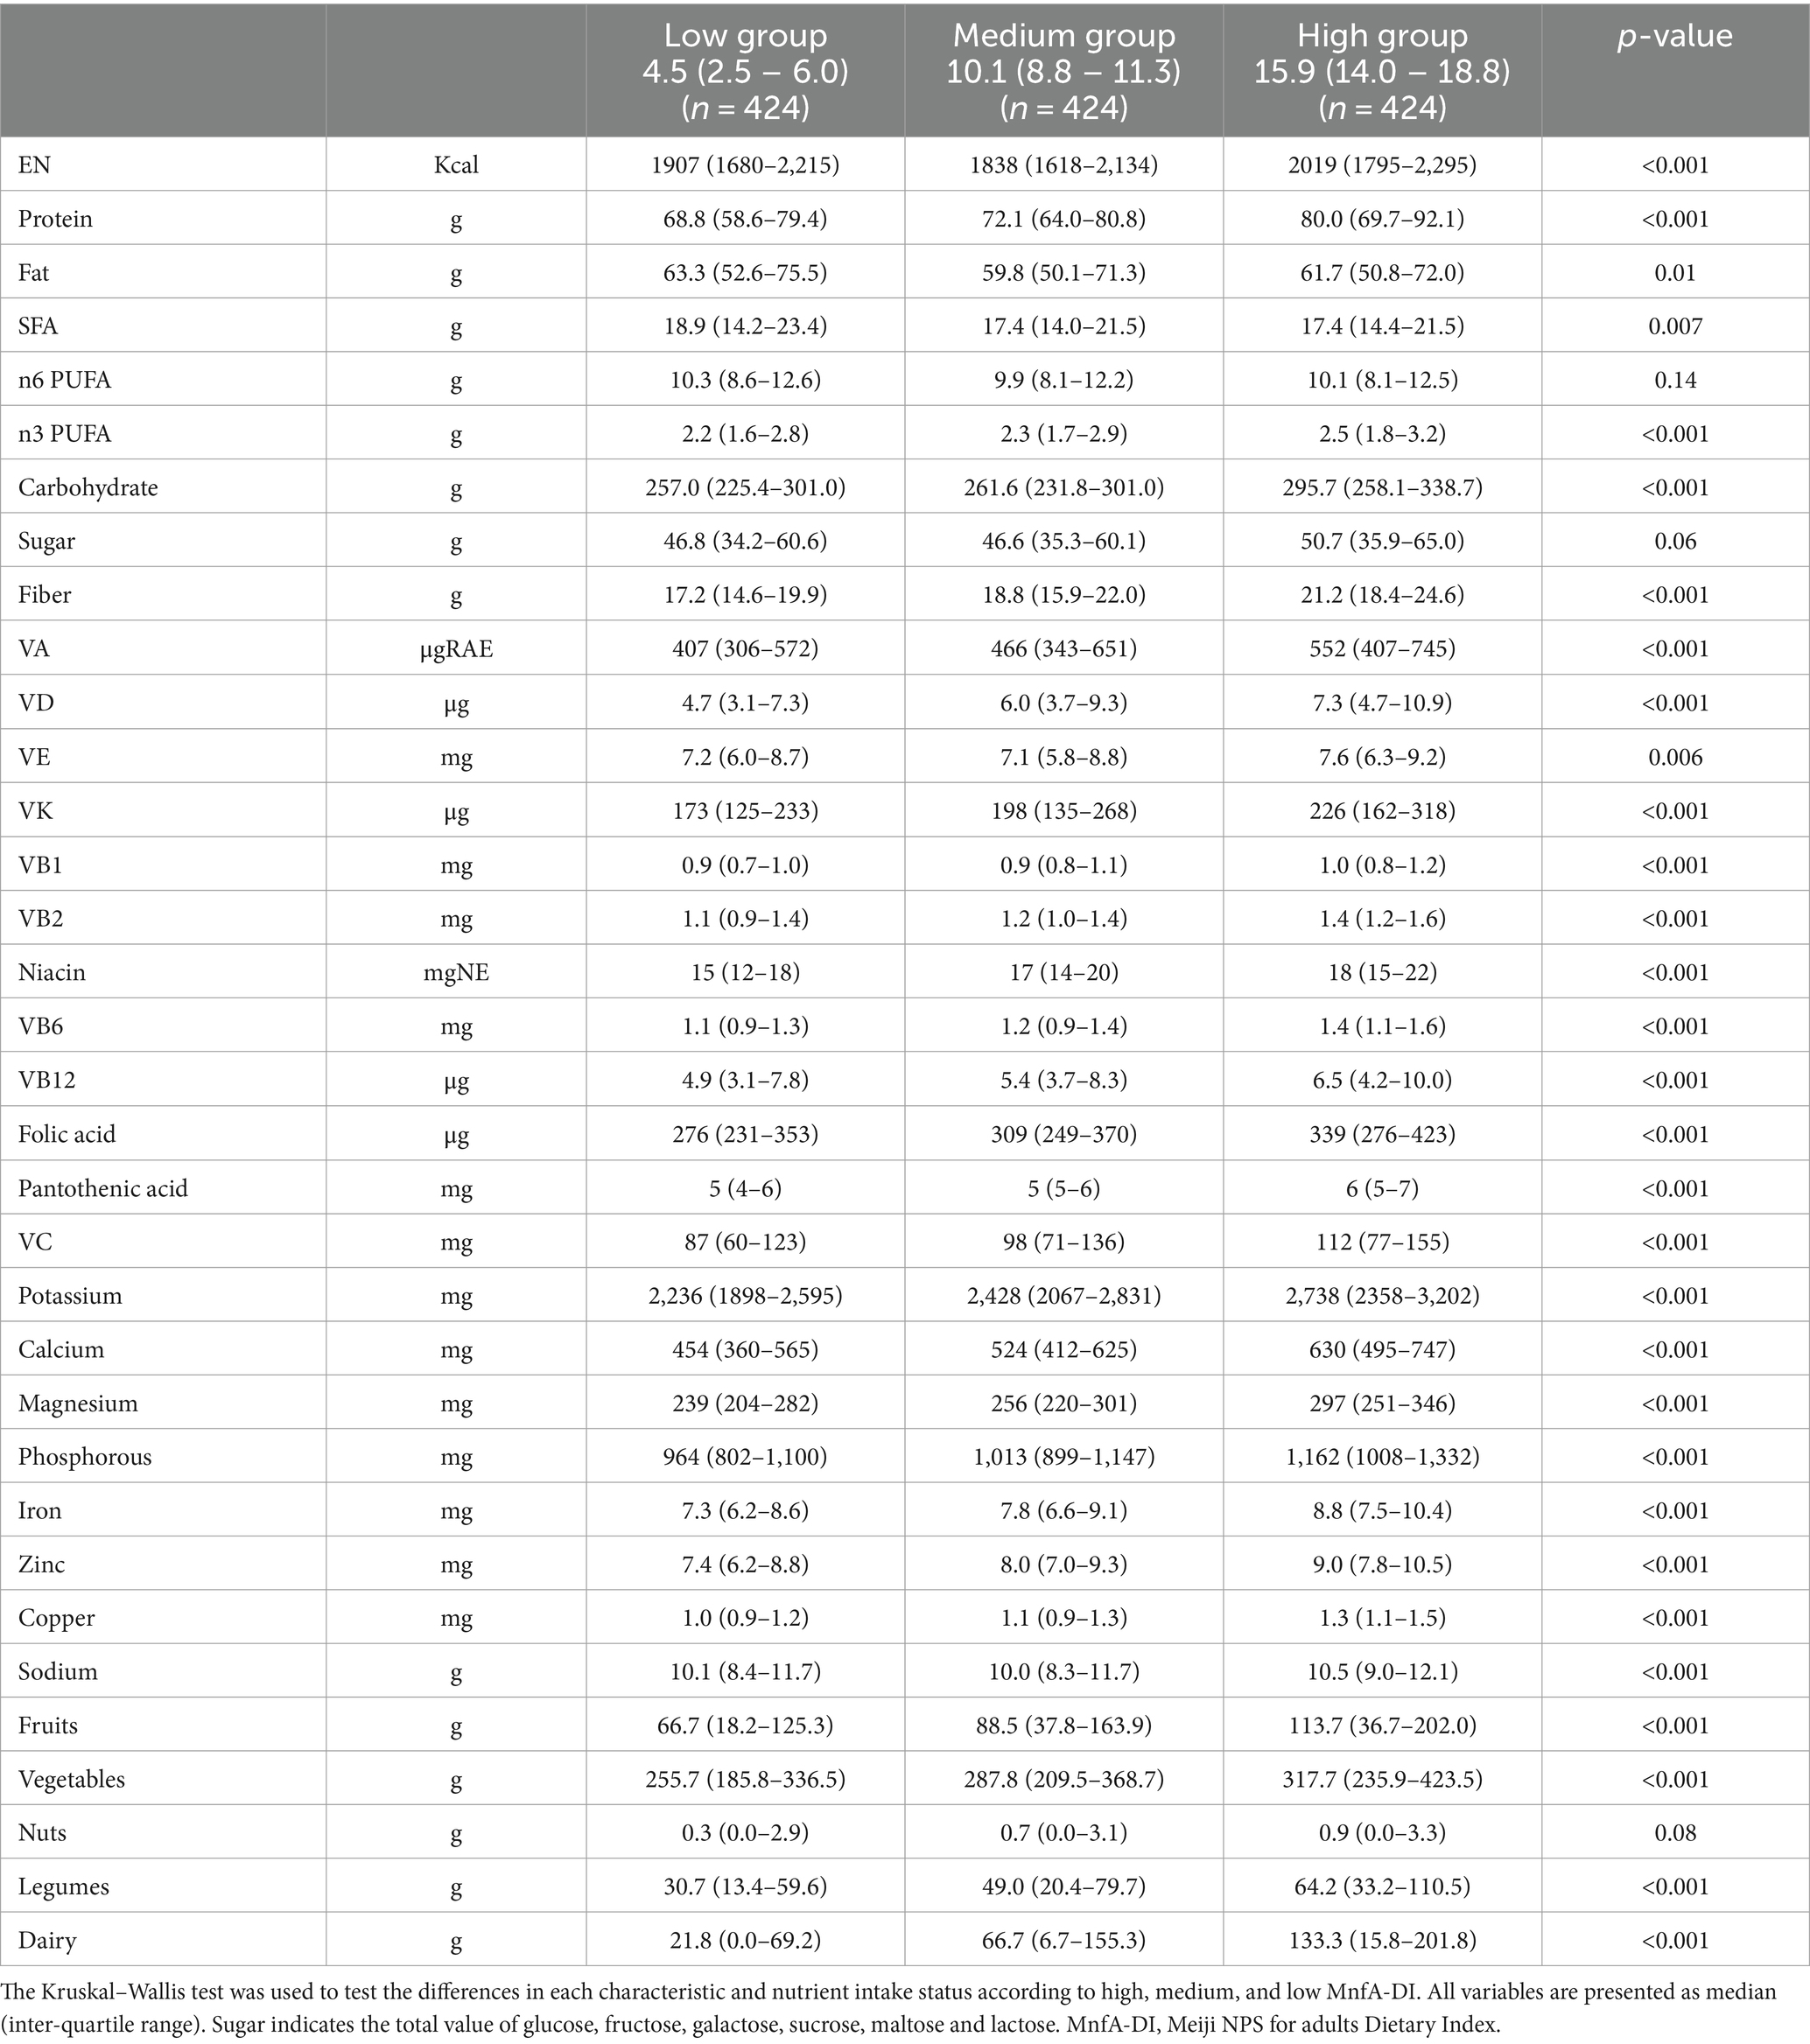
Table 4. Differences in nutrient and food intake (raw data) in low, medium, and high MNfA-DI groups.
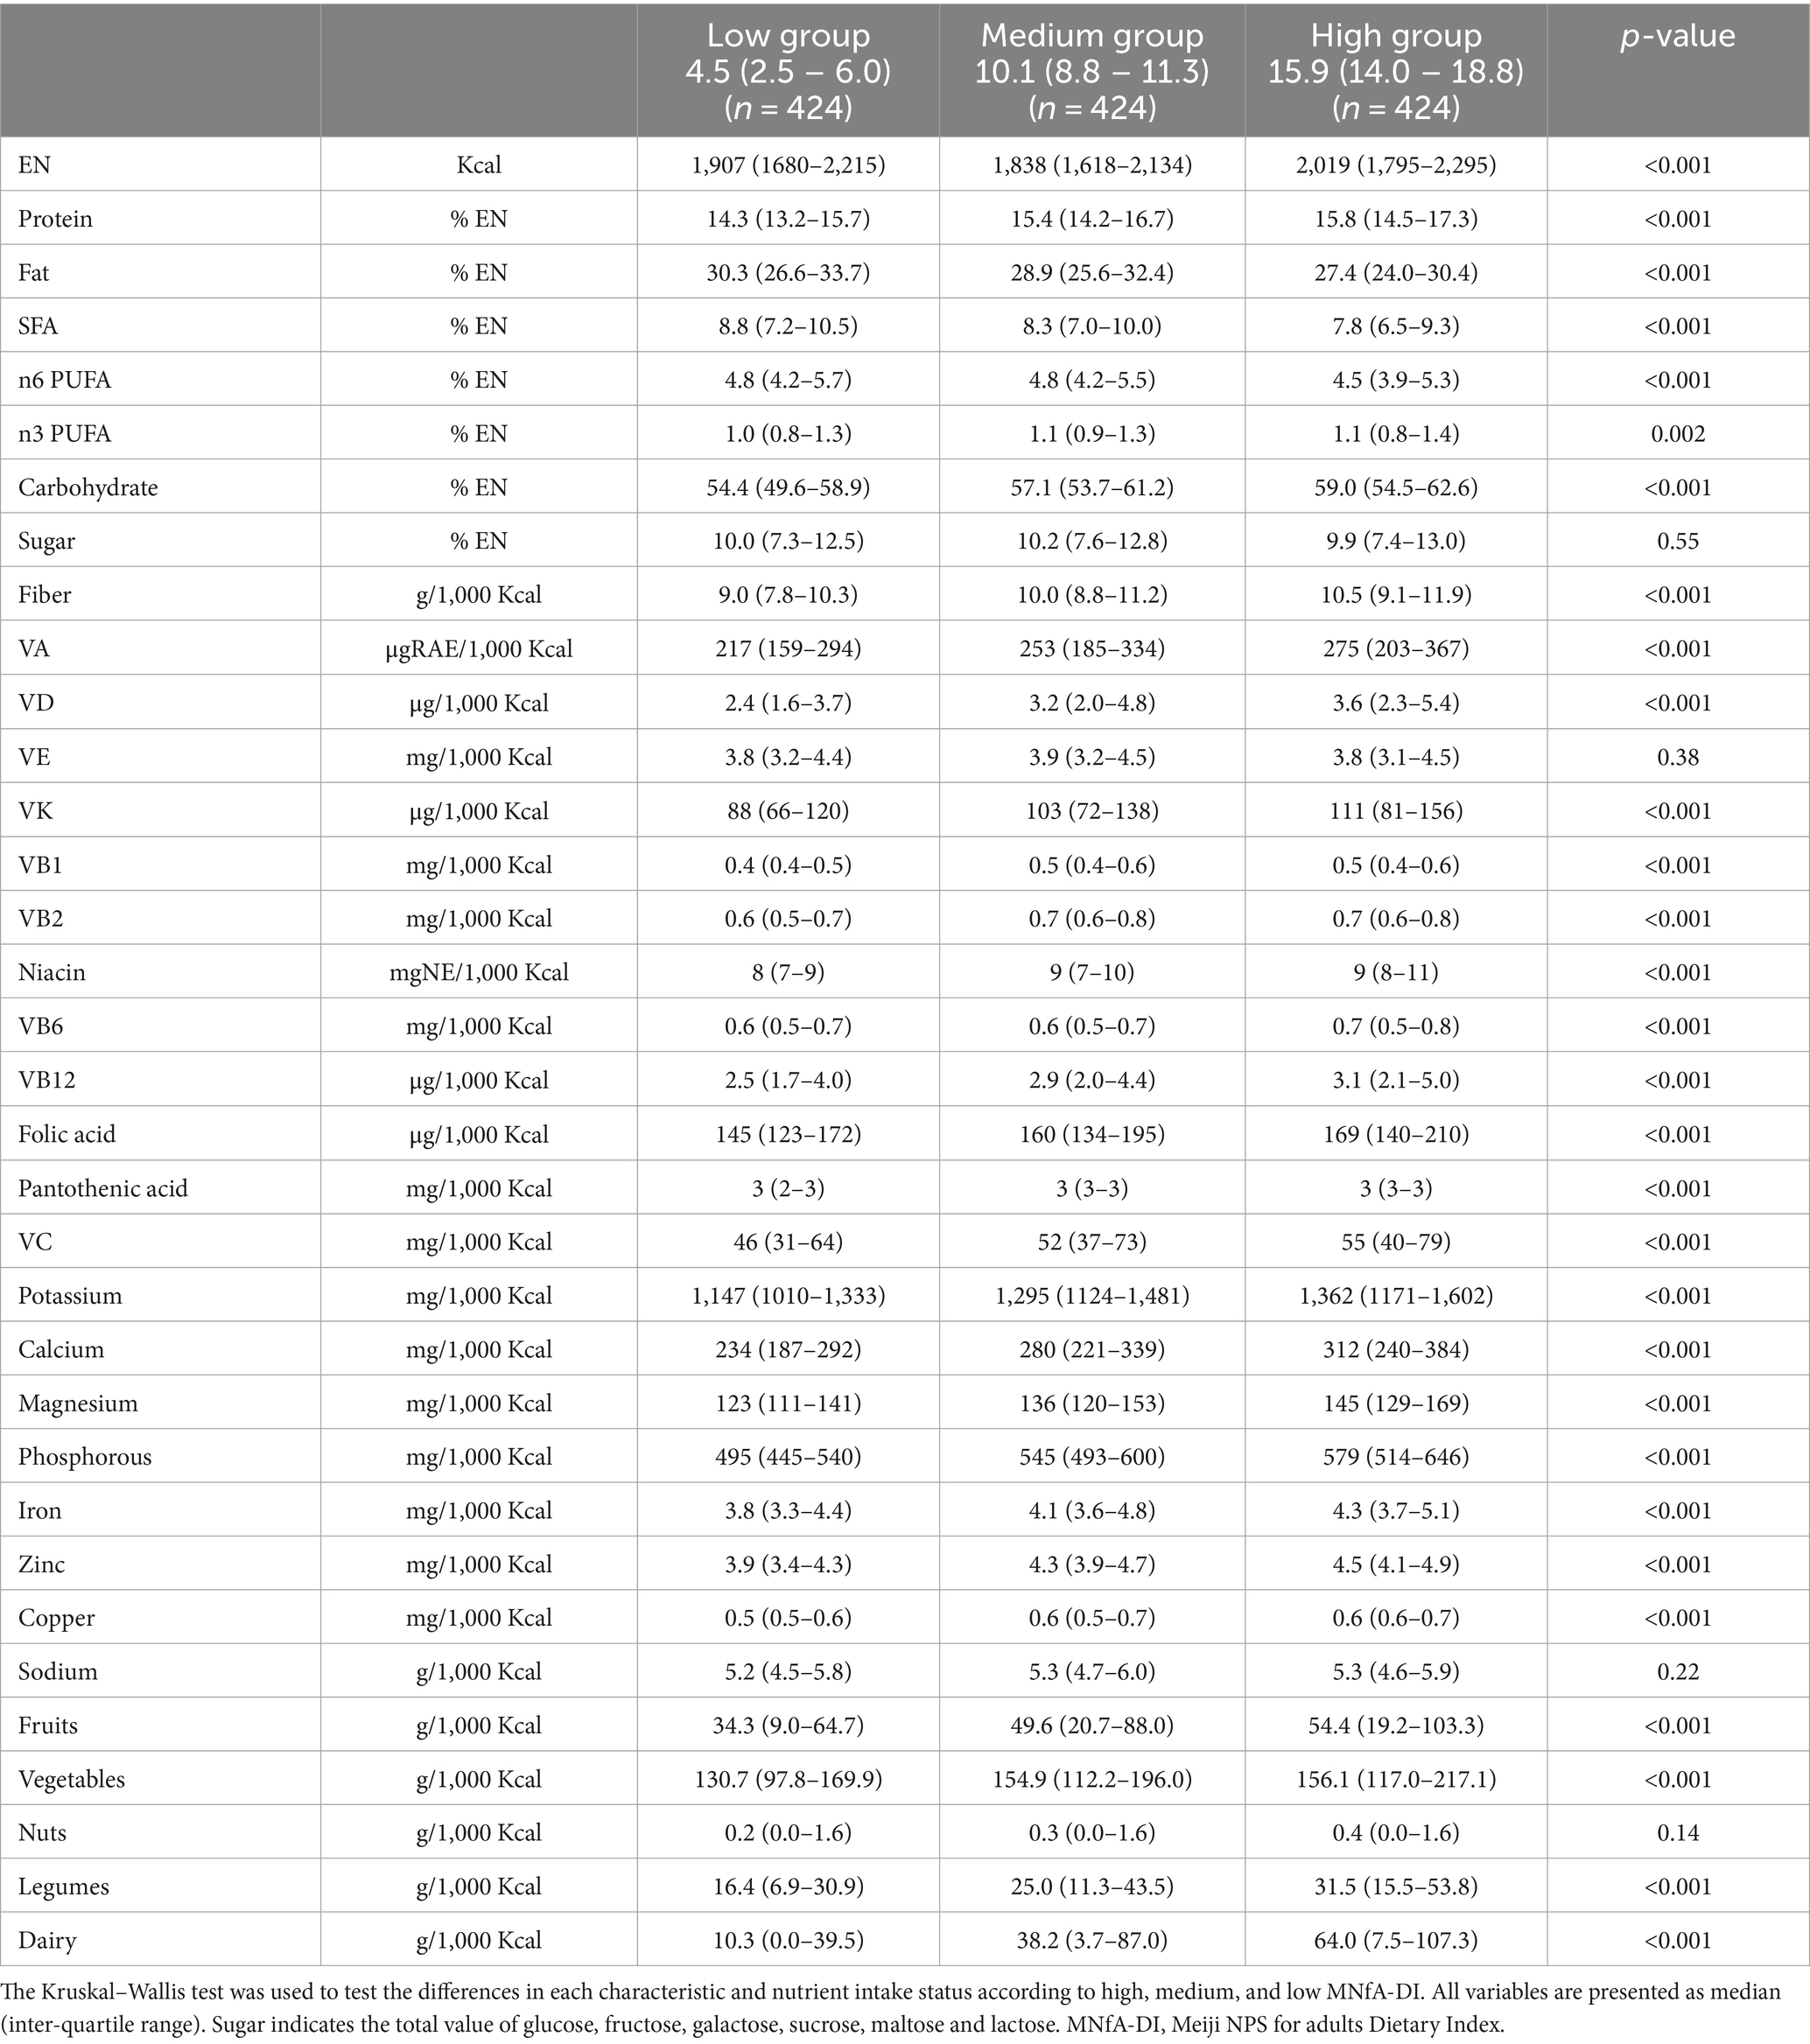
Table 5. Differences in nutrient and food intake (density adjusted) in low, medium, and high MNfA-DI groups.
Table 2 shows the association between MNfA-DI and each lifestyle-related disease indicator. MNfA-DI was negatively associated with body fat [partial regression coefficient (95% confidence interval) −0.04 (−0.07, −0.01)], diastolic blood pressure [−0.08 (−0.17, −0.002)], fasting plasma glucose [−0.18 (−0.33, −0.01)], and triglyceride levels [−1.36 (−2.16, −0.55)]. Furthermore, Table 3 shows the association between MNfA-DI and various lifestyle-related disease indicators among participants with a BMI between 18.5 and 24.9 kg/m2. Except for LDL and HDL cholesterol, significant associations with most variables were confirmed.
This study examined the association between MNfA-DI and each lifestyle-related disease indicator. Higher MNfA-DI was found to be significantly negatively associated with body fat ratio, diastolic blood pressure, fasting blood glucose, and triglycerides. The higher MNfA-DI was also negatively associated with almost lifestyle-related disease indicators when restricted to participants with a BMI between 18.5 and 24.9 kg/m2. While the relationship between existing NPS and non-communicable diseases or related disease indicators has been explored worldwide, this study stands as the first to confirm such a relationship specifically within the context of Japan.
A paper published more than 15 years ago suggests that nutritional profiling is not a new system, but many have been developed using a non-systematic and non-logical methodology (52). Different nutrient profiling models are needed for different purposes, but the key requirement is that they are developed using systematic, transparent and logical processes. NPSs with confirmed predictive validity can play an important role in helping companies improve their products to make them healthier (33). For example, leading companies in this field are attempting to reform their product portfolios based on their own developed NPS (33, 36). It also has the potential to make people’s eating habits healthier, as a tool for corporate non-profit initiatives and public health nutrition policies (25). Because the NPS plays a pivotal role in public health nutrition strategies, notably in FoPL. As a measure of strategies targeting these populations, it is not sufficient to assume an association with the disease but to confirm the relationship with the assumed health outcomes, which will increase the validity of the NPS and make it a more effective public health nutrition strategy (38).
The predictive validity of the NPS has been examined mainly in European countries, and the most used measures are the Nutri-Score (Food Standards Agency NPS-DI, FSA NPS-DI) and the HSR. An association with overweight/obesity was reported in a study that used the FSA NPS-DI from the French SUVIMAX cohort (53). A high baseline FSA NPS-DI score (indicative of a poor diet) was associated with increased weight and BMI. Sex differences were also observed between groups. Therefore, FoPL using the FSA NPS may not only contribute to obesity in specific people but may also contribute to effective solutions to the public health population obesity problem through people making conscious food choices. The NutriNet-Santé cohort in France (n = 71,403) also supported the association between the FSA NPS-DI and obesity and concluded that it supports the use of the FSA NPS in public policy for chronic disease prevention (54). Additionally, the Spanish PREDIMED-Plus cohort study highlighted the association between FSA NPS-DI and cardiovascular disease risk factors among the older population (55). These findings indicate that a higher baseline FSA NPS-DI correlates with increased levels of several key CVD risk factors, including body weight, fasting plasma glucose, triglycerides, and diastolic blood pressure. However, no association was found between LDL or HDL cholesterol and the FSA NPS-DI, suggesting that while some factors are associated, others are not, highlighting the selectivity of the FSA NPS-DI for health outcomes. The results are quite scientifically interesting, and our findings are similar: the Meiji NPS for adults is not associated with all the key lifestyle-related factors but with fasting blood glucose, triglycerides, and diastolic blood pressure, but not with LDL or HDL cholesterol. Although it is generally accepted that diet intake is associated with LDL and HDL cholesterol by physiological mechanisms, the relationship between diet and LDL or HDL cholesterol is complex and there is no more consistent evidence than for triglycerides or other lifestyle disease indicators (56–59). Consumption of foods high in soluble fiber (e.g., oats, barley) has been negatively associated with LDL-C (although these foods are not commonly eaten in Japan) (60). However, the mechanisms are dependent on eating time and individual socio-economic factors (61, 62). A study using data from 8,344 Japanese subjects (NIPPON DATA90) suggests that SFA and fat per calorie intake are associated with LDL (in men only, the association between fat and HDL is not statistically significant). Thus, following physiological mechanisms, fat or SFA intakes may confirm an association with blood lipids in Japanese (63). However, in the case of the combined scale of carbohydrate, protein, fat, SFA, and the sum of MUFA and PUFA intake, the association between higher scores (indicate the higher intake of fat and SFA) and LDL cholesterol was not significant. This is possible because a high score on this scale indicates a high intake of fat and SFA, but also a low intake of carbohydrate and a high intake of protein and the sum of MUFA and PUFA (64). From a physiological and epidemiological perspective, these studies support the validity of including them as limiting nutrients in the Meiji NPS for adults for the prevention of lifestyle-related diseases. On the other hand, they may explain why epidemiological studies with multiple nutrients do not consistently provide the expected results. As this is a cross-sectional study, longitudinal studies are needed to further clarify the association, especially with LDL and HDL cholesterol.
It is necessary to discuss the development flow of the NPS because the NPS are considered to be strongly limited in their association with health outcomes by pre-defined items. A study that developed a scale to assess the quality of the Japanese diet carefully selected items from several potential scales to assess a healthy diet, considering potential health effects (65). This method is highly dependent on the data used and may need to consider its applicability to different populations. Conversely, the Meiji NPS for adults is data-independent and was developed based on careful consideration of various sources (National Health and Nutrition Survey, Dietary Reference Intakes for Japanese, a large number of Japanese epidemiological studies or meta-analyses, and experts’ comments). While such measures have high applicability in the population, it is necessary to confirm whether the measures are associated with health outcomes. Both are scientific methods, but they differ in their approaches to validation (close to the priori dietary patterns vs. posteriori dietary patterns) (66). This point is also supported by papers discussing the validity of the NPS. While it is important to develop an NPS for people’s health, it is also necessary to confirm its relation to health-related outcomes (23, 38, 39). A scientifically unique NPS, the Food Compass, developed primarily by Tufts University, must be mentioned (67). The Food Compass serves as an NPS for evaluating the healthfulness of a wide variety of foods, beverages, and diets. In a large cohort of US adults, dietary scores derived from the Food Compass were associated with higher BMI, HDL cholesterol, and various disease indicators such as lower systolic and diastolic blood pressure, LDL cholesterol, HbA1c, and fasting plasma glucose levels, suggesting that the Food Compass has a high level of predictive validity. These findings support the relevance of the Food Compass as a tool for guiding public health and private sector strategies to identify and promote healthier diets (68). Furthermore, several other studies have confirmed associations between the Food Compass and inflammatory markers and cardiovascular disease risk and have evaluated its clinical utility (69, 70).
The NutriNet-Santé study utilized weight as an outcome and compared four types of NPS: FSA NPS-DI, Food Standards Australia New Zealand Nutrient Profiling Scoring Criterion, HSR, and the French High Council of Public Health NPS (54). Although the observed differences were small, the feasibility of differentiating between multiple NPS for a single outcome was suggested. Currently, no similar studies have been conducted in Asia; however, it is imperative to evaluate the predictive validity of the Meiji NPS for adults for specific diseases, such as lifestyle-related diseases, in Japan or Asia in future research. Another important feature of the Meiji NPS for adults is modifiable. It has been found that the results of nutritional epidemiological studies derived from observational studies are often updated by time, consumption trends, region, and dietary assessment methods (71–73). In addition, while diet quality is reported to be improving in most parts of the world, Japan has shifted from a diet based on plant foods and fish to a diet based on bread, dairy or animal products, and oil (74, 75). These need to be considered comprehensively and carefully, and important and reliable findings need to be incorporated into algorithms in response to various changes. The Meiji NPS for adults is a scientific NPS formulated based on the concept of an NPS for the adult population of Japan. The application of the Meiji NPS for adults to other regions of the world requires careful consideration, as dietary habits and health issues are likely to be different between east Asia and other regions of the world (76).
The strengths of this study are outlined as follows: Firstly, the accuracy of the variables. The dietary survey employed a three-day food record. Among the data of over 1,000 participants (hundreds of food intake data per person), the dietitian staff checked each type and weight of food. Nutritional values were calculated by referencing standard food tables, resulting in meticulously surveyed data. Additionally, an activity meter was used for step count measurement, which is generally considered to be more accurate than self-reported step counts or step counts obtained from questionnaire surveys. Furthermore, this study’s outcome relied on clinical data derived from actual blood collection and measurements rather than self-reported histories of lifestyle-related diseases. This high accuracy minimizes potential recall and memory biases among participants, thereby enhancing the interpretability of results. Secondly, the study utilized a linear regression model to examine several important confounding factors, such as demographics, socioeconomic status, lifestyle factors, and disease history, thereby enhancing the robustness of the analysis. Thirdly, the MNfA-DI used in this study was calculated using a methodology consistent with previous studies, ensuring methodological continuity and enabling comparisons with earlier research findings. However, this study has also some limitations. Firstly, due to the study design, it was not possible to determine a causal relationship between the MNfA-DI and lifestyle-related disease indicators. As this was the first study in Japan, the primary aim was to identify cross-sectional associations and utilize multiple tables to carefully assess and describe differences in characteristics and nutrient or food intakes as assessed by the Meiji NPS for adults. This descriptive approach is integral to observational studies and is deemed important for evaluating the Meiji NPS for adults. Secondly, the results were limited to NILS-LSA data. As the predictive validity of existing NPS is typically validated using nationally representative data, further discussion is warranted regarding the generalizability of the results of this study. Additionally, the reliability of the study’s findings using nationally representative data must be verified. Nevertheless, various experts carefully collected the NILS-LSA data. The target area has both urban and rural locations and is located almost in the center of Japan, with few peculiar climatic or cultural factors. Consequently, the data collected from people residing in this area are considered to closely resemble the average data for Japan as a whole. Third, although several studies have highlighted the importance of timing of food intake, this study is a hypothesis-driven study design and does not consider chrono-nutrition (77). Finally, this study showing that the Meiji NPS for adults can correctly classify the healthiness of foods and confirm their association with lifestyle-related diseases. However, the actual food choice (purchasing behavior) needs to consider a variety of socio-economic and environmental factors, including sex and age differences (78–80).
These findings suggest that the Meiji NPS for adults could be associated with a lower risk of lifestyle-related diseases. These findings also support the validity of the Meiji NPS for adults as a measure of food healthiness for the adult population from a public health nutrition perspective. Longitudinal studies are needed to strengthen these findings.
The data analyzed in this study is subject to the following licenses/restrictions: The data used in this study are available from the National Institute of Longitudinal Study of Aging (NILS-LSA), but as the data have been used under license for this study, there are restrictions on the availability of these data and they are not publicly available. The data are available from the authors on reasonable request, with permission from the NILS-LSA Data Management Office. Requests to access these datasets should be directed to RO, b3RzdWthQG5jZ2cuZ28uanA=.
The studies involving humans were approved by the Ethics Committee on Human Research of the National Center for Geriatrics and Gerontology (approved number: 1757). The studies were conducted in accordance with the local legislation and institutional requirements. The participants provided their written informed consent to participate in this study.
TY: Conceptualization, Data curation, Formal analysis, Methodology, Software, Validation, Visualization, Writing – original draft, Writing – review & editing. SZ: Data curation, Methodology, Resources, Validation, Writing – review & editing. RW: Methodology, Software, Visualization, Writing – review & editing. TH: Supervision, Validation, Visualization, Writing – review & editing. CT: Data curation, Investigation, Methodology, Project administration, Validation, Writing – review & editing. YN: Data curation, Investigation, Methodology, Project administration, Validation, Writing – review & editing. RO: Conceptualization, Data curation, Funding acquisition, Investigation, Methodology, Project administration, Resources, Software, Supervision, Validation, Writing – review & editing.
The author(s) declare that financial support was received for the research, authorship, and/or publication of this article. This study was funded by collaborative research funds from Meiji Co., Ltd., and grants from the National Center for Geriatrics and Gerontology (RO, grant no. 24–10).
We are deeply grateful to the NILS-LSA participants and acknowledge the support of Teruyuki Noma, Keiko Kawahata, and Shigeru Taniguchi from Meiji Co., Ltd.
TY, RW, and TH are full-time employees of R&D Division Meiji Co., Ltd.
The remaining authors declare that the research was conducted in the absence of any commercial or financial relationships that could be construed as a potential conflict of interest.
All claims expressed in this article are solely those of the authors and do not necessarily represent those of their affiliated organizations, or those of the publisher, the editors and the reviewers. Any product that may be evaluated in this article, or claim that may be made by its manufacturer, is not guaranteed or endorsed by the publisher.
1. Iijima, K, Arai, H, Akishita, M, Endo, T, Ogasawara, K, Kashihara, N, et al. Toward the development of a vibrant, super-aged society: the future of medicine and society in Japan. Geriatr Gerontol Int. (2021) 21:601–13. doi: 10.1111/ggi.14201
2. Sasaki, S . What is the scientific definition of the Japanese diet from the viewpoint of nutrition and health? Nutr Rev. (2020) 78:18–26. doi: 10.1093/nutrit/nuaa099
3. Tsugane, S . Why has Japan become the world's most long-lived country: insights from a food and nutrition perspective. Eur J Clin Nutr. (2021) 75:921–8. doi: 10.1038/s41430-020-0677-5
4. GBD 2017 Diet Collaborators . Health effects of dietary risks in 195 countries, 1990-2017: a systematic analysis for the global burden of disease study 2017. Lancet. (2019) 393:1958–72. doi: 10.1016/S0140-6736(19)30041-8
5. Shinozaki, N, Murakami, K, Masayasu, S, and Sasaki, S. Usual nutrient intake distribution and prevalence of nutrient intake inadequacy among Japanese children and adults: a Nationwide study based on 8-day dietary records. Nutrients. (2023) 15:5113. doi: 10.3390/nu15245113
6. Country Nutrition Profiles : Global nutrition REPORT. Available at: https://globalnutritionreport.org/.
7. Hu, FB . Diet strategies for promoting healthy aging and longevity: an epidemiological perspective. J Intern Med. (2023) 295:508–31. doi: 10.1111/joim.13728
8. GBD 2019 Diseases and Injuries Collaborators . Global burden of 369 diseases and injuries in 204 countries and territories, 1990-2019: a systematic analysis for the global burden of disease study 2019. Lancet. (2020) 396:1204–22. doi: 10.1016/S0140-6736(20)30925-9
9. Nishida, Y, Yamada, Y, Sasaki, S, Kanda, E, Kanno, Y, Anzai, T, et al. Effect of overweight/obesity and metabolic syndrome on frailty in middle-aged and older Japanese adults. Obes Sci Pract. (2024) 10:e714. doi: 10.1002/osp4.714
10. Muramoto, A, Matsushita, M, Kato, A, Yamamoto, N, Koike, G, Nakamura, M, et al. Three percent weight reduction is the minimum requirement to improve health hazards in obese and overweight people in Japan. Obes Res Clin Pract. (2014) 8:e466–75. doi: 10.1016/j.orcp.2013.10.003
11. Noguchi, M, Kinuta, M, Sairenchi, T, Yamakawa, M, Koide, K, Katsura, S, et al. Relationship between health counselor characteristics and counseling impact on individuals at high-risk for lifestyle-related disease: sub-analysis of the J-HARP cluster-randomized controlled trial. Int J Environ Res Public Health. (2022) 19:6375. doi: 10.3390/ijerph19116375
12. Nakagomi, A, Yasufuku, Y, Ueno, T, and Kondo, K. Social determinants of hypertension in high-income countries: a narrative literature review and future directions. Hypertens Res. (2022) 45:1575–81. doi: 10.1038/s41440-022-00972-7
13. NCD Risk Factor Collaboration (NCD-RisC) . Worldwide trends in hypertension prevalence and progress in treatment and control from 1990 to 2019: a pooled analysis of 1201 population-representative studies with 104 million participants. Lancet. (2021) 398:957–80. doi: 10.1016/S0140-6736(21)01330-1
14. NCD Risk Factor Collaboration (NCD-RisC) . Worldwide trends in blood pressure from 1975 to 2015: a pooled analysis of 1479 population-based measurement studies with 19·1 million participants. Lancet. (2017) 389:37–55. doi: 10.1016/S0140-6736(16)31919-5
15. Danaei, G, Finucane, MM, Lu, Y, Singh, GM, Cowan, MJ, Paciorek, CJ, et al. National, regional, and global trends in fasting plasma glucose and diabetes prevalence since 1980: systematic analysis of health examination surveys and epidemiological studies with 370 country-years and 2·7 million participants. Lancet. (2011) 378:31–40. doi: 10.1016/S0140-6736(11)60679-X
16. NCD Risk Factor Collaboration (NCD-RisC) . Trends in adult body-mass index in 200 countries from 1975 to 2014: a pooled analysis of 1698 population-based measurement studies with 19·2 million participants. Lancet. (2016) 387:1377–96. doi: 10.1016/S0140-6736(16)30054-X
17. NCD Risk Factor Collaboration (NCD-RisC) . Worldwide trends in diabetes since 1980: a pooled analysis of 751 population-based studies with 4.4 million participants. Lancet. (2016) 387:1513–30. doi: 10.1016/S0140-6736(16)00618-8
18. Satoh, A, Arima, H, Ohkubo, T, Nishi, N, Okuda, N, Ae, R, et al. Associations of socioeconomic status with prevalence, awareness, treatment, and control of hypertension in a general Japanese population: NIPPON DATA2010. J Hypertens. (2017) 35:401–8. doi: 10.1097/HJH.0000000000001169
19. Tsuji, M, Arima, H, Ohkubo, T, Nakamura, K, Takezaki, T, Sakata, K, et al. Socioeconomic status and knowledge of cardiovascular risk factors: NIPPON DATA2010. J Epidemiol. (2018) 28:S46–s52. doi: 10.2188/jea.JE20170255
20. Julia, C, Touvier, M, Méjean, C, Ducrot, P, Péneau, S, Hercberg, S, et al. Development and validation of an individual dietary index based on the British food standard agency nutrient profiling system in a French context. J Nutr. (2014) 144:2009–17. doi: 10.3945/jn.114.199679
21. Julia, C, Kesse-Guyot, E, Touvier, M, Méjean, C, Fezeu, L, and Hercberg, S. Application of the British Food Standards Agency nutrient profiling system in a French food composition database. Br J Nutr. (2014) 112:1699–705. doi: 10.1017/S0007114514002761
22. Adriouch, S, Julia, C, Kesse-Guyot, E, Ducrot, P, Péneau, S, Méjean, C, et al. Association between a dietary quality index based on the food standard agency nutrient profiling system and cardiovascular disease risk among French adults. Int J Cardiol. (2017) 234:22–7. doi: 10.1016/j.ijcard.2017.02.092
23. Montericcio, A, Bonaccio, M, Ghulam, A, Di Castelnuovo, A, Gianfagna, F, de Gaetano, G, et al. Dietary indices underpinning front-of-pack nutrition labels and health outcomes: a systematic review and meta-analysis of prospective cohort studies. Am J Clin Nutr. (2023) 119:756–68. doi: 10.1016/j.ajcnut.2023.12.017
24. Ahn, C, and Lee, CG. Effect of NUTRI-SCORE labeling on sales of food items in stores at sports and non-sports facilities. Prev Med Rep. (2022) 29:101919. doi: 10.1016/j.pmedr.2022.101919
25. Martin, C, Turcotte, M, Cauchon, J, Lachance, A, Pomerleau, S, Provencher, V, et al. Systematic review of nutrient profile models developed for nutrition-related policies and regulations aimed at noncommunicable disease prevention-an update. Adv Nutr. (2023) 14:1499–522. doi: 10.1016/j.advnut.2023.08.013
26. Jones, A, Neal, B, Reeve, B, Ni Mhurchu, C, and Thow, AM. Front-of-pack nutrition labelling to promote healthier diets: current practice and opportunities to strengthen regulation worldwide. BMJ Glob Health. (2019) 4:e001882. doi: 10.1136/bmjgh-2019-001882
27. Phulkerd, S, Dickie, S, Thongcharoenchupong, N, Thapsuwan, S, Machado, P, Woods, J, et al. Choosing an effective food classification system for promoting healthy diets in Thailand: a comparative evaluation of three nutrient profiling-based food classification systems (government, WHO, and healthier choice logo) and a food-processing-based food classification system (NOVA). Front Nutr. (2023) 10:1149813. doi: 10.3389/fnut.2023.1149813
28. Labonté, M, Poon, T, Gladanac, B, Ahmed, M, Franco-Arellano, B, Rayner, M, et al. Nutrient profile models with applications in government-led nutrition policies aimed at health promotion and noncommunicable disease prevention: a systematic review. Adv Nutr. (2018) 9:741–88. doi: 10.1093/advances/nmy045
29. Egnell, M, Boutron, I, Péneau, S, Ducrot, P, Touvier, M, Galan, P, et al. Impact of the Nutri-score front-of-pack nutrition label on purchasing intentions of individuals with chronic diseases: results of a randomised trial. BMJ Open. (2022) 12:e058139. doi: 10.1136/bmjopen-2021-058139
30. Finkelstein, EA, Li, W, Melo, G, Strombotne, K, and Zhen, C. Identifying the effect of shelf nutrition labels on consumer purchases: results of a natural experiment and consumer survey. Am J Clin Nutr. (2018) 107:647–51. doi: 10.1093/ajcn/nqy014
31. Ducrot, P, Julia, C, Méjean, C, Kesse-Guyot, E, Touvier, M, Fezeu, LK, et al. Impact of different front-of-pack nutrition labels on consumer purchasing intentions: a randomized controlled trial. Am J Prev Med. (2016) 50:627–36. doi: 10.1016/j.amepre.2015.10.020
32. El-Abbadi, NH, Taylor, SF, Micha, R, and Blumberg, JB. Nutrient profiling systems, front of pack labeling, and consumer behavior. Curr Atheroscler Rep. (2020) 22:36. doi: 10.1007/s11883-020-00857-5
33. Lehmann, U, Charles, VR, Vlassopoulos, A, Masset, G, and Spieldenner, J. Nutrient profiling for product reformulation: public health impact and benefits for the consumer. Proc Nutr Soc. (2017) 76:255–64. doi: 10.1017/S0029665117000301
34. Greenberg, D, Drewnowski, A, Black, R, Weststrate, JA, and O'Shea, M. A progressive nutrient profiling system to guide improvements in nutrient density of foods and beverages. Front Nutr. (2021) 8:774409. doi: 10.3389/fnut.2021.774409
35. Yu, L, Braesco, V, Cooper, SL, Drewnowski, A, Esteves, BH, and Budelli, AL. The Kraft Heinz company global nutrition targets for the innovation and reformulation of food and beverages: current and future directions. Front Nutr. (2023) 10:1104617. doi: 10.3389/fnut.2023.1104617
36. Vlassopoulos, A, Masset, G, Charles, VR, Hoover, C, Chesneau-Guillemont, C, Leroy, F, et al. A nutrient profiling system for the (re)formulation of a global food and beverage portfolio. Eur J Nutr. (2017) 56:1105–22. doi: 10.1007/s00394-016-1161-9
37. O'Hearn, M, Reedy, J, Robinson, E, Economos, C, Wong, JB, Sacks, G, et al. Landscape analysis of environmental, social and governance (ESG) investing metrics for consumer nutrition and health in the food and beverage sector. BMJ Nutr Prev Health. (2023) 6:139–52. doi: 10.1136/bmjnph-2022-000600
38. Barrett, EM, Afrin, H, Rayner, M, Pettigrew, S, Gaines, A, Maganja, D, et al. Criterion validation of nutrient profiling systems: a systematic review and meta-analysis. Am J Clin Nutr. (2024) 119:145–63. doi: 10.1016/j.ajcnut.2023.10.013
39. Townsend, MS . Where is the science? What will it take to show that nutrient profiling systems work? Am J Clin Nutr. (2010) 91:1109s–15s. doi: 10.3945/ajcn.2010.28450F
40. Mertens, E, and Peñalvo, JL. Mapping the nutritional value of diets across Europe according to the Nutri-score front-of-pack label. Front Nutr. (2022) 9:1080858. doi: 10.3389/fnut.2022.1080858
41. Furuta, C, Jinzu, H, Cao, L, Drewnowski, A, and Okabe, Y. Nutrient profiling of Japanese dishes: the development of a novel Ajinomoto group nutrient profiling system. Front Nutr. (2022) 9:912148. doi: 10.3389/fnut.2022.912148
42. Dunford, EK, Ni Mhurchu, C, Huang, L, Vandevijvere, S, Swinburn, B, Pravst, I, et al. A comparison of the healthiness of packaged foods and beverages from 12 countries using the health star rating nutrient profiling system, 2013-2018. Obes Rev. (2019) 20:107–15. doi: 10.1111/obr.12879
43. Whitton, C, Ramos-García, C, Kirkpatrick, SI, Healy, JD, Dhaliwal, SS, Boushey, CJ, et al. A systematic review examining contributors to Misestimation of food and beverage intake based on short-term self-Report dietary assessment instruments administered to adults. Adv Nutr. (2022) 13:2620–65. doi: 10.1093/advances/nmac085
44. Murakami, K, Livingstone, MBE, Fujiwara, A, and Sasaki, S. Application of the healthy eating Index-2015 and the nutrient-rich food index 9.3 for assessing overall diet quality in the Japanese context: different nutritional concerns from the US. PLoS One. (2020) 15:e0228318. doi: 10.1371/journal.pone.0228318
45. Shimokata, H, Ando, F, and Niino, N. A new comprehensive study on aging--the National Institute for longevity sciences, longitudinal study of aging (NILS-LSA). J Epidemiol. (2000) 10:S1–9. doi: 10.2188/jea.10.1sup_1
46. Zhang, S, Otsuka, R, Nishita, Y, Tange, C, Tomida, M, Ando, F, et al. Twenty-year prospective cohort study of the association between a Japanese dietary pattern and incident dementia: the NILS-LSA project. Eur J Nutr. (2023) 62:1719–29. doi: 10.1007/s00394-023-03107-x
47. Murakami, K, Livingstone, MBE, and Sasaki, S. Diet quality scores in relation to metabolic risk factors in Japanese adults: a cross-sectional analysis from the 2012 National Health and nutrition survey. Jpn Eur J Nutr. (2019) 58:2037–50. doi: 10.1007/s00394-018-1762-6
48. Imai, T, Sakai, S, Mori, K, Ando, F, Niino, N, and Shimokata, H. Nutritional assessments of 3-day dietary records in National Institute for longevity sciences--longitudinal study of aging (NILS-LSA). J Epidemiol. (2000) 10:S70–6. doi: 10.2188/jea.10.1sup_70
49. National Institute of Heath and Nutrition . Health Japan 21 (the second term) analysis and assessment project Available at: https://www.nibiohn.go.jp/eiken/kenkounippon21/en/eiyouchousa/.
50. Wakayama, R, Drewnowski, A, Horimoto, T, Saito, Y, Yu, T, Suzuki, T, et al. Development and validation of the Meiji nutritional profiling system (Meiji NPS) to address dietary needs of adults and older adults in Japan. Nutrients. (2024) 16:936. doi: 10.3390/nu16070936
51. Friedewald, WT, Levy, RI, and Fredrickson, DS. Estimation of the concentration of low-density lipoprotein cholesterol in plasma, without use of the preparative ultracentrifuge. Clin Chem. (1972) 18:499–502. doi: 10.1093/clinchem/18.6.499
52. Scarborough, P, Rayner, M, and Stockley, L. Developing nutrient profile models: a systematic approach. Public Health Nutr. (2007) 10:330–6. doi: 10.1017/S1368980007223870
53. Julia, C, Ducrot, P, Lassale, C, Fézeu, L, Méjean, C, Péneau, S, et al. Prospective associations between a dietary index based on the British food standard agency nutrient profiling system and 13-year weight gain in the SU.VI.MAX cohort. Prev Med. (2015) 81:189–94. doi: 10.1016/j.ypmed.2015.08.022
54. Egnell, M, Seconda, L, Neal, B, Mhurchu, CN, Rayner, M, Jones, A, et al. Prospective associations of the original Food Standards Agency nutrient profiling system and three variants with weight gain, overweight and obesity risk: results from the French NutriNet-Santé cohort. Br J Nutr. (2021) 125:902–14. doi: 10.1017/S0007114520003384
55. Khoury, N, Gómez-Donoso, C, Martínez, M, Martínez-González, M, Corella, D, Fitó, M, et al. Associations between the modified food standard agency nutrient profiling system dietary index and cardiovascular risk factors in an elderly population. Front Nutr. (2022) 9:897089. doi: 10.3389/fnut.2022.897089
56. Ge, L, Sadeghirad, B, Ball, GDC, da Costa, BR, Hitchcock, CL, Svendrovski, A, et al. Comparison of dietary macronutrient patterns of 14 popular named dietary programmes for weight and cardiovascular risk factor reduction in adults: systematic review and network meta-analysis of randomised trials. BMJ. (2020) 369:m696. doi: 10.1136/bmj.m696
57. Drewnowski, A, Fiddler, EC, Dauchet, L, Galan, P, and Hercberg, S. Diet quality measures and cardiovascular risk factors in France: applying the healthy eating index to the SU.VI.MAX study. J Am Coll Nutr. (2009) 28:22–9. doi: 10.1080/07315724.2009.10719757
58. Qorbani, M, Mahdavi-Gorabi, A, Khatibi, N, Ejtahed, HS, Khazdouz, M, Djalalinia, S, et al. Dietary diversity score and cardio-metabolic risk factors: an updated systematic review and meta-analysis. Eat Weight Disord. (2022) 27:85–100. doi: 10.1007/s40519-020-01090-4
59. Dietschy, JM . Dietary fatty acids and the regulation of plasma low density lipoprotein cholesterol concentrations. J Nutr. (1998) 128:444S–8S. doi: 10.1093/jn/128.2.444S
60. Schoeneck, M, and Iggman, D. The effects of foods on LDL cholesterol levels: a systematic review of the accumulated evidence from systematic reviews and meta-analyses of randomized controlled trials. Nutr Metab Cardiovasc Dis. (2021) 31:1325–38. doi: 10.1016/j.numecd.2020.12.032
61. Chen, HJ, Chuang, SY, Chang, HY, and Pan, WH. Energy intake at different times of the day: its association with elevated total and LDL cholesterol levels. Nutr Metab Cardiovasc Dis. (2019) 29:390–7. doi: 10.1016/j.numecd.2019.01.003
62. Okami, Y, Ueshima, H, Nakamura, Y, Okuda, N, Nakagawa, H, Sakata, K, et al. The relationship of dietary cholesterol with serum low-density lipoprotein cholesterol and confounding by reverse causality: the INTERLIPID study. J Atheroscler Thromb. (2019) 26:170–82. doi: 10.5551/jat.43075
63. Nakamura, Y, Okuda, N, Turin, TC, Fujiyoshi, A, Okamura, T, Hayakawa, T, et al. Fatty acids intakes and serum lipid profiles: NIPPON DATA90 and the national nutrition monitoring. J Epidemiol. (2010) 20:S544–8. doi: 10.2188/jea.JE20090223
64. Nakamura, Y, Ueshima, H, Okuda, N, Miura, K, Kita, Y, Miyagawa, N, et al. Relationship of three different types of low-carbohydrate diet to cardiometabolic risk factors in a Japanese population: the INTERMAP/INTERLIPID study. Eur J Nutr. (2016) 55:1515–24. doi: 10.1007/s00394-015-0969-z
65. Oono, F, Murakami, K, Fujiwara, A, Shinozaki, N, Adachi, R, Asakura, K, et al. Development of a diet quality score for Japanese and comparison with existing diet quality scores regarding inadequacy of nutrient intake. J Nutr. (2023) 153:798–810. doi: 10.1016/j.tjnut.2022.11.022
66. Allès, B, Samieri, C, Féart, C, Jutand, MA, Laurin, D, and Barberger-Gateau, P. Dietary patterns: a novel approach to examine the link between nutrition and cognitive function in older individuals. Nutr Res Rev. (2012) 25:207–22. doi: 10.1017/S0954422412000133
67. Mozaffarian, D, El-Abbadi, NH, O'Hearn, M, Erndt-Marino, J, Masters, WA, Jacques, P, et al. Food compass is a nutrient profiling system using expanded characteristics for assessing healthfulness of foods. Nat Food. (2021) 2:809–18. doi: 10.1038/s43016-021-00381-y
68. O'Hearn, M, Erndt-Marino, J, Gerber, S, Lauren, BN, Economos, C, Wong, JB, et al. Validation of food compass with a healthy diet, cardiometabolic health, and mortality among U.S. adults, 1999-2018. Nat Commun. (2022) 13:7066. doi: 10.1038/s41467-022-34195-8
69. Detopoulou, P, Damigou, E, Antonopoulou, S, Fragopoulou, E, Chysohoou, C, Pitsavos, C, et al. Food compass score and its association with inflammatory markers and homocysteine in cardiovascular disease-free adults: a cross-sectional analysis of the ATTICA epidemiological study. Eur J Clin Nutr. (2023) 77:998–1004. doi: 10.1038/s41430-023-01300-z
70. Damigou, E, Detopoulou, P, Antonopoulou, S, Chrysohoou, C, Barkas, F, Vlachopoulou, E, et al. Food compass score predicts incident cardiovascular disease: the ATTICA cohort study (2002-2022). J Hum Nutr Diet. (2024) 37:203–16. doi: 10.1111/jhn.13247
71. Alpers, DH, Bier, DM, Carpenter, KJ, McCormick, DB, Miller, AB, and Jacques, PF. History and impact of nutritional epidemiology. Adv Nutr. (2014) 5:534–6. doi: 10.3945/an.114.006353
72. Mozaffarian, D, Rosenberg, I, and Uauy, R. History of modern nutrition science-implications for current research, dietary guidelines, and food policy. BMJ. (2018) 361:k2392. doi: 10.1136/bmj.k2392
73. Matsumoto, M, Murakami, K, Yuan, X, Oono, F, Adachi, R, Tajima, R, et al. A scoping review of dietary assessment questionnaires potentially suitable for assessing habitual dietary intake in the National Health and nutrition survey, Japan. J Nutr Sci. (2024) 13:e8. doi: 10.1017/jns.2024.1
74. Murakami, K, Livingstone, MBE, and Sasaki, S. Thirteen-year trends in dietary patterns among Japanese adults in the National Health and nutrition survey 2003−2015: continuous westernization of the Japanese diet. Nutrients. (2018) 10:994. doi: 10.3390/nu10080994
75. Miller, V, Webb, P, Cudhea, F, Shi, P, Zhang, J, Reedy, J, et al. Global dietary quality in 185 countries from 1990 to 2018 show wide differences by nation, age, education, and urbanicity. Nat Food. (2022) 3:694–702. doi: 10.1038/s43016-022-00594-9
76. GBD 2021 Causes of Death Collaborators . Global burden of 288 causes of death and life expectancy decomposition in 204 countries and territories and 811 subnational locations, 1990-2021: a systematic analysis for the global burden of disease study 2021. Lancet. (2024) 403:2100–32. doi: 10.1016/S0140-6736(24)00367-2
77. Imamura, M, Sasaki, H, Shinto, T, Tahara, Y, Makino, S, Kuwahara, M, et al. Association between Na, K, and lipid intake in each meal and blood pressure. Front Nutr. (2022) 9:853118. doi: 10.3389/fnut.2022.853118
78. Patrão, AL, Almeida, MDC, Matos, SMA, Chor, D, and Aquino, EML. Gender and psychosocial factors associated with healthy lifestyle in the Brazilian longitudinal study of adult health (ELSA-Brasil) cohort: a cross-sectional study. BMJ Open. (2017) 7:e015705. doi: 10.1136/bmjopen-2016-015705
79. Gressier, M, Privet, L, Mathias, KC, Vlassopoulos, A, Vieux, F, and Masset, G. Modeled dietary impact of industry-wide food and beverage reformulations in the United States and France. Am J Clin Nutr. (2017) 106:225–32. doi: 10.3945/ajcn.117.153361
Keywords: nutrient profiles, nutritional profiling model, nutritional quality, product reformulation, healthy food, healthy society, non-communicable diseases
Citation: Yu T, Zhang S, Wakayama R, Horimoto T, Tange C, Nishita Y and Otsuka R (2024) The relationship between the dietary index based Meiji nutritional profiling system for adults and lifestyle-related diseases: a predictive validity study from the National Institute for Longevity Sciences—Longitudinal Study of Aging. Front. Nutr. 11:1413980. doi: 10.3389/fnut.2024.1413980
Edited by:
Macarena Lozano-Lorca, University of Granada, SpainReviewed by:
Pulkit Mathur, University of Delhi, IndiaCopyright © 2024 Yu, Zhang, Wakayama, Horimoto, Tange, Nishita and Otsuka. This is an open-access article distributed under the terms of the Creative Commons Attribution License (CC BY). The use, distribution or reproduction in other forums is permitted, provided the original author(s) and the copyright owner(s) are credited and that the original publication in this journal is cited, in accordance with accepted academic practice. No use, distribution or reproduction is permitted which does not comply with these terms.
*Correspondence: Tao Yu, dGFvLnl1QG1laWppLmNvbQ==
Disclaimer: All claims expressed in this article are solely those of the authors and do not necessarily represent those of their affiliated organizations, or those of the publisher, the editors and the reviewers. Any product that may be evaluated in this article or claim that may be made by its manufacturer is not guaranteed or endorsed by the publisher.
Research integrity at Frontiers
Learn more about the work of our research integrity team to safeguard the quality of each article we publish.