
95% of researchers rate our articles as excellent or good
Learn more about the work of our research integrity team to safeguard the quality of each article we publish.
Find out more
ORIGINAL RESEARCH article
Front. Nutr. , 07 June 2024
Sec. Nutritional Epidemiology
Volume 11 - 2024 | https://doi.org/10.3389/fnut.2024.1410154
This article is part of the Research Topic Optimal Omegas View all 10 articles
 Yifan Li1†
 Hao Tang1,2†Xiaotong Yang1Lili Ma1Hangqi Zhou1Guangjiang Zhang1Xin Chen1Lijun Ma1Jing Gao1Wei Ji3*
Background: In recent years, diseases caused by abnormal immune-inflammatory responses have become increasingly severe. Dietary intervention involving omega-3 polyunsaturated fatty acids (ω-3 PUFAs) has emerged as a potential treatment. However, research investigating the relationship between ω-3, ω-6 PUFAs, and ω-6 to ω-3 ratio with inflammatory biomarkers remains controversial.
Methods: To investigate the correlation between the intake of ω-3 and ω-6 PUFAs and the ratio of ω-6: ω-3 with biomarkers of inflammation, the National Health and Nutrition Examination Survey (NHANES) data (1999 to 2020) was utilized. The systemic immune-inflammation index (SII), platelet-lymphocyte ratio (PLR), neutrophil-lymphocyte ratio (NLR), and white blood cell (WBC) were selected as study subjects. Dietary data for ω-3 and ω-6 PUFAs were collected via two 24-h dietary recall interviews. SII index and other indicators were obtained from the blood routine data. The multiple linear regression and restricted cubic spline models were utilized to evaluate the association of ω-3, ω-6 PUFAs intake, and ω-6: ω-3 ratio to SII and secondary measures.
Results: This study involved a total of 43,155 American adults. ω-3 and ω-6 PUFAs exhibited negative correlations with SII, PLR, NLR, and WBC. The correlation between ω-6: ω-3 ratio and SII, PLR, NLR, and WBC was not significant. Furthermore, the dose–response relationship showed that the relationship between the intake of ω-3 and ω-6 PUFAs and SII was an “L” pattern.
Conclusion: Intake of dietary ω-3 and ω-6 PUFAs reduces the levels of several inflammatory biomarkers in the body and exerts immunomodulatory effects.
An immune-inflammatory response refers to the systemic response of the immune system of the body to a particular state. This response is involved not only in acute inflammation caused by infection or injury but also in the normal homeostatic regulation of the body (1, 2). However, prolonged chronic systemic inflammation elevates the risk of various disorders, including autoimmune disease, cardiovascular disease (CVD), cancer, and diabetes (3–7).
Dietary polyunsaturated fatty acids (PUFAs), serving as vital energy sources and cell membrane components, exert a crucial impact on human health (8, 9). Clinical trials and experimental research have demonstrated that ω-3 PUFAs possess significant anti-inflammatory properties (10, 11). Although ω-6 PUFAs are often theoretically considered pro-inflammatory mediators, the findings from clinical research do not consistently support this conventional hypothesis. Arachidonic acid (AA) supplementation was found to elevate AA content in human plasma or cellular phospholipids in a randomized controlled study and crossover design study conducted in the UK and US, respectively. However, it did not exert a significant impact on pro-inflammatory cytokine production and the number of inflammatory cells (12–14). Conversely, some investigations have even proposed that ω-6 PUFAs may be linked to decreased inflammation (15–17). Additionally, research on the relationship between ω-6: ω-3 ratio and inflammatory markers has yielded conflicting results. Numerous investigations have revealed that the proportion of ω-6: ω-3 is positively correlated with inflammatory markers (18–20). While Harris (21, 22) collated and analyzed 11 case–control and two prospective cohort studies, it was considered that the clinical ω-6: ω-3 ratio could not serve as a reliable indicator for predicting disease status or providing nutritional reference.
The concept of systemic immune-inflammation index (SII) was initially introduced by Hu (23) and has been applied in several disease areas, such as CVD, respiratory diseases, autoimmune diseases, and some cancers (4, 23–27). Additionally, platelet-lymphocyte ratio (PLR), neutrophil-lymphocyte ratio (NLR), and white blood cell (WBC) count are important indicators commonly used for early detection and prediction of inflammatory diseases in clinical practice and have also been widely used in clinical studies (28–30).
Clinical interventions and experimental studies on dietary ω-3 and ω-6 PUFAs have not elucidated the relationship between the two and inflammatory mediators. Similarly, there is no consensus on the effects of the optimal ratio of ω-6 to ω:3 PUFA in humans. Therefore, this study investigated a dataset of ethnically diverse cohorts of Americans aged 20 years and older from the National Health and Nutrition Examination Survey (NHANES) data to analyze the relationship between intake of ω-3, ω-6 PUFAs and the ratio of ω-6 to ω:3 and systemic immune-inflammatory markers to provide more compelling evidence for clinical interventions and therapies.
The National Health and Nutrition Examination Survey (NHANES), carried out by the Centers for Disease Control and Prevention (CDC), is a cross-sectional survey undertaken on a biennial basis. Its purpose is to analyze the nutritional and health status of children and adults in the US. This assessment is carried out by selecting a representative sample of the US population employing a complex multistage probability sampling design (31). NHANES contains interviews covering demographic, dietary, health-related, and socio-economic issues, alongside laboratory tests performed by highly qualified medical personnel (32). For this study, we included 116,876 participants who took part in the survey during the period 1999–2020. Our study exclusion criteria were as follows: (1) adults younger than 20 years of age (n = 52,563) (2) dietary fatty acid data were incomplete or abnormal and missing laboratory tests (n = 10,328) (3) any other covariates were missing (n = 10,830). After that, this study comprised 43,155 individuals, including 22,575 women and 20,580 men (age: ≥20 years) (Figure 1).
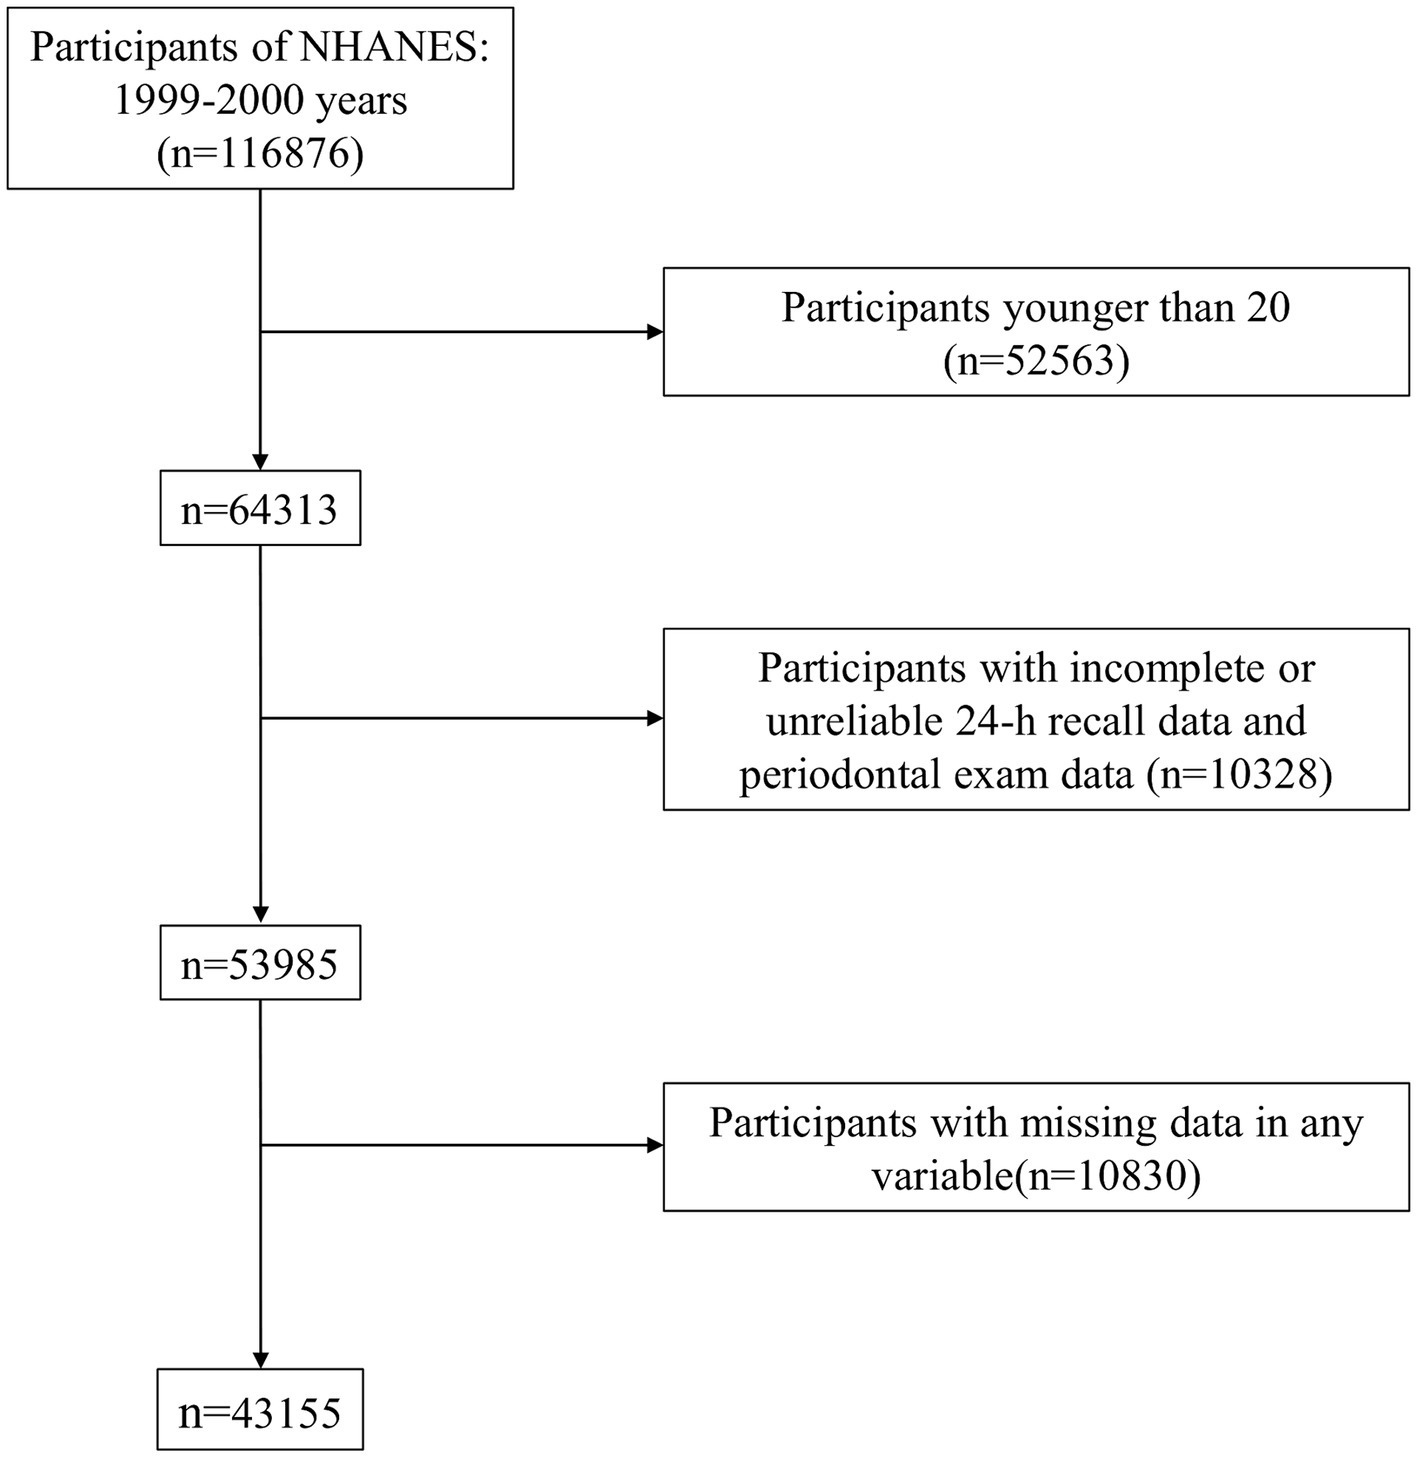
Figure 1. Flowchart of the screening process for the selection of eligible participants.
During the Mobile Examination Centre (MEC) portion of NHANES, ω-3 and ω-6 PUFAs dietary intake was obtained through two 24-h dietary recalls administered 3 to 10 days apart. The main diet interview was conducted in the MEC, and subsequent diet interview data were obtained by the Home Office via telephone. Comprehensive descriptions of the data processing procedures and diet interviews are available in the Diet Interview section of the NHANES website. α-linoleic acid (ALA, 18:3), docosapentaenoic acid (DPA, 22:5), docosahexaenoic acid (DHA, 22:6), eicosapentaenoic acid (EPA, 20:5), and stearidonic acid (SDA, 18:4) are constituents of ω-3 PUFAs. On the other hand, AA (20:4) and linoleic acid (LA, 18:2) are included in ω-6 PUFAs. Dietary intake of ω-3, ω-6 PUFAs, and ω-6: ω-3 ratios were categorized into tertiles for subsequent analyses.
The primary outcome was SII calculated as platelet count × neutrophil count/lymphocyte count (33). NLR = Neutrophil count/lymphocyte count. PLR = platelet count/lymphocyte count. WBC count was obtained directly from a blood routine. NHANES implemented standardized protocols for the measurement of these biomarkers, and all investigators obtained written informed consent from participants.
Alongside the investigation of ω-3 and ω-6 PUFAs dietary intake, several potential confounders were examined, including age (20–40, 41–60, and ≥ 60 years), body mass index (BMI) (normal: <25 kg/m2; overweight: 25–30 kg/m2; obesity: ≥30 kg/m2), educational level (below high school, high school, or above), marital status (married/cohabiting with partner or divorced/widowed/never married/separated), poverty income ratio (PIR) (below poverty line: ≤0.99, above poverty line: ≥1), race (Mexican Americans, non-Hispanic whites, non-Hispanic blacks, other Hispanics, and other races), smoking status (never, before, and now), and sex (men and women).
Due to the complex sampling design employed by NHANES, all experiments were adjusted for weighted variables and survey design to ensure that the included population was nationally representative. The Kolmogorov–Smirnov normality test was utilized to examine the normality of continuous variables, which are expressed as mean ± standard error. Variables that were not normally distributed were presented utilizing the median (interquartile range). Adjusted dietary intake of ω-3 and ω-6 PUFAs was categorized into three groups based on tertiles, with the lowest tertile serving as the reference value. Multivariate weighted linear regression models were utilized to determine the correlation between dietary ω-3, ω-6 PUFAs, and ω-6: ω-3 ratios and SII as well as other secondary outcomes. For each regression analysis, a total of three statistical models were developed. Model 1 remained unadjusted, while Model 2 was adjusted for age and sex only. Model 3 encompassed adjustments for all covariates, including age, BMI, education, monthly household poverty level index, marital status, race, sex, and smoking status. Fully adjusted models considered demographic, dietary, lifestyle, and metabolic factors. To further investigate the dose–response correlation between dietary ω-3 and ω-6 PUFAs, as well as the ω-6: ω-3 ratios with the primary measure SII, the restricted cubic splines were applied. These splines included three nodes at the 5th, 50th, and 95th percentiles of the exposure distribution in multivariate-adjusted model 3. All statistical analyses were performed using R software for data analysis. All statistical tests were two-sided, and p < 0.05 was deemed to reflect statistical significance.
Tables 1–3 present the baseline attributes of the study population, categorized by dietary intake of ω-3, ω-6 PUFAs, and ω-6: ω-3 ratios in triple-digit groups, respectively. The study comprised 43,155 participants in total. The tertile intervals for ω-3 fatty acid intake were: low intake (≤ 1.167 g/day, n = 14,401), medium intake (1.167–1.928 g/day, n = 14,364), and high intake (>1.928 g/day, n = 14,390). Tertile intervals for ω-6 fatty acid intake were defined as low dose intake (≤ 10.929 g/day, n = 14,387), medium dose intake (10.929–17.63 g/day, n = 14,384), and high dose intake (>17.63 g/day, n = 14,384). The tertile interval for the ω-6: ω-3 proportion of fatty acid intake was: low (≤ 8.19, n = 14,383), medium (8.19–10.13, n = 14,383), and high (≥10.13, n = 14,389). Participants with higher ω-3 and ω-6 PUFAs intake tended to be young and medium-aged, male, married or cohabiting with a partner, non-Hispanic white, higher educational level, wealthier, and non-smoking. Regarding laboratory parameters, individuals with higher ω-3 and ω-6 PUFAs intake demonstrated lower levels of SII, PLR, and WBC.
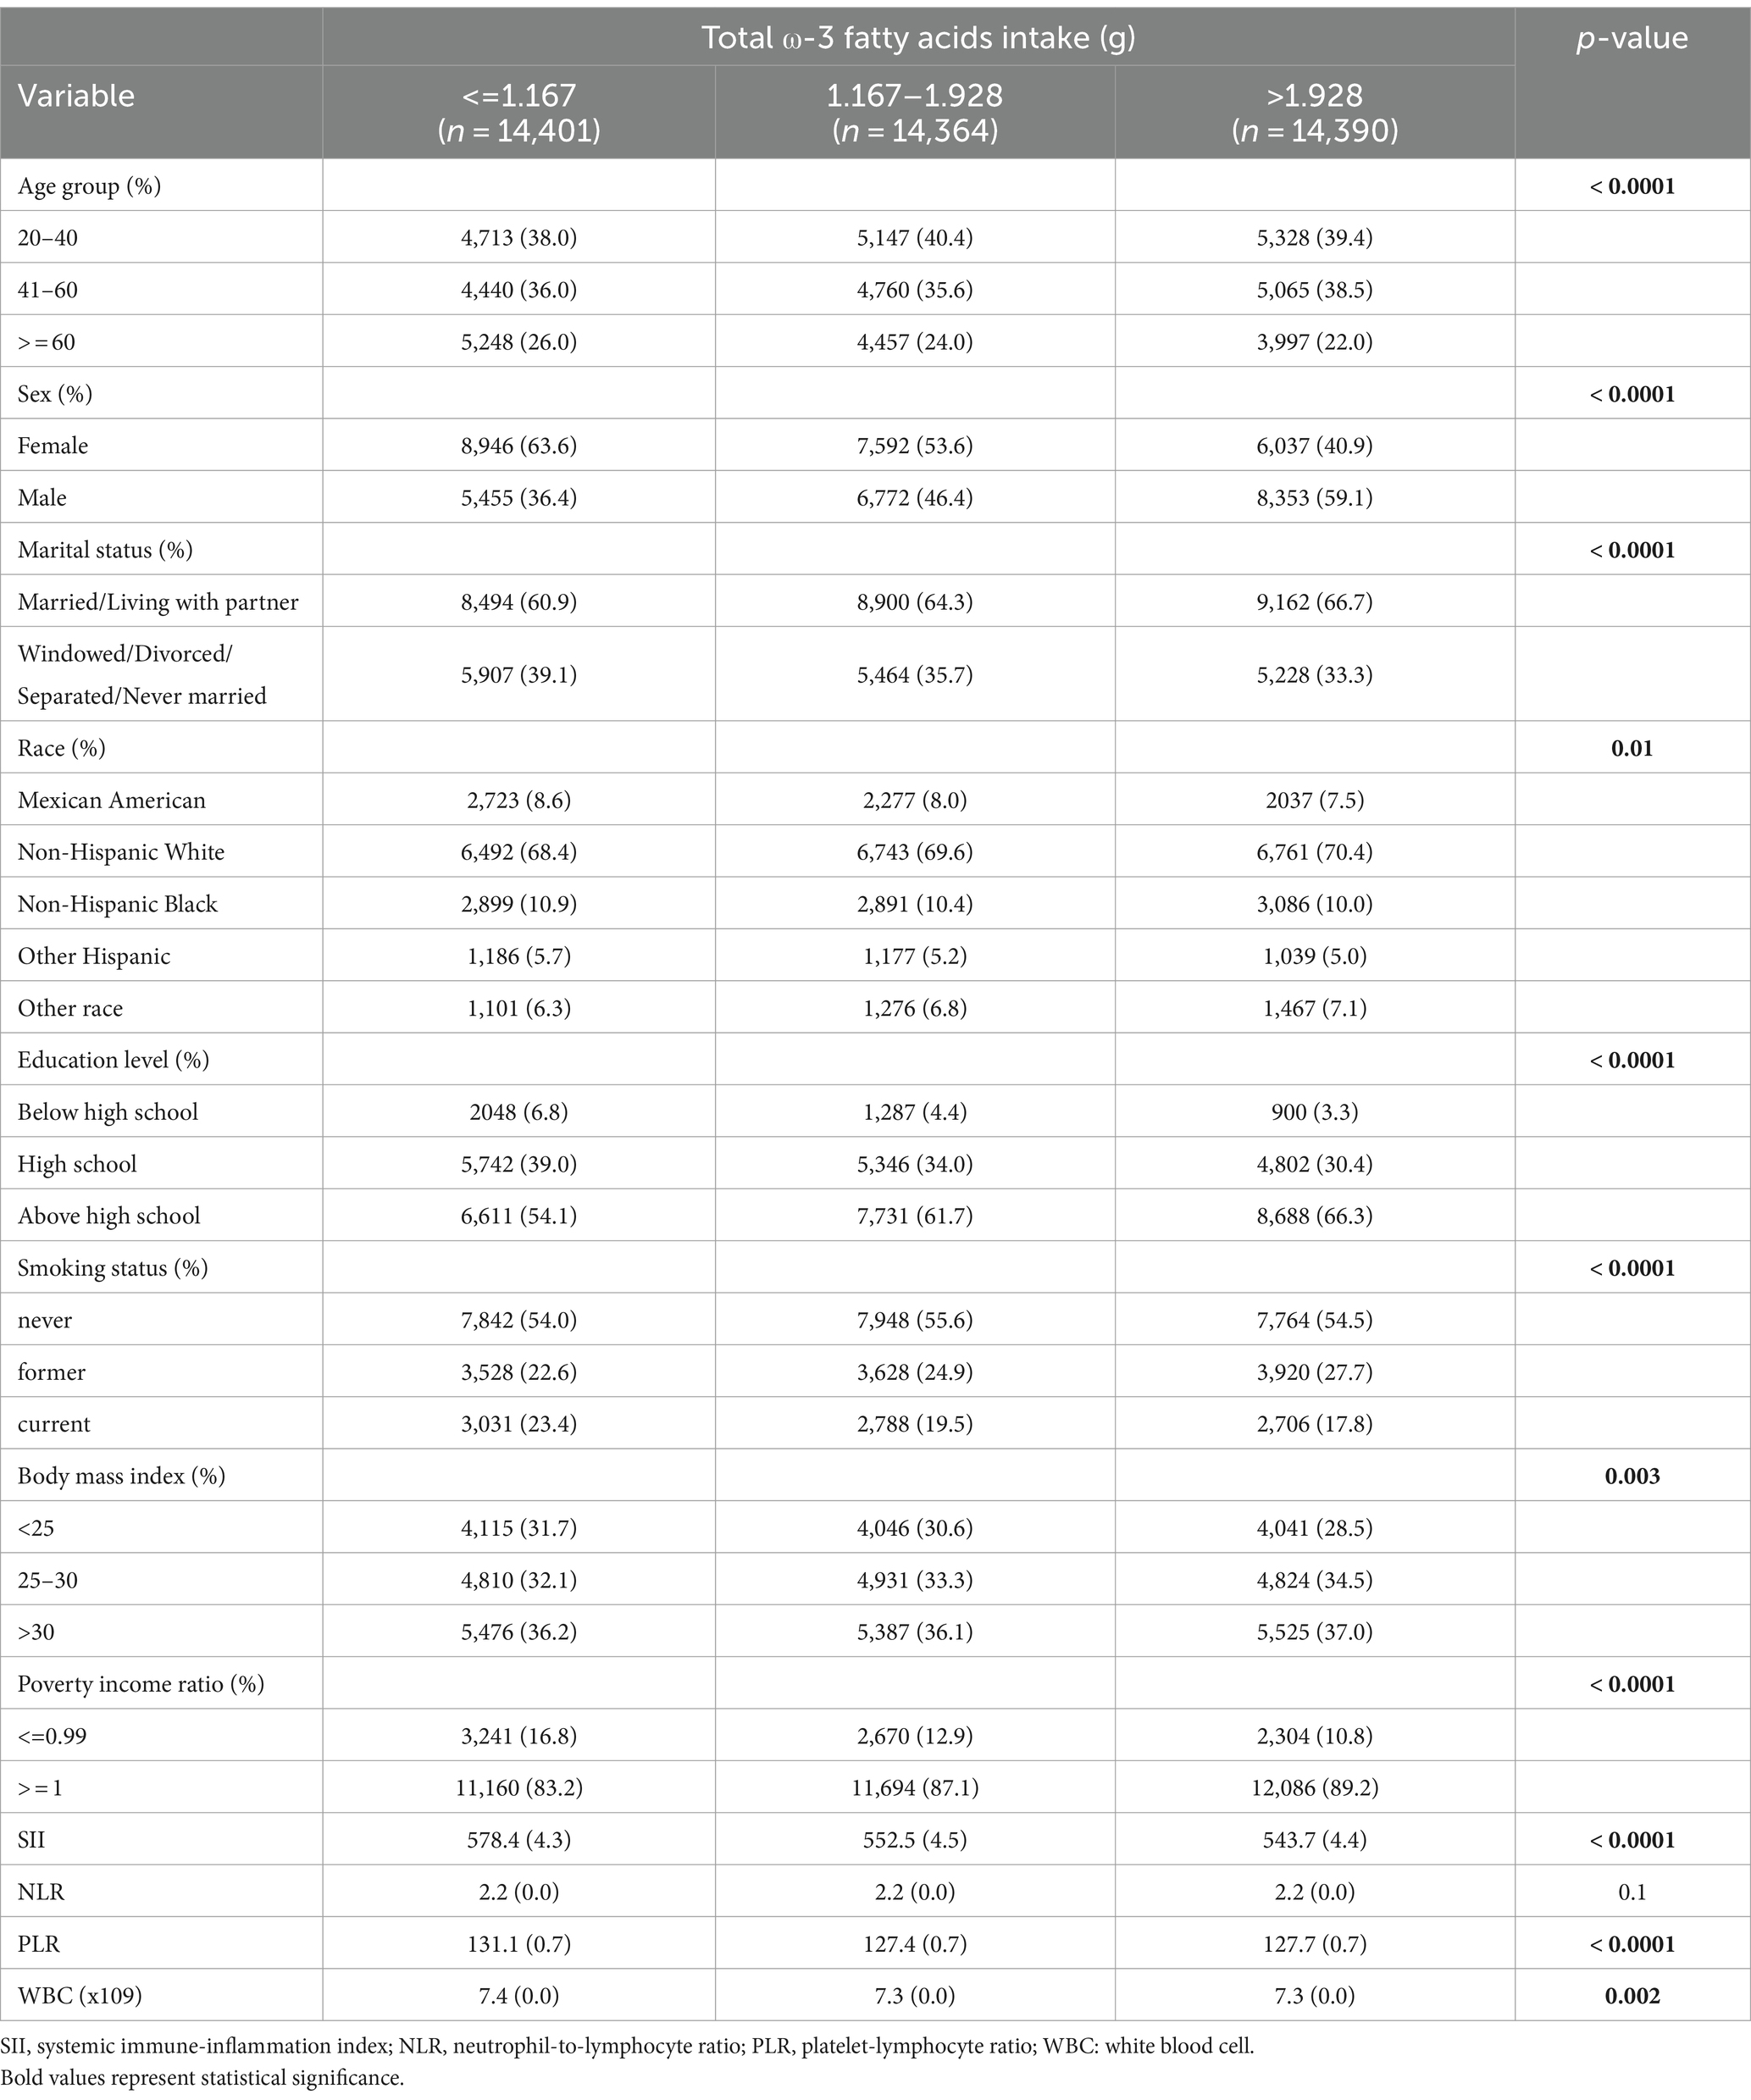
Table 1. Weighted characteristics of the study population based on dietary ω-3 fatty acids intake.
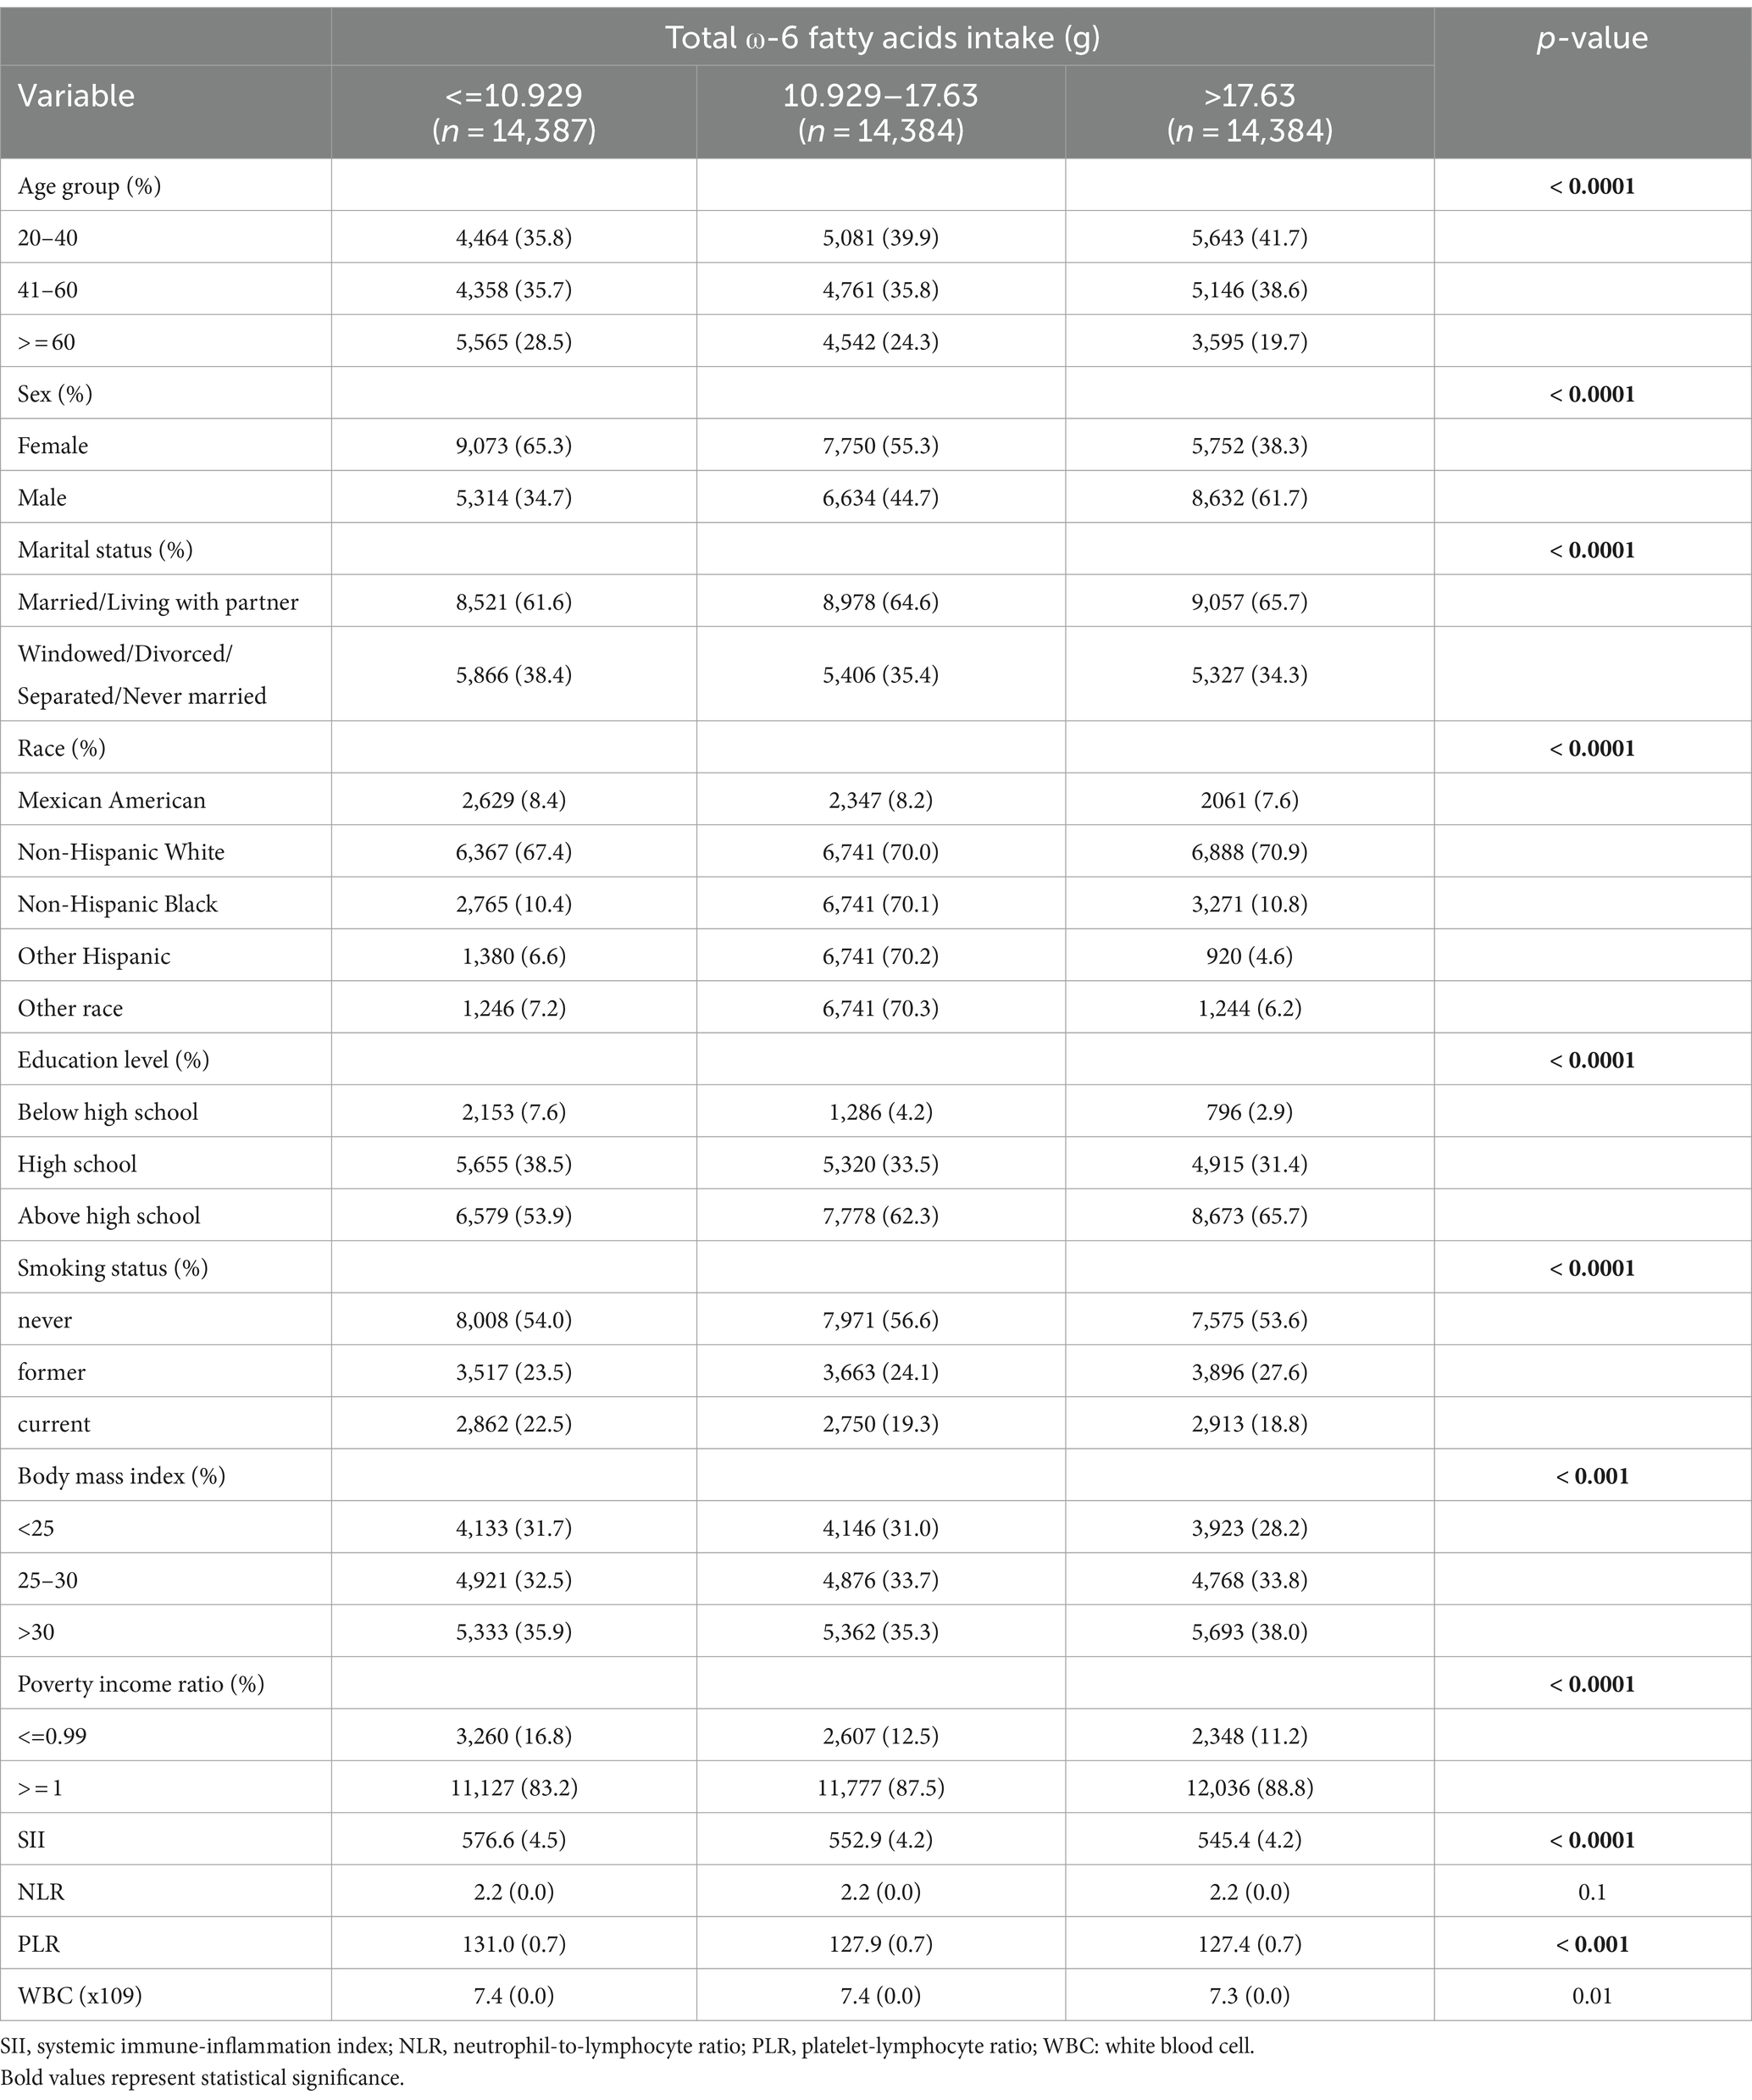
Table 2. Weighted characteristics of the study population based on dietary ω-6 fatty acids intake.
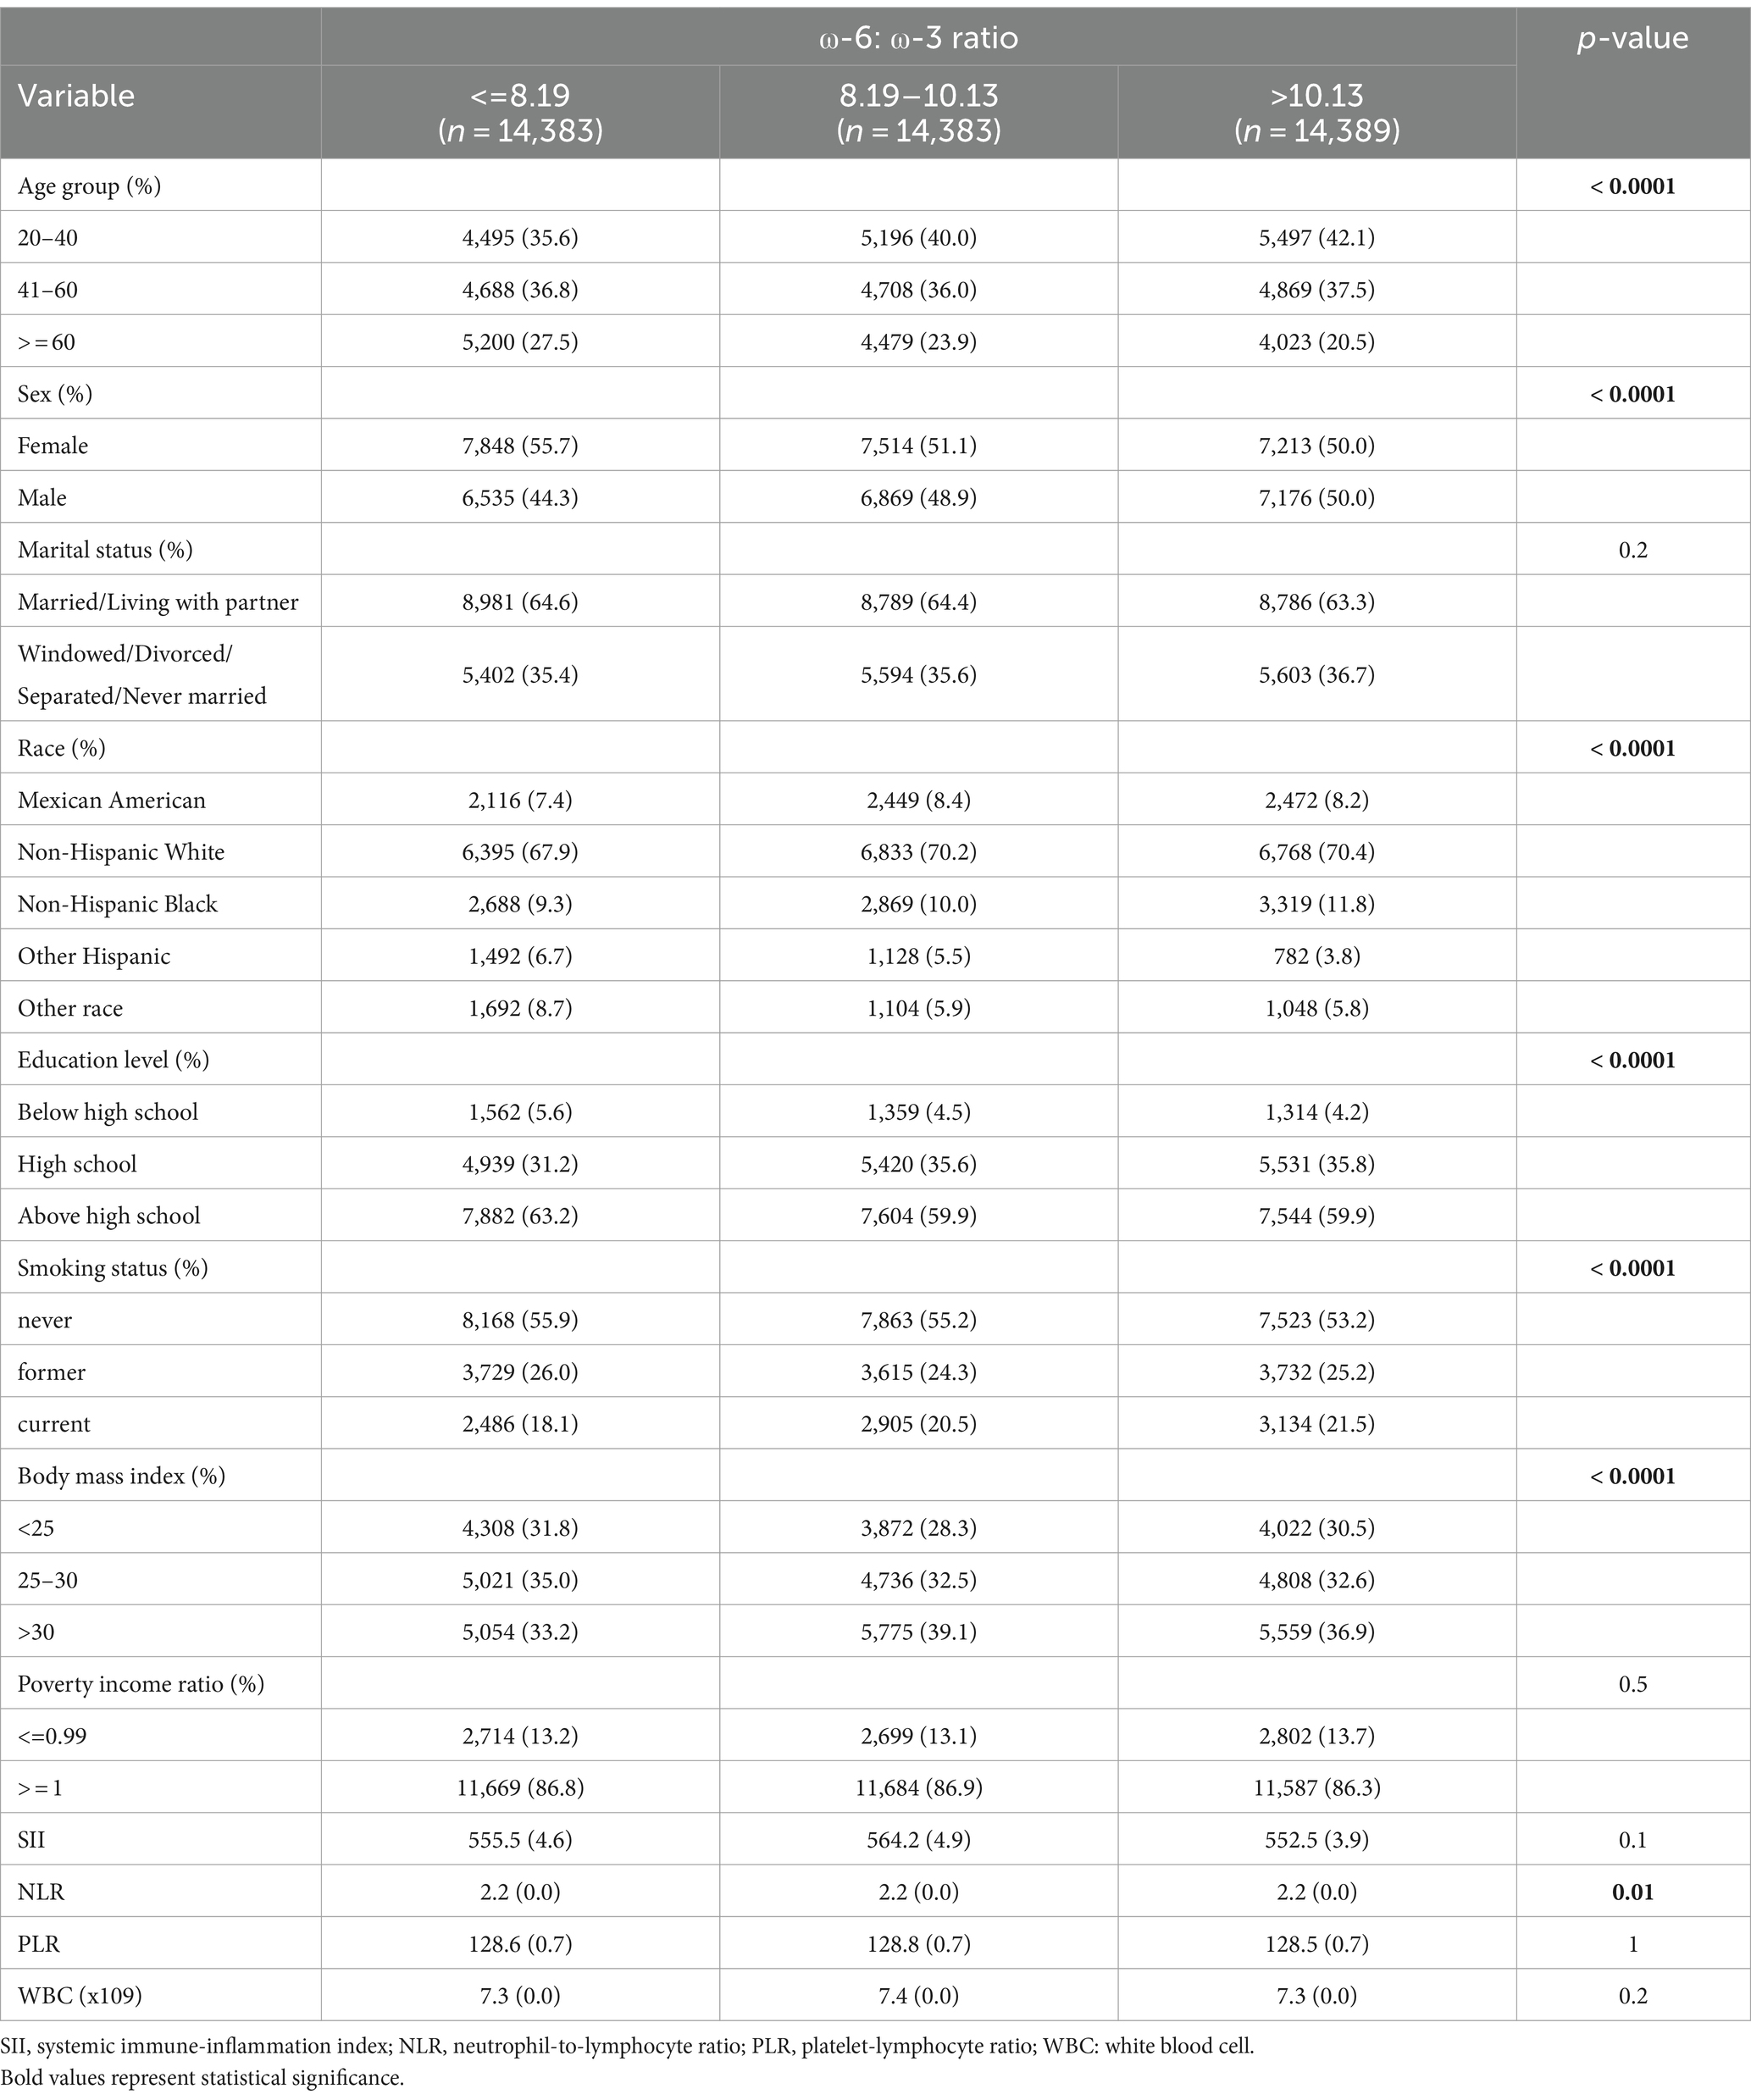
Table 3. Weighted characteristics of the study population based on dietary ω-6: ω-3 ratio.
Table 4 shows the relationship between the dietary intake of ω-3, ω-6 PUFAs and ω-6: ω-3 ratio and SII. In all three models, there was a clear negative correlation between ω-3 and ω-6 PUFAs intake and SII. In model 1, the effect size (β) and 95% confidence intervals (CI) for SII were −34.662 (−46.069, −23.256) and − 31.157 (−41.912, −20.402) for the high-dose intake group of ω-3 and ω-6 PUFAs, respectively. In model 2, there was a negative relationship between the high-dose intake group of ω-3 and ω-6 PUFAs and SII, with β and 95% CI of −25.004 (−36.653, −13.354) and −18.021 (−29.131, −6.911), respectively. In model 3, a negative relationship was found between the high-dose intake group of ω-3 and ω-6 PUFAs and SII, with β and 95% CI of −21.309 (−33.098, −9.520) and −15.557 (−26.681, −4.434), respectively. The p-values for trend were statistically significant for ω-3 and ω-6 PUFAs intake (p trend <0.001). However, the correlation between the proportion of ω-6: ω-3 fatty acid intake and SII was not statistically significant. In Model 2, there was a positive correlation between the medium scale group of ω-6: ω-3 ratios and SII, with β and 95% CI of 12.163 (0.127, 24.199).
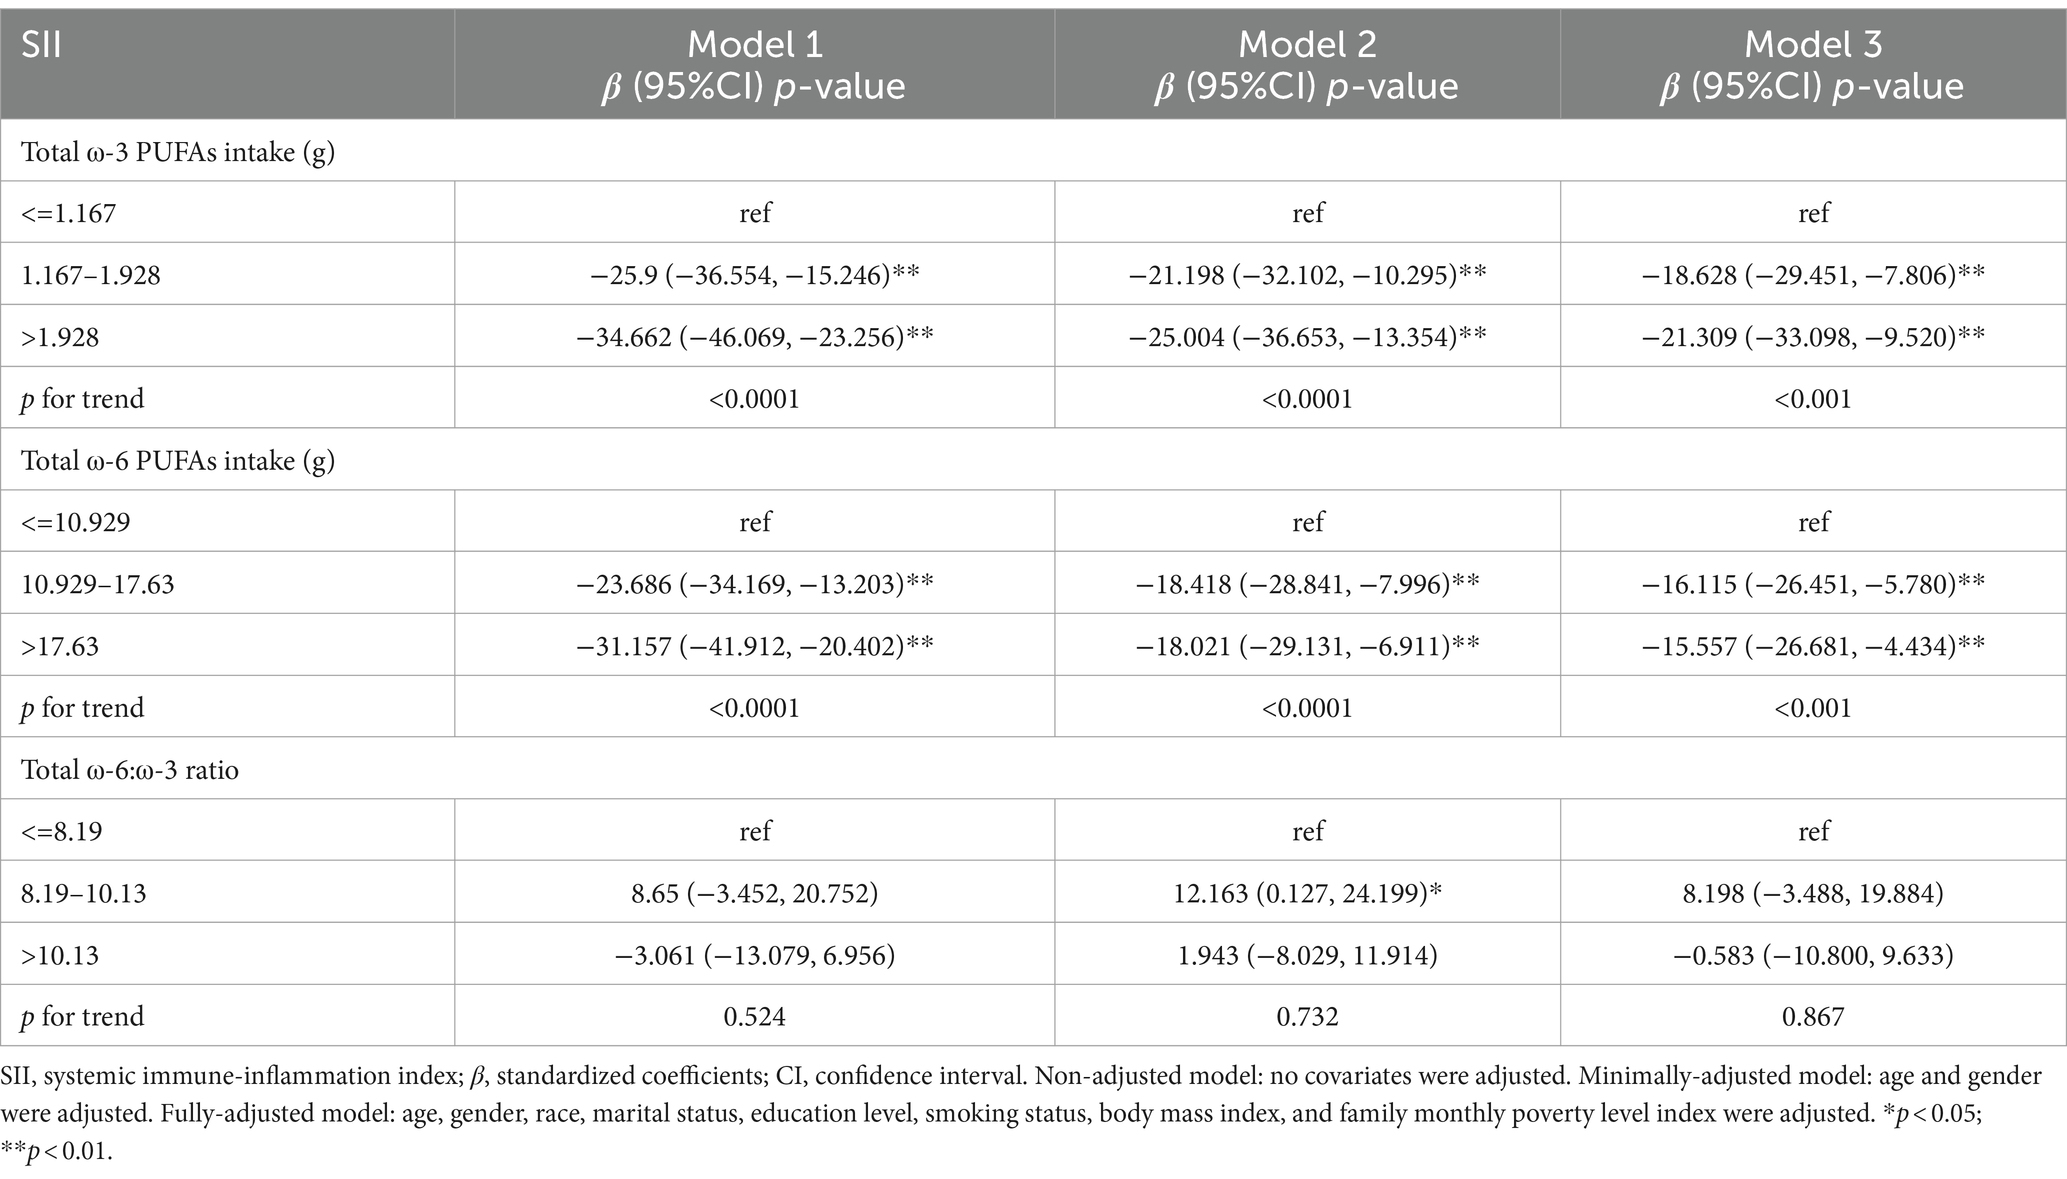
Table 4. Survey-weighted multivariate regression analyses of associations between dietary ω-3 and ω-6 PUFAs intake and ω-6:ω-3 ratio and SII.
Table 5 shows the dietary intake of ω-3, ω-6 PUFAs, and the relationship between ω-6: ω-3 ratio and PLR. In model 1, the β and 95% CI for PLR were −3.369 (−5.145, −1.593) and −3.606 (−5.428, −1.784) for the high-dose intake group of ω-3 and ω-6 PUFAs, respectively. In model 2, there was an inverse relationship between the high-dose intake group of ω-3 and ω-6 PUFAs and PLR, with β and 95% CI of −2.777 (−4.595, −0.959) and −1.958 (−3.608, −0.308), respectively. In model 3, a negative relationship was found between the high-dose intake group of ω-3 and ω-6 PUFAs and PLR, with β and 95% CI of −2.555 (−4.374, −0.735) and −1.867 (−3.702, −0.033), respectively. The p-values for trend for ω-3 and ω-6 PUFAs intake were statistically significant (p < 0.001). The correlation between ω-6: ω-3 ratio and PLR did not exhibit statistical significance.
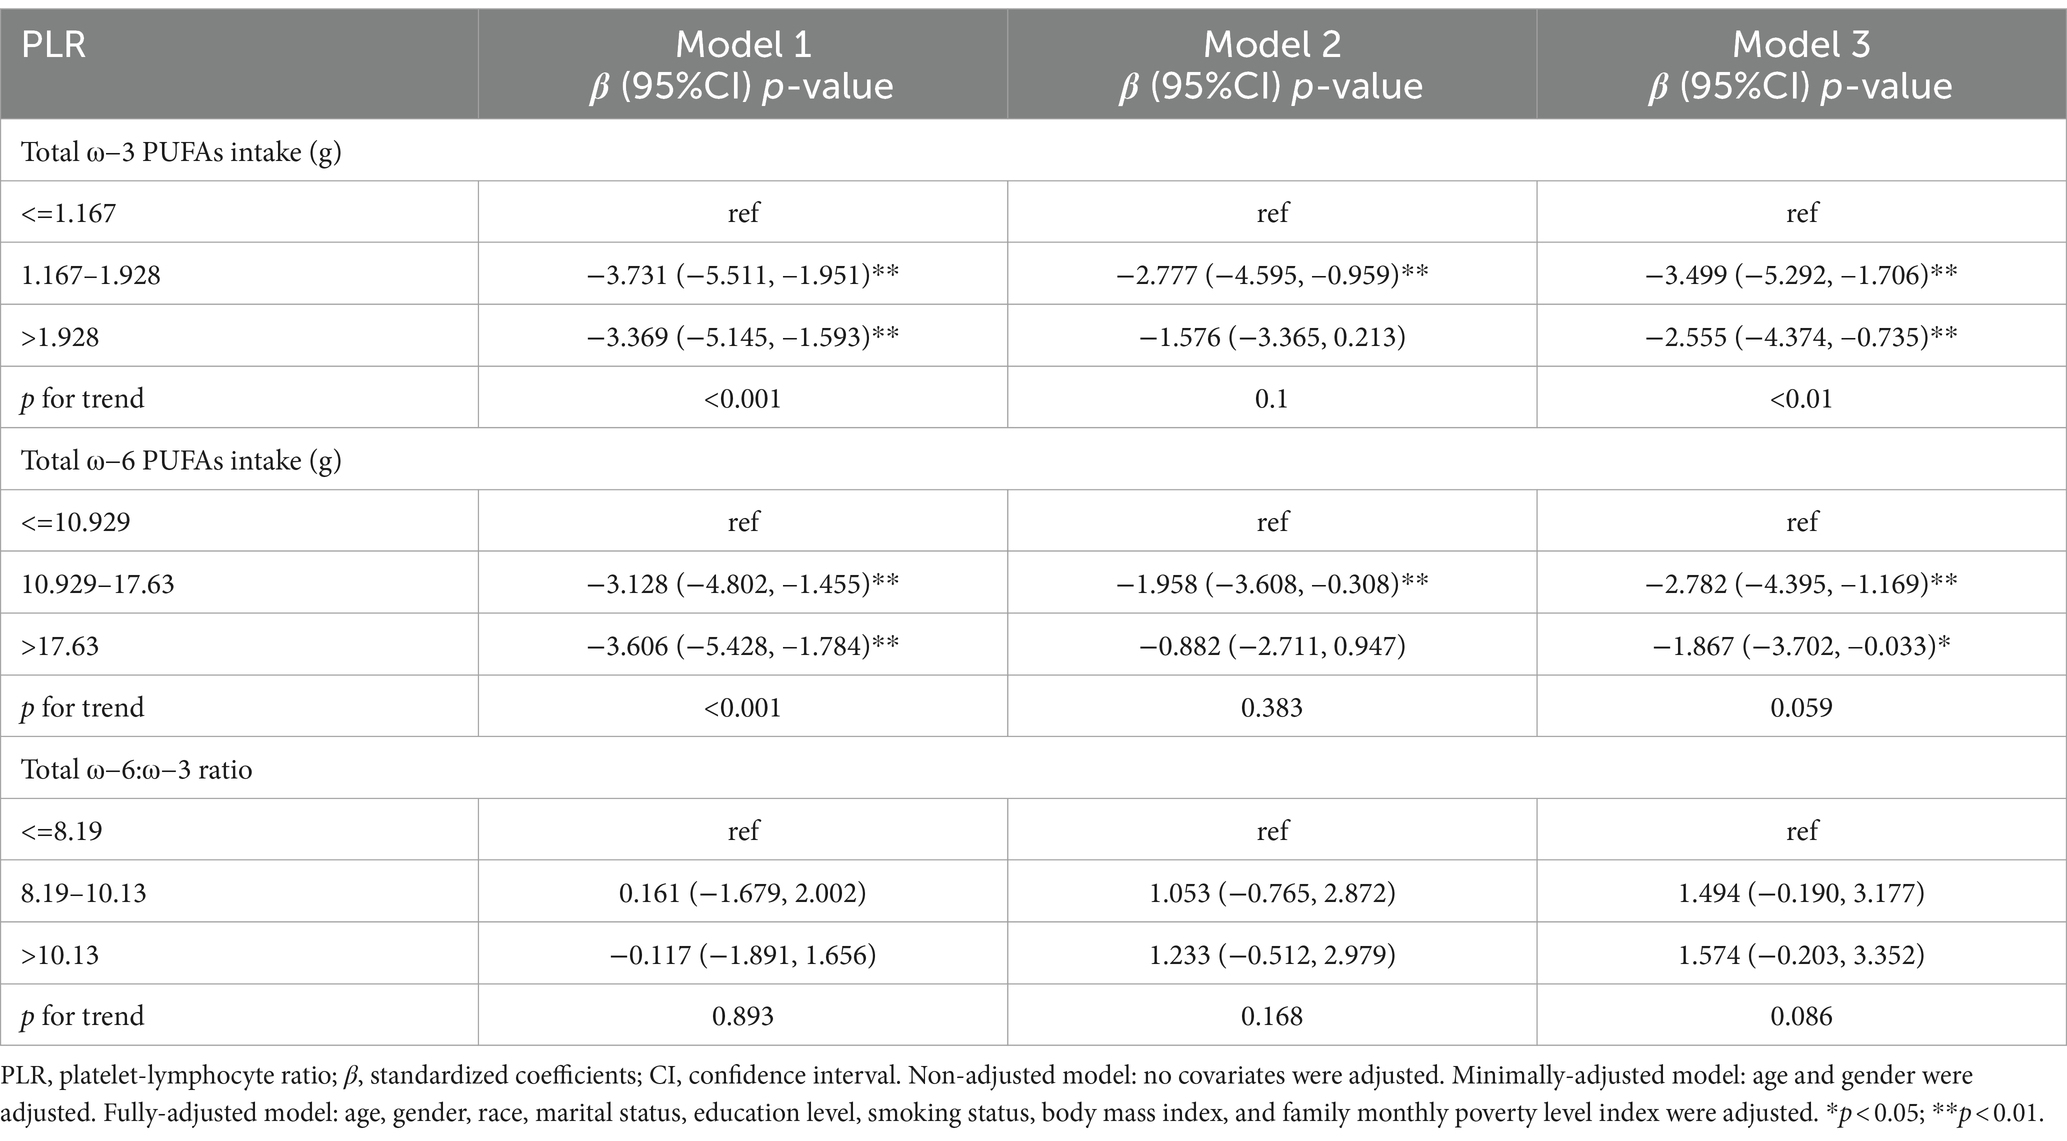
Table 5. Survey-weighted multivariate regression analyses of associations between dietary ω-3 and ω-6 PUFAs intake and ω-6:ω-3 ratio and PLR.
Table 6 depicts the dietary intake of ω-3, ω-6 PUFAs, and the relationship between ω-6: ω-3 ratio and NLR. In model 1, the β and 95% CI for NLR were −0.041 (−0.076, −0.006) and −0.04 (−0.077, −0.003) for the medium-dose intake group of ω-3 and ω-6 PUFAs, respectively. In model 2, there was an inverse relationship between the high-dose intake group of ω-3 and ω-6 PUFAs and NLR, with β and 95% CI of −0.045 (−0.084, −0.005) and −0.038 (−0.075, −0.001), respectively. In model 3, a negative relationship was found between the medium-dose intake group of ω-3 PUFAs and NLR, with β and 95% CI of −0.037 (−0.071, −0.002). The p-values for trend for ω-3 and ω-6 PUFAs intake were statistically significant (p < 0.05). In Model 1, there was a negative correlation between the high-scale group of ω-6: ω-3 ratios and NLR, with β and 95% CI of −0.037 (−0.073, −0.002).
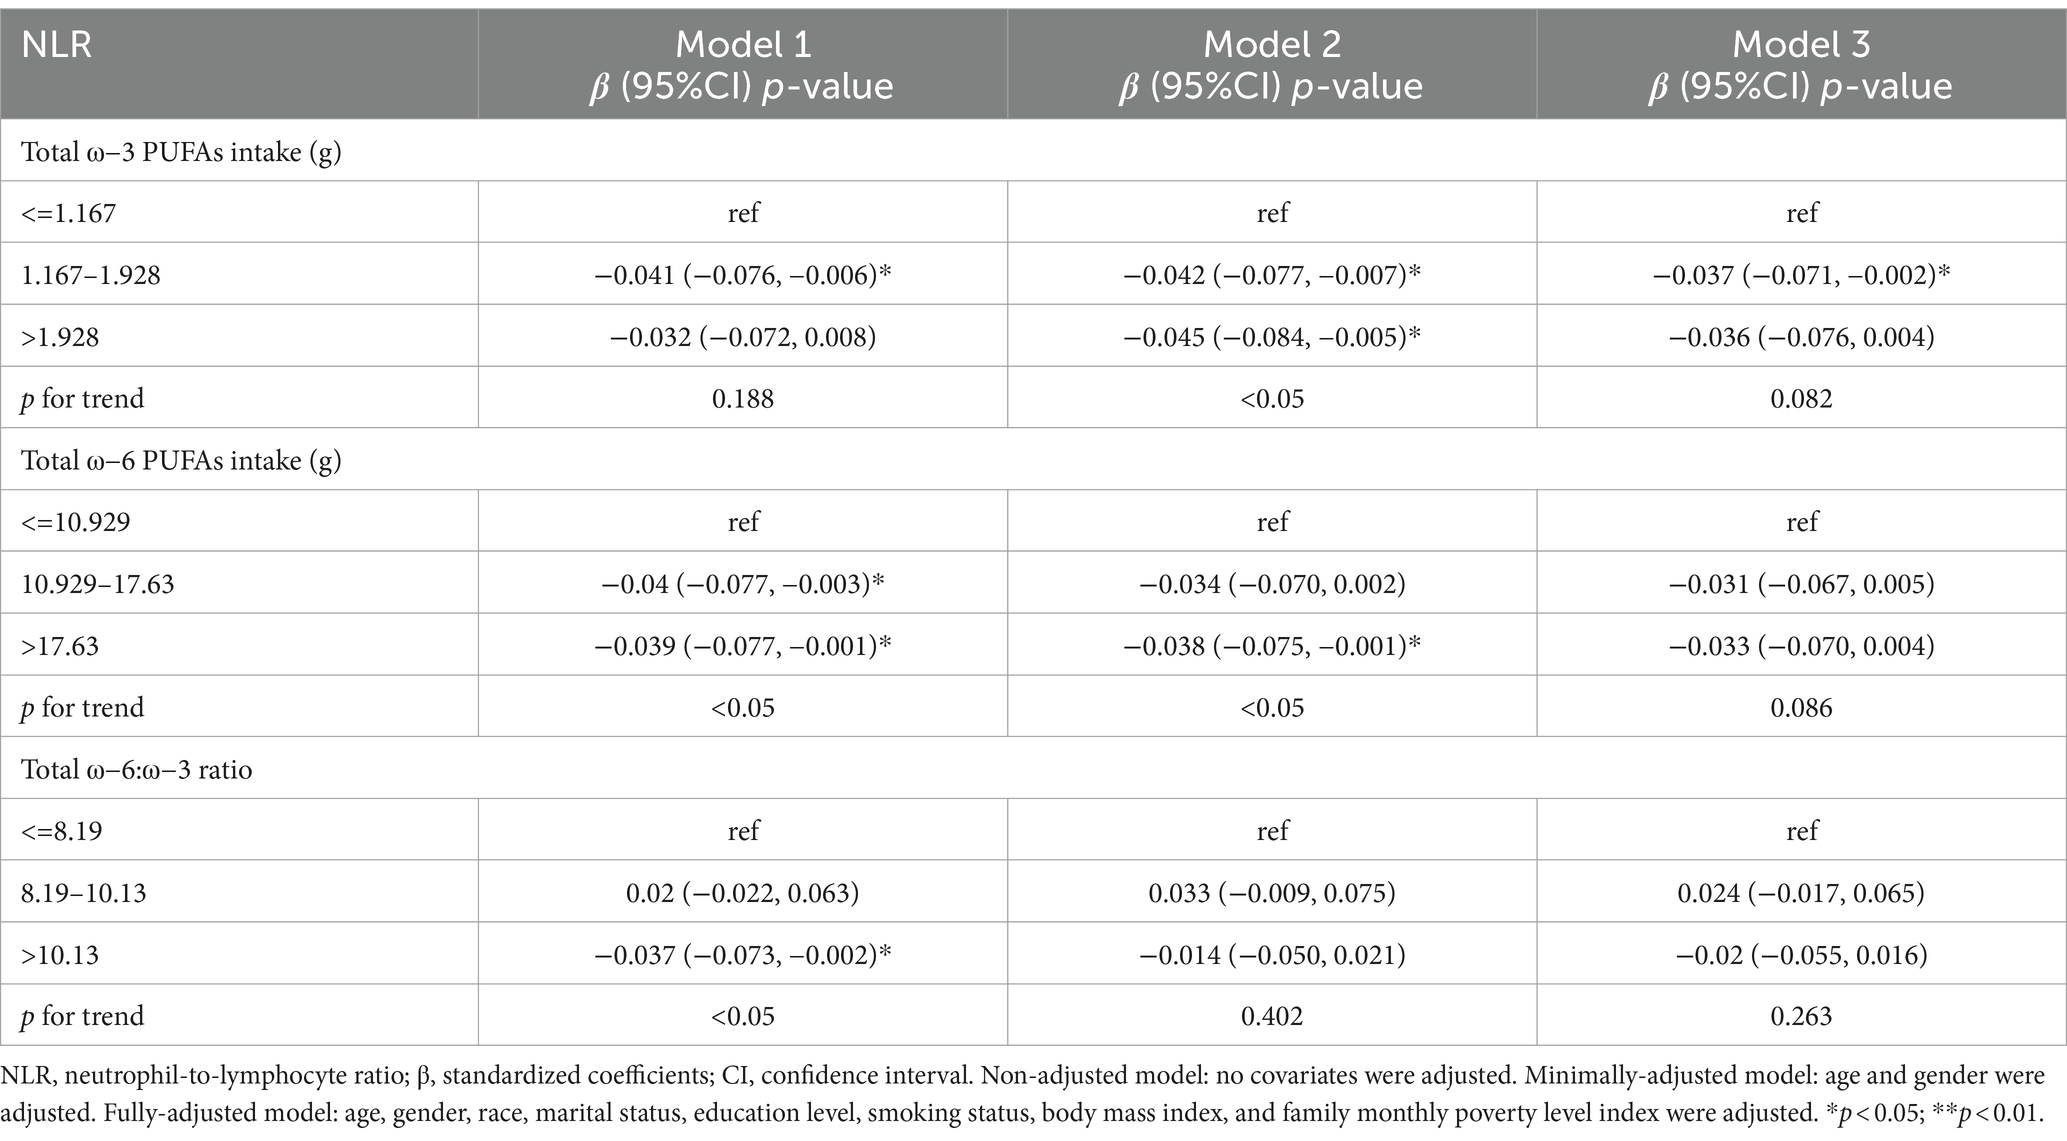
Table 6. Survey-weighted multivariate regression analyses of associations between dietary ω-3 and ω-6 PUFAs intake and ω-6:ω-3 ratio and NLR.
Table 7 shows the ω-3 and ω-6 PUFAs dietary intake and the relationship between ω-6: ω-3 ratio and WBC. In model 1, the β and 95% CI for WBC were −0.169 (−0.264, −0.073) and − 0.128 (−0.214, −0.041) for the high-dose intake group of ω-3 and ω-6 PUFAs, respectively. The p-values trend for ω-3 and ω-6 PUFAs intake were less than 0.01 and 0.05, respectively, and were statistically significant. In model 2, there was a negative relationship between the high-dose intake group of ω-3 and ω-6 PUFAs and WBC, with β and 95% CI of −0.142 (−0.246, −0.039) and-0.113 (−0.206, −0.021), respectively. The p-value for trend for ω-3 PUFAs intake was statistically significant. (p < 0.01). No notable relationship was depicted between ω-6: ω-3 ratio and WBC.
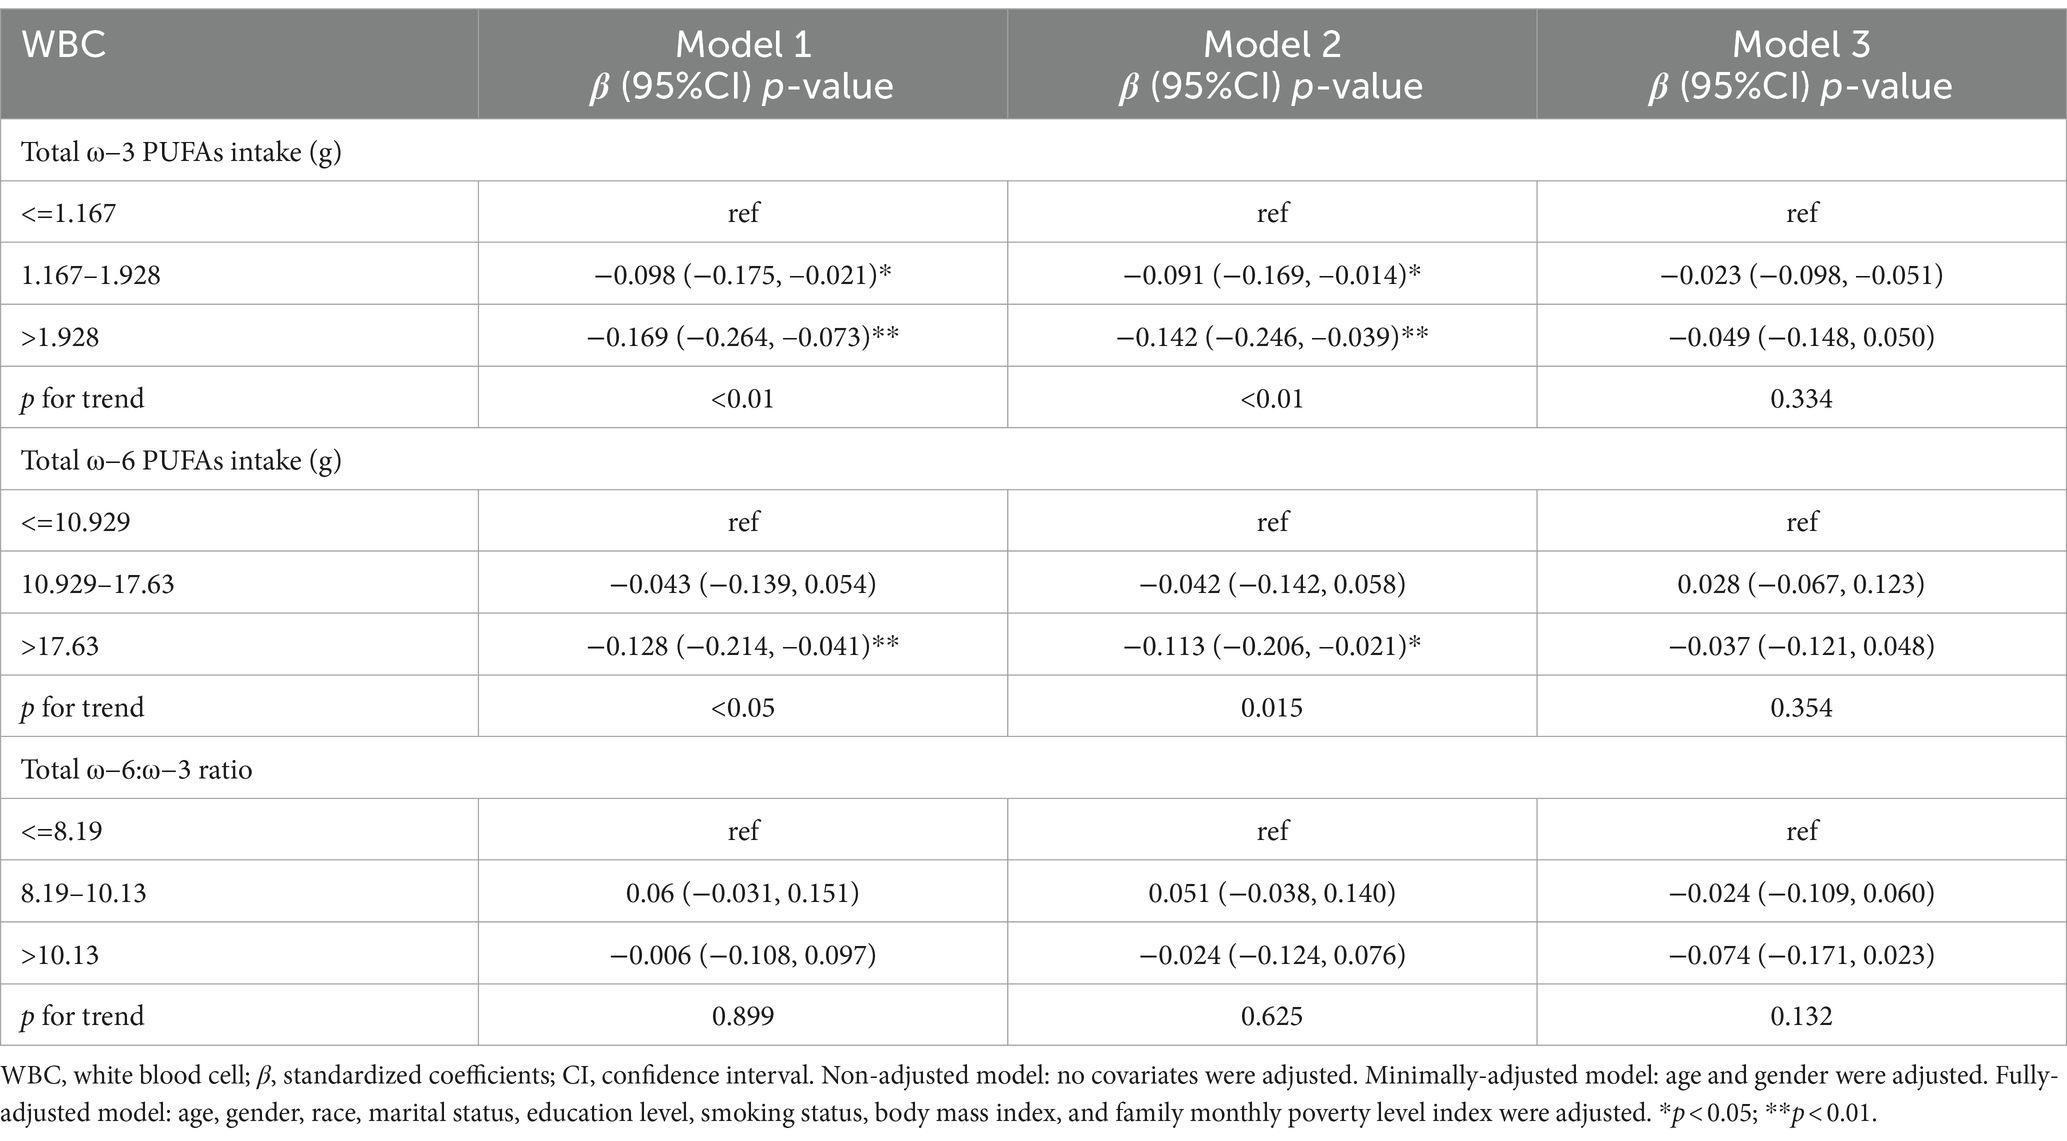
Table 7. Survey-weighted multivariate regression analyses of associations between dietary ω-3 and ω-6 PUFAs intake and ω-6:ω-3 ratio and WBC.
The study participants were divided into groups based on sex, age, smoking status, race, BMI, and education (Supplementary Tables S1, S2). The analysis showed that the relationship between dietary intake of ω-3 and ω-6 fatty acids and the SII index remained consistent across all the groups and did not exhibit significant variations. However, it is important to note that the association between ω-3 and ω-6 fatty acid intake and SII was found to be stronger in the obese population (BMI > 30).
Figures 2, 3 illustrate the findings of the dose–response relationship between ω-3, ω-6 PUFAs and SII index. As shown in the figure, an L-type correlation was observed between ω-3 and ω-6 PUFAs intake and SII (p for nonlinearity <0.05). The dose–response relationship between intake of ω-3 and ω-6 PUFAs and SII showed an overall trend of first decrease and then increase, with inflection points of 2.35 g/day and 19.79 g/day, respectively. However, the non-linear relationship between the ω-3: ω-6 ratio and SII was not significant (p for nonlinearity >0.05).
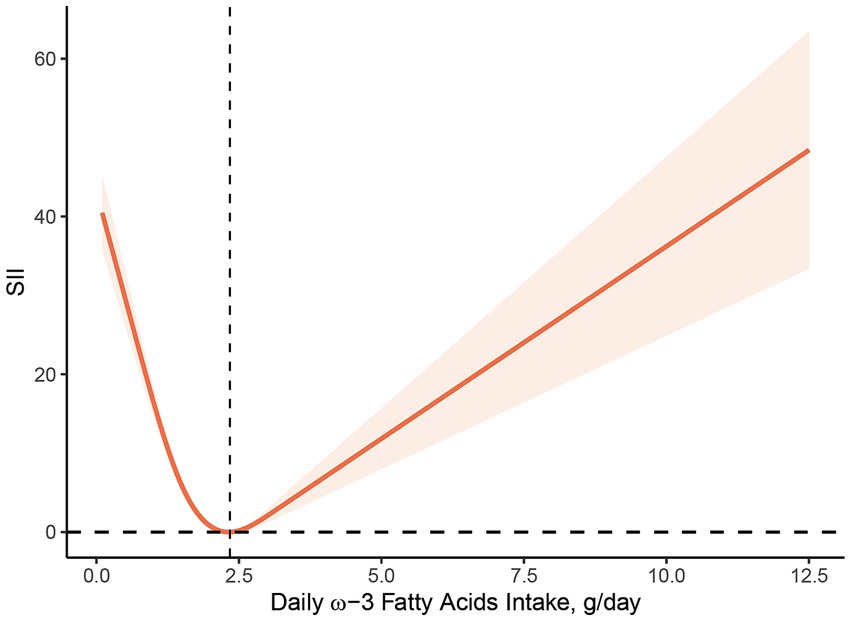
Figure 2. Dose–response relationship between ω-3 PUFAs intake and SII. The association was adjusted for age, gender, race, marital status, education level, smoking status, body mass index, family monthly poverty level index.
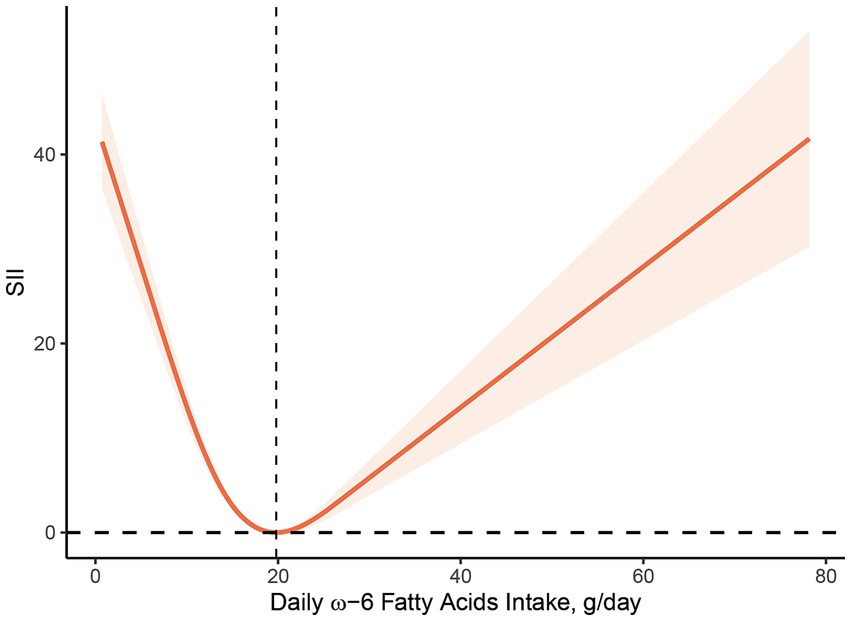
Figure 3. Dose–response relationship between ω-6 PUFAs intake and SII. The association was adjusted for age, gender, race, marital status, education level, smoking status, body mass index, family monthly poverty level index.
A comprehensive cross-sectional survey was carried out in this research to assess the relationship between dietary intake of ω-3, ω-6 PUFAs, and ω-6 to ω-3 ratio with systemic immune and inflammatory biomarkers. Data from the NHANES survey for 1999 to 2020, representing the US population, were utilized. In this study, we found a significant negative correlation between dietary intake of ω-3 and ω-6 PUFAs and SII, NLR, PLR, and WBC, which supports the contention that ω-3 PUFAs exert an anti-inflammatory effect, and that ω-6 PUFAs have a similar anti-inflammatory effect. In addition, the dose–response relationship suggests that ω-3 and ω-6 PUFAs intakes are associated with SII in a non-linear L-form, whereas ω-6: ω-3 ratios are not substantially related to these inflammatory biomarkers.
Theoretical studies suggest that ω-3 and ω-6 PUFAs compete with each other at cyclooxygenase (COX) and lipoxygenase (LOX) sites to generate different types of eicosanoids, such as prostaglandins (PGs) and leukotrienes (LTs), etc. (34). In response to inflammatory stimuli, AA within the ω-6 PUFA is released from membrane phospholipids. Subsequently, it undergoes conversion into PGE2 and LTB4 in a COX- and LOX-dependent manner. This process exerts a strong pro-inflammatory effect, contributing to platelet aggregation and vasoconstriction. In contrast, the metabolism of EPA and DHA in ω-3 PUFA produces PGE3 and LTB5, which exhibit anti-inflammatory and antiplatelet aggregation effects (35).
However, the relationship between fatty acid elongation and desaturase action is rather complex, and clinical outcome is not easily predicted based on biochemical pathways alone. The association between dietary PUFAs and inflammatory markers has not yet been fully elucidated (36). The anti-inflammatory impacts of ω-3 fatty acids have been extensively documented in multiple clinical and experimental studies. Two extensive studies by Derosa et al. (10, 11) revealed substantially reduced levels of serum of high-sensitivity C-reactive protein (hs-CRP), matrix metalloproteinase (MMP)-2, and MMP-9 in patients with dyslipidemia after 6 months of EPA + DHA intake at 2.6 g/day compared with placebo. ω-3 PUFAs also protect from CVD by addressing arrhythmias, lowering blood pressure, plasma homocysteine and serum triglycerides, prolonging clotting time, and suppressing platelet aggregation (37). This is consistent with the findings of this research. However, it is crucial to highlight that there is no substantial correlation between consuming low doses of ω-3 fatty acids over short courses and inflammation biomarkers (38).
At the same time, it was found that ω-6 PUFAs also had some anti-inflammatory effects. Although ω-6 PUFAs are theoretically and widely recognized as pro-inflammatory mediators, multiple clinical studies have failed to substantiate this hypothesis (12–14). In a study examining the impact of dietary AA supplementation on peripheral blood mononuclear cells (PBMCs), participants who received 0.7 g/day of AA-rich single-cell oil (ARASCO) for 12 weeks exhibited an elevation in the proportion of AA in PBMC phospholipids of total fatty acids (12). In another study, ARASCO supplementation for 7 weeks significantly increased the secretion of PGE2 and LTB4 from lipopolysaccharide-stimulated cultured PBMCs. However, this supplementation did not lead to the increased secretion of interleukin-6 (IL-6), IL-1β, or tumor necrosis factor-α (TNF-α), nor did it affect the number of circulating lymphocytes labeled with specific subsets (13). A randomized controlled study of healthy elderly adults (55 to 70 years old) in Japan discovered that the plasma phospholipid content of AA increased dose-dependently following 4 weeks of AA supplementation at 0.24 g/day or 0.73 g/day. However, this supplementation did not influence the levels of AA metabolites and the plasma concentrations of CRP, IL-6, and TNF-α (14). The provided evidence indicates that increasing AA intake results in elevated AA content in plasma or cellular phospholipids. However, it does not exert a notable impact on pro-inflammatory cytokine production and the number of inflammatory cells. In parallel, studies focusing on LA, a synthetic substrate of AA, revealed that increasing LA intake did not elevate AA concentrations in plasma or PBMC. Moreover, it was not significantly associated with multiple inflammatory markers (39–41). This observation could be attributed to the saturation of the pathway for synthesizing AA from LA. Conversely, some studies even suggest that AA and LA may be associated with reduced inflammation (15–17). A cross-sectional study of 364 patients with CVD secondary prevention showed that augmented dietary consumption of ω-3 and ω-6 PUFAs was inversely correlated with levels of CRP, IL-1β, IL-10, and IL-12 (16). Another cross-sectional study showed that ω-3 and ω-6 PUFAs intake was linked to a reduced risk of developing CVD in comparison with intake of either fatty acid alone (17). These findings align with our observation that ω-6 PUFA intake is inversely associated with inflammatory markers. The inhibitory effect of ω-6 PUFAs on inflammatory responses may be achieved through eicosanoid-independent pathways as well as the production of precursors related to the inflammatory abrogation mediators. Nonetheless, additional research is required to explore the specific mechanisms involved (42).
In addition, this study revealed no noteworthy correlation between ω-6: ω-3 ratio and SII, along with other secondary measures. It is noteworthy that research investigating the relationship between the ω-6: ω-3 ratio and inflammatory markers has yielded conflicting results (18–22). Kalogeropoulos et al. (18) demonstrated a strong relationship between the proportion of ω-6: ω-3 and hs-CRP, IL-6, TNF-α, fibrinogen, and homocysteine in serum from 374 healthy people in the ATTICA’s study database. This suggests that the inflammatory balance of the body may be regulated by the relative amounts of ω-6 and ω-3 fatty acids. Another study involving 1,123 healthy individuals discovered an inverse relationship between the proportion of ω-6: ω-3 in fasting plasma and the anti-inflammatory marker IL-10 (20). Zhang et al. (19) utilized a population cohort from the UK Biobank to identify an elevated risk of all-cause, cancer, and CVD mortality with an elevated ω-6: ω-3 ratio in the population. Harris (21, 22) conducted an analysis of 11 case–control and two prospective cohort studies, revealing that the ω-6: ω-3 ratio was not effective in distinguishing coronary artery disease cases from healthy subjects. Therefore, it is suggested that more evidence is necessary to substantiate the utility of the ω-6: ω-3 ratio as a biomarker for predicting disease status or serving as a nutritional reference. This is supported by our findings. The ω-6: ω-3 ratio may not allow for the efficacy of each fatty acid to be assessed individually. Therefore, no recommendation can be given for a more accurate assessment.
The specific mechanism for the “L” shaped dose–response relationship between dietary ω-3 and ω-6 fatty acid intake and SII index is unclear, but there are several possibilities. First, dietary fatty acid intake is strongly associated with age, BMI, and individual metabolism. The results of stratified analyses show that there are some differences in BMI among the included study populations. One study found that a high dietary ω-6: ω-3 PUFA ratio was positively associated with excessive obesity and worsened metabolic status (43). And BMI is a better predictor of response to dietary supplements than simple body weight (44). Therefore, BMI differences in the study population may contribute to the over-activation of the inflammatory state, resulting in an “L” shaped dose–response relationship between PUFAs intake and inflammatory biomarkers in the body. Secondly, the effect of a single dietary component on homeostasis is limited, as the structure and function of cell membranes are regulated by other dietary factors, such as antioxidants and polyphenols, in addition to PUFAs. Several studies have shown that PUFAs is highly susceptible to oxidation, and their peroxidation produces lipid peroxides, which can harm the organism. The dietary intake of PUFA is accompanied by the intake of certain antioxidants, such as LA and vitamin E which are also obtained through vegetable oils. An epidemiological study investigating the relationship between PUFA intake and CRP concentrations found that the negative correlation between dietary ω-3 and ω-6 fatty acid intake and elevated CRP was only significant in individuals with low vitamin E intake, demonstrating some interaction between vitamin E and PUFAs (45). Thus with the gradual increase in ω-3 and ω-6 fatty acid intake, antioxidants in the body are unable to antagonize the higher levels of lipid peroxides and an increase follows a decrease in the level of inflammation. In addition to this, PUFA is also closely associated with the platelet-activating factor (PAF), the synthesis and catabolism of which involves the participation of a series of enzymes, among which lipoprotein-associated phospholipase A2 (Lp-PLA2) is considered to be a marker of vascular inflammatory response in the body. A cross-sectional study including 2,246 participants found that AA, EPA, and DHA plasma levels were negatively correlated with Lp-PLA2 mass and activity (46). In addition, a negative correlation between EPA and DHA and Lp-PLA2 concentrations was also observed in adipose tissue (47). Further studies revealed that this may affect Lp-PLA2 expression through activation of p38 mitogen-activated protein kinase and phosphatidylinositol 3-kinase (48–50). This may be related to the “L” shaped relationship between ω-3 and ω-6 fatty acid intake and SII index. However, the association between ω-3 and ω-6 PUFAs and PAF has not yet been established, and further studies are needed (51, 52).
On the one hand, this research exhibits multiple notable strengths. Firstly, it examined the correlation between dietary ω-3, ω-6 PUFAs intake and ω-6: ω-3 ratio and systemic immune-inflammatory status, utilizing multiple inflammatory indicators. Secondly, it explored the dose–response relationship between the main indicator SII and the dietary intake of ω-3 and ω-6 PUFAs. Finally, it employed a large, nationally representative sample, which enhances statistical power and augments the accuracy and reliability of the findings. On the other hand, this research also has certain limitations. Firstly, due to its cross-sectional design, establishing causality is challenging. Secondly, dietary data were collected via a 24-h dietary recall interview, which may lead to inaccuracy.
This research proposes that there is an inverse relationship between ω-3, ω-6 PUFAs intake and systemic inflammatory biomarkers in humans. The intake ω-3 and ω-6 PUFAs in the dose–response relationship exhibited an “L”-type association with the SII, indicating an initial decrease followed by an increase. However, no noticeable association was observed between ω-6: ω-3 ratio and these inflammatory markers. Further investigation is warranted to elucidate the mechanisms underlying this observation.
The original contributions presented in the study are included in the article/Supplementary material, further inquiries can be directed to the corresponding author.
The studies involving humans were approved by National Center for Health Statistics. The studies were conducted in accordance with the local legislation and institutional requirements. The participants provided their written informed consent to participate in this study. Written informed consent was obtained from the individual(s) for the publication of any potentially identifiable images or data included in this article.
YL: Data curation, Formal analysis, Methodology, Software, Validation, Writing – original draft, Writing – review & editing. HT: Conceptualization, Data curation, Formal analysis, Methodology, Writing – original draft. XY: Conceptualization, Methodology, Visualization, Writing – original draft. LilM: Formal analysis, Software, Visualization, Writing – review & editing. HZ: Data curation, Supervision, Visualization, Writing – review & editing. GZ: Data curation, Formal analysis, Methodology, Software, Writing – review & editing. XC: Conceptualization, Data curation, Formal analysis, Writing – original draft. LijM: Data curation, Methodology, Writing – original draft. JG: Formal analysis, Software, Validation, Writing – review & editing. WJ: Conceptualization, Methodology, Visualization, Writing – review & editing.
The author(s) declare that financial support was received for the research, authorship, and/or publication of this article. This research was funded by Changzhou Science and Technology Bureau Science and Technology Program, grant number CJ20229001; Young Talent Program of Changzhou Municipal Health Commission, grant number QN202337 and Science and Technology Program of Liyang Hospital of Traditional Chinese Medicine, grant number YN202301.
The authors would like to express their gratitude to the staff of the National Center for Health Statistics at the Centers for Disease Control for designing, collecting, and collating the NHANES data and creating the public database that facilitated access to this valuable information.
The authors declare that the research was conducted in the absence of any commercial or financial relationships that could be construed as a potential conflict of interest.
All claims expressed in this article are solely those of the authors and do not necessarily represent those of their affiliated organizations, or those of the publisher, the editors and the reviewers. Any product that may be evaluated in this article, or claim that may be made by its manufacturer, is not guaranteed or endorsed by the publisher.
The Supplementary material for this article can be found online at: https://www.frontiersin.org/articles/10.3389/fnut.2024.1410154/full#supplementary-material
1. Medzhitov, R. The spectrum of inflammatory responses. Science. (2021) 374:1070–5. doi: 10.1126/science.abi5200
2. Netea, MG, Joosten, LAB, Latz, E, Mills, KHG, Natoli, G, Stunnenberg, HG, et al. Trained immunity: a program of innate immune memory in health and disease. Science. (2016) 352:aaf1098. doi: 10.1126/science.aaf1098
3. Furman, D, Campisi, J, Verdin, E, Carrera-Bastos, P, Targ, S, Franceschi, C, et al. Chronic inflammation in the etiology of disease across the life span. Nat Med. (2019) 25:1822–32. doi: 10.1038/s41591-019-0675-0
4. Afify, SM, Hassan, G, Seno, A, and Seno, M. Cancer-inducing niche: the force of chronic inflammation. Br J Cancer. (2022) 127:193–201. doi: 10.1038/s41416-022-01775-w
5. Kain, V, Prabhu, SD, and Halade, GV. Inflammation revisited: inflammation versus resolution of inflammation following myocardial infarction. Basic Res Cardiol. (2014) 109:444. doi: 10.1007/s00395-014-0444-7
6. Zhang, Z, Zhao, L, Zhou, X, Meng, X, and Zhou, X. Role of inflammation, immunity, and oxidative stress in hypertension: new insights and potential therapeutic targets. Front Immunol. (2023) 13:1098725. doi: 10.3389/fimmu.2022.1098725
7. Pereira, B, Xu, X-N, and Akbar, AN. Targeting inflammation and Immunosenescence to improve vaccine responses in the elderly. Front Immunol. (2020) 11:583019. doi: 10.3389/fimmu.2020.583019
8. Calder, PC. Functional roles of fatty acids and their effects on human health. J Parenter Enter Nutr. (2015) 39:18S–32S. doi: 10.1177/0148607115595980
9. Rebello, CJ. Polyunsaturated fatty acid intake and brain health: balance is the key. Am J Geriatr Psychiatry. (2022) 30:774–6. doi: 10.1016/j.jagp.2022.01.009
10. Derosa, G, Maffioli, P, D’Angelo, A, Salvadeo, S, Ferrari, I, Fogari, E, et al. Effects of long chain ω-3 fatty acids on metalloproteinases and their inhibitors in combined dyslipidemia patients. Expert Opin Pharmacother. (2009) 10:1239–47. doi: 10.1517/14656560902865601
11. Derosa, G, Cicero, AFG, Fogari, E, D’Angelo, A, Bonaventura, A, Romano, D, et al. Effects of n-3 PUFAs on postprandial variation of metalloproteinases, and inflammatory and insulin resistance parameters in dyslipidemic patients: evaluation with euglycemic clamp and oral fat load. J Clin Lipidol. (2012) 6:553–64. doi: 10.1016/j.jacl.2012.02.010
12. Thies, F, Nebe-von-Caron, G, Powell, JR, Yaqoob, P, Newsholme, EA, and Calder, PC. Dietary supplementation with γ-linolenic acid or fish oil decreases T lymphocyte proliferation in healthy older humans. J Nutr. (2001) 131:1918–27. doi: 10.1093/jn/131.7.1918
13. Kelley, DS, Taylor, PC, Nelson, GJ, and Mackey, BE. Arachidonic acid supplementation enhances synthesis of eicosanoids without suppressing immune functions in young healthy men. Lipids. (1998) 33:125–30. doi: 10.1007/s11745-998-0187-9
14. Kakutani, S, Ishikura, Y, Tateishi, N, Horikawa, C, Tokuda, H, Kontani, M, et al. Supplementation of arachidonic acid-enriched oil increases arachidonic acid contents in plasma phospholipids, but does not increase their metabolites and clinical parameters in Japanese healthy elderly individuals: a randomized controlled study. Lipids Health Dis. (2011) 10:241. doi: 10.1186/1476-511X-10-241
15. Miles, EA, Allen, E, and Calder, PC. In vitro effects of eicosanoids derived from different 20-carbon fatty acids on production of monocyte-derived cytokines in human whole blood cultures. Cytokine. (2002) 20:215–23. doi: 10.1006/cyto.2002.2007
16. Bersch-Ferreira, ÂC, Sampaio, GR, Gehringer, MO, Ross-Fernandes, MB, Kovacs, C, Alves, R, et al. Association between polyunsaturated fatty acids and inflammatory markers in patients in secondary prevention of cardiovascular disease. Nutrition. (2017) 37:30–6. doi: 10.1016/j.nut.2016.12.006
17. Djoussé, L, Pankow, JS, Eckfeldt, JH, Folsom, AR, Hopkins, PN, Province, MA, et al. Relation between dietary linolenic acid and coronary artery disease in the National Heart, Lung, and Blood Institute family heart study. Am J Clin Nutr. (2001) 74:612–9. doi: 10.1093/ajcn/74.5.612
18. Kalogeropoulos, N, Panagiotakos, DB, Pitsavos, C, Chrysohoou, C, Rousinou, G, Toutouza, M, et al. Unsaturated fatty acids are inversely associated and n-6/n-3 ratios are positively related to inflammation and coagulation markers in plasma of apparently healthy adults. Clin Chim Acta. (2010) 411:584–91. doi: 10.1016/j.cca.2010.01.023
19. Zhang, Y, Sun, Y, Yu, Q, Song, S, Brenna, JT, Shen, Y, et al. Higher ratio of plasma omega-6/omega-3 fatty acids is associated with greater risk of all-cause, cancer, and cardiovascular mortality: a population-based cohort study in UK biobank. medRxiv. (2024) 10:2023.01.16.23284631. doi: 10.1101/2023.01.16.23284631
20. Ferrucci, L, Cherubini, A, Bandinelli, S, Bartali, B, Corsi, A, Lauretani, F, et al. Relationship of plasma polyunsaturated fatty acids to circulating inflammatory markers. J Clin Endocrinol Metabol. (2006) 91:439–46. doi: 10.1210/jc.2005-1303
21. Harris, WS, Assaad, B, and Poston, WC. Tissue Omega-6/Omega-3 fatty acid ratio and risk for coronary artery disease. Am J Cardiol. (2006) 98:19–26. doi: 10.1016/j.amjcard.2005.12.023
22. Harris, WS. The omega-6/omega-3 ratio and cardiovascular disease risk: uses and abuses. Curr Atheroscler Rep. (2006) 8:453–9. doi: 10.1007/s11883-006-0019-7
23. Hu, B, Yang, X-R, Xu, Y, Sun, Y-F, Sun, C, Guo, W, et al. Systemic immune-inflammation index predicts prognosis of patients after curative resection for hepatocellular carcinoma. Clin Cancer Res. (2014) 20:6212–22. doi: 10.1158/1078-0432.CCR-14-0442
24. Zhang, F, Niu, M, Wang, L, Liu, Y, Shi, L, Cao, J, et al. Systemic-immune-inflammation index as a promising biomarker for predicting perioperative ischemic stroke in older patients who underwent non-cardiac surgery. Front Aging Neurosci. (2022) 14:865244. doi: 10.3389/fnagi.2022.865244
25. Ji, Y, and Wang, H. Prognostic prediction of systemic immune-inflammation index for patients with gynecological and breast cancers: a meta-analysis. World J Surg Oncol. (2020) 18:197. doi: 10.1186/s12957-020-01974-w
26. Meng, L, Yang, Y, Hu, X, Zhang, R, and Li, X. Prognostic value of the pretreatment systemic immune-inflammation index in patients with prostate cancer: a systematic review and meta-analysis. J Transl Med. (2023) 21:79. doi: 10.1186/s12967-023-03924-y
27. Zhao, Z, Zhang, X, Sun, T, Huang, X, Ma, M, Yang, S, et al. Prognostic value of systemic immune-inflammation index in CAD patients: systematic review and meta-analyses. Eur J Clin Investig. (2024) 54:e14100. doi: 10.1111/eci.14100
28. Stojkovic Lalosevic, M, Pavlovic Markovic, A, Stankovic, S, Stojkovic, M, Dimitrijevic, I, Radoman Vujacic, I, et al. Combined diagnostic efficacy of neutrophil-to-lymphocyte ratio (NLR), platelet-to-lymphocyte ratio (PLR), and mean platelet volume (MPV) as biomarkers of systemic inflammation in the diagnosis of colorectal cancer. Dis Markers. (2019) 2019:6036979–7. doi: 10.1155/2019/6036979
29. Asperges, E, Albi, G, Zuccaro, V, Sambo, M, Pieri, TC, Calia, M, et al. Dynamic NLR and PLR in predicting COVID-19 severity: a retrospective cohort study. Infect Dis Ther. (2023) 12:1625–40. doi: 10.1007/s40121-023-00813-1
30. Mureșan, AV, Russu, E, Arbănași, EM, Kaller, R, Hosu, I, Arbănași, EM, et al. The predictive value of NLR, MLR, and PLR in the outcome of end-stage kidney disease patients. Biomedicines. (2022) 10:1272. doi: 10.3390/biomedicines10061272
31. Ahluwalia, N, Dwyer, J, Terry, A, Moshfegh, A, and Johnson, C. Update on NHANES dietary data: focus on collection, release, analytical considerations, and uses to inform public Policy12. Adv Nutr. (2016) 7:121–34. doi: 10.3945/an.115.009258
32. Patel, CJ, Pho, N, McDuffie, M, Easton-Marks, J, Kothari, C, Kohane, IS, et al. A database of human exposomes and phenomes from the US National Health and nutrition examination survey. Sci Data. (2016) 3:160096. doi: 10.1038/sdata.2016.96
33. Nøst, TH, Alcala, K, Urbarova, I, Byrne, KS, Guida, F, Sandanger, TM, et al. Systemic inflammation markers and cancer incidence in the UK biobank. Eur J Epidemiol. (2021) 36:841–8. doi: 10.1007/s10654-021-00752-6
34. Calder, PC. Omega-3 fatty acids and inflammatory processes. Nutrients. (2010) 2:355–74. doi: 10.3390/nu2030355
35. Ishihara, T, Yoshida, M, and Arita, M. Omega-3 fatty acid-derived mediators that control inflammation and tissue homeostasis. Int Immunol. (2019) 31:559–67. doi: 10.1093/intimm/dxz001
36. Kaluza, J, Harris, H, Melhus, H, Michaëlsson, K, and Wolk, A. Questionnaire-based anti-inflammatory diet index as a predictor of low-grade systemic inflammation. Antioxid Redox Signal. (2018) 28:78–84. doi: 10.1089/ars.2017.7330
37. Cawood, AL, Ding, R, Napper, FL, Young, RH, Williams, JA, Ward, MJA, et al. Eicosapentaenoic acid (EPA) from highly concentrated n−3 fatty acid ethyl esters is incorporated into advanced atherosclerotic plaques and higher plaque EPA is associated with decreased plaque inflammation and increased stability. Atherosclerosis. (2010) 212:252–9. doi: 10.1016/j.atherosclerosis.2010.05.022
38. Mori, TA, Woodman, RJ, Burke, V, Puddey, IB, Croft, KD, and Beilin, LJ. Effect of eicosapentaenoic acid and docosahexaenoic acid on oxidative stress and inflammatory markers in treated-hypertensive type 2 diabetic subjects. Free Radic Biol Med. (2003) 35:772–81. doi: 10.1016/S0891-5849(03)00407-6
39. Pischon, T, Hankinson, SE, Hotamisligil, GS, Rifai, N, Willett, WC, and Rimm, EB. Habitual dietary intake of n-3 and n-6 fatty acids in relation to inflammatory markers among US men and women. Circulation. (2003) 108:155–60. doi: 10.1161/01.CIR.0000079224.46084.C2
40. Rett, BS, and Whelan, J. Increasing dietary linoleic acid does not increase tissue arachidonic acid content in adults consuming Western-type diets: a systematic review. Nutr Metab (Lond). (2011) 8:36. doi: 10.1186/1743-7075-8-36
41. Johnson, GH, and Fritsche, K. Effect of dietary linoleic acid on markers of inflammation in healthy persons: a systematic review of randomized controlled trials. J Acad Nutr Diet. (2012) 112:1029–1041.e15. doi: 10.1016/j.jand.2012.03.029
42. Dussault, I, and Forman, BM. Prostaglandins and fatty acids regulate transcriptional signaling via the peroxisome proliferator activated receptor nuclear receptors. Prostaglandins Other Lipid Mediat. (2000) 62:1–13. doi: 10.1016/S0090-6980(00)00071-X
43. Torres-Castillo, N, Silva-Gómez, JA, Campos-Perez, W, Barron-Cabrera, E, Hernandez-Cañaveral, I, Garcia-Cazarin, M, et al. High dietary ω-6:ω-3 PUFA ratio is positively associated with excessive adiposity and waist circumference. Obes Facts. (2018) 11:344–53. doi: 10.1159/000492116
44. Ekwaru, JP, Zwicker, JD, Holick, MF, Giovannucci, E, and Veugelers, PJ. The importance of body weight for the dose response relationship of Oral vitamin D supplementation and serum 25-Hydroxyvitamin D in healthy volunteers. PLoS One. (2014) 9:e111265. doi: 10.1371/journal.pone.0111265
45. Julia, C, Touvier, M, Meunier, N, Papet, I, Galan, P, Hercberg, S, et al. Intakes of PUFAs were inversely associated with plasma C-reactive protein 12 years later in a middle-aged population with vitamin E intake as an effect modifier. J Nutr. (2013) 143:1760–6. doi: 10.3945/jn.113.180943
46. Steffen, BT, Steffen, LM, Liang, S, Tracy, R, Jenny, NS, and Tsai, MY. N-3 and n-6 fatty acids are independently associated with lipoprotein-associated phospholipase A2 in the multi-ethnic study of atherosclerosis. Br J Nutr. (2013) 110:1664–71. doi: 10.1017/S0007114513000949
47. Schmidt, EB, Koenig, W, Khuseyinova, N, and Christensen, JH. Lipoprotein-associated phospholipase A2 concentrations in plasma are associated with the extent of coronary artery disease and correlate to adipose tissue levels of marine n-3 fatty acids. Atherosclerosis. (2008) 196:420–4. doi: 10.1016/j.atherosclerosis.2006.11.027
48. Wu, X, Zimmerman, GA, Prescott, SM, and Stafforini, DM. The p38 MAPK pathway mediates transcriptional activation of the plasma platelet-activating factor Acetylhydrolase gene in macrophages stimulated with lipopolysaccharide. J Biol Chem. (2004) 279:36158–65. doi: 10.1074/jbc.M402454200
49. Wang, W-Y, Li, J, Yang, D, Xu, W, Zha, R, and Wang, Y. OxLDL stimulates lipoprotein-associated phospholipase A2 expression in THP-1 monocytes via PI3K and p38 MAPK pathways. Cardiovasc Res. (2010) 85:845–52. doi: 10.1093/cvr/cvp367
50. Arita, M, Ohira, T, Sun, Y-P, Elangovan, S, Chiang, N, and Serhan, CN. Resolvin E1 selectively interacts with leukotriene B4 receptor BLT1 and ChemR23 to regulate inflammation. J Immunol. (2007) 178:3912–7. doi: 10.4049/jimmunol.178.6.3912
51. Fragopoulou, E, Detopoulou, P, Alepoudea, E, Nomikos, T, Kalogeropoulos, N, and Antonopoulou, S. Associations between red blood cells fatty acids, desaturases indices and metabolism of platelet activating factor in healthy volunteers. Prostaglandins Leukot Essent Fat Acids. (2021) 164:102234. doi: 10.1016/j.plefa.2020.102234
52. Akisu, M, Huseyinov, A, Baka, M, Yalaz, M, and Kultursay, N. The effect of dietary supplementation with n-3 polyunsaturated fatty acids on the generation of platelet-activating factor and leukotriene B4 in hypoxic–ischemic brain in young mice. Prostaglandins Leukot Essent Fat Acids. (2002) 67:429–33. doi: 10.1054/plef.2002.0453
Keywords: ω-3 PUFAs, ω-6 PUFAs, ω-6: ω-3 ratio, NHANES, systemic immune-inflammation index, neutrophil-to-lymphocyte ratio, platelet-lymphocyte ratio, white blood cell
Citation: Li Y, Tang H, Yang X, Ma L, Zhou H, Zhang G, Chen X, Ma L, Gao J and Ji W (2024) Associations of ω-3, ω-6 polyunsaturated fatty acids intake and ω-6: ω-3 ratio with systemic immune and inflammatory biomarkers: NHANES 1999-2020. Front. Nutr. 11:1410154. doi: 10.3389/fnut.2024.1410154
Edited by:
Katie Elizabeth Lane, Liverpool John Moores University, United KingdomReviewed by:
Paraskevi Detopoulou, General Hospital Korgialenio Benakio, GreeceCopyright © 2024 Li, Tang, Yang, Ma, Zhou, Zhang, Chen, Ma, Gao and Ji. This is an open-access article distributed under the terms of the Creative Commons Attribution License (CC BY). The use, distribution or reproduction in other forums is permitted, provided the original author(s) and the copyright owner(s) are credited and that the original publication in this journal is cited, in accordance with accepted academic practice. No use, distribution or reproduction is permitted which does not comply with these terms.
*Correspondence: Wei Ji, d2Vpd2VpamkxMTAzQDE2My5jb20=
†These authors have contributed equally to this work and share first authorship
Disclaimer: All claims expressed in this article are solely those of the authors and do not necessarily represent those of their affiliated organizations, or those of the publisher, the editors and the reviewers. Any product that may be evaluated in this article or claim that may be made by its manufacturer is not guaranteed or endorsed by the publisher.
Research integrity at Frontiers
Learn more about the work of our research integrity team to safeguard the quality of each article we publish.