 Yoonjeong Kim1
 Jeehye Sung
 Younghwa Kim
94% of researchers rate our articles as excellent or good
Learn more about the work of our research integrity team to safeguard the quality of each article we publish.
Find out more
ORIGINAL RESEARCH article
Front. Nutr. , 11 June 2024
Sec. Food Chemistry
Volume 11 - 2024 | https://doi.org/10.3389/fnut.2024.1409309
This article is part of the Research Topic Nutritional Bio-Active Compounds and Their Structural Modifications for Functional Foods View all 3 articles
Lignans are phytoestrogens found in various forms such as glycosides, ester-linked oligomers, and aglycones in a variety of foods, including soy products, legumes, grains, nuts, vegetables, and fruits. This study aimed to optimize the extraction of lignans from cereal grains using response surface methodology (RSM). Lignans, including secoisolariciresinol (Seco), matairesinol (Mat), pinoresinol (Pin), lariciresinol (Lar), and syringaresinol (Syr), were quantified using high-performance liquid chromatography–tandem mass spectrometry. A Box–Behnken design was employed to determine the optimal values for three extraction parameters: temperature (X1: 20°C–60°C), methanol concentration (X2: 60%–100%), and extraction time (X3: 30–90 min). The highest lignan contents were obtained at X1 = 44.24°C, X2 = 84.64%, and X3 = 53.63 min. To apply these experimental conditions to the actual experiment, the optimal conditions were slightly adjusted to X1 = 40°C, X2 = 80%, and X3 = 60 min. The predicted results closely matched the experimental results obtained using the modified optimal extraction conditions. The highest lignan content found in barley sprouts (85.930 μg/100 g), however, most grains exhibited relatively low concentrations of lignans. These findings provide valuable insights into the lignan content of grains and contribute to the generation of reliable data in this field.
Lignans are phenylpropanoid dimers, where the phenylpropane units are linked by the central carbon of their side chains (1). Lignans, including secoisolariciresinol (Seco), matairesinol (Mat), pinoresinol (Pin), medioresinol (Med), lariciresinol (Lar), syringaresinol (Syr), sesamin (Ses), 7′-hydroxymatairesinol (HMR), and isolariciresinol, are widely distributed in the bark, bulbs, leaves, seeds, and stems of plants (2, 3). The compounds occur mainly in the glycoside, ester-linked oligomer, and aglycone forms (4, 5). Lignans are known as potential antioxidants along with phenolic compounds such as flavonoids and phenolic acids (6, 7). Some of the plant lignans including secoisolariciresinol diglucoside, Mat, Pin, and Lar are deglycosylated, dehydroxylated, demethylated, and converted by intestinal bacteria to the mammalian lignans enterodiol and enterolactone and then absorbed through the colon (8–10). Moreover, lignans, referred to as phytoestrogens, bind to estrogen receptors and may exhibit both estrogenic and anti-estrogenic effects, affecting conditions such as menopause, cardiovascular disease, and cancer (11, 12). Recent studies demonstrated the bioaccessibility and bioavailability of plant lignans during digestion and fermentation in foodstuffs (13, 14). Grain such as wheat, corn, rice, oats, millet, barley, spelt, and rye, are commonly consumed worldwide (15, 16). Various studies have investigated the absorption and role of dietary lignans from grains (17–19). Moreover, Nørskov et al. (20) have investigated the LC–MS/MS method of the free and bound form of plant lignans and enterolignans after consumption of cereal-based diets. Previous studies have shown the lignan content in seeds, vegetables, and fruits (21). Smeds et al. (22) evaluated that lignans, including HMR, Seco, Mat, Lar, Pin, Med, and Syr, were quantified in wheat, oat, and rye. Thompson et al. (23) reported the isoflavone, lignan, and coumestan contents in various foods (e.g., soy products, legumes, nuts, grains, vegetables, and fruits) commonly consumed in Canadian diets. Lignan contents in seeds, such as sesame seeds and flaxseeds have been reported (24–26), but research on lignan contents in cereal grain and their products has been limited.
Various extraction methods of lignans in plants have been reported, such as ultrasound-assisted extraction, Soxhlet extraction, reflux extraction, and microwave-assisted extraction, using organic solvents including methanol, ethanol, and ethyl acetate (27–29). Additionally, hydrolysis methods have been studied to break the glycoside linkages of lignans, such as enzymatic, acidic, and alkaline hydrolysis (24, 30, 31). Liquid chromatography combined with mass spectrometry is preferred for metabolite identification and quantitative research in foods and drugs due to its sensitivity, fast analysis times, simplicity of sample preparation, and mass accuracy (32–34). López et al. (35) reported that Pin, hydroxy-Pin, and acetoxy-Pin, found in olive oil, were quantitatively analyzed by high-performance liquid chromatography mass spectrometry (HPLC–MS/MS). Moreover, Kuhnle et al. (36) reported that Seco and Mat were simultaneously analyzed in vegetables using HPLC–MS/MS. Response Surface Methodology (RSM) is a mathematical and statistical technique for determining the optimal values to describe the relationship between independent variables and responses (37). Currently, RSM is applied in the food and pharmacological industries to optimize compound extraction from various foods (38, 39). Zhang et al. (40) used RSM to optimize the extraction of lignans from flaxseed, and Zhao et al. (41) used RSM to optimize schizandrin and schisandrol B extraction from Schisandra chinensis using accelerated solvent extraction. A previous study evaluated the influence of antioxidants, including polyphenols and vitamin B2, in ultrasound-assisted extraction using the response surface method with Box–Behnken design (42). However, only a limited number of studies have reported on extraction methods and simultaneous analysis of lignans such as Lar, Mat, Pin, Seco, and Syr found in cereal grain. This study aimed to determine the content of five lignans (Figure 1; Lar, Mat, Pin, Seco, and Syr) in cereal grains and their products, and to assess the optimal extraction conditions of lignans using RSM.
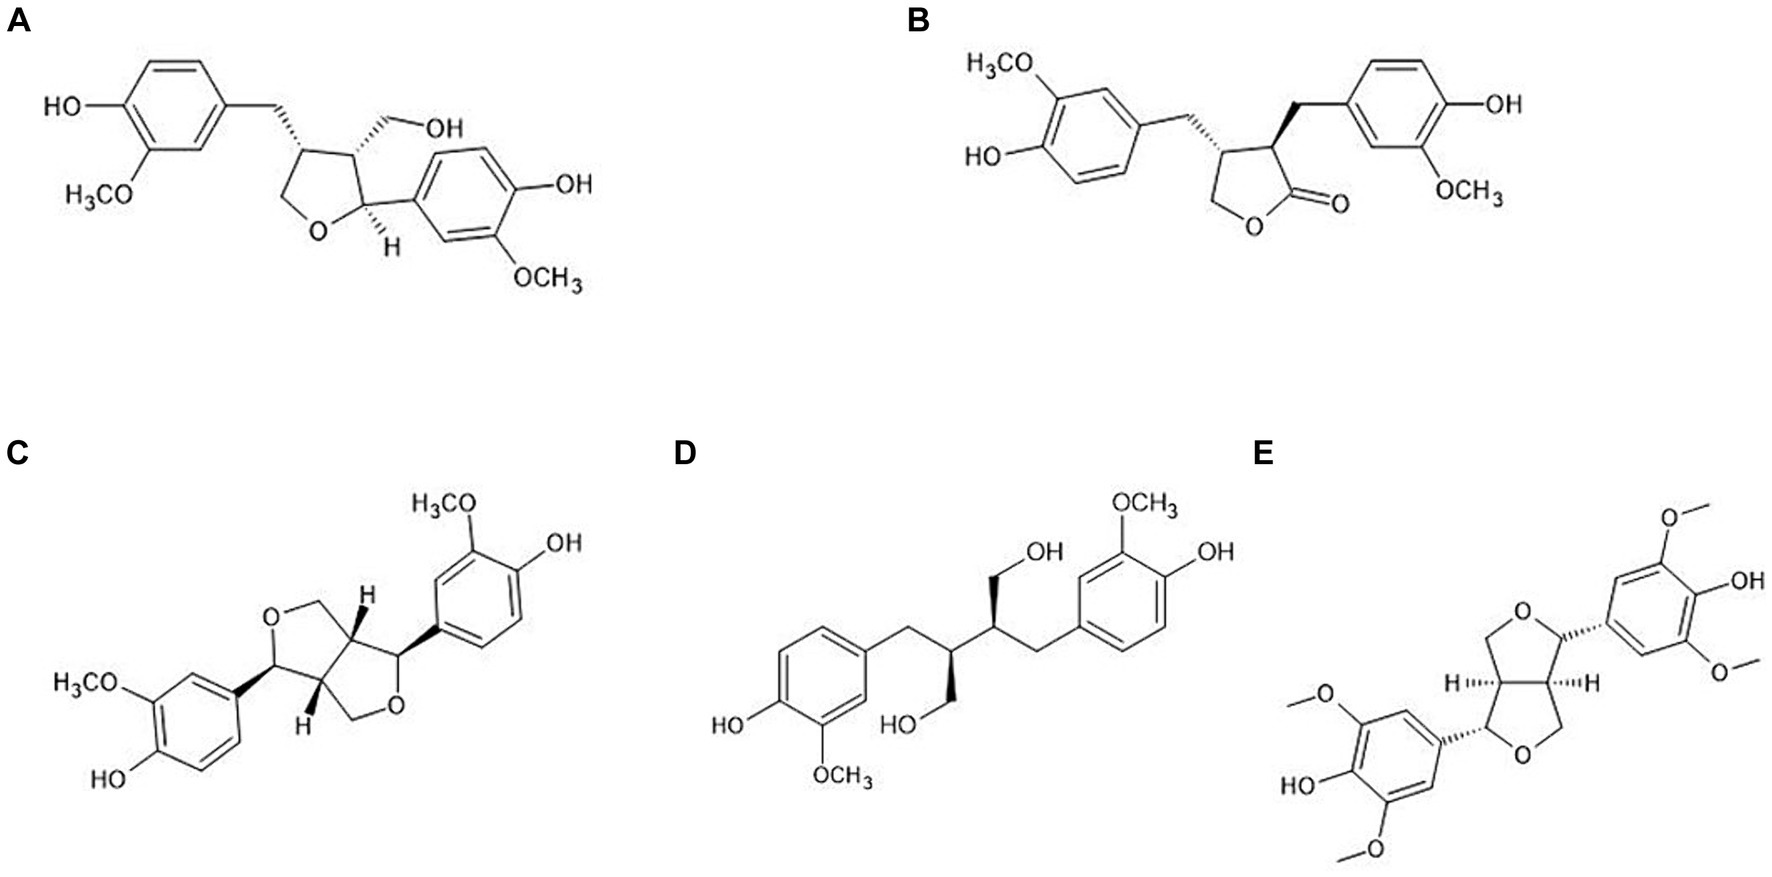
Figure 1. Chemical structure of plant lignans. (A) Lariciresinol; (B) matairesinol; (C) pinoresinol; (D) secoisolariciresinol; (E) syringaresinol.
All the reagents were of analytical and HPLC grade. Syr (≥98%) was obtained from ChemFaces (Wuhan, China). Seco (≥95%), Mat (≥85%), Lar (≥95%), and Pin (≥95%) were purchased from Sigma-Aldrich (St. Louis, Mo, United States). Acetonitrile (ACN) was purchased from Merck (Darmstadt, Germany). Methanol was from Honeywell Burdick & Jackson (Muskegon, MI, USA). Water was deionized from a Milli-Q system (Millipore, Bedford, United States).
The oat (Avena sativa L.) powder used in this study was commercial product from Natural Hill (Youngin, Korea). A total of 50 grain products were provided from Rural Development Administration (Jeonju, Korea) in 2022 or 2023. All samples were freeze-dried to achieve less than 3% water content. All samples were stored at −80°C until further analysis.
To select the parameters on the extraction of lignan, we select.
An amount of 0.1 g of oat powder was weighed in a 2-mL centrifuge tube, and 1 mL of 80% methanol was added and vortexed. Ultrasound sonication was performed at 0°C, 20°C, 40°C, 60°C, and 80°C for 60 min. The extract was then cooled and centrifuged at 22,250 × g at 4°C for 10 min to yield a clear supernatant. The supernatant was filtered through a 0.2 μm nylon filter (Whatman Inc., Maidstone, United Kingdom) into a vial for HPLC-MS/MS analysis.
For the extraction, 0.1 g of samples was weighed in a 2-mL microcentrifuge tube, and six different concentrations (water, 20%, 40%, 60%, 80%, and 100% methanol) of methanol were prepared using an ultrasound sonicator at 40°C for 60 min. The sample was then centrifuged at 22,250 × g for 10 min, and the supernatant was filtered through a 0.2 μm syringe filter for HPLC-MS/MS analysis.
The sample (0.1 g) was weighed and transferred to a 2-mL microcentrifuge tube. Then, 1 mL of 80% methanol was added and vortexed for 3 min. Subsequently, the extraction was carried out at 40°C for four different durations (30, 60, 90, and 120 min) using an ultrasonic extractor. Afterward, the extract was filtered through a 0.2 μm nylon syringe filter following centrifugation (22,250 × g, 4°C, 10 min) before HPLC–MS/MS analysis.
The RSM was employed to assess the impacts of extraction parameters and optimize conditions for multiple responses. The Box–Behnken design (BBD) was used to determine the extraction parameters for lignans from oats. The experimental design comprised 15 experimental points with three levels (−1, 0, 1) of each factor. The independent variables selected for optimizing lignan extraction were extraction temperature (°C) (X1), methanol concentration (% (v/v)) (X2), and extraction time (min) (X3). The natural and coded values of the factors used in the experimental design are presented in Table 1. The experimental data were fitted to a second-order polynomial model to determine the regression coefficients. The optimum conditions were conducted by 3D response surface plots with the relationship between the independent variables and responses. The second-order polynomial model expressed total lignan contents (μg/100 g) using the following equation:
where Y represents the response variable (total lignan contents μg/100 g), β0 is the intercept, βi is the linear regression coefficient, βii and βij are the quadratic and interaction terms, respectively. Xi and Xj are the actual levels of the independent variables. To assess the predictive performance of the model on the response variable, an analysis of variance (ANOVA) was conducted with a confidence level of 95%. The regression coefficient (R2) and the p-value of the lack of fit were calculated using Minitab ver. 14 software (Minitab Inc., State College, PA, United States).
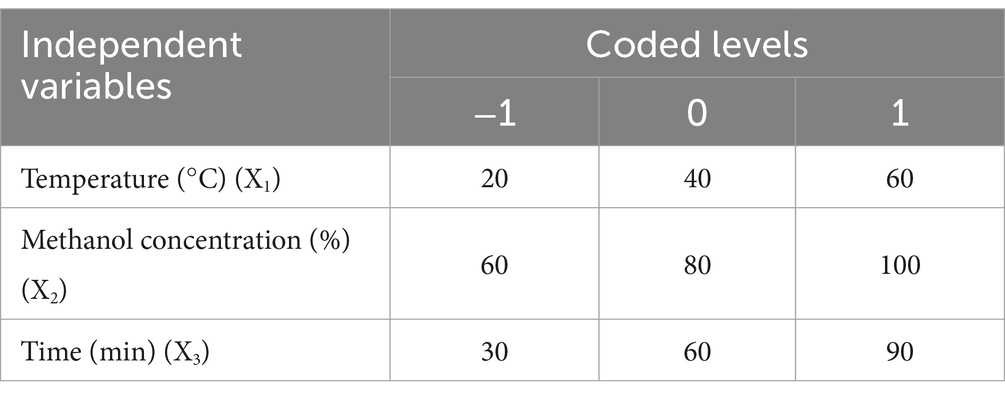
Table 1. Coded and actual levels of three variables in oat.
The HPLC-MS/MS conditions for total lignans were followed as described in a previous study (43). HPLC-MS/MS analysis was performed using an Agilent 1,260 Infinity II HPLC (Agilent Technologies, California, United States) coupled with an AB Sciex Triple Quad 4,500 LC-MS/MS system (AB Sciex, Framingham, MA, United States) equipped with an electrospray ionization source operating in negative mode. Samples were separated on an Agilent Poroshell C18 column (2.1 × 50 mm, 1.9 μm; Agilent Technologies, United States). The mobile phase A consisted of water, and mobile phase B consisted of acetonitrile, with an injection volume of 2 μL. The separation gradient elution program was as follows: 0–2 min, 15% B; 2–4 min, 50% B; 4–4.1 min, 50% B; 4.1–15 min, 15% B. The flow rate was maintained at 0.4 mL/min, and the column temperature was set at 30°C. The Turbo-V source parameters were configured as follows: curtain gas, 30 psi; collision gas, 9 psi; ion source gas 1, 80 psi; ion source gas 2, 40 psi; ionspray voltage, −4,500 V; ion source temperature, 450°C. The multiple reaction monitoring (MRM) conditions are listed in Table 2. Data acquisition and processing were performed using the AB SCIEX Analyst 1.7.1 Software and MultiQuant (ver 3.0.3).
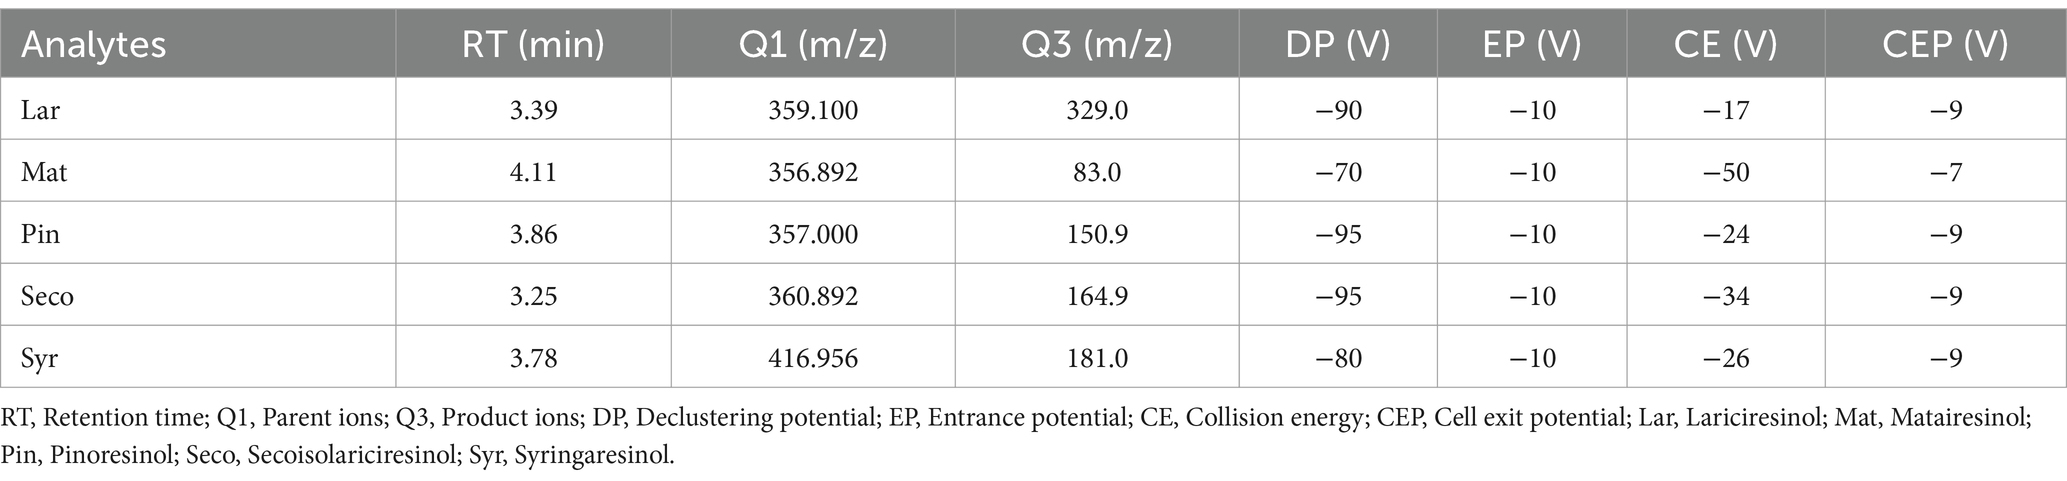
Table 2. MRM transitions and optimized parameters for lignans.
Statistical analysis of data was carried out using SAS 9.4 software (Statistical Analysis System, SAS Institute Inc., Cary, NC, United States). The data were expressed as mean ± standard deviation of three experiments. The data were analyzed with one-way analysis of variance followed by Duncan’s multiple range test (p < 0.05).
The effects of various parameters (extraction temperature, methanol concentration, and extraction time) on the contents of lignans in oats are presented in Table 3. Among the extraction temperatures, the total lignan content of oats ranged from 37.714 μg/100 g to 56.326 μg/100 g, with Syr showing the highest content ranging from 24.454 to 39.592 μg/100 g, while Mat and Seco were not detected. Additionally, the total lignan contents of oats were lowest at 0°C, increased from 20°C to 60°C, and then decreased at 80°C. The total lignan content of oats, using different methanol concentrations, ranged from 18.166 to 56.326 μg/100 g. Among these conditions, the total lignan content was elevated with the use of 80% methanol as the extraction solvent. However, Mat and Seco were not detected. The content of Syr was 18.166 μg/100 g in 0% methanol, while Lar, Mat, Pin, and Seco were not detected. Moreover, Syr was the most abundant in 80% methanol (39.592 μg/100 g), followed by Pin and Lar at 11.252 and 5.482 μg/100 g, respectively. Previous studies reported highly variable ultrasonic extraction times for lignans, ranging from 5 min to 4 h depending on the sample type (25, 44–46). Therefore, this study used extraction times from 30 to 120 min to investigate the effect of extraction time on the lignan content of oats. In this study, most of the lignans showed higher content at 60 min, with a decrease observed at 90 min. The highest total lignan content in oats was observed after 60 min of extraction, with values of 56.326 μg/100 g. However, a significant decrease was observed at 90 and 120 min. Among oats, Syr was the most abundant with 39.592 μg/100 g, while Mat and Seco were not detected. The lignan content depends on the variety of the plant and/or the geographical location of oats. Durazzo et al. (47) studied that Seco and Mat were not detected in oats, which aligns with our results. However, the lignan contents of various oat varieties, with Seco and Mat ranging from 6 to 19 μg/100 g and 0 to 104 μg/100 g, respectively (25). The thermal stability of lignans is known to depend on the structure of the compound and its interactions with other compounds in the plant matrix (44, 48, 49). Gerstenmeyer et al. (49) evaluated that the Lar content in sesame seeds and wheat was stable at 100°C but decreased rapidly above 200°C. These findings indicate that the effect of heat treatment on lignan concentration depends on the plant species, cultivation, extraction, and processing methods (50, 51). Therefore, the results of this study suggest that the differences in oat lignan content depending on temperature are due to differences in oat variety, growing conditions, and extraction methods. Most lignans in grains and seeds are commonly extracted using polar organic solvents (methanol, ethanol, acetone), while less polar lignans can be extracted using non-polar organic solvents such as n-hexane, dichloromethane, and chloroform (5, 18, 52). Additionally, adding 5%–10% water in organic solvents promotes solvent penetration into the plant matrix and facilitates the extraction of polar lignans (5). A previous study examined Seco in flaxseed hulls at various ethanol and methanol concentrations (53). The results showed higher contents of Seco in methanol compared to ethanol, with the highest extraction observed at 70 and 80% methanol concentrations, while extraction yields decreased with ethanol concentrations above 80%. The lignans examined in this study were generally not detected or showed low quantity when extracted with water; however, lignan content increased at 80% methanol compared to 100% methanol. These findings are consistent with previous research, indicating that the five lignans analyzed in this study are more easily extracted in organic solvents than water. Additionally, adding 30% water to methanol improves the polarity of the solvent, facilitating the extraction of polar lignans. Ultrasound-assisted extraction is an approach to create cavitation bubbles within plant cell walls to facilitate solvent penetration and increase the release of various organic compounds (54, 55). The efficiency of the method can be affected by the extraction time, solvent-to-sample ratio, and extraction temperature, which should be taken into consideration (56–58). Previous studies have shown that the lignan secoisolariciresinol diglucoside and phenolic compounds, such as ferulic acid glucoside and caffeic acid glucoside in flaxseed increased with extraction time, specifically more than a 2-fold increase at 60 min compared to 15 min extraction (59). Guo et al. (28) conducted a study to optimize ultrasonic extraction conditions for three lignans ((-)-fargesin, Ses, L-asarinin) from Zanthoxylum armatum roots using RSM. The highest lignan content was observed at 55°C with an extraction time of 40 min, but prolonged sonication time led to its degradation. This study showed that lignan content was highest after 60 min of ultrasonic extraction, with the content decreasing after 90 min. This indicates that the lignans present in the sample matrix were extracted within 60 min, but longer extraction time resulted in ultrasonic degradation of released lignans.
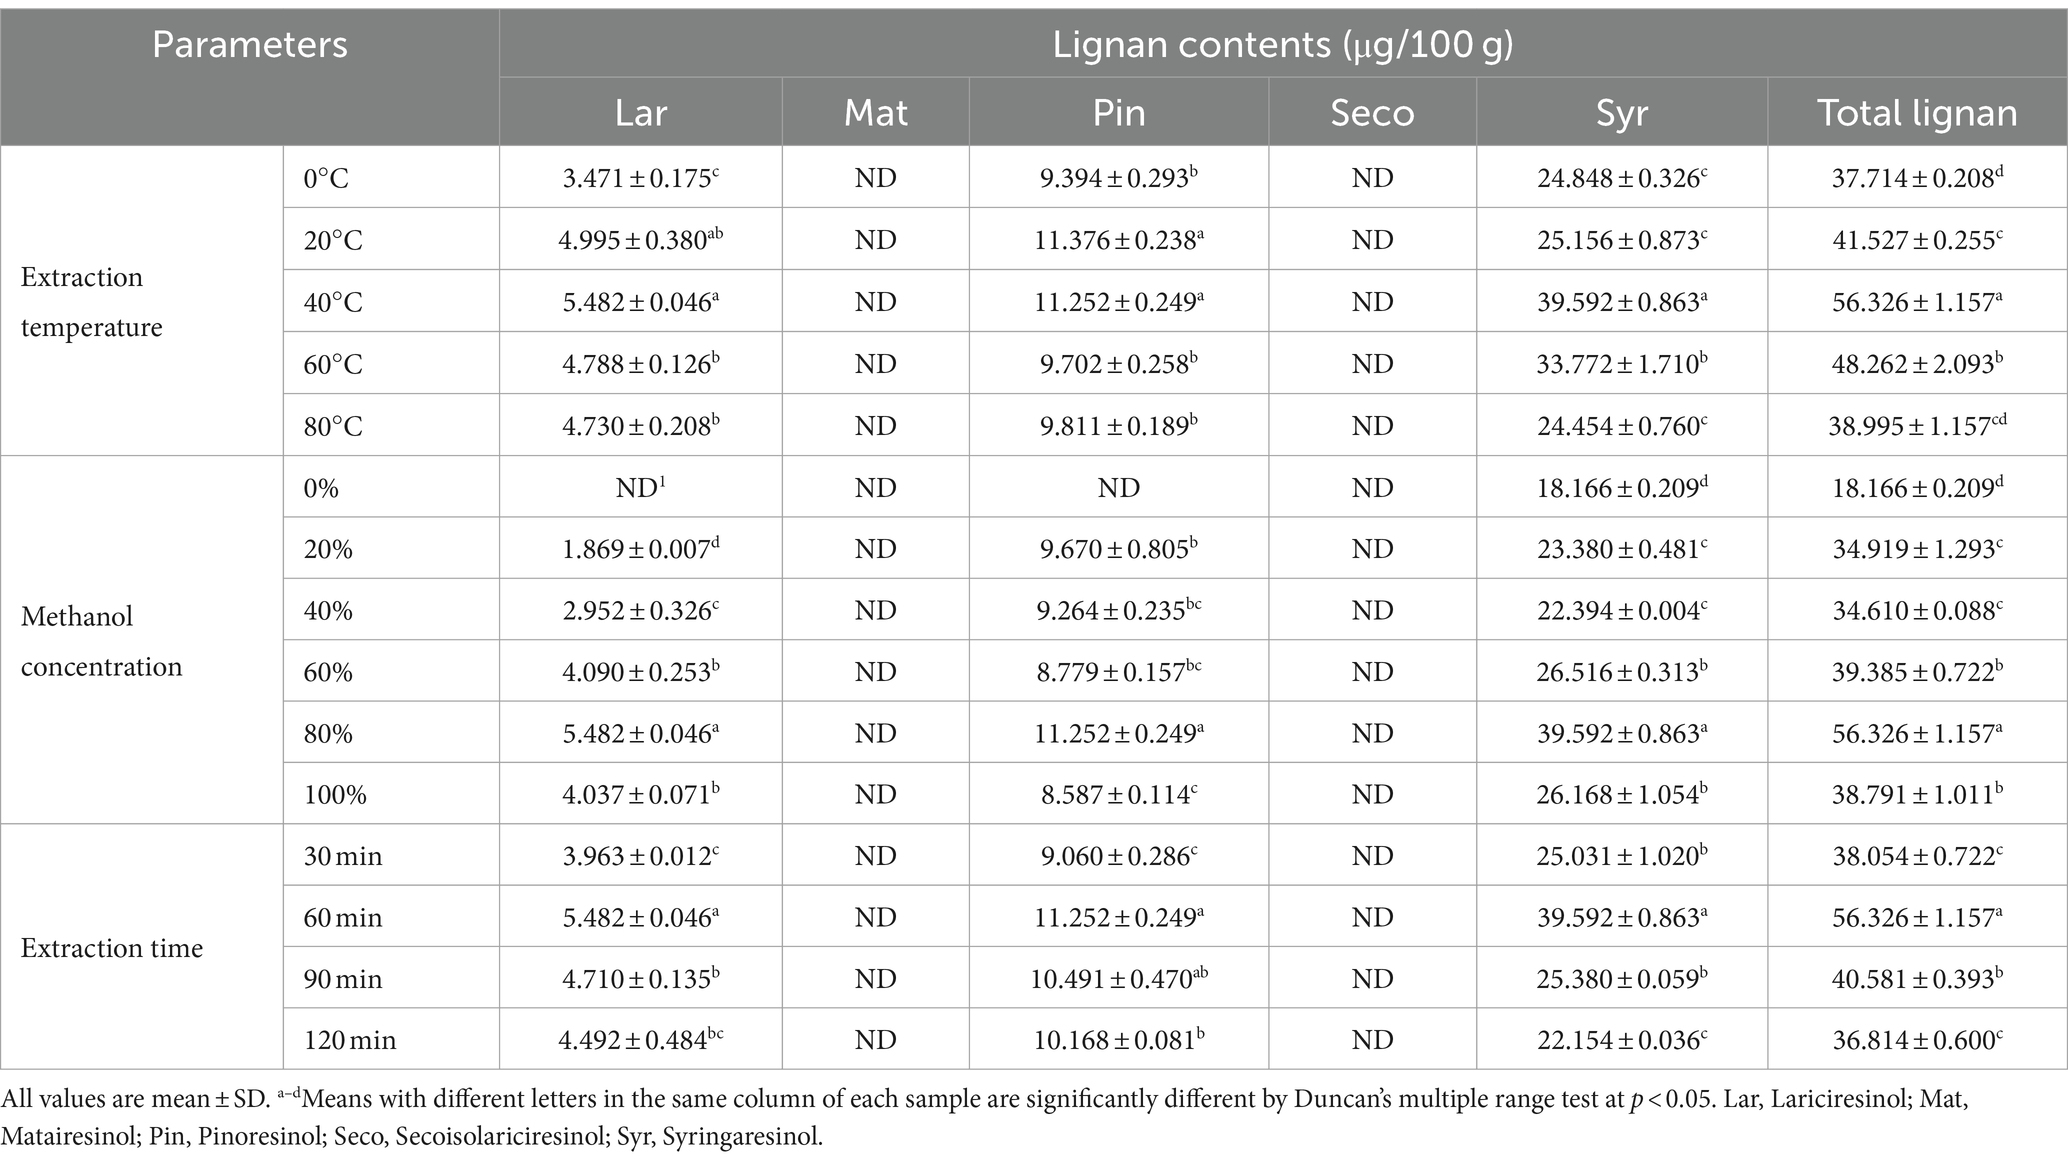
Table 3. The effect of different parameters of lignan contents in oats.
Fifteen experiments were designed with independent variables of temperature, methanol concentration, and extraction time coded in three levels. The results for the lignan content of oats and the response of the surface are presented in Table 4 and Figure 2, respectively. The lignan content of oats ranged from 38.777 to 60.709 μg/100 g. Among the five lignans, Syr had the highest content, ranging from 23.003 to 41.812 μg/100 g. Pin and Lar were present in the range of 10.494 to 13.025 μg/100 g and 4.041 to 6.346 μg/100 g, respectively, while Mat and Pin were not detected. The experimental results for oats, designed by the BBD, were analyzed for significance and adequacy using ANOVA and are presented in Table 5. The p-values of the linear, quadratic, and interaction terms of the model ranged from 0.031 to 0.553, with the term X2 acting as the significant term. The linear term, methanol concentration, has a p-value of 0.031, indicating a significant effect on the response variable. However, the extraction temperature (X1) and extraction time (X3) demonstrated p > 0.05 and were not influenced by the response variables. Similarly, the quadratic term was found to be a significant variable with a p-value of 0.027 in term X2, whereas X1 and X3 did not have a significant effect on the response variable (p > 0.05). Furthermore, the interaction term did not show significance in all terms (p > 0.05). The results indicated that methanol concentration has a significant effect on total lignan content, whereas extraction time and extraction temperature do not appear to be significant variables. The p-value for lack of fit was 0.059, indicating no significant difference, suggesting that the response surface model adequately describes the variation in lignan content. Furthermore, the R2 value for the response surface model was 82.39%, indicating a good fit.
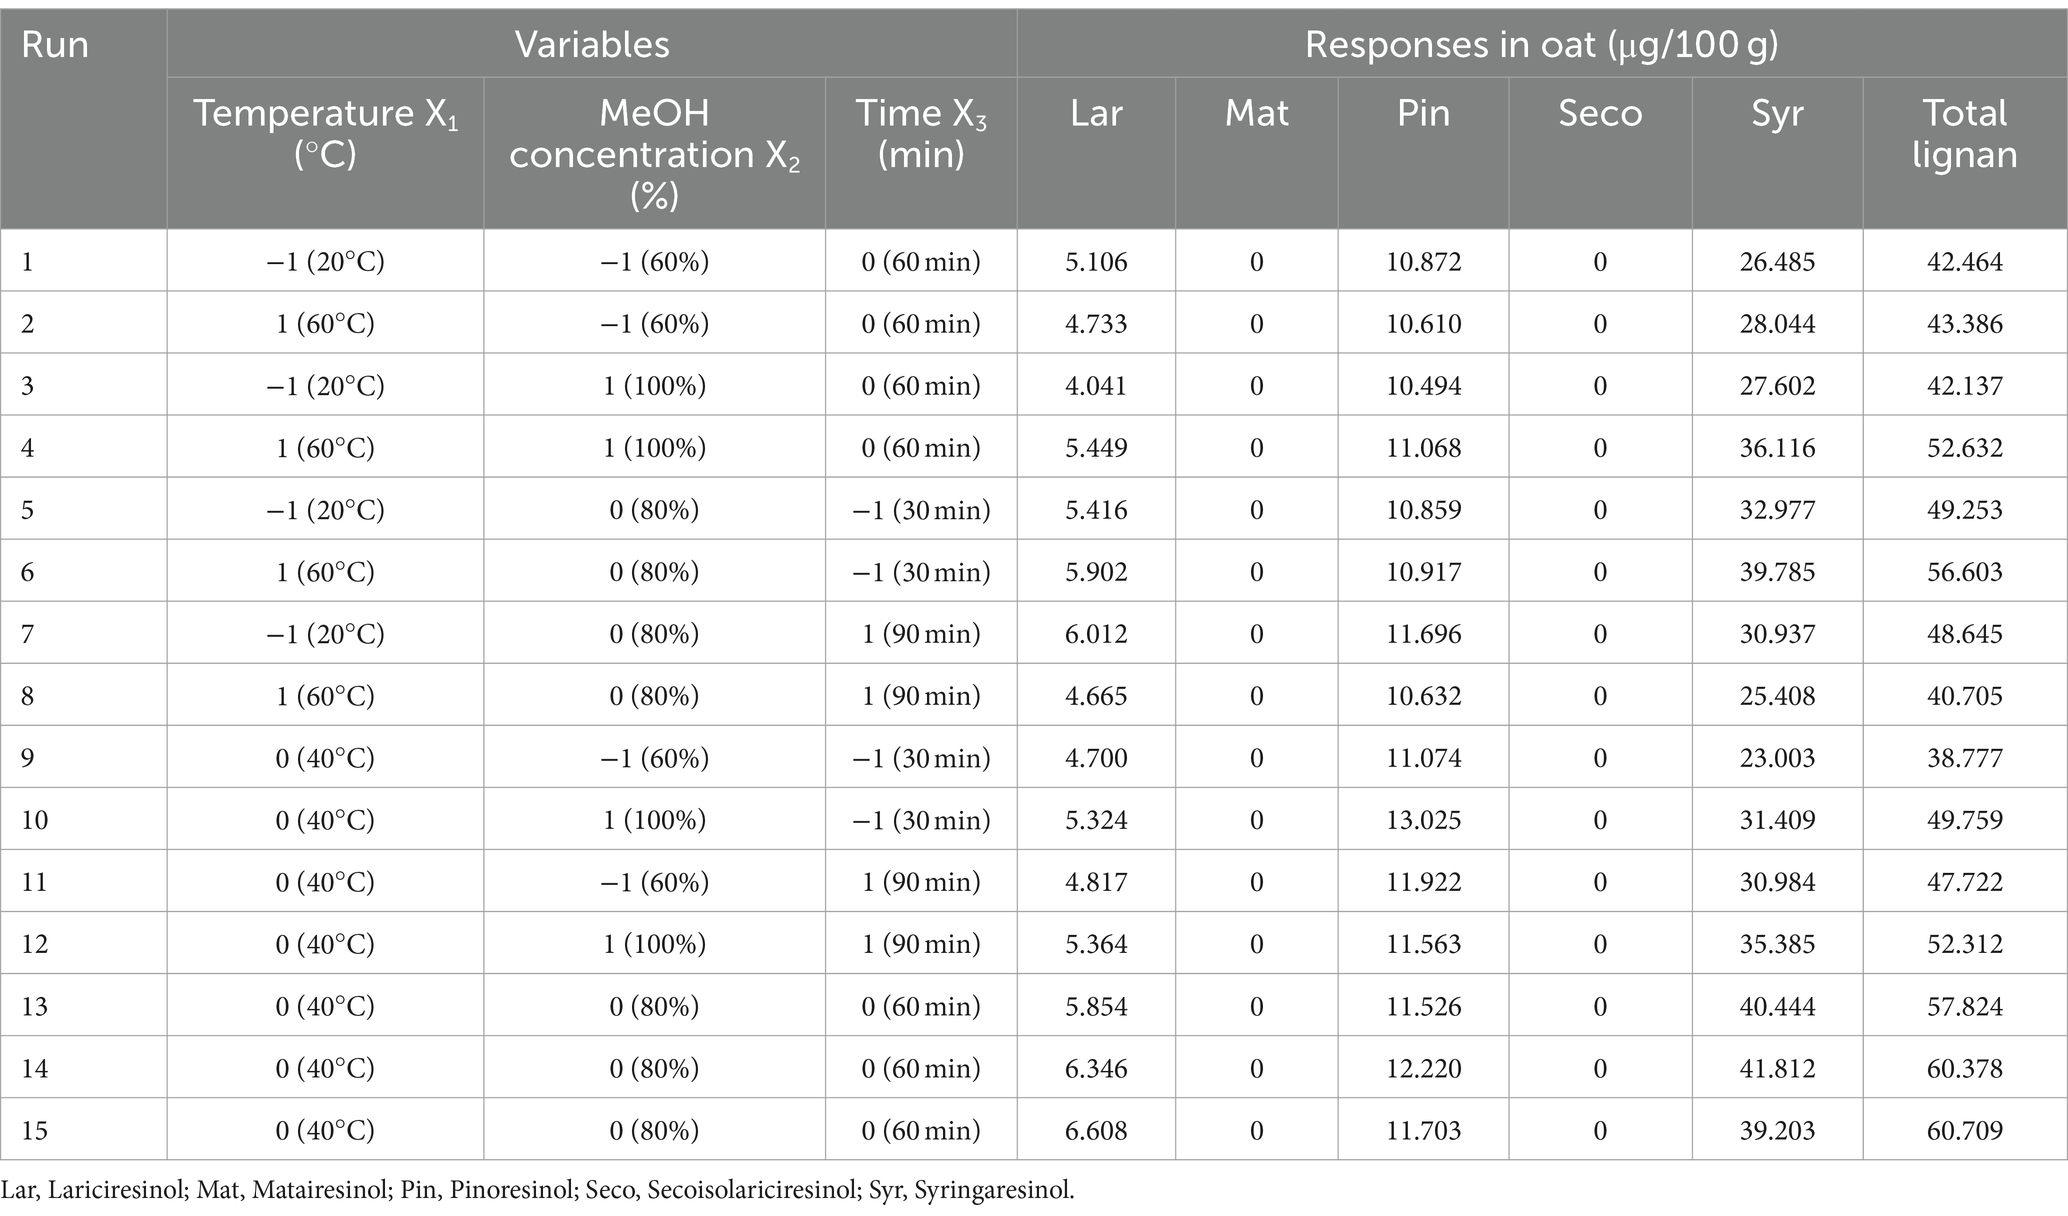
Table 4. Response surface design and experimental data for the total lignan content in oat.
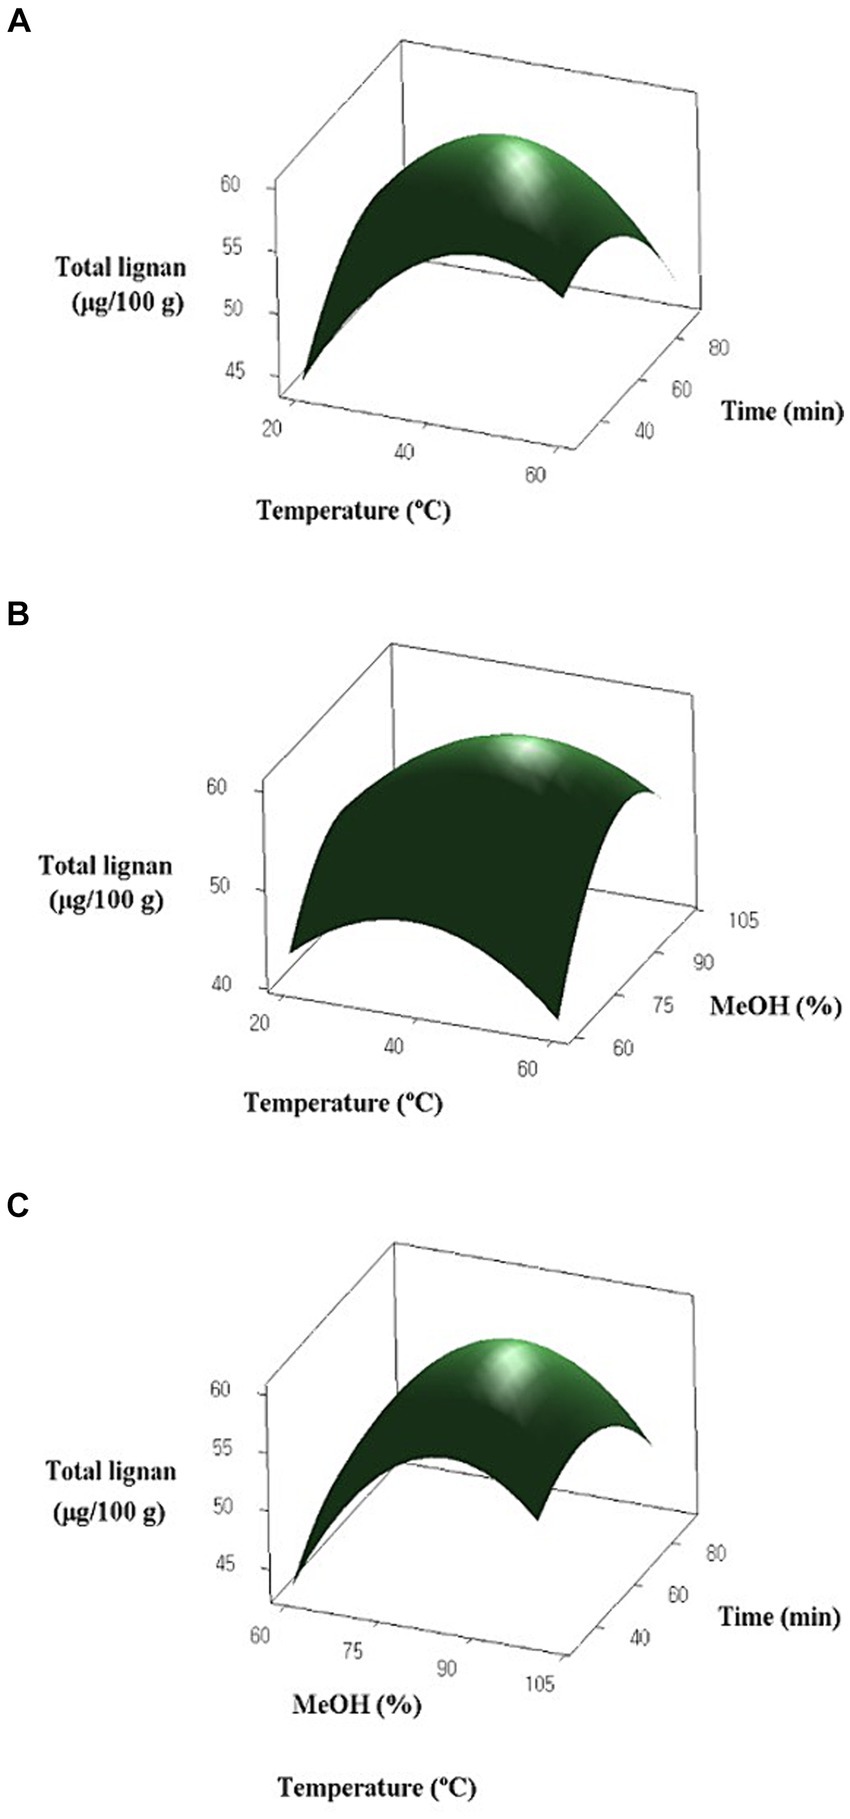
Figure 2. Response surface graphs for the effects of temperature, methanol (MeOH) concentration and extraction time on lignan content of oat: (A) Temperature (X1) and extraction time (X3); (B) Temperature (X1) and MeOH concentration (X2); (C) MeOH concentration (X2) and extraction time (X3).
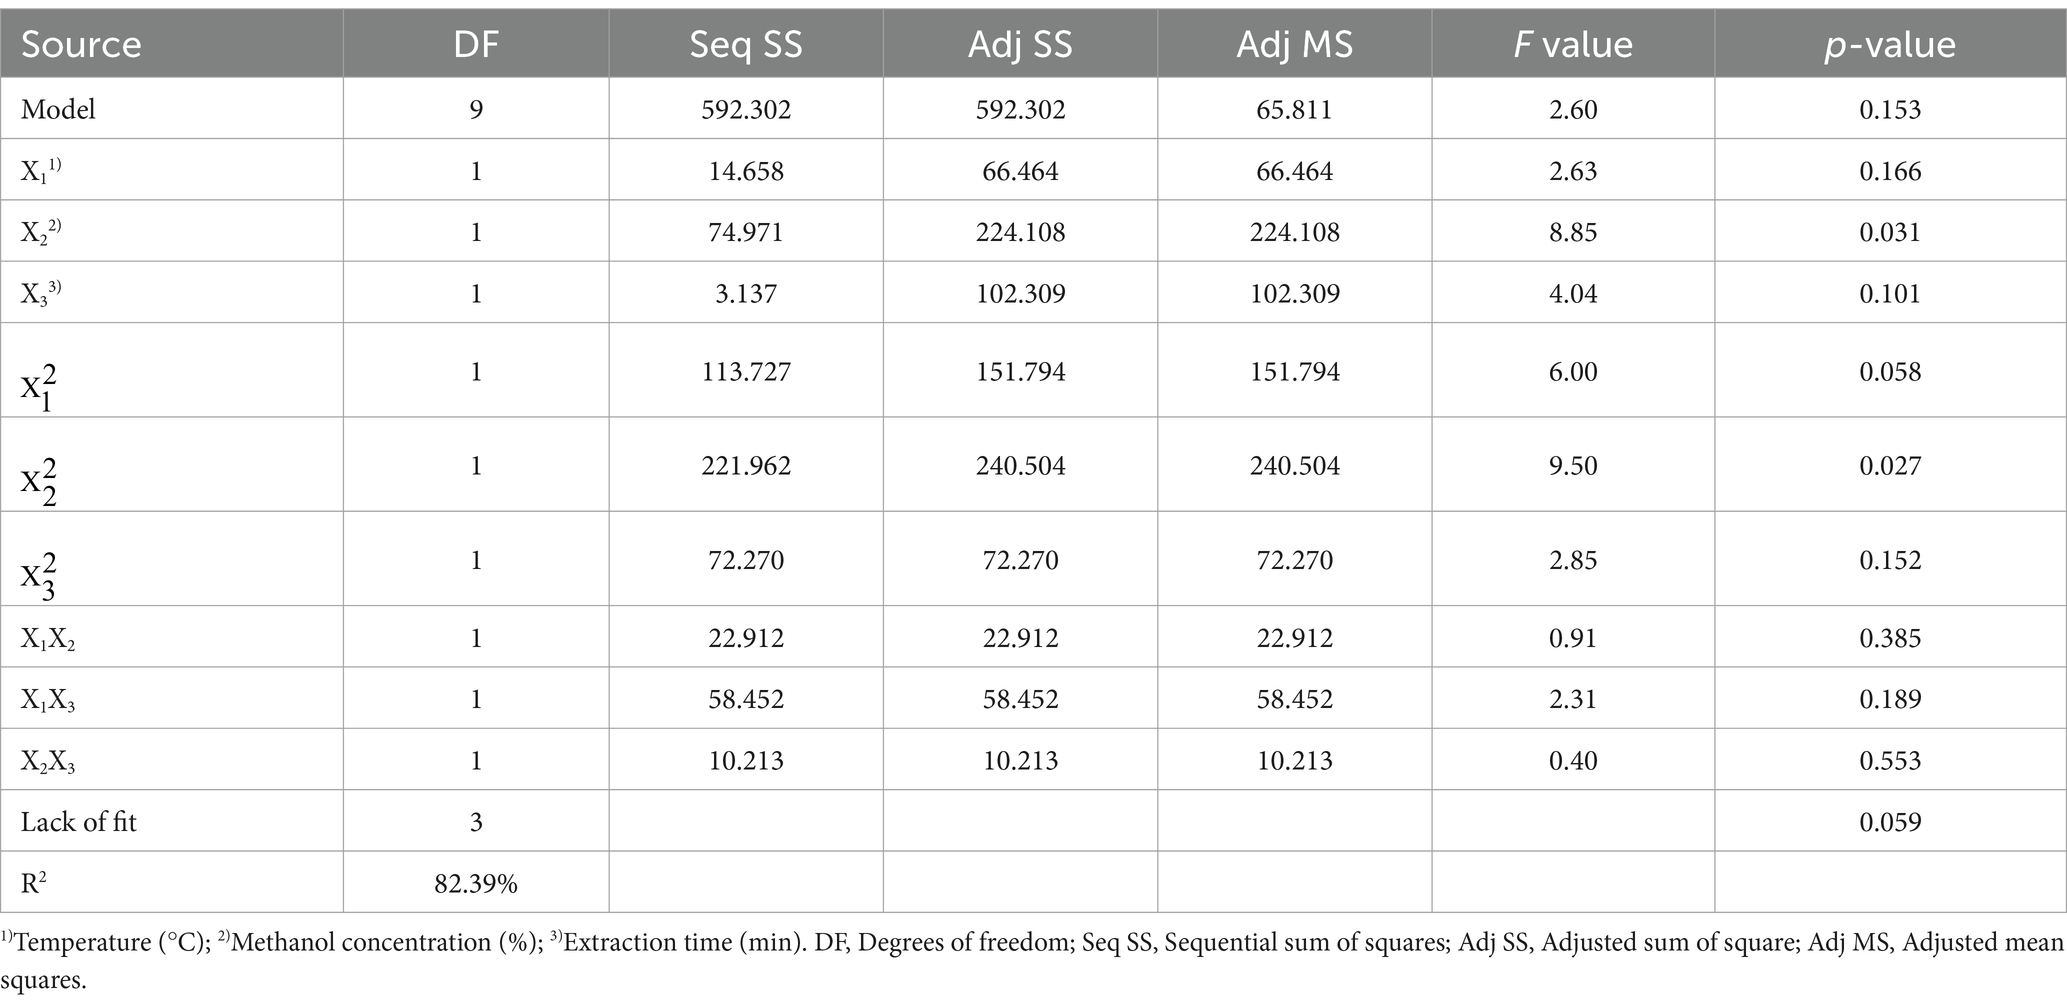
Table 5. Analysis of variance (ANOVA) of BBD model for total lignan from oat.
The regression equation obtained for total lignan is expressed as equation given below:
Table 6 displays the optimized extraction conditions for oat lignans, determined by setting the lignan content to its maximum value. The predicted optimal extraction conditions for oat lignans are a temperature of 44.24°C, a methanol concentration of 84.64%, and an extraction time of 53.53 min. However, in this study, the optimal extraction conditions were modified to include a temperature of 40°C, a methanol concentration of 84%, and an extraction time of 60 min. These parameters were selected for experimental convenience in evaluating the total lignan content of oats. The results showed that the lignan content of the oats was 59.564 μg/100 g, which was similar to the predicted value of 60.213 μg/100 g. Several factors, including solvent-to-solid ratio, solvent concentration, extraction time, and temperature, may significantly impact the extraction efficiency of phenolic compounds from plant sources (60–62). Liyana-Pathirana and Shahidi (63) reported that the concentration of solvent significantly influenced the total antioxidant activity of wheat extracts using RSM. Fombang et al. (64) also reported that solvent concentration had the greatest effect on the total phenol content of Moringa oleifera Lam. leaves compared to extraction temperature and extraction time. Additionally, several studies have demonstrated that solvent concentration is an important factor in the extraction of phenolic compounds from various natural products (65–67), consistent with our findings.
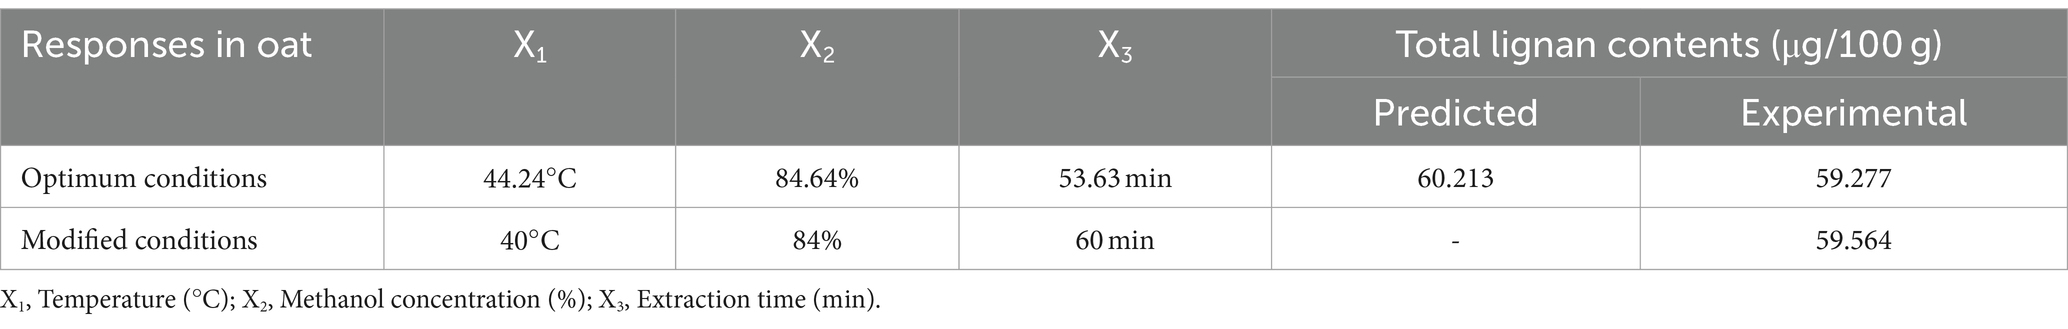
Table 6. Optimum conditions, predicted and experimental values of responses of oat.
To validate the LC-MS/MS analytical method of lignans, the linearity, limits of detection (LOD), limit of quantitation (LOQ), and intra-day and inter-day precision were evaluated. The linearity was evaluated with six concentration levels (15.625–500 ng/mL) for each analyte, showing acceptable correlation coefficients (R2 > 0.999) (Supplementary Figure 1). The LOD is in the range of 0.041–0.877 μg/100 g, and the LOQ is in the range of 0.118–1.831 μg/100 g (Supplementary Table 1). The intra-day and inter-day precision of the lignans in oats ranged from 0.075%–3.480% and 0.749%–13.735% RSD, respectively (Supplementary Table 2). In this study, a total 53 samples of grains and their products using optimal lignan extraction conditions based on RSM results was analyzed (Table 7). The total lignan contents of the grain samples ranged from 0 to 85.930 μg/100 g. Most of the samples exhibited low lignan content, except for Syr. Barley sprout had the highest total lignan content among the samples with 85.930 μg/100 g. The most abundant lignan in barley sprout was Syr with 41.713 μg/100 g. Lar and Pin were present at 36.491 and 7.726 μg/100 g, respectively, while Mat and Seco were not detected. In wheat, all lignans except Syr were not detected. In addition, the total lignan content of rice increased after cooking process. However, considering that the moisture content of cooked rice is about 65% (68), the content of lignans consumed from cooked rice will be smaller than the value presented in Table 7. For example, the lignan intake from cooked Saeilmi brown rice would be 17.648 μg per serving of cooked rice (210 g). Smeds et al. (25) conducted a study on the lignan content of various cereals and found that wheat and barley accounted for approximately 80% of the total lignan content, while oats contained 42% Syr, with higher proportions of Lar and Pin compared to other varieties. The study also showed that Mat was not detected in some wheat and oat varieties, and Lar content varied widely, ranging from 50.3 to 291 μg/100 g depending on the variety. Peñalvo et al. (10) reported that wheat, oat, barley, and rice had the highest levels of Syr, with wheat accounting for over 50% of the total lignan content, three times more than barley and oat. Barley, wheat, and barley had low levels of Mat, ranging from 1 μg/100 g to 3 μg/100 g. The lignan content of barley husks was found to be higher compared to other grains, particularly Lar, which was more than nine times higher compared to other grains. Makowska et al. (18) found that Syr had the highest lignan content among germinated grains, with some varieties showing increased contents of Lar and Syr after germination. Furthermore, Katina et al. (69) reported that germination approximately doubled the lignan levels in wheat. It is known that lignans are more easily released from the structure of germinated grains, leading to an increase in their content. In addition, the breakdown of some starch during germination can increase the content of bioactive compounds such as phenolic compounds. In a study conducted by Gerstenmeyer et al. (49), the content of Lar and Syr increased over time when wheat was steamed at 100°C. The increase in lignan content may be attributed to the facilitation of lignan extraction resulting from changes in the matrix after heating. Therefore, it is considered that the high content of lignan observed in the cooked samples was due to the release of lignans resulting from the gelatinization of starch during cooking.
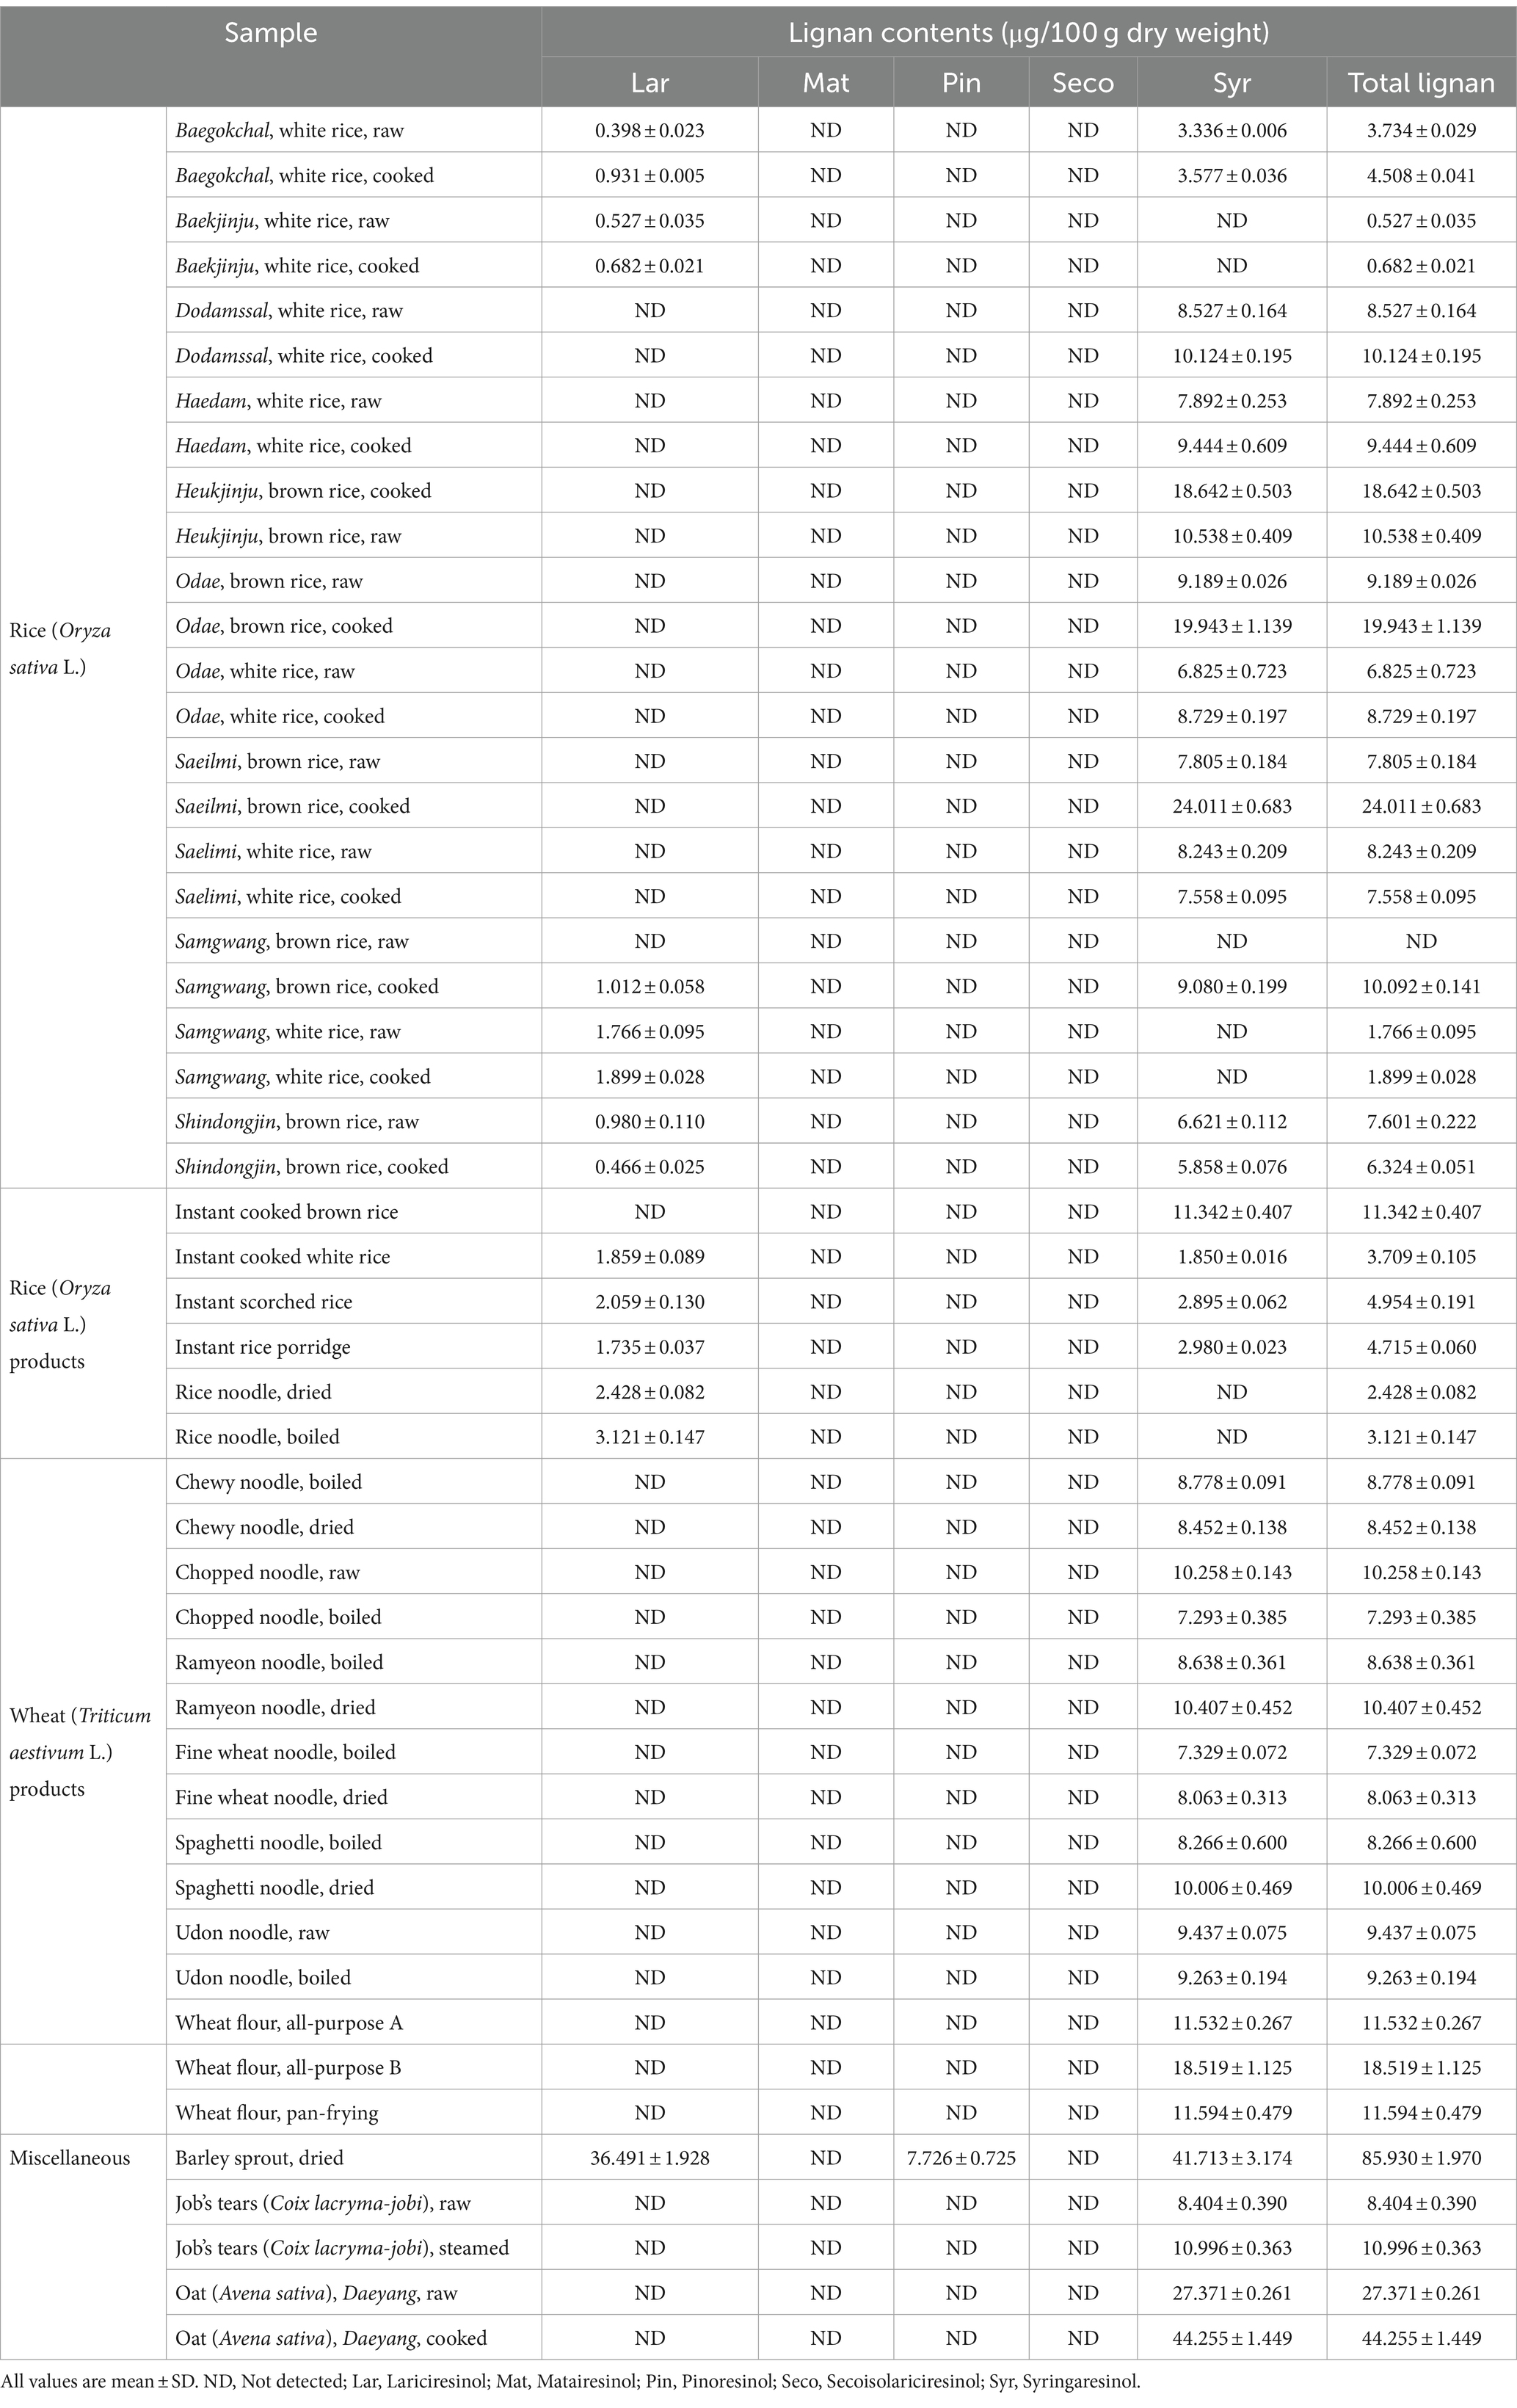
Table 7. The contents of lignan in grains and grain products.
In conclusion, optimal extraction conditions of lignans from cereal grains using RSM was investigated. A Box–Behnken design was employed to develop optimal extraction condition of lignan using the three extracting parameters (temperature, methanol concentration, and extraction time). The optimum extract conditions for lignans from grain were obtained at X1 = 44.24°C, X2 = 84.64%, and X3 = 53.63 min. To implement these experimental conditions in the actual experiment, slight modifications were made to the optimal conditions, resulting in X1 = 40°C, X2 = 80%, and X3 = 60 min. The predicted results matched well with the experimental results obtained using the modified optimal extraction conditions. The highest total lignan content of grain was found in barley sprout. These results may be useful for providing reliable data about the lignan contents in cereal grain.
The original contributions presented in the study are included in the article/Supplementary material, further inquiries can be directed to the corresponding authors.
YooK: Formal analysis, Investigation, Writing – original draft. H-WK: Conceptualization, Writing – review & editing. JS: Conceptualization, Supervision, Writing – original draft. YouK: Conceptualization, Funding acquisition, Writing – review & editing.
The author(s) declare that financial support was received for the research, authorship, and/or publication of this article. This study was carried out with the support of “Cooperative Research Program for Agriculture Science and Technology Development (project no. RS-2022-RD009982)” Rural Development Administration, Republic of Korea and the BB21plus funded by Busan metropolitan City and Busan Techno Park.
The authors declare that the research was conducted in the absence of any commercial or financial relationships that could be construed as a potential conflict of interest.
All claims expressed in this article are solely those of the authors and do not necessarily represent those of their affiliated organizations, or those of the publisher, the editors and the reviewers. Any product that may be evaluated in this article, or claim that may be made by its manufacturer, is not guaranteed or endorsed by the publisher.
The Supplementary material for this article can be found online at: https://www.frontiersin.org/articles/10.3389/fnut.2024.1409309/full#supplementary-material
2. Landete, JM . Plant and mammalian lignans: a review of source, intake, metabolism, intestinal bacteria and health. Food Res Int. (2012) 46:410–24. doi: 10.1016/j.foodres.2011.12.023
3. Xu, WH, Zhao, P, Wang, M, and Liang, Q. Naturally occurring furofuran lignans: structural diversity and biological activities. Nat Prod Res. (2019) 33:1357–73. doi: 10.1080/14786419.2018.1474467
4. Penalvo, JL, Adlercreutz, H, Uehara, M, Ristimaki, A, and Watanabe, S. Lignan content of selected foods from Japan. J Agric Food Chem. (2008) 56:401–9. doi: 10.1021/jf072695u
5. Willfor, SM, Smeds, AI, and Holmbom, BR. Chromatographic analysis of lignans. J Chromatogr A. (2006) 1112:64–77. doi: 10.1016/j.chroma.2005.11.054
6. Yashin, AY, Yashunskii, DB, Vedenin, AN, Nifant’ev, NE, Nemzer, BV, and Yashin, YI. Chromatographic determination of lignans (antioxidants) in food products. J Aanal Chem. (2018) 73:399–406. doi: 10.1134/S106193481805012X
7. Tardugno, R, Cicero, N, Costa, R, Nava, V, and Vadalà, R. Exploring lignans, a class of health promoting compounds, in a variety of edible oils from Brazil. Food Secur. (2022) 11:1386. doi: 10.3390/foods11101386
8. Niemeyer, HB, Honig, DM, Kulling, SE, and Metzler, M. Studies on the metabolism of the plant lignans secoisolariciresinol and matairesinol. J Agric Food Chem. (2003) 51:6317–25. doi: 10.1021/jf030263n
9. Hu, C, Yuan, YV, and Kitts, DD. Antioxidant activities of the flaxseed lignan secoisolariciresinol diglucoside, its aglycone secoisolariciresinol and the mammalian lignans enterodiol and enterolactone in vitro. Food Chem Toxicol. (2007) 45:2219–27. doi: 10.1016/j.fct.2007.05.017
10. Peñalvo, JL, Haajanen, KM, Botting, N, and Adlercreutz, H. Quantification of lignans in food using isotope dilution gas chromatography/mass spectrometry. J Agric Food Chem. (2005) 53:9342–7. doi: 10.1021/jf051488w
11. Cornwell, T, Cohick, W, and Raskin, I. Dietary phytoestrogens and health. Phytochemistry. (2004) 65:995–1016. doi: 10.1016/j.phytochem.2004.03.005
12. Wang, LQ . Mammalian phytoestrogens: Enterodiol and Enterolactone. J Chromatogr B Analyt Technol Biomed Life Sci. (2002) 777:289–309. doi: 10.1016/s1570-0232(02)00281-7
13. Zaki, UKH, Fryganas, C, Trijsburg, L, Feskens, EJ, and Capuano, E. In vitro gastrointestinal bioaccessibility and colonic fermentation of lignans from fresh, fermented, and germinated flaxseed. Food Funct. (2022) 13:10737–47. doi: 10.1039/D2FO02559K
14. Berenshtein, L, Okun, Z, and Shpigelman, A. Stability and bioaccessibility of Lignans in food products. ACS Omega. (2024) 9:2022–31. doi: 10.1021/acsomega.3c07636
15. Cui, S, and Liu, RH. Health benefits of oat phytochemicals. Oats Nutr Technol. (2013) 2013:171–94. doi: 10.1002/9781118354100.ch7
16. Singh, R, De, S, and Belkheir, A. Avena sativa (oat), a potential neutraceutical and therapeutic agent: an overview. Crit Rev Food Sci Nutr. (2013) 53:126–44. doi: 10.1080/10408398.2010.526725
17. Bolvig, AK, Adlercreutz, H, Theil, PK, Jørgensen, H, and Knudsen, KEB. Absorption of plant lignans from cereals in an experimental pig model. Br J Nutr. (2016) 115:1711–20. doi: 10.1017/S0007114516000829
18. Makowska, A, Waśkiewicz, A, and Chudy, S. Lignans in triticale grain and triticale products. J Cereal Sci. (2020) 93:102939. doi: 10.1016/j.jcs.2020.102939
19. Bleidere, M, Zute, S, Gailāne, N, Kantāne, I, Jākobsone, I, and Bartkevičs, V. Lignans in oat and barley grains depending on genotype and farming practice. Proc Latv Acad Sci Section B Nat Exact Appl Sci. (2022) 76:124–30. doi: 10.2478/prolas-2022-0019
20. Nørskov, NP, and Knudsen, KEB. Validated LC-MS/MS method for the quantification of free and bound lignans in cereal-based diets and feces. J Agric Food Chem. (2016) 64:8343–51. doi: 10.1021/acs.jafc.6b03452
21. Schwartz, H, and Sontag, G. Determination of secoisolariciresinol, lariciresinol and isolariciresinol in plant foods by high performance liquid chromatography coupled with coulometric electrode array detection. J Chromatogr B Analyt Technol Biomed Life Sci. (2006) 838:78–85. doi: 10.1016/j.jchromb.2006.03.058
22. Smeds, AI, Jauhiainen, L, Tuomola, E, and Peltonen-Sainio, P. Characterization of variation in the lignan content and composition of winter rye, spring wheat, and spring oat. J Agric Food Chem. (2009) 57:5837–42. doi: 10.1021/jf9004274
23. Thompson, LU, Boucher, BA, Liu, Z, Cotterchio, M, and Kreiger, N. Phytoestrogen content of foods consumed in Canada, including isoflavones, lignans, and coumestan. Nutr Cancer. (2006) 54:184–201. doi: 10.1207/s15327914nc5402_5
24. Moazzami, AA, Haese, SL, and Kamal-Eldin, A. Lignan contents in sesame seeds and products. Eur J Lipid Sci Technol. (2007) 109:1022–7. doi: 10.1002/ejlt.200700057
25. Pilar, B, Gullich, A, Oliveira, P, Stroher, D, Piccoli, J, and Manfredini, V. Protective role of flaxseed oil and flaxseed lignan secoisolariciresinol diglucoside against oxidative stress in rats with metabolic syndrome. J Food Sci. (2017) 82:3029–36. doi: 10.1111/1750-3841.13964
26. Smeds, AI, Eklund, PC, and Willfor, SM. Content, composition, and stereochemical characterisation of lignans in berries and seeds. Food Chem. (2012) 134:1991–8. doi: 10.1016/j.foodchem.2012.03.133
27. Cheng, Z, Song, H, Yang, Y, Zhou, H, Liu, Y, and Liu, Z. Smashing tissue extraction of five lignans from the fruit of Schisandra chinensis. J Chromatogr Sci. (2016) 54:bmv116. doi: 10.1093/chromsci/bmv116
28. Guo, T, Su, D, Huang, Y, Wang, Y, and Li, YH. Ultrasound-assisted aqueous two-phase system for extraction and enrichment of Zanthoxylum armatum lignans. Molecules. (2015) 20:15273–86. doi: 10.3390/molecules200815273
29. Nemes, SM, and Orsat, V. Evaluation of a microwave-assisted extraction method for lignan quantification in flaxseed cultivars and selected oil seeds. Food Anal Methods. (2012) 5:551–63. doi: 10.1007/s12161-011-9281-6
30. Angeloni, S, Navarini, L, Khamitova, G, Maggi, F, Sagratini, G, Vittori, S, et al. A new analytical method for the simultaneous quantification of isoflavones and lignans in 25 green coffee samples by HPLC-MS/MS. Food Chem. (2020) 325:126924. doi: 10.1016/j.foodchem.2020.126924
31. Smeds, AI, Eklund, PC, Sjoholm, RE, Willfor, SM, Nishibe, S, Deyama, T, et al. Quantification of a broad spectrum of lignans in cereals, oilseeds, and nuts. J Agric Food Chem. (2007) 55:1337–46. doi: 10.1021/jf0629134
32. Castro-Perez, JM . Current and future trends in the application of HPLC-MS to metabolite-identification studies. Drug Discov Today. (2007) 12:249–56. doi: 10.1016/j.drudis.2007.01.007
33. Gallien, S, Duriez, E, Demeure, K, and Domon, B. Selectivity of LC-MS/MS analysis: implication for proteomics experiments. J Proteome. (2013) 81:148–58. doi: 10.1016/j.jprot.2012.11.005
34. Lucci, P, Saurina, J, and Núñez, O. Trends in LC-MS and LC-HRMS analysis and characterization of polyphenols in food. TrAC Trends Anal Chem. (2017) 88:1–24. doi: 10.1016/j.trac.2016.12.006
35. López, MJO, Innocenti, M, Ieri, F, Giaccherini, C, Romani, A, and Mulinacci, N. HPLC/DAD/ESI/MS detection of lignans from Spanish and Italian Olea europaea L. fruits. J Food Compos Anal. (2008) 21:62–70. doi: 10.1016/j.jfca.2007.04.012
36. Kuhnle, GG, Dell’Aquila, C, Runswick, SA, and Bingham, SA. Variability of phytoestrogen content in foods from different sources. Food Chem. (2009) 113:1184–7. doi: 10.1016/j.foodchem.2008.08.004
37. Khuri, AI, and Mukhopadhyay, S. Response surface methodology. Wiley Interdisciplin Rev Comput Stat. (2010) 2:128–49. doi: 10.1002/wics.73
38. Adki, KM, and Kulkarni, YA. Chemistry, pharmacokinetics, pharmacology and recent novel drug delivery systems of paeonol. Life Sci. (2020) 250:117544. doi: 10.1016/j.lfs.2020.117544
39. Tirado-Kulieva, VA, Sánchez-Chero, M, Yarlequé, MV, Aguilar, GFV, Carrión-Barco, G, and Santa Cruz, AGY. An overview on the use of response surface methodology to model and optimize extraction processes in the food industry. Curr Res Nutr Food Sci. (2021) 9:745–54. doi: 10.12944/CRNFSJ.9.3.03
40. Zhang, ZS, Li, D, Wang, LJ, Ozkan, N, Chen, XD, Mao, Z-H, et al. Optimization of ethanol–water extraction of lignans from flaxseed. Sep Purif Technol. (2007) 57:17–24. doi: 10.1016/j.seppur.2007.03.006
41. Zhao, LC, He, Y, Deng, X, Yang, GL, Li, W, Liang, J, et al. Response surface modeling and optimization of accelerated solvent extraction of four lignans from fructus schisandrae. Molecules. (2012) 17:3618–29. doi: 10.3390/molecules17043618
42. Wang, D, Zhang, L, Xu, Y, Qi, X, Wang, X, Wang, X, et al. Optimization of an ultrasound-assisted extraction for simultaneous determination of antioxidants in sesame with response surface methodology. Antioxidants. (2019) 8:321. doi: 10.3390/antiox8080321
43. Kim, Y, Pyeon, J, Baek, I, and Kim, Y. Development of simultaneous analytical method for five lignans in edible seeds. Korean J Food Nutr. (2022) 35:543–51. doi: 10.9799/ksfan.2022.35.6.543
44. Chen, Y, Lin, H, Lin, M, Zheng, Y, and Chen, J. Effect of roasting and in vitro digestion on phenolic profiles and antioxidant activity of water-soluble extracts from sesame. Food Chem Toxicol. (2020) 139:111239. doi: 10.1016/j.fct.2020.111239
45. Li, X, Yuan, JP, Xu, SP, Wang, JH, and Liu, X. Separation and determination of secoisolariciresinol diglucoside oligomers and their hydrolysates in the flaxseed extract by high-performance liquid chromatography. J Chromatogr A. (2008) 1185:223–32. doi: 10.1016/j.chroma.2008.01.066
46. Mekky, RH, Abdel-Sattar, E, Segura-Carretero, A, and Contreras, MDM. Phenolic compounds from sesame cake and antioxidant activity: a new insight for Agri-food residues’ significance for sustainable development. Food Secur. (2019) 8:432. doi: 10.3390/foods8100432
47. Durazzo, A, Raguzzini, A, Azzini, E, Foddai, M, Narducci, V, Maiani, G, et al. Bioactive molecules in cereal grains. Tec Molitoria. (2009) 60:130–41.
48. Durazzo, A, Zaccaria, M, Polito, A, Maiani, G, and Carcea, M. Lignan content in cereals, buckwheat and derived foods. Food Secur. (2013) 2:53–63. doi: 10.3390/foods2010053
49. Gerstenmeyer, E, Reimer, S, Berghofer, E, Schwartz, H, and Sontag, G. Effect of thermal heating on some lignans in flax seeds, sesame seeds and rye. Food Chem. (2013) 138:1847–55. doi: 10.1016/j.foodchem.2012.11.117
50. Akhila, H, and Beevy, SS. Quantification of seed oil and evaluation of antioxidant properties in the wild and cultivated species of Sesamum L. (Pedaliaceae). Int J Pharm Pharm Sci. (2015) 7:136–42.
51. Chen, Y, Lin, H, Lin, M, Lin, P, and Chen, J. Effects of thermal preparation and in vitro digestion on lignan profiles and antioxidant activity in defatted-sesame meal. Food Chem Toxicol. (2019) 128:89–96. doi: 10.1016/j.fct.2019.03.054
52. Grougnet, R, Magiatis, P, Laborie, H, Lazarou, D, Papadopoulos, A, and Skaltsounis, AL. Sesamolinol glucoside, disaminyl ether, and other lignans from sesame seeds. J Agric Food Chem. (2012) 60:108–11. doi: 10.1021/jf2040687
53. Renouard, S, Hano, C, Corbin, C, Fliniaux, O, Lopez, T, Montguillon, J, et al. Cellulase-assisted release of secoisolariciresinol from extracts of flax (Linum usitatissimum) hulls and whole seeds. Food Chem. (2010) 122:679–87. doi: 10.1016/j.foodchem.2010.03.036
54. Sharmila, G, Nikitha, V, Ilaiyarasi, S, Dhivya, K, Rajasekar, V, Kumar, NM, et al. Ultrasound assisted extraction of total phenolics from Cassia auriculata leaves and evaluation of its antioxidant activities. Ind Crop Prod. (2016) 84:13–21. doi: 10.1016/j.indcrop.2016.01.010
55. Wang, J, Sun, B, Cao, Y, Tian, Y, and Li, X. Optimisation of ultrasound-assisted extraction of phenolic compounds from wheat bran. Food Chem. (2008) 106:804–10. doi: 10.1016/j.foodchem.2007.06.062
56. Medina-Torres, N, Ayora-Talavera, T, Espinosa-Andrews, H, Sánchez-Contreras, A, and Pacheco, N. Ultrasound assisted extraction for the recovery of phenolic compounds from vegetable sources. Agronomy. (2017) 7:47. doi: 10.3390/agronomy7030047
57. Paniwnyk, L, Beaufoy, E, Lorimer, JP, and Mason, TJ. The extraction of rutin from flower buds of Sophora japonica. Ultrason Sonochem. (2001) 8:299–301. doi: 10.1016/s1350-4177(00)00075-4
58. Rostagno, MA, Palma, M, and Barroso, CG. Ultrasound-assisted extraction of soy isoflavones. J Chromatogr A. (2003) 1012:119–28. doi: 10.1016/s0021-9673(03)01184-1
59. Corbin, C, Fidel, T, Leclerc, EA, Barakzoy, E, Sagot, N, Falguieres, A, et al. Development and validation of an efficient ultrasound assisted extraction of phenolic compounds from flax (Linum usitatissimum L.) seeds. Ultrason Sonochem. (2015) 26:176–85. doi: 10.1016/j.ultsonch.2015.02.008
60. Majeed, M, Hussain, AI, Chatha, SA, Khosa, MK, Kamal, GM, Kamal, MA, et al. Optimization protocol for the extraction of antioxidant components from Origanum vulgare leaves using response surface methodology. Saudi J Biol Sci. (2016) 23:389–96. doi: 10.1016/j.sjbs.2015.04.010
61. Martínez-Ramos, T, Benedito-Fort, J, Watson, NJ, Ruiz-López, II, Che-Galicia, G, and Corona-Jiménez, E. Effect of solvent composition and its interaction with ultrasonic energy on the ultrasound-assisted extraction of phenolic compounds from mango peels (Mangifera indica L.). Food Bioprod Process. (2020) 122:41–54. doi: 10.1016/j.fbp.2020.03.011
62. Antony, A, and Farid, M. Effect of temperatures on polyphenols during extraction. Appl Sci. (2022) 12:2107. doi: 10.3390/app12042107
63. Liyanapathirana, C, and Shahidi, F. Optimization of extraction of phenolic compounds from wheat using response surface methodology. Food Chem. (2005) 93:47–56. doi: 10.1016/j.foodchem.2004.08.050
64. Fombang, EN, Nobossé, P, Mbofung, CM, and Singh, D. Optimising extraction of antioxidants from roasted Moringa oleifera lam. Leaves using response surface methodology. J Food Process Preserv. (2020) 44:e14482. doi: 10.1111/jfpp.14482
65. Bilgin, M, Elhussein, EAA, Ozyurek, M, Guclu, K, and Sahin, S. Optimizing the extraction of polyphenols from Sideritis montana L. using response surface methodology. J Pharm Biomed Anal. (2018) 158:137–43. doi: 10.1016/j.jpba.2018.05.039
66. Kwon, JH, Belanger, JM, and Pare, JR. Optimization of microwave-assisted extraction (MAP) for ginseng components by response surface methodology. J Agric Food Chem. (2003) 51:1807–10. doi: 10.1021/jf026068a
67. Vongsak, B, Sithisarn, P, Mangmool, S, Thongpraditchote, S, Wongkrajang, Y, and Gritsanapan, W. Maximizing total phenolics, total flavonoids contents and antioxidant activity of Moringa oleifera leaf extract by the appropriate extraction method. Ind Crop Prod. (2013) 44:566–71. doi: 10.1016/j.indcrop.2012.09.021
68. Dibba, D, Weaver, LT, and Hudson, GJ. Water content of cooked rice is related to variety and cooking method. Nutr Res. (1991) 1991:1397–402.
Keywords: lignans, LC-MS/MS, grains, RSM, optimal extraction
Citation: Kim Y, Kim HW, Sung J and Kim Y (2024) Optimal extraction conditions and quantification of lignan phytoestrogens in cereal grains using targeted LC-MS/MS. Front. Nutr. 11:1409309. doi: 10.3389/fnut.2024.1409309
Edited by:
Ki-Teak Lee, Chungnam National University, Republic of KoreaReviewed by:
Paola Montoro, University of Salerno, ItalyCopyright © 2024 Kim, Kim, Sung and Kim. This is an open-access article distributed under the terms of the Creative Commons Attribution License (CC BY). The use, distribution or reproduction in other forums is permitted, provided the original author(s) and the copyright owner(s) are credited and that the original publication in this journal is cited, in accordance with accepted academic practice. No use, distribution or reproduction is permitted which does not comply with these terms.
*Correspondence: Jeehye Sung, amVlaHllQGFudS5hYy5rcg==; Younghwa Kim, eW91bmdod2FraW1Aa3MuYWMua3I=
Disclaimer: All claims expressed in this article are solely those of the authors and do not necessarily represent those of their affiliated organizations, or those of the publisher, the editors and the reviewers. Any product that may be evaluated in this article or claim that may be made by its manufacturer is not guaranteed or endorsed by the publisher.
Research integrity at Frontiers
Learn more about the work of our research integrity team to safeguard the quality of each article we publish.