 Meaghan E. Kavanagh1,2
 Andrea J. Glenn1,2,3
 Laura Chiavaroli1,2,4
 Gloria A. Morgan2Robert G. Josse1,2,4,5,6
 Vasanti S. Malik1,3
 Christopher P. F. Marinangeli7
 Cyril W. C. Kendall1,2,8
 David J. A. Jenkins1,2,4,5,6
 John L. Sievenpiper1,2,4,5,6*
- 1Department of Nutritional Sciences, Temerty Faculty of Medicine, University of Toronto, Toronto, ON, Canada
- 2Toronto 3D Knowledge Synthesis and Clinical Trials Unit, Clinical Nutrition and Risk Factor Modification Center, St. Michael’s Hospital, Toronto, ON, Canada
- 3Department of Nutrition, Harvard T.H. Chan School of Public Health, Boston, MA, United States
- 4Li Ka Shing Knowledge Institute, St. Michael’s Hospital, Toronto, ON, Canada
- 5Division of Endocrinology and Metabolism, St. Michael’s Hospital, Toronto, ON, Canada
- 6Department of Medicine, Temerty Faculty of Medicine, University of Toronto, Toronto, ON, Canada
- 7Protein Industries Canada, Regina, SK, Canada
- 8College of Pharmacy and Nutrition, University of Saskatchewan, Saskatoon, SK, Canada
Introduction: The Portfolio Diet combines cholesterol-lowering plant foods for the management of cardiovascular disease risk. However, the translation of this dietary approach into clinical practice necessitates a user-friendly method for patients to autonomously monitor their adherence.
Objective: This study aimed to develop and validate the clinical-Portfolio Diet Score (c-PDS) as a food-based metric to facilitate self-tracking of the Portfolio Diet.
Methods: Using a simulation model to estimate the c-PDS, the validity was assessed in a secondary analysis of a completed trial of the Portfolio Diet in 98 participants with hyperlipidemia over 6 months. Concurrent and predictive validity of the estimated c-PDS were assessed against the reference measure (weighed 7-day diet records) and concomitant changes in LDL-C from baseline to 6 months. Bland–Altman analysis was used to assess the limits of agreement between the two methods.
Results: The c-PDS was positively correlated with dietary adherence as measured using the 7-day diet records (r = 0.94, p < 0.001). The c-PDS was negatively correlated with change in LDL-C (r = −0.43, p < 0.001) with a 1-point increase in the c-PDS being associated with a − 0.04 mmol/L (CI:−0.06,−0.03; p < 0.001) or a 1.09% reduction in LDL-C. Visual evaluation of the Bland–Altman plots showed reasonable agreement.
Conclusion: These findings indicate good validity of the c-PDS for primary prevention in adults with hyperlipidemia. The predictive validity findings have informed the goals and messaging within the PortfolioDiet.app, a digital health application for delivering the Portfolio Diet. Future research will assess the effectiveness of the intended combination of the c-PDS and the PortfolioDiet.app in supporting behavior change.
1 Introduction
Cardiovascular diseases (CVD) are the leading cause of death globally (1). Despite notable advancements in the medical field, CVD continues to escalate, underscoring the need for innovative primary and secondary prevention strategies. Dietary modification has been consistently established as front-line therapy for management of CVD risk factors such as dyslipidemia (2) and as a leading strategy for population prevention of CVD (3, 4). The Portfolio Diet is a nutrition therapy which has high quality evidence for lowering LDL-C in adults with hyperlipidemia (5, 6). Initially developed as a “portfolio” of foods with established cholesterol-lowering properties, the diet combines nuts and seeds, viscous fiber sources, plant protein sources (soy and dietary pulses), plant sterols, and plant-derived monounsaturated fatty acids (MUFA) sources. Despite the demonstrated efficacy of the Portfolio Diet on established cardiovascular parameters (7) and its recognition in clinical practice guidelines (8–12), the Portfolio Diet’s integration into clinical practice faces several barriers, a challenge commonly shared with other dietary approaches.
There are many aspects of a nutrition trial environment that are not easily replicated in clinical settings therefore tools are needed to translate nutrition interventions from trials to a “real-world” environment. Simple scoring methods can facilitate self-monitoring and be used to provide adherence-related feedback to participants (13). However, no scoring system or self-tracking tool is available for the Portfolio Diet. To help translate current clinical practice guidelines for dyslipidemia and enable the Portfolio Diet to be of use in clinical settings, a tested user-friendly score was needed. The objective of this research was to validate the clinical-Portfolio Diet Score (c-PDS) as a food-based metric to facilitate (self-) tracking of the Portfolio Diet by participants and clinicians. The score’s concurrent validity for measuring adherence to the Portfolio Diet was assessed against an established reference measure of 7-day diet records (7DDR) and the score’s predictive validity was assessed with a biomarker of adherence to the diet, LDL-C.
2 Methods
2.1 Study design
The validity of the c-PDS was assessed within a completed 6-month randomized controlled trial of the Portfolio Diet in primary prevention hyperlipidemic adults (ClinicalTrials.gov identifier, NCT00438425). The trial compared a low-saturated fat therapeutic diet (control) to the Portfolio Diet, where counseling was delivered at two different frequencies (routine or intense). The routine Portfolio Diet intervention involved 2 clinic visits, and the intense Portfolio Diet intervention involved 7 clinic visits over the six-month intervention. Further details on the trial have been described elsewhere (6). A total of 108 participants completed the trial at the Toronto site, which is considered an acceptable sample size for validation studies (14). Of the 108 participants that completed the study, 8 had missing diet records and 2 had missing blood lipid data. Supplementary Figure S1 presents the flow of participants for analysis with a total of 98 participants included.
2.2 Dietary assessment
Weighed 7-day diet records (7DDR) were collected at baseline and 6 months and analyzed by ESHA Food Processor SQL (version 10.1.1; ESHA, Salem, Oregon). The reference measure was calculated using participant’s percent adherence to their prescribed Portfolio Diet based on reported total energy intake (45-g/day of nuts, 50-g/day of protein from plants [soy, pulses], 20-g/day of viscous fiber, 2-g/day of plant sterols, and 45-g/day of MUFA) based on a 2000-kcal diet. This reference method was the original way adherence to the Portfolio Diet has been assessed since 2003 (5, 6, 15), with the only difference being the inclusion of 45-g/day of MUFA as a food category which was added to the Portfolio Diet in a subsequent trial (16).
2.3 Development of the clinical portfolio diet score (c-PDS)
2.3.1 Food-based scores
The Portfolio Diet targets were initially conceptualized as grams per day with adherence being measured using weighed 7DDRs. However, communication of nutrient targets to patients can be challenging; leading dietitians to provide food-based, instead of nutrient-based targets, when counselling patients (17). Beyond this point, weighed 7-day diet records are time consuming, and can be challenging to interpret requiring access to a detailed nutrient database and are unable to provide immediate feedback to participants if using grams per day as targets. These limitations are also true of other dietary assessment methods such as food frequency questionnaires (FFQ) or 24-h recalls. These concerns align with a Scientific Statement from the American Heart Association which called for more validated rapid diet screener tools to assess diet quality at point of care for management of CVD, with a specific focus on screeners for dietary patterns (18). To further emphasize this food-based counseling and align with current recommendations, a food-based screener was developed for use in the ongoing Portfolio Diet trial (ClinicalTrials.gov Identifier: NCT02481466). Supplementary Figure S2 provides the 2,000 kcal version of the original food-based screener. This initial version of the screener was completed by the participant, and then used by the study dietitians to provide rapid and personalized feedback. This initial screener counted traditional food servings in household measures of each Portfolio Diet food and did not provide an overall target. This screener was used as a starting point to inform the development of the c-PDS.
2.3.2 The c-PDS food categories
A total of 5 Portfolio Diet categories were chosen: Nuts and Seeds, Plant Protein, Viscous Fiber, Plant Sterols, and High MUFA Oils & Foods. Target amounts for 1-point of the c-PDS were food-based and provided in reasonable household measurements. For each category of the c-PDS a maximum of 5-points was set (total score ranged from 0 to 25-points).
2.3.3 Accounting for different energy needs
In previous trials, adherence to the Portfolio Diet was measured using total energy intake calculated from the weighed 7DDRs (6). As having patients track calories would complicate self-tracking, thus hindering the score’s usability, we instead used estimated energy requirement (EER) based-on the Institute of Medicine’s equations. The c-PDS targets were adjusted based on the EER. The EER accounts for four variables: sex, baseline weight, age, and physical activity level (sedentary, lightly active, moderately active, very active), and was based on the Institute of Medicine equations (19).
2.4 Estimating the c-PDS
To emulate participant input of dietary items, a simulation model was executed utilizing the weighed 7DDRs and participant-specific data. The c-PDS was derived by using the weighed 7DDRs while accounting for underlying assumptions of the model. Supplementary Figure S3 provides an illustration of the simulation model’s decision tree and the binary questions. The decision tree included sequences of 1 to 5 binary questions for each line of the 7DDRs. These are summarized in the list below.
1. Food item? From the 7DDRs, relevant food items were identified from non-food items. Recorded food intake from the 7DDRs was converted to household measurements (20) to reflect a diet checklist.
2. Portfolio Food? Then possible portfolio foods from non-portfolio foods were identified.
3. EER? Subsequently, using participant-specific data individual participants were allocated to respective calorie groups (1,200, 1,600, or 2000 kcal) based on their estimated EER, corresponding to adjustments of their respective c-PDS targets.
4. Category? Then the identified Portfolio Diet foods were classified into the five distinct categories: Nuts and Seeds, Plant Protein, Viscous Fiber, Plant Sterols, and High MUFA Oils and Foods.
5. Point value? Point value assigned based on household measure. Emulating user input, points values were rounded up to the nearest 0.5 with a maximum point value of 5 points per category per day, resulting in a total score ranging from 0 to 25-points.
Underlying assumptions included that the EER calculation provided a reasonable prediction of different energy needs (discussed in section 2.3.3 Accounting for different energy needs) and that the information included in the 7DDR is reflective of actual dietary intake.
This estimated c-PDS was then assessed for its concurrent and predictive validity as discussed below in the statistical analysis section.
2.5 LDL-C assessment
All fasting blood samples were analyzed in the routine hospital laboratory using Beckman SYNCHRON LX Systems (Mississauga, Ontario, Canada). LDL-C level was calculated using the Friedewald equation (21).
2.6 Statistical analysis
The control and two treatment arms were pooled together. Concurrent validity was assessed by Pearson correlation coefficient of the c-PDS (ranging from 0 to a total of 25-points), with the overall adherence to the Portfolio Diet (by percent) using weighed 7DDRs. Bland–Altman analysis was used to assess the limits of agreement between the two methods (22). Bland–Altman analysis is commonly used to verify the accuracy of a new dietary assessment measure against another established measure (23, 24). Absolute agreement is calculated by taking the mean of the differences for the two methods against the mean intake of the two methods. The 95% limits of agreement provide an interval within which 95% of these differences are expected to fall. Limits of agreement between 50 and 200% was considered reasonable (25). Bland–Altman plots were used to visualize the agreement between the two methods (26, 27).
For predictive validity, Pearson correlation coefficients were used to assess the correlation of change (from baseline to 6 month) in the c-PDS with change in LDL-C. Assumptions of normality were met for LDL-C, and the linear relationship between c-PDS and LDL-C was assessed with a scatterplot. Multiple linear regression was also used to assess the association of change in the c-PDS with concomitant changes in LDL-C after adjustment for pre-specified covariates: age (continuous), sex (male, female), ethnicity (Asian, Black, Caucasian, Hispanic, Other), body mass index (continuous), and baseline LDL-C (continuous). Effect size was calculated using β-coefficients to estimate the change in LDL-C level per 1-point and 12-point increases in the c-PDS. All statistical tests were two-tailed, and p < 0.05 was considered significant. Statistical analysis was performed using Stata version 17 (Stata Statistical Software: Release 17. College Station, TX, USA).
3 Results
3.1 The clinical portfolio diet score (c-PDS)
Supplementary Table S1 reports the c-PDS with the category targets in household measures for EER groups. The five categories of the Portfolio Diet each allow between 0 and 5 points based on pre-defined targets with points rounded to the nearest 0.5 resulting in a total range of 0 to 25 points (i.e., ½ cup chickpeas has ~10 grams protein = 1 point for plant protein for those with an EER of 2000 kcal). Supplementary Figure S4 provides an example of a c-PDS tracking sheet for a EER of 2000 kcal.
3.2 Participant characteristics
As shown in Supplementary Table S2, participants included were an average of 56 ± 9 years of age (mean ± standard deviation), predominantly female (60%), with the majority of participants identifying as White (65%) or Asian (18%). Prior to being randomized, 14% participants were on lipid-lowering medications. These medications were stopped 2 weeks before randomization. At baseline participants had a BMI of 27.1 ± 4.2 kg/m2, total cholesterol of 6.30 ± 0.93 mmol/L, triglycerides of 1.49 ± 0.90, HDL-C of 1.32 ± 0.34, LDL-C of 4.33 ± 0.80 mmol/L, non-HDL-C of 4.98 ± 0.89 mmol/L, and an Apolipoprotein B (ApoB) of 1.20 ± 0.19 g/L. For baseline diet participants had an average c-PDS of 3.11 ± 2.64 points.
3.3 Validation of the c-PDS
3.3.1 Concurrent validity
Table 1 shows the concurrent validity results with correlation coefficients for individual categories and total Portfolio Diet adherence. The c-PDS was positively correlated with adherence using the 7DDRs. Figure 1A presents a scatterplot illustrating average dietary adherence measured by the reference method, shown as percentage, and the c-PDS, shown as points. Overall, the c-PDS was positively correlated with the reference method from the 7DDRs (r = 0.95, p < 0.001). The Bland–Altman analysis demonstrated reasonable agreement with a mean difference in % dietary adherence between the c-PDS to the reference of −4.44 [95% confidence intervals (CI): −6.32, −2.55] and narrow limits of agreement (−23.10 to 14.22). Supplementary Table S3 shows results for each food category separately. Figure 1B presents the Bland–Altman plot and visually demonstrates reasonable agreement between the c-PDS and the reference method by dietary records. Clustering of datapoints closest to the origin of X-axis was attributed to the control group’s low adherence to the Portfolio Diet.
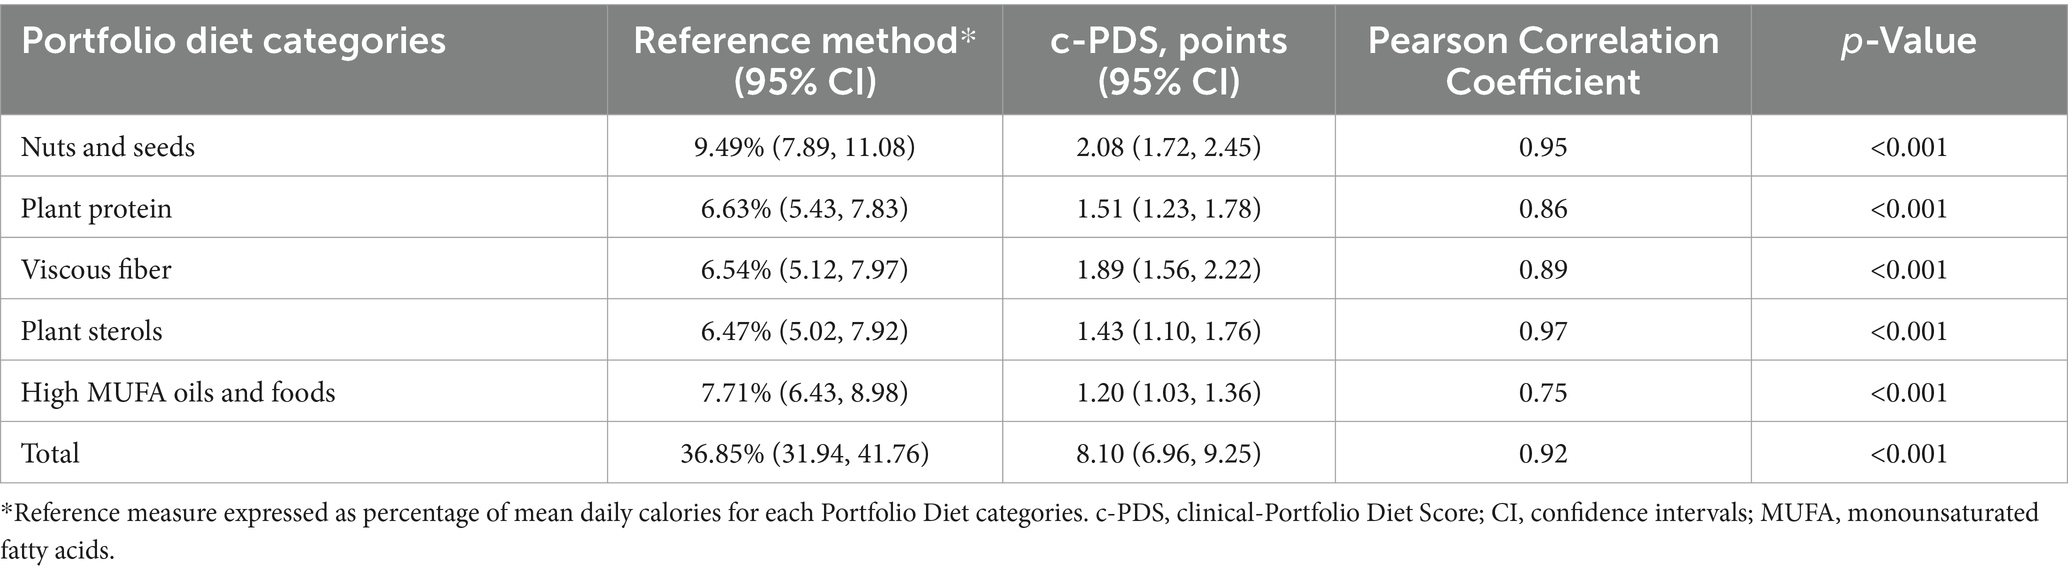
Table 1. Comparison of the mean intake of the Portfolio Diet measured by reference method and the clinical-Portfolio Diet Score (c-PDS) by category assessed at 6 months (n = 98).
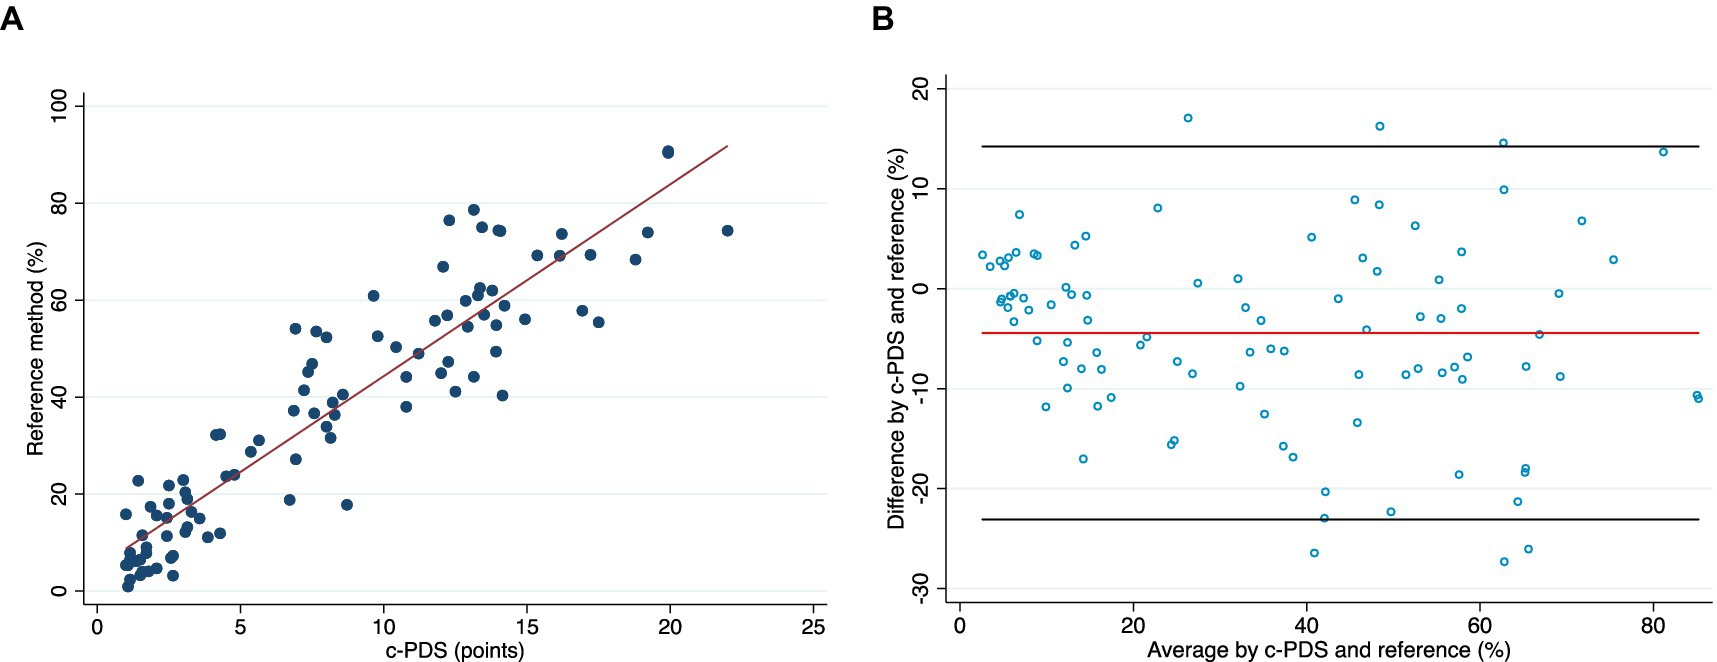
Figure 1. (A) A scatter plot of the correlation between the dietary adherence to Portfolio Diet at week 24 measured by the reference method, shown as percentage, and the clinical-Portfolio Diet Score (c-PDS), shown as points (range, 0 to 25-points). (B) Bland–Altman plot visually presents the agreement between the c-PDS and the reference method of % adherence to the Portfolio Diet assessed by weighed 7-day diet records (week 24). The x-axis is the mean of the two methods, and the y-axis is the difference between the two methods. The red line is the mean difference and black lines represent upper and lower 95% limits of agreement. The Bland–Altman plot demonstrates reasonable agreement between the c-PDS and the reference method by dietary records. Clustering of datapoints closest to the origin of X-axis was attributed to the control group’s low adherence to the Portfolio Diet. c-PDS, clinical-Portfolio Diet Score; LDL-C low-density lipoprotein cholesterol.
Supplementary Figures S4–S8 present side-by-side comparisons of scatter plots and Bland–Altman plots for each of the Portfolio Diet categories, with the corresponding correlation coefficients being found in Table 1. Agreement between the two methods was reasonable with category-specific Bland–Altman plots suggesting modest underestimation of reported intakes by the c-PDS for all categories except for the Viscous Fiber, where there was a modest overestimation by the c-PDS.
3.3.2 Predictive validity
Figure 2 presents a scatter plot of change in c-PDS and change in LDL-C (%) from baseline to 6 months. At 6 months the average LDL-C was 3.88 ± 0.65 mmol/L and c-PDS was 8.10 ± 5.7 points. The average change in the c-PDS from baseline to 6 months was 3.91 points [95% confidence intervals (CI): 2.74, 5.07] and the change in LDL-C was −0.45 mmol/L (CI: −0.55, −0.35) or − 8.75%.
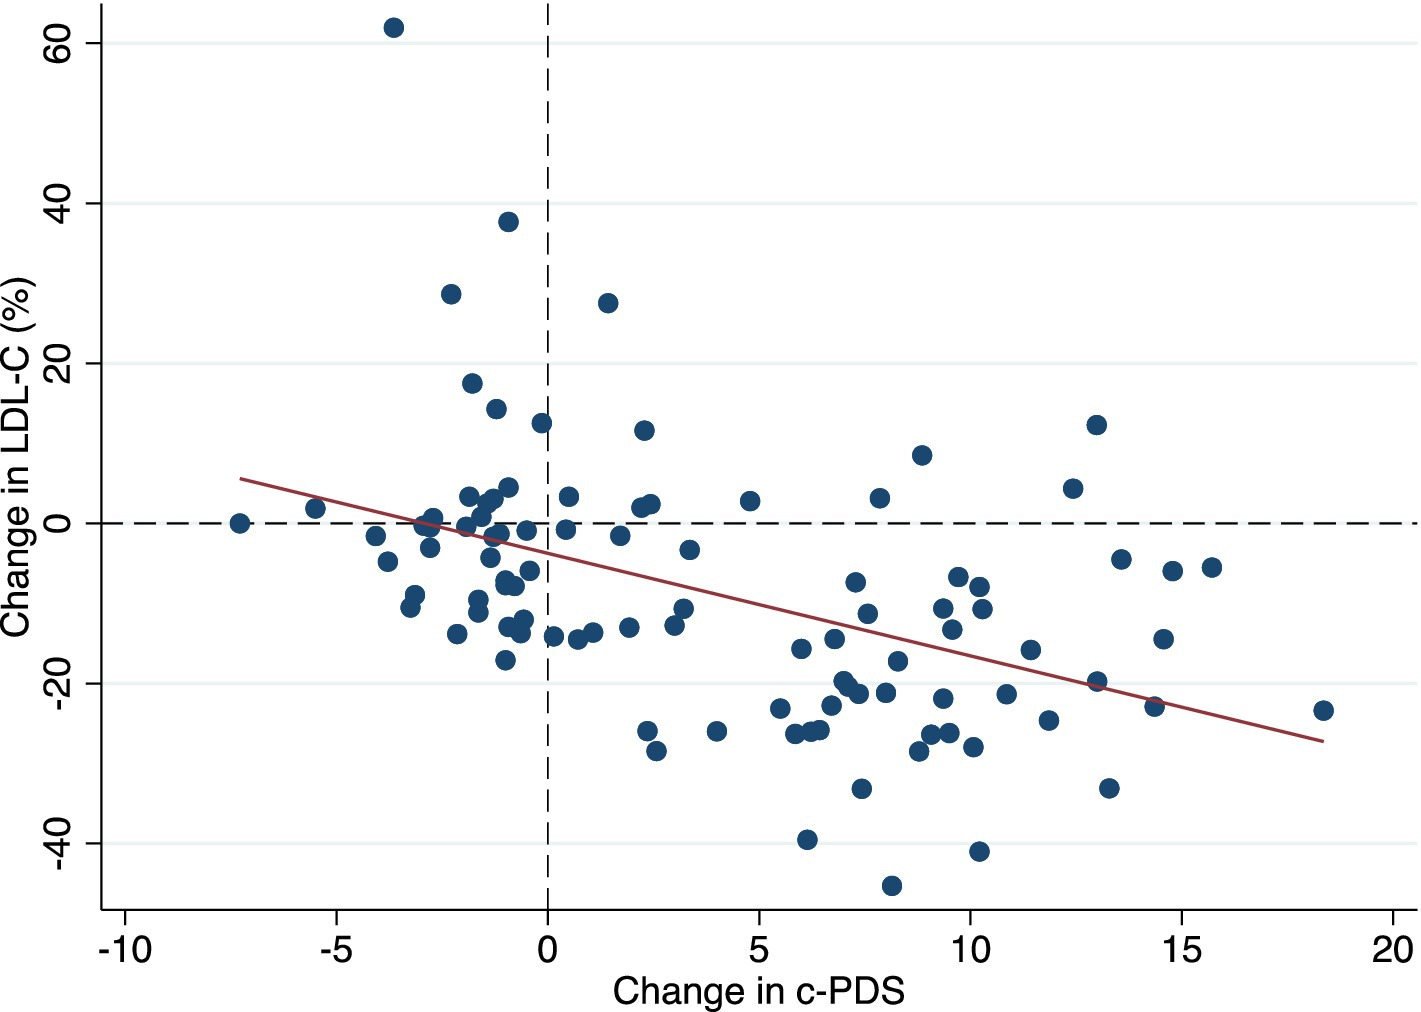
Figure 2. A scatter plot showing the predictive validity of the clinical-Portfolio Diet Score using % change of LDL-C over 6 months as a biomarker of adherence. c-PDS, clinical-Portfolio Diet Score; LDL-C low-density lipoprotein cholesterol.
Table 2 shows the linear regression for change in c-PDS and concomitant changes in LDL-C from baseline to 6 months. The c-PDS was inversely correlated with LDL-C (r = −0.43, p < 0.0001) with an apparent inverse association in the crude analysis (β coefficient: −0.06 mmol/L) (CI: −0.08, −0.03; p < 0.001) or a 1.28% reduction in LDL-C. In the multiple linear regression analysis, the association remained statistically significant and the c-PDS was inversely associated with concomitant change in LDL-C with a 1-point increase in score associated with a − 0.04 mmol/L (CI: −0.06, −0.03; p < 0.001) or a 1.09% reduction in LDL-C, after adjusting for covariates. Multiplying this estimate, a 12-point increase in the c-PDS corresponds to a reduction in LDL-C of 0.53 mmol/L (13.1%).
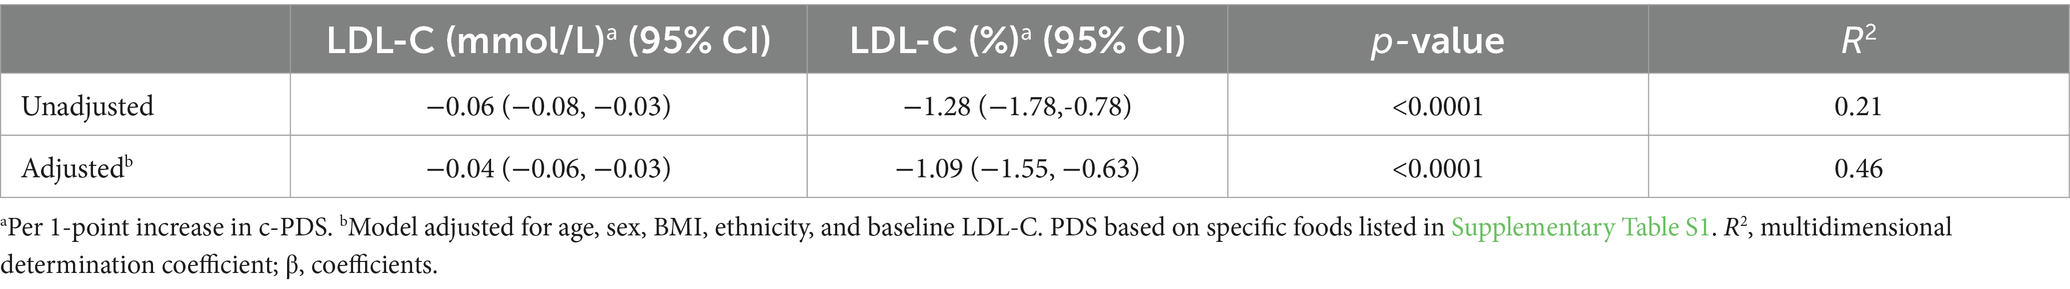
Table 2. Linear regression for the change in the clinical-Portfolio Diet Score (c-PDS) and concomitant change in LDL-C as a biomarker of adherence, over 6 months (n = 98).
Supplementary Table S4 shows the average change from baseline to 6 months by category and the association with change in LDL-C. Out of the five categories, Plant Protein presented the strongest inverse association, with a 1-point increase being associated with a − 0.15 mmol/L (CI: −0.28, −0.07; p < 0.001) or − 3.80% in LDL-C. There was no change in High MUFA Oils and Foods, and this category was not associated with change in LDL-C.
4 Discussion
Our secondary analysis of a completed trial in 98 primary prevention participants demonstrates that compared to reference method, the estimated c-PDS showed reasonable concurrent validity for measuring adherence to the Portfolio Diet. The mean agreement between the c-PDS and the reference method was reasonable with the limits of agreement falling within the acceptable boundaries (50–200%). As hypothesized, the change in c-PDS was negatively correlated with change in LDL-C from baseline to 6 months. A 1-point increase in the c-PDS was associated with an LDL-C reduction of 1.09% (0.04 mmol/L) after adjusting for covariates. These results overall indicate good validity of the c-PDS in adults with hyperlipidemia and allow us to estimate that a clinically meaningful reduction in LDL-C of 0.53 mmol/L (13.1%) may be observed with an achievable 12-point increase in the c-PDS.
4.1 Comparison with previous work
When looking at the current literature, existing tools for other dietary patterns beyond the Portfolio Diet have been developed and validated. Dietary scores and their respective short screeners have been developed and tested for rapid estimation of adherence in time-limited settings for dietary patterns such as the Mediterranean Diet (28), the Dietary Approach to Stop Hypertension (DASH) diet (29), Alternative Healthy Eating Index (AHEI) (30), and Dietary Guidelines, such as Canada’s Food Guide (31). These short screeners permit these dietary patterns to be easily assessed and used in many settings, leading to greater dissemination. As part of an dietary pattern intervention, a scoring method was used in the DASH Cloud intervention (13). In this trial a previously developed index (32) was used to facilitate self-monitoring and to communicate adherence-related feedback to participants through automated text-messages where adherence to the diet was found to increase during the trial.
Although redundancy was an important consideration when developing the c-PDS, a separate scoring system was needed for the Portfolio Diet as previously developed diet scores and rapid screeners do not capture many of the key cholesterol-lowering foods that make up the Portfolio Diet. Moreover, as tailoring to a patient’s dietary preferences is considered a key strategy for improving adherence (33, 34), having multiple evidence-based nutrition therapies to choose from is important for patients. To the best of our knowledge the c-PDS is the only score for clinical tracking of the Portfolio Diet. We used the original validated Portfolio Diet Score (PDS), developed by Glenn et al. (35) used in epidemiological settings to inform the development of the c-PDS in the current study. The original PDS is a population-based dietary score ranging from 6 to 30 points for measuring exposure to the Portfolio Diet in prospective cohort studies (35–38). While developing the patient-facing c-PDS, it was decided that the PDS’s sixth category of foods high in saturated fat and cholesterol (which is weighed negatively), would not be included in the score. The omission of the negative category was to ensure the c-PDS was easy for patients to use with concerns raised in consultation with study dietitians that reverse scoring would lead to confusion. Moreso, the positive focus on the five categories is consistent with previous messaging given to participants in the Portfolio Diet intervention trials. Another difference between the scores was the plant sterol category. To ensure the c-PDS was in keeping with advice given in an intervention trial (target of 2 grams/2000 kcal) only supplements or fortified foods were included in the c-PDS such as a fortified plant-sterol margarine and plant-sterol sachets.
4.2 Strengths and limitations
In our present study, we assessed the ability of the c-PDS to predict concomitant changes in LDL-C, which has been extensively studied and has been described as a causal for CVD (39). Moreover, LDL-C is the primary target of the Portfolio Diet. Another strength was the use of multiple linear regression analysis which allows for possible confounders to be accounted for and predictions about health outcomes to be made. By undertaking this analysis, we estimated that a reduction in LDL-C of 0.53 mmol/L (13.1%) may be observed with a 12-point increase in the c-PDS. Furthermore, our analysis was performed in the Portfolio Diet’s target population of adults with hyperlipidemia, strengthening our confidence in our estimated benefit. However, it is important to note that this was a secondary analysis, and therefore no direct assessment of benefit to participants can be made. Another limitation of the present study was the use of self-reported dietary records, which may not reflect true dietary intake. Measurement errors in self-reported dietary data can result in systematic bias such as intake-related bias where over-reporting of healthy foods and under-reporting of unhealthy foods may occur due to social pressures (40). This issue of self-reported data remains a major challenge in all nutrition research (41). A separate limitation of this study, when examining the five individual categories of the diet, the High MUFA Oils and Foods category was not associated with LDL-C or HDL-C. However, no change in this category was observed over the 6-month period, so no association with HDL-C could be established. Furthermore, the current study that the sample of participants was only from a single study and was made up of predominately White adults, limiting the generalizability of the findings to other populations. Future research in populations with different demographic characteristics from those in this study, including underrepresented populations, is needed (42).
4.3 Practical application of the c-PDS in clinical settings
While nutrition and lifestyle therapy are the major cornerstones of preventative therapy for cardiovascular disease (8–12) effectively providing nutrition therapy in clinical settings is challenging. As supporting material to the Portfolio Diet infographic, currently hosted on the Canadian Cardiovascular Society’s (CCS) website (43), the c-PDS can be used in clinical settings to facilitate self-tracking through the patient-facing score sheet (Supplementary Figure S4). Short screeners and scoring tools, easily used in various settings, can enhance dissemination (18). Additionally, self-tracking or monitoring is essential for effective interventions, as it is a cornerstone of behavior change techniques and is essential for producing sustained behavior change (44) such as dietary self-monitoring food intake for supporting weight loss (45).
Beyond screeners, tools for dietary self-tracking that allow for the combination of self-tracking with other behavior change techniques are essential for effective long-term interventions (44), empowering both patients and healthcare providers to embrace dietary interventions. This led us to mount the c-PDS within the PortfolioDiet.app, a freely available health application for delivering the Portfolio Diet in clinical settings (46). As a transformative digitally-enabled health services tool for the translation of current CCS guidelines (8), the PortfolioDiet.app was designed to help patients manage dyslipidemia and prevent CVD. The c-PDS is used in the PortfolioDiet.app to translate dietary adherence data into tailored feedback for patients, a critical addition to self-monitoring for behavioral interventions (47).
4.4 Implications and future directions
Because CVD remains the leading cause of mortality globally (1), there are significant implications of expanding access to the Portfolio Diet. As evidence continues to emphasize how critical the cumulative exposure over one’s lifetime to atherogenic particles is for CVD risk (39, 48, 49), the role for early long-term adoption of a healthy dietary pattern to improve risk is evident. This emphasis is supported by evidence from 3 prospective cohorts found higher adherence to the Portfolio Diet over 30 years was associated with a 14% lower risk of total CVD (50). While a number of evidence-based therapeutic dietary patterns have been developed for CVD, creative solutions to help support people to follow these dietary patterns are needed.
We hope this work serves as an example for other healthy dietary patterns and highlights the potential of user-friendly scores to help translate nutrition. The PortfolioDiet.app uses the c-PDS to provide the user with personalized feedback through the interactive dashboard displays, goal settings, Short Message Service (SMS) texts, and gamification components such as leaderboards. By undertaking this analysis on the c-PDS, we can predict that if patients achieve a 12-point increase in the c-PDS, they can anticipate a clinically meaningful reduction in their LDL-C. Supplementary Figure S9 provides an example of how the 12/25 points target has informed how we frame our messaging and feedback to patients within the PortfolioDiet.app, allowing for positive messaging with a goal of 12/25 points (~50% adherence). Importantly, a relatively similar level of adherence to the Portfolio Diet (~46%) was found in a multi-center trial, which significantly lower LDL-C by ~13% over 6 months (6).
While developing the PortfolioDiet.app, considerations to ensure the best integration of the c-PDS were made. Because the c-PDS uses the EER to allow for personalization of dietary goals, to reflect this characteristic in the PortfolioDiet.app, an EER question was built into the patient-facing side of the app. Using four patient-entered variables, the app automatically calculates EER and allocates users to their respective calorie group with corresponding c-PDS targets. Beyond this, the app allows tracking of the c-PDS as well as other health measures (LDL-C, fasting blood glucose, and blood pressure). By providing patients with a tool to track their behaviors and health outcomes, this tool allows them to draw a relationship between the two, improving self-efficacy. Findings from a quality improvement and usability study found the PortfolioDiet.app was considered acceptable by users and that the c-PDS used in the app did not cause confusion (46). Based on these previous findings and the current study’s findings, we anticipate the c-PDS as part of the PortfolioDiet.app aid in the dissemination of the Portfolio Diet. Future research in a randomized controlled trial will assess if the c-PDS, as part of the PortfolioDiet.app, is effective in promoting behavior change and subsequent health-related outcomes, such as lipid targets.
5 Conclusion
By facilitating (self-) tracking of the Portfolio Diet by participants and clinicians, we anticipate that the c-PDS will aid in the uptake of the Portfolio Diet under the wide range of circumstances that constitute clinical practice. Undertaking this analysis on the c-PDS, allowed us to predict that if patients achieve a 12-point increase in the c-PDS, they can anticipate a clinically meaningful reduction in LDL-C of 0.53 mmol/L (13.1%). This 12/25 points target has been incorporated into the messaging and goals to patients within the PortfolioDiet.app, a clinical health application for delivering the Portfolio Diet. Future research will assess if the c-PDS when used as part of the PortfolioDiet.app in a randomized controlled trial is effective in promoting behaviour change and subsequent health-related outcomes, such as desired lipid targets in clinical practice.
Data availability statement
The data analyzed in this study is subject to the following licenses/restrictions: Publicly available data are contained within the article. Requests to access these datasets should be directed to Sm9obi5zaWV2ZW5waXBlckB1dG9yb250by5jYQ==.
Ethics statement
The studies involving humans were approved by Research Ethics Committee of St. Michael’s Hospital (REB#04–056). The studies were conducted in accordance with the local legislation and institutional requirements. The participants provided their written informed consent to participate in this study.
Author contributions
MK: Conceptualization, Formal analysis, Investigation, Methodology, Writing – original draft, Writing – review & editing. AG: Conceptualization, Formal Analysis, Methodology, Writing – original draft, Writing – review & editing. LC: Conceptualization, Methodology, Writing – original draft, Writing – review & editing. GM: Writing – original draft, Writing – review & editing. RJ: Conceptualization, Methodology, Writing – original draft, Writing – review & editing. VM: Conceptualization, Methodology, Writing – original draft, Writing – review & editing. CM: Methodology, Writing – original draft, Writing – review & editing. CK: Data curation, Methodology, Writing – original draft, Writing – review & editing. DJ: Conceptualization, Data curation, Methodology, Writing – original draft, Writing – review & editing. JS: Conceptualization, Funding acquisition, Methodology, Supervision, Writing – original draft, Writing – review & editing.
Funding
The author(s) declare that financial support was received for the research, authorship, and/or publication of this article. This research was funded by the Canadian Institutes of Health Research (CIHR) Doctoral Research Award: FRN: 181403. The Diet, Digestive tract, and Disease (3D) Centre, funded through the Canada Foundation for Innovation and the Ministry of Research and Innovation’s Ontario Research Fund, provided the infrastructure for the conduct of this work. MK was supported by the Canadian Institutes of Health Research (CIHR) Doctoral Research Award: FRN: 181403 and a Toronto 3D Knowledge Synthesis and Clinical Trials foundation PhD Scholarship Award. AG was supported by a Canadian Institute of Health Research Fellowship. LC was funded by a Toronto 3D New Investigator Award. DJ was funded by the Government of Canada through the Canada Research Chair Endowment. JS was funded by a PSI Graham Farquharson Knowledge Translation Fellowship; Canadian Diabetes Association Clinician Scientist Award; Canadian Institute of Health Research INMD and CNS New Investigator Partnership Prize; and Banting & Best Diabetes Centre Sun Life Financial New Investigator Award.
Acknowledgments
Components of this work were presented at the Canadian Nutrition Society (CNS) Annual Conference, 2021 and the presentation abstract was published in App Physiol Nutr Metab. 46:S20. [doi: 10.1139/apnm-2021-0172].
Conflict of interest
MK has received from a Toronto 3D PhD Scholarship award and was a part-time employee at INQUIS Clinical Research, Ltd., a contract research organization. AG has received travel support and/or honoraria from Vinasoy, the British Nutrition Society and the Academy of Nutrition and Dietetics. CM is currently employed by Protein Industries Canada and a former employee of Kellogg Canada and Pulse Canada. LC has received research support from the Canadian Institutes of health Research (CIHR), Protein Industries Canada (a Government of Canada Global Innovation Clusters), The United Soybean Board (USDA soy “Checkoff” program), and the Alberta Pulse Growers Association. VM has received funding from the Canadian Institutes of Health Research (CIHR); National Institutes of Health (NIDDK); Novo Nordisk Network for Healthy Populations; Canada Research Chairs Program; Connaught New Researcher Award, University of Toronto; The Joannah & Brian Lawson Centre for Child Nutrition, University of Toronto; Temerty Faculty of Medicine Pathway Grant, University of Toronto; Canada Foundation for Innovation; Ontario Research Fund. Dr. Malik is a Scientific Advisory Committee member for the Healthy Eating Research, Robert Wood Johnson Consensus Statement of beverages for children and an Advisory Board Member of the Canadian Institutes of Health research, Institute of Nutrition, Metabolism and Diabetes, and has served as a consultant for the City and County of San Francisco for litigation related to health warning labels on sugar sweetened beverages. CK has received grants or research support from the Advanced Food Materials Network, Agriculture and Agri-Foods Canada (AAFC), Almond Board of California, Barilla, Canadian Institutes of Health Research (CIHR), Canola Council of Canada, International Nut and Dried Fruit Council, International Tree Nut Council Research and Education Foundation, Loblaw Brands Ltd, the Peanut Institute, Pulse Canada and Unilever. He has received in-kind research support from the Almond Board of California, Barilla, California Walnut Commission, Kellogg Canada, Loblaw Companies, Nutrartis, Quaker (PepsiCo), the Peanut Institute, Primo, Unico, Unilever, WhiteWave Foods/Danone. He has received travel support and/or honoraria from the Barilla, California Walnut Commission, Canola Council of Canada, General Mills, International Nut and Dried Fruit Council, International Pasta Organization, Lantmannen, Loblaw Brands Ltd, Nutrition Foundation of Italy, Oldways Preservation Trust, Paramount Farms, the Peanut Institute, Pulse Canada, Sun-Maid, Tate & Lyle, Unilever and White Wave Foods/Danone. He has served on the scientific advisory board for the International Tree Nut Council, International Pasta Organization, McCormick Science Institute and Oldways Preservation Trust. He is a founding member of the International Carbohydrate Quality Consortium (ICQC), Chair of the Diabetes and Nutrition Study Group (DNSG) of the European Association for the Study of Diabetes (EASD), is on the Clinical Practice Guidelines Expert Committee for Nutrition Therapy of the EASD and is a Director of Glycemia Consulting and the Toronto 3D Knowledge Synthesis and Clinical Trials foundation. DJ has received research grants from Loblaw Companies Ltd., the Almond Board of California, Soy Nutrition Institute (SNI), and the Canadian Institutes of Health Research (CIHR). He has received in-kind supplies for trials as a research support from the Almond board of California, Walnut Council of California, American Peanut Council, Barilla, Unilever, Unico, Primo, Loblaw Companies, Quaker (Pepsico), Pristine Gourmet, Bunge Limited, Kellogg Canada, WhiteWave Foods. He has been on the speaker’s panel, served on the scientific advisory board and/or received travel support and/or honoraria from Lawson Centre Nutrition Digital Series, Nutritional Fundamentals for Health (NFH)-Nutramedica, Saint Barnabas Medical Center, The University of Chicago, 2020 China Glycemic Index (GI) International Conference, Atlantic Pain Conference, Academy of Life Long Learning, the Almond Board of California, Canadian Agriculture Policy Institute, the Loblaw Companies Ltd, the Griffin Hospital (for the development of the NuVal scoring system), the Coca-Cola Company, Epicure, Danone, Diet Quality Photo Navigation (DQPN), Better Therapeutics (FareWell), Verywell, True Health Initiative (THI), Heali AI Corp, Institute of Food Technologists (IFT), Soy Nutrition Institute (SNI), Herbalife Nutrition Institute (HNI), Herbalife International, Pacific Health Laboratories, Nutritional Fundamentals for Health (NFH), the Soy Foods Association of North America, the Nutrition Foundation of Italy (NFI), the Toronto Knowledge Translation Group (St. Michael’s Hospital), the Canadian College of Naturopathic Medicine, The Hospital for Sick Children, the Canadian Nutrition Society (CNS), and the American Society of Nutrition (ASN). He is a member of the International Carbohydrate Quality Consortium (ICQC). His wife, Alexandra L. Jenkins, is senior scientist of INQUIS Clinical Research Inc. (Clinical Research Organization), his 2 daughters, Wendy Jenkins and Amy Jenkins, have published a vegetarian book that promotes the use of the low glycemic index plant foods advocated here, The Portfolio Diet for Cardiovascular Risk Reduction (Academic Press/Elsevier 2020 ISBN:978-0-12-810510-8) and his sister, Caroline Brydson, received funding through a grant from the St. Michael’s Hospital Foundation to develop a cookbook for one of his studies. JS has received research support from the Canadian Foundation for Innovation, Ontario Research Fund, Province of Ontario Ministry of Research and Innovation and Science, Canadian Institutes of health Research (CIHR), Diabetes Canada, American Society for Nutrition (ASN), National Honey Board (U.S. Department of Agriculture [USDA] honey “Checkoff” program), Institute for the Advancement of Food and Nutrition Sciences (IAFNS), Pulse Canada, Quaker Oats Center of Excellence, INC International Nut and Dried Fruit Council Foundation, The United Soybean Board (USDA soy “Checkoff” program), Protein Industries Canada (a Government of Canada Global Innovation Cluster), Almond Board of California, European Fruit Juice Association, The Tate and Lyle Nutritional Research Fund at the University of Toronto, The Glycemic Control and Cardiovascular Disease in Type 2 Diabetes Fund at the University of Toronto (a fund established by the Alberta Pulse Growers), The Plant Protein Fund at the University of Toronto (a fund which has received contributions from IFF among other donors), The Plant Milk Fund at the University of Toronto (a fund established by the Karuna Foundation through Vegan Grants), and The Nutrition Trialists Network Fund at the University of Toronto (a fund established by donations from the Calorie Control Council and Physicians Committee for Responsible Medicine). He has received food donations to support randomized controlled trials from the Almond Board of California, California Walnut Commission, Danone, Nutrartis, Soylent, and Dairy Farmers of Canada. He has received travel support, speaker fees and/or honoraria from Danone, FoodMinds LLC, Nestlé, Abbott, General Mills, Nutrition Communications, International Food Information Council (IFIC), Arab Beverages, International Sweeteners Association, Association Calorie Control Council, and Phynova. He has or has had ad hoc consulting arrangements with Perkins Coie LLP, Tate & Lyle, Ingredion, and Brightseed. He is on the Clinical Practice Guidelines Expert Committees of Diabetes Canada, European Association for the study of Diabetes (EASD), Canadian Cardiovascular Society (CCS), and Obesity Canada/Canadian Association of Bariatric Physicians and Surgeons. He serves as an unpaid member of the Board of Trustees of IAFNS. He is a Director at Large of the Canadian Nutrition Society (CNS), founding member of the International Carbohydrate Quality Consortium (ICQC), Executive Board Member of the Diabetes and Nutrition Study Group (DNSG) of the EASD, and Director of the Toronto 3D Knowledge Synthesis and Clinical Trials foundation. His spouse is an employee of AB InBev.
The remaining authors declare that the research was conducted in the absence of any commercial or financial relationships that could be construed as a potential conflict of interest.
Publisher’s note
All claims expressed in this article are solely those of the authors and do not necessarily represent those of their affiliated organizations, or those of the publisher, the editors and the reviewers. Any product that may be evaluated in this article, or claim that may be made by its manufacturer, is not guaranteed or endorsed by the publisher.
Supplementary material
The Supplementary material for this article can be found online at: https://www.frontiersin.org/articles/10.3389/fnut.2024.1398450/full#supplementary-material
References
1. Roth, GA, Mensah, GA, Johnson, CO, Addolorato, G, Ammirati, E, Baddour, LM, et al. Global burden of cardiovascular diseases and risk factors, 1990-2019: update from the GBD 2019 study. J Am Coll Cardiol. (2020) 76:2982–3021. doi: 10.1016/j.jacc.2020.11.010
2. Virani, SS, Morris, PB, Agarwala, A, Ballantyne, CM, Birtcher, KK, Kris-Etherton, PM, et al. 2021 ACC expert consensus decision pathway on the management of ASCVD risk reduction in patients with persistent hypertriglyceridemia: a report of the American College of Cardiology Solution set Oversight Committee. J Am Coll Cardiol. (2021) 78:960–93. doi: 10.1016/j.jacc.2021.06.011
3. Mozaffarian, D. Dietary and policy priorities for cardiovascular disease, diabetes, and obesity: a comprehensive review. Circulation. (2016) 133:187–225. doi: 10.1161/CIRCULATIONAHA.115.018585
4. Yu, E, Malik, VS, and Hu, FB. Cardiovascular disease prevention by diet modification: JACC health promotion series. J Am Coll Cardiol. (2018) 72:914–26. doi: 10.1016/j.jacc.2018.02.085
5. Jenkins, DJ, Kendall, CW, Marchie, A, Faulkner, DA, Wong, JM, de Souza, R, et al. Effects of a dietary portfolio of cholesterol-lowering foods vs lovastatin on serum lipids and C-reactive protein. J Am Coll Cardiol. (2003) 290:502–10. doi: 10.1001/jama.290.4.502
6. Jenkins, DJ, Jones, PJ, Lamarche, B, Kendall, CW, Faulkner, D, Cermakova, L, et al. Effect of a dietary portfolio of cholesterol-lowering foods given at 2 levels of intensity of dietary advice on serum lipids in hyperlipidemia: a randomized controlled trial. JAMA. (2011) 306:831–9. doi: 10.1001/jama.2011.1202
7. Chiavaroli, L, Nishi, SK, Khan, TA, Braunstein, CR, Glenn, AJ, Mejia, SB, et al. Portfolio dietary pattern and cardiovascular disease: a systematic review and Meta-analysis of controlled trials. Prog Cardiovasc Dis. (2018) 61:43–53. doi: 10.1016/j.pcad.2018.05.004
8. Pearson, GJ, Thanassoulis, G, Anderson, TJ, Barry, AR, Couture, P, Dayan, N, et al. 2021 Canadian cardiovascular society guidelines for the Management of Dyslipidemia for the prevention of cardiovascular disease in adults. Can J Cardiol. (2021) 37:1129–50. doi: 10.1016/j.cjca.2021.03.016
9. Anderson, TJ, Grégoire, J, Pearson, GJ, Barry, AR, Couture, P, Dawes, M, et al. 2016 Canadian cardiovascular society guidelines for the Management of Dyslipidemia for the prevention of cardiovascular disease in the adult. Can J Cardiol. (2016) 32:1263–82. doi: 10.1016/j.cjca.2016.07.510
10. Diabetes Canada Clinical Practice Guidelines Expert C Punthakee, Z, Goldenberg, R, and Katz, P. Definition, classification and diagnosis of diabetes, prediabetes and metabolic syndrome. Can. J Diabetes. (2018) 42:S10–5. doi: 10.1016/j.jcjd.2017.10.003
11. Stroes, ES, Thompson, PD, Corsini, A, Vladutiu, GD, Raal, FJ, Ray, KK, et al. Statin-associated muscle symptoms: impact on statin therapy-European atherosclerosis society consensus panel statement on assessment. Aetiol Manag Eur Heart J. (2015) 36:1012–22. doi: 10.1093/eurheartj/ehv043
12. Grundy, SM, Stone, NJ, Bailey, AL, Beam, C, Birtcher, KK, Blumenthal, RS, et al. 2018 AHA/ACC/AACVPR/AAPA/ABC/ACPM/ADA/AGS/APhA/ASPC/NLA/PCNA guideline on the Management of Blood Cholesterol: executive summary: a report of the American College of Cardiology/American Heart Association task force on clinical practice guidelines. J Am Coll Cardiol. (2019) 73:3168–209. doi: 10.1016/j.jacc.2018.11.002
13. Steinberg, DM, Kay, MC, Svetkey, LP, Askew, S, Christy, J, Burroughs, J, et al. Feasibility of a digital health intervention to improve diet quality among women with high blood pressure: randomized controlled feasibility trial. JMIR Mhealth Uhealth. (2020) 8:e17536. doi: 10.2196/17536
15. Jenkins, DJ, Kendall, CW, Faulkner, DA, Nguyen, T, Kemp, T, Marchie, A, et al. Assessment of the longer-term effects of a dietary portfolio of cholesterol-lowering foods in hypercholesterolemia. Am J Clin Nutr. (2006) 83:582–91. doi: 10.1093/ajcn.83.3.582
16. Jenkins, DJ, Chiavaroli, L, Wong, JM, Kendall, C, Lewis, GF, Vidgen, E, et al. Adding monounsaturated fatty acids to a dietary portfolio of cholesterol-lowering foods in hypercholesterolemia. CMAJ. (2010) 182:1961–7. doi: 10.1503/cmaj.092128
17. Sievenpiper, JL, and Dworatzek, PD. Food and dietary pattern-based recommendations: an emerging approach to clinical practice guidelines for nutrition therapy in diabetes. Can J Diabetes. (2013) 37:51–7. doi: 10.1016/j.jcjd.2012.11.001
18. Vadiveloo, M, Lichtenstein, AH, Anderson, C, Aspry, K, Foraker, R, Griggs, S, et al. Rapid diet assessment screening tools for cardiovascular disease risk reduction across healthcare settings: a scientific statement from the American Heart Association. Circ Cardiovasc Qual Outcomes. (2020) 13:e000094. doi: 10.1161/HCQ.0000000000000094
19. Trumbo, P, Schlicker, S, Yates, AA, and Poos, M. Dietary reference intakes for energy, carbohydrate, fiber, fat, fatty acids, cholesterol, protein and amino acids. J Am Diet Assoc. (2002) 102:1621–30. doi: 10.1016/S0002-8223(02)90346-9
20. Canadian Nutrient File (CNF), (2015). Government of Canada. Available at: https://www.canada.ca/en/health-canada/services/food-nutrition/healthy-eating/nutrient-data/canadian-nutrient-file-2015-download-files.html (Accessed March 3, 2020)
21. Friedewald, WT, Levy, RI, and Fredrickson, DS. Estimation of the concentration of low-density lipoprotein cholesterol in plasma, without use of the preparative ultracentrifuge. Clin Chem. (1972) 18:499–502. doi: 10.1093/clinchem/18.6.499
22. Altman, DG, and Bland, JM. Measurement in medicine: the analysis of method comparison studies. J. Royal Statistic. Soc. Series D. (1983) 32:307–17.
23. Sierra-Ruelas, É, Bernal-Orozco, MF, Macedo-Ojeda, G, Márquez-Sandoval, YF, Altamirano-Martínez, MB, and Vizmanos, B. Validation of semiquantitative FFQ administered to adults: a systematic review. Public Health Nutr. (2021) 24:3399–418. doi: 10.1017/S1368980020001834
24. Benítez-Arciniega, AA, Mendez, MA, Baena-Díez, JM, Rovira Martori, M-A, Soler, C, Marrugat, J, et al. Concurrent and construct validity of Mediterranean diet scores as assessed by an FFQ. Public Health Nutr. (2011) 14:2015–21. doi: 10.1017/S1368980011001212
25. Ambrosini, GL, van Roosbroeck, SA, Mackerras, D, Fritschi, L, de Klerk, NH, and Musk, AW. The reliability of ten-year dietary recall: implications for cancer research. J Nutr. (2003) 133:2663–8. doi: 10.1093/jn/133.8.2663
26. Bland, JM, and Altman, DG. Statistical methods for assessing agreement between two methods of clinical measurement. Lancet. (1986) 1:307–10.
27. Bland, JM, and Altman, DG. Measuring agreement in method comparison studies. Stat Methods Med Res. (1999) 8:135–60. doi: 10.1177/096228029900800204
28. Martínez-González, MA, García-Arellano, A, Toledo, E, Salas-Salvadó, J, Buil-Cosiales, P, Corella, D, et al. A 14-item Mediterranean diet assessment tool and obesity indexes among high-risk subjects: the PREDIMED trial. PLoS One. (2012) 7:e43134. doi: 10.1371/journal.pone.0043134
29. Apovian, CM, Murphy, MC, Cullum-Dugan, D, Lin, PH, Gilbert, KM, Coffman, G, et al. Validation of a web-based dietary questionnaire designed for the DASH (dietary approaches to stop hypertension) diet: the DASH online questionnaire. Public Health Nutr. (2010) 13:615–22. doi: 10.1017/S1368980009991996
30. Lafrenière, J, Harrison, S, Laurin, D, Brisson, C, Talbot, D, Couture, P, et al. Development and validation of a brief diet quality assessment tool in the French-speaking adults from Quebec. Int J Behav Nutr Phys Act. (2019) 16:61. doi: 10.1186/s12966-019-0821-6
31. Hutchinson, JM, Dodd, KW, Guenther, PM, Lamarche, B, Haines, J, Wallace, A, et al. The Canadian food intake screener for assessing alignment of adults’ dietary intake with the 2019 Canada’s food guide healthy food choices recommendations: scoring system and construct validity. Appl Physiol Nutr Metab. (2023)
32. Mellen, PB, Gao, SK, Vitolins, MZ, and Goff, DC Jr. Deteriorating dietary habits among adults with hypertension: DASH dietary accordance, NHANES 1988-1994 and 1999-2004. Arch Intern Med. (2008) 168:308–14. doi: 10.1001/archinternmed.2007.119
33. Sievenpiper, JL, Chan, CB, Dworatzek, PD, Freeze, C, and Williams, SL. Nutrition therapy. Can J Diabetes. (2018) 42:S64–s79. doi: 10.1016/j.jcjd.2017.10.009
34. Brown, J, Clarke, C, Johnson Stoklossa, C, and Sievenpiper, J. Canadian adult obesity clinical practice guidelines: Medical nutrition therapy in obesity management. (2022). Available at: https://obesitycanada.ca/guidelines/nutrition/ (Accessed July 19, 2024)
35. Glenn, AJ, Boucher, BA, Kavcic, CC, Khan, TA, Paquette, M, Kendall, CWC, et al. Development of a portfolio diet score and its concurrent and predictive validity assessed by a food frequency questionnaire. Nutrients. (2021) 13:2850. doi: 10.3390/nu13082850
36. Glenn, AJ, Lo, K, Jenkins, DJA, Boucher, BA, Hanley, AJ, Kendall, CWC, et al. Relationship between a plant-based dietary portfolio and risk of cardiovascular disease: findings from the Women’s Health Initiative prospective cohort study. J Am Heart Assoc. (2021) 10:e021515. doi: 10.1161/JAHA.121.021515
37. Glenn, AJ, Li, J, Lo, K, Jenkins, DJA, Boucher, BA, Hanley, AJ, et al. The portfolio diet and incident type 2 diabetes: findings from the Women’s Health Initiative prospective cohort study. Diabetes Care. (2023) 46:28–37. doi: 10.2337/dc22-1029
38. Glenn, AJ, Hernández-Alonso, P, Kendall, CWC, Martínez-González, M, Corella, D, Fitó, M, et al. Longitudinal changes in adherence to the portfolio and DASH dietary patterns and cardiometabolic risk factors in the PREDIMED-plus study. Clin Nutr. (2021) 40:2825–36. doi: 10.1016/j.clnu.2021.03.016
39. Ference, BA, Ginsberg, HN, Graham, I, Ray, KK, Packard, CJ, Bruckert, E, et al. Low-density lipoproteins cause atherosclerotic cardiovascular disease. 1. Evidence from genetic, epidemiologic, and clinical studies. A consensus statement from the European atherosclerosis society consensus panel. Eur Heart J. (2017) 38:2459–72. doi: 10.1093/eurheartj/ehx144
40. Kipnis, V, Subar, AF, Midthune, D, Freedman, LS, Ballard-Barbash, R, Troiano, RP, et al. Structure of dietary measurement error: results of the OPEN biomarker study. Am J Epidemiol. (2003) 158:14–21. doi: 10.1093/aje/kwg091
41. Ravelli, MN, and Schoeller, DA. Traditional self-reported dietary instruments are prone to inaccuracies and new approaches are needed. Front Nutr. (2020) 7:90. doi: 10.3389/fnut.2020.00090
42. Vadiveloo, MK, Thorndike, AN, and Lichtenstein, AH. Integrating diet screening into routine clinical care: the time is now. J Am Heart Assoc. (2023) 12:e028583. doi: 10.1161/JAHA.122.028583
43. Jenkins, DJA, Kendall, CWC, Chiavaroli, L, Kavanagh, ME, Glenn, AJ, Burris, L, et al. (2023). Infographic: The portfolio diet: An evidence-based eating plan for lower cholesterol. Available at: https://ccs.ca/companion-resources/ (Accessed March 3, 2024)
44. Michie, S, Ashford, S, Sniehotta, FF, Dombrowski, SU, Bishop, A, and French, DP. A refined taxonomy of behaviour change techniques to help people change their physical activity and healthy eating behaviours: the CALO-RE taxonomy. Psychol Health. (2011) 26:1479–98. doi: 10.1080/08870446.2010.540664
45. Raber, M, Liao, Y, Rara, A, Schembre, SM, Krause, KJ, Strong, L, et al. A systematic review of the use of dietary self-monitoring in behavioural weight loss interventions: delivery, intensity and effectiveness. Public Health Nutr. (2021) 24:5885–913. doi: 10.1017/S136898002100358X
46. Kavanagh, ME, Chiavaroli, L, Glenn, AJ, Heijmans, G, Grant, SM, Chow, C-M, et al. A web-based health application to translate nutrition therapy for cardiovascular risk reduction in primary care (PortfolioDiet.App): quality improvement and usability testing study. JMIR Hum Factors. (2022) 9:e34704. doi: 10.2196/34704
47. Krukowski, RA, Denton, AH, and König, LM. Impact of feedback generation and presentation on self-monitoring behaviors, dietary intake, physical activity, and weight: a systematic review and meta-analysis. Int J Behav Nutr Phys Act. (2024) 21:3. doi: 10.1186/s12966-023-01555-6
48. Makover, ME, Shapiro, MD, and Toth, PP. There is urgent need to treat atherosclerotic cardiovascular disease risk earlier, more intensively, and with greater precision: a review of current practice and recommendations for improved effectiveness. Am J Prev Cardiol. (2022) 12:100371. doi: 10.1016/j.ajpc.2022.100371
49. Fernández-Friera, L, Fuster, V, López-Melgar, B, Oliva, B, García-Ruiz, JM, Mendiguren, J, et al. Normal LDL-cholesterol levels are associated with subclinical atherosclerosis in the absence of risk factors. J Am Coll Cardiol. (2017) 70:2979–91. doi: 10.1016/j.jacc.2017.10.024
Keywords: nutrition, portfolio diet, dietary patterns, lipids, cholesterol reduction, self-monitoring
Citation: Kavanagh ME, Glenn AJ, Chiavaroli L, Morgan GA, Josse RG, Malik VS, Marinangeli CPF, Kendall CWC, Jenkins DJA and Sievenpiper JL (2024) Simulation model to assess the validity of the clinical portfolio diet score used in the PortfolioDiet.app for dietary self-tracking: a secondary analysis of a randomized controlled trial in hyperlipidemic adults. Front. Nutr. 11:1398450. doi: 10.3389/fnut.2024.1398450
Edited by:
Sofia Balula Dias, University of Lisbon, PortugalReviewed by:
Ioannis Pagkalos, International Hellenic University, GreeceGhada Alhussein, Khalifa University, United Arab Emirates
Copyright © 2024 Kavanagh, Glenn, Chiavaroli, Morgan, Josse, Malik, Marinangeli, Kendall, Jenkins and Sievenpiper. This is an open-access article distributed under the terms of the Creative Commons Attribution License (CC BY). The use, distribution or reproduction in other forums is permitted, provided the original author(s) and the copyright owner(s) are credited and that the original publication in this journal is cited, in accordance with accepted academic practice. No use, distribution or reproduction is permitted which does not comply with these terms.
*Correspondence: John L. Sievenpiper, am9obi5zaWV2ZW5waXBlckB1dG9yb250by5jYQ==