 Feng Chen
 Yufan Gao1†
 Yukai Wang
 Fan Ye
- 1The Second School of Medicine, Wenzhou Medical University, Wenzhou, China
- 2Department of Otorhinolaryngology, The First Affiliated Hospital of Wenzhou Medical University, Wenzhou, China
- 3The School of Medicine, Zhejiang University, Hangzhou, China
Background: Hearing loss (HL) is increasingly recognized as a significant global public health issue, and research on its relationship with vitamin D levels has gained wider attention. However, the association between serum biomarkers 25-hydroxyvitamin D2 (25(OH)D2) and D3 (25(OH)D3) with different types of HL remains unclear. This study aimed to investigate the potential association of serum 25(OH)D2 and 25(OH)D3 with HL in US adults.
Methods: A sample of 3,684 individuals aged 20–69 years from the 2015–2016 National Health and Nutrition Examination (NHANES) was analyzed in this study. HL was defined as a pure tone average > 25 dB in either ear at low frequencies (500, 1,000, 2000 Hz), speech frequencies (500, 1,000, 2000, 4,000 Hz), and high frequencies (3,000, 4,000, 6,000, 8,000 Hz). Logistic regression was employed to examine the association between serum 25(OH)D2 and 25(OH)D3 and HL. The study population was then stratified by age, gender, race, and education level to analyze potential differences between adults in different subgroups.
Results: In the multivariate analysis, it was found that serum 25(OH)D2 was independently associated with low-frequency hearing loss (LFHL) (OR: 1.012 [95% CI, 1.005–1.020]) and speech-frequency hearing loss (SFHL) (OR: 1.011 [95% CI, 1.003–1.018]). Restrictive cubic spline analysis demonstrated a linear dose–response relationship between serum 25(OH)D2 levels and LFHL (p for linearity <0.001), as well as SFHL (p for linearity = 0.001). Conversely, an L-shaped association was observed between serum 25(OH)D3 levels and both LFHL (p for nonlinearity = 0.014) and SFHL (p for nonlinearity = 0.025), with threshold values identified at 35.3 and 36.5 nmol/L, respectively. Higher levels of serum 25(OH)D3 were associated with a lower probability of high-frequency hearing loss (HFHL) (OR: 0.994 [95% CI, 0.989–0.999]), with a threshold value identified at 53.9 nmol/L. Furthermore, a significant interaction between diabetes and serum 25(OH)D2 in LFHL was revealed through subgroup analysis (p = 0.041). In the non-diabetic population, serum 25(OH)D2 maintained its association with LFHL.
Conclusion: Our findings suggested a positive association between serum 25(OH)D2 concentrations and both LFHL and SFHL in the studied cohort. Additionally, an L-shaped relationship was found between serum 25(OH)D3 and LFHL and SFHL, and higher levels of serum 25(OH)D3 were identified to be associated with a lower risk of HFHL.
1 Introduction
Hearing loss (HL) is increasingly recognized as an important public health issue in the contemporary age, affecting more than 5% of the world’s population (1). Multiple reasons have been attributed to the escalating prevalence of HL, including an aging population, noise from occupational or recreational settings, and the widespread use of headphone devices (2). HL not only hinders interpersonal interactions, but also exerts a profound impact on personal quality of life, and daily functioning (3–5), posing enormous health and economic burdens. Therefore, it is of great necessity to identify potential risk factors for potential HL.
The role of vitamin D in auditory impairment has increasingly become a focal point of research. Studies have revealed (6) that a deficiency in vitamin D can lead to the demineralization of cochlear calcium and disrupt microcirculation, which in turn contributes to changes in cochlear morphology and the incidence of HL. Further experimental investigations (7) have confirmed that vitamin D plays a critical role in the proliferation and differentiation of neural stem and progenitor cells, which is essential for preserving the normal function of the auditory nerve. In animal experiments, zebrafish embryos deficient in vitamin D receptor (VDR) gene were found to produce fewer sensory hair cells in their ears, resulting in HL and motor balance disorders (8). Similarly, mice lacking the VDR gene exhibited hypomineralization in their auditory ossicles, impairing sound transmission through the middle ear (9). Recent research has also demonstrated that VDR gene regulates brain natriuretic peptide via the cGMP-PKG signaling pathway, promoting neurite outgrowth and survival of cochlear spiral ganglion neurons (10). This growing body of evidence underscores the significance of vitamin D in maintaining auditory health.
In epidemiological investigations, to date, only a handful of studies have linked vitamin D with HL (11–14). A cross-sectional study revealed a relationship between vitamin D deficiency and an increased likelihood of low-frequency hearing loss (LFHL) and speech-frequency hearing loss (SFHL) among individuals aged 70 and over (13). Another study, based on data from the UK Biobank, found that vitamin D intake is negatively correlated with the incidence of HL (15). Several other research concentrated on the relationship between vitamin D and HL in specific populations; for example, vitamin D deficiency has been deemed as a risk factor for HL in patients with diabetes (11). However, more recent studies indicate that diabetes is correlated with high-frequency hearing loss (HFHL) (16). Therefore, since vitamin D deficiency is prevalent in diabetic patients (17, 18), HL may not be directly caused by diabetes but could be due to vitamin D deficiency in type 2 diabetes (T2DM) patients. This indicates that the current evidence is not certain and requires further investigation.
Given the backdrop of prior studies, it appears apparent that research revolving around the correlations between vitamin D and HL has primarily focused on the elderly or specific populations such as diabetics. Furthermore, the majority of studies have only focused on serum 25-hydroxyvitamin D (25(OH)D) or dietary vitamin D intake concerning HL, yet the individual contributions of serum 25-hydroxyvitamin D3 (25(OH)D3) and D2 (25(OH)D2) have been less studied. Since serum 25(OH)D is composed of both 25(OH)D3 and 25(OH)D2, it is important to distinguish between the two. Vitamin D3 (cholecalciferol) is primarily synthesized in the skin through sunlight exposure, whereas vitamin D2 (ergocalciferol) is mainly obtained from plant-based foods and supplements. Both forms undergo hydroxylation in the liver to form 25(OH)D3 and 25(OH)D2, respectively, which are the main circulating forms. Currently, serum 25(OH)D or 25(OH)D3 are the primary methods for assessing vitamin D status. Measuring 25(OH)D2 can provide a more comprehensive assessment of vitamin D status (19). With the use of high-performance liquid chromatography–tandem mass spectrometry (HPLC-MS/MS), 25(OH)D2 has further refined the classification of these measurements.
Therefore, the current study aims to clarify the association between serum 25(OH)D2 and 25(OH)D3 and HL separately, as well as to identify their optimal concentrations for potential clinical reference values.
2 Methods
2.1 Study participants
National Health and Nutrition Examination Survey (NHANES) (20) is a national, cross-sectional survey that collects health-related data from the US population every 2 years. The program is well representative undergoing a 4-stage rigid design and includes data derived from in-depth interviews, series of physical examinations, and laboratory test results. Detailed information on the study design, methodology, and data collection can be found on the official NHANES website.
The current study utilized data of participants aged 20–69 years in NHANES from 2015 to 2016. Individuals were excluded if (1) audiometry data (N = 504) or abnormal tympanogram results, as well as those with type B and C tympanogram results were unavailable (21, 22) (N = 361); (2) data of other covariates such as body mass index (BMI), hypertension, diabetes, history of stroke, history of congestive heart failure, smoking, firearms noise exposure, occupational noise exposure, recreational noise exposure, and supplement use were missing (N = 44); (3) without serum vitamin D level data (N = 174). A total of 3,684 eligible participants remained for final analysis. The participant screening flowchart is presented in Figure 1.
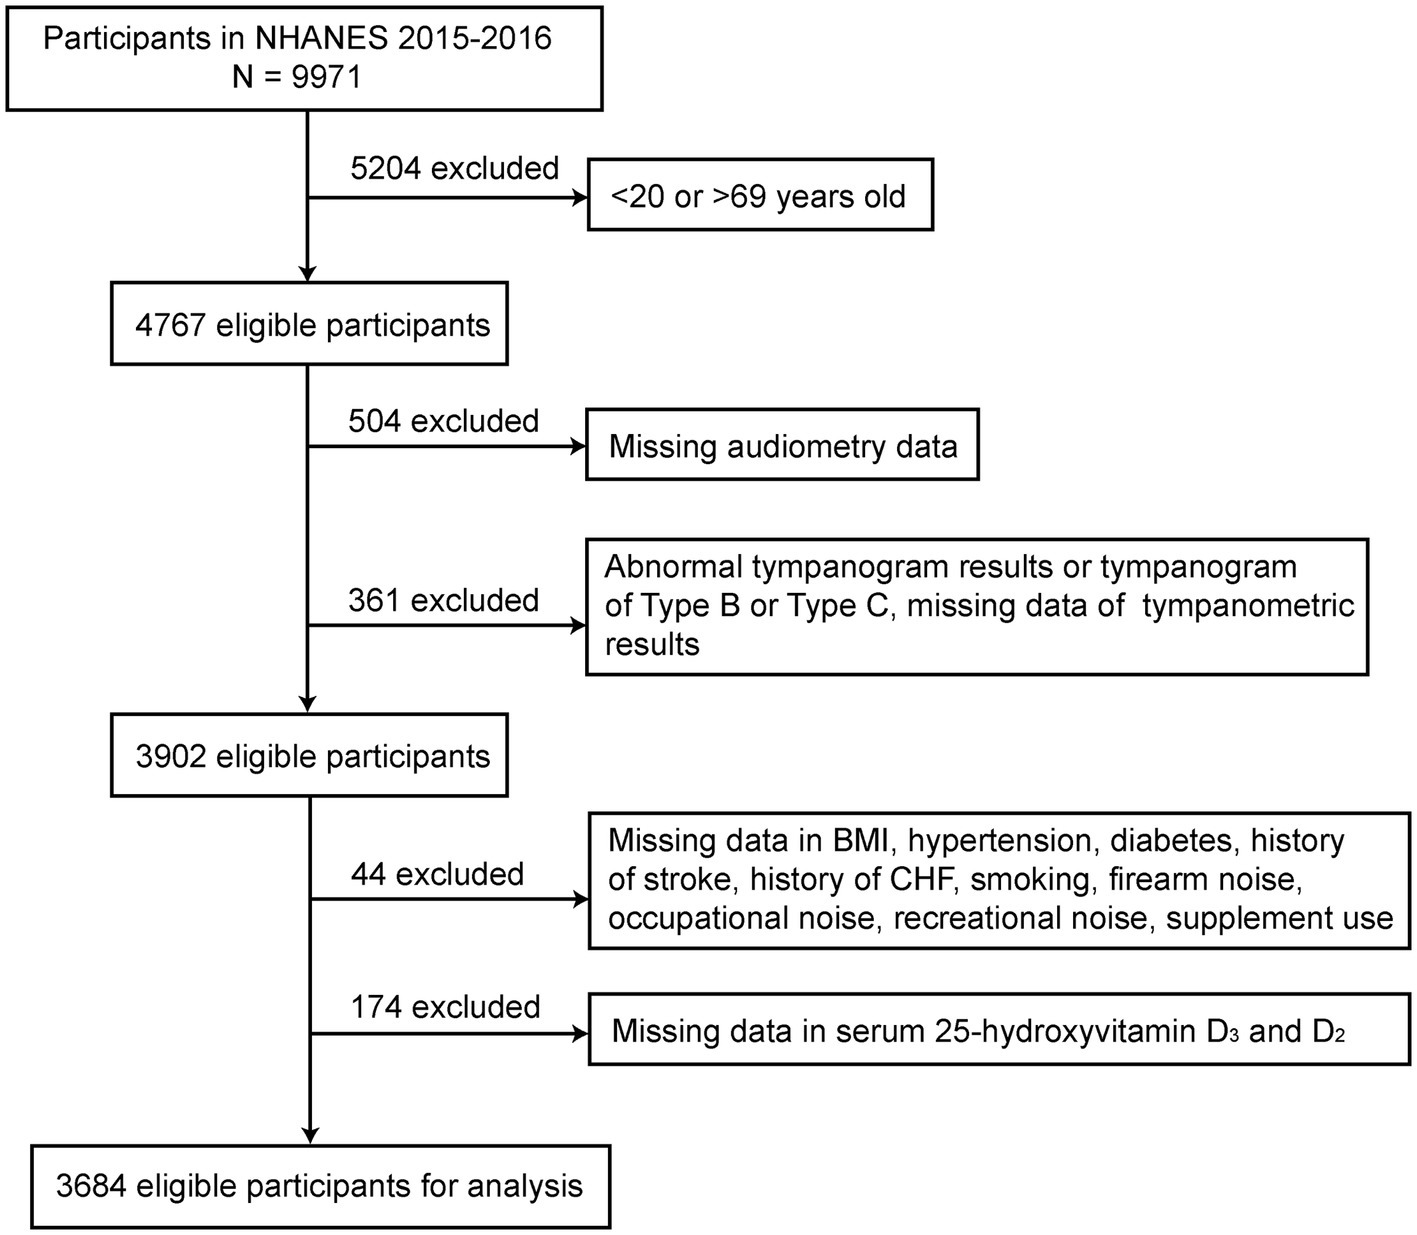
Figure 1. The flowchart of the participants’ selection process.
2.2 Vitamin D levels
The NHANES 2015–2016 cycle used a HPLC-MS/MS method to measure serum 25(OH)D2 and serum 25(OH)D3 levels. When the 25(OH)D2 concentration is below the lower limit of detection, NHANES proposes using the lowest 25(OH)D2 concentration (1.45 nmol/L) as the input value (23, 24). For specific operations and details, refer to the NHANES Assessment of Vitamin D Levels document.
2.3 Audiometry
The audiometric requirements were met by all adults aged 20–69 years (25). The audiometric test was conducted by trained examiners in a soundproof room at the Mobile Examination Center (MEC) using an Interacoustics model AD226 audiometer with standard TDH-49P headphones and Etymotic EarTone 3A plug-in headphones to measure pure-tone air-conduction audiometry in both ears. Middle ear testing was performed using the Interacoustics Titan. Detailed instructions for this procedure can be found on the website (26).
HL was categorized as low-frequency, speech frequency, or high-frequency: LFHL defined as a mean of pure tones greater than 25 dB measured in either ear at 500, 1000, and 2000 Hz; SFHL defined as a mean of pure tones greater than 25 dB measured in either ear at 500, 1000, 2000, and 4,000 Hz; HFHL defined as a mean of pure tones greater than 25 dB measured in either ear at 3000, 4000, 6,000, and 8,000 Hz (13).
2.4 Covariates
Building upon previous research (25, 27, 28), we included the following covariates in our analysis: age, sex, race, level of education, BMI, hypertension, diabetes, history of stroke, history of congestive heart failure, smoking status, firearm noise, occupational noise, recreational noise, and supplement use. Definitions for medical histories including hypertension, diabetes, stroke, congestive heart failure, smoking status, and supplement use were all acquired through self-reports. Considering the potential impact of noise exposure on hearing, our analysis utilized three different sources of noise exposure, with definitions aligning with those found in prior literature (29).
2.5 Statistical analysis
Continuous variables were described as mean ± standard deviation or median (interquartile range) after Kolmogorov–Smirnov test for normality, and categorical variables as percentages. Depending on the characteristics of the variables, group differences were compared using the T-test, non-parametric tests, or chi-square tests. Multivariable logistic regression was employed to assess the relationship between serum 25(OH)D2, D3, and HL, followed by Generalized additive models (GAM) to further examine the nonlinear relationship. GAM provide flexibility by not assuming a predefined form for the relationship between the predictor and outcome variables. If a nonlinear relationship was detected, we applied piecewise logistic regression to identify threshold effects. This method involves dividing the predictor variable into segments and fitting separate logistic regression models within each segment. Restricted cubic splines allow for flexible modeling of nonlinear relationships by using piecewise polynomial functions that are smooth at the points where they join (knots). We visualized the relationship between serum 25(OH)D2 and HL using restricted cubic splines with three knots; and for the relationship between serum 25(OH)D3 and HL, five knots were used to further demonstrate an L-shaped relationship. Stratified logistic regression models were used for subgroup analyses, and likelihood ratio tests were applied to assess the effects and interactions within subgroups. All statistical analyses were performed using R version 4.3.0 (30) and EmpowerStats (31) software. A two-sided p-value <0.05 was considered statistically significant.
3 Results
3.1 Baseline characteristics of population with hearing loss
Among 3,684 participants aged 20–69 years, 328 had LFHL, 496 had SFHL, and 1,276 had HFHL. Those with older age, gender of male, Mexican-American ethnicity, lower education level, higher BMI, hypertension, diabetes, history of congestive heart failure, history of stroke, smoking, supplement use, occupational and recreational noise exposure were more likely to display HL in all three types (p < 0.05). Firearm noise exposure was found to be only associated with SFHL and HFHL (p < 0.05).
Across three types of HL, vitamin D levels showed different characteristics. Those with serum 25(OH)D2 concentration greater than 1.45 nmol/L were more inclined to be LFHL (p < 0.05), whereas serum 25(OH)D3 concentration was higher in SFHL and HFHL group (both p < 0.05) (Table 1).
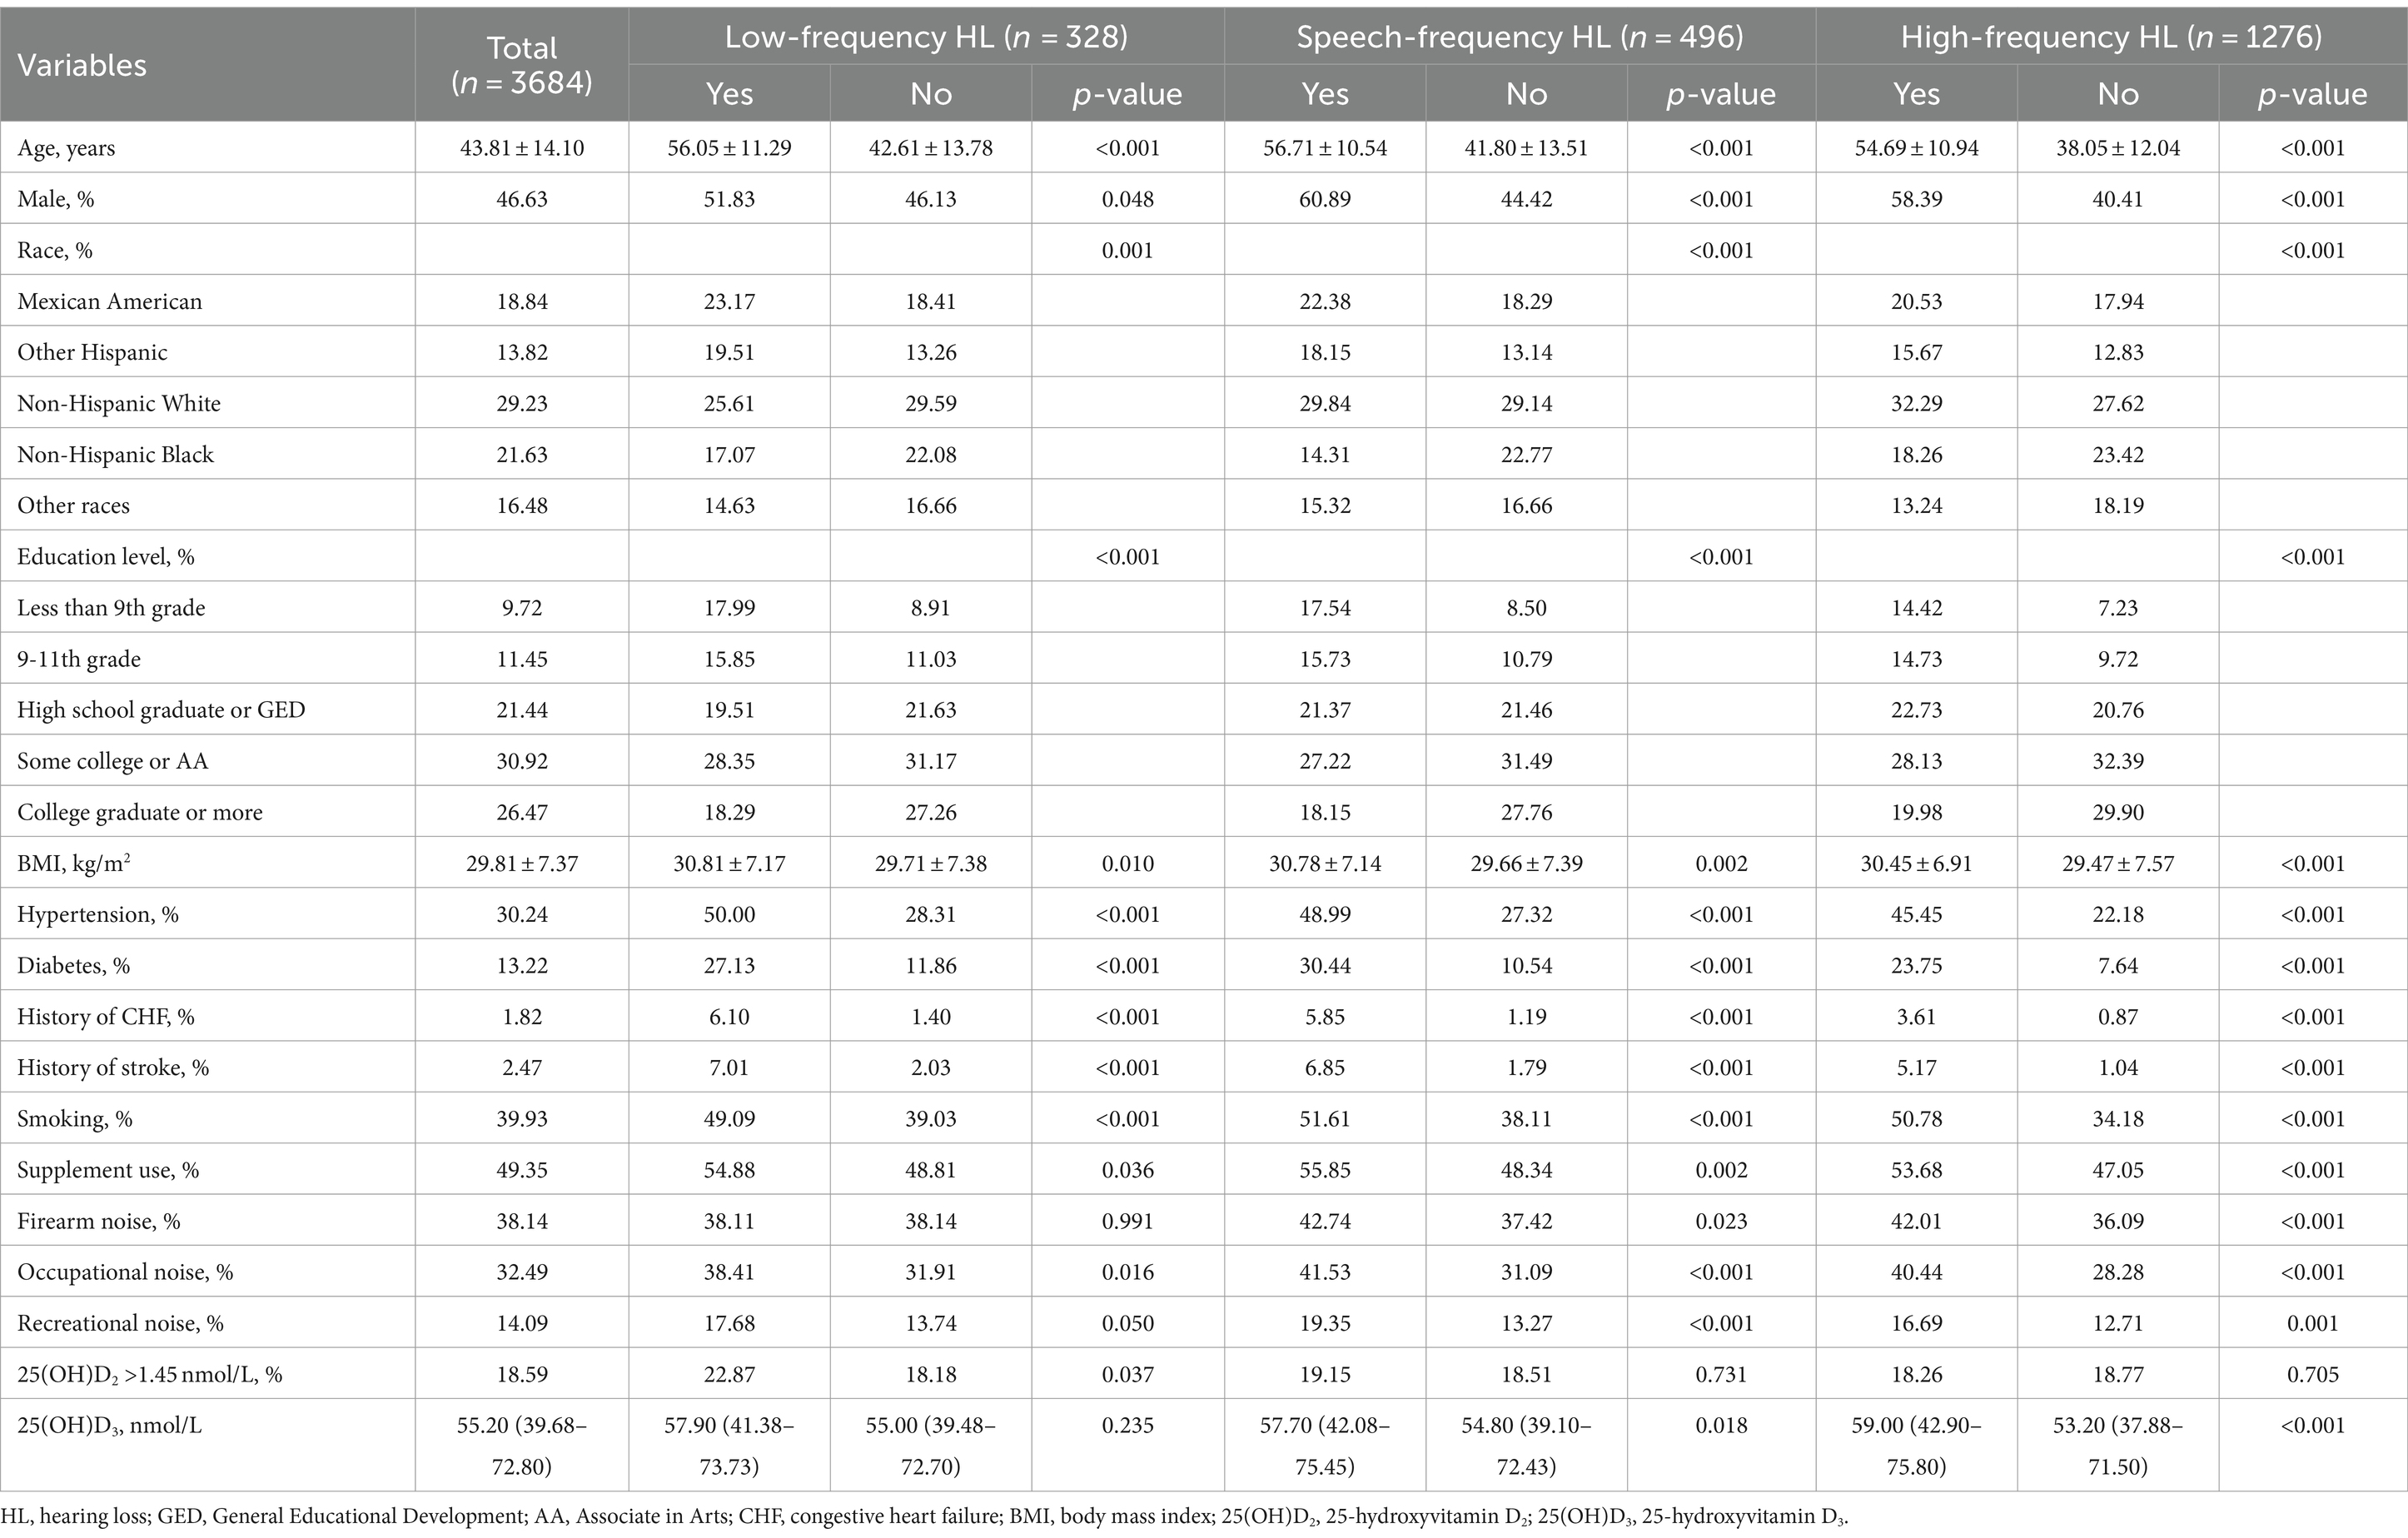
Table 1. Characteristics of participants classified by hearing loss.
3.2 Multivariable logistic regression
Multivariable binary logistic regression was used to explore the association between serum 25(OH)D2, D3, and HL. Crude Model 1 adjusted for demographic variables including age, gender, race, education level and Model 2 fully adjusted for all potential covariates described above in Method (Table 2). In Model 1, serum 25(OH)D2 concentration was associated with LFHL (OR:1.013 [95% CI, 1.005–1.020], p < 0.001) and SFHL (OR:1.012 [95% CI, 1.005–1.020], p = 0.001), but no significance was identified in HFHL (OR:1.003 [95% CI, 0.995–1.011], p = 0.438). Serum 25(OH)D3 concentration was associated with SFHL (OR:0.996 [95% CI, 0.992–1.000], p = 0.049) and HFHL (OR:0.996 [95% CI, 0.993–0.999], p = 0.023), but no significance found in LFHL (OR:0.995 [95% CI, 0.991–1.000], p = 0.057). To further enhance the robustness of the association between serum 25(OH)D3 and 25(OH)D2 levels and HL in adults, we additionally adjusted for confounding factors such as serum calcium, serum phosphorus, and a history of renal insufficiency (Supplementary Table 3). Sensitivity analyses demonstrated that the association between serum 25(OH)D3 and 25(OH)D2 levels and HL in adults remained significant, indicating a strong robustness of our findings.
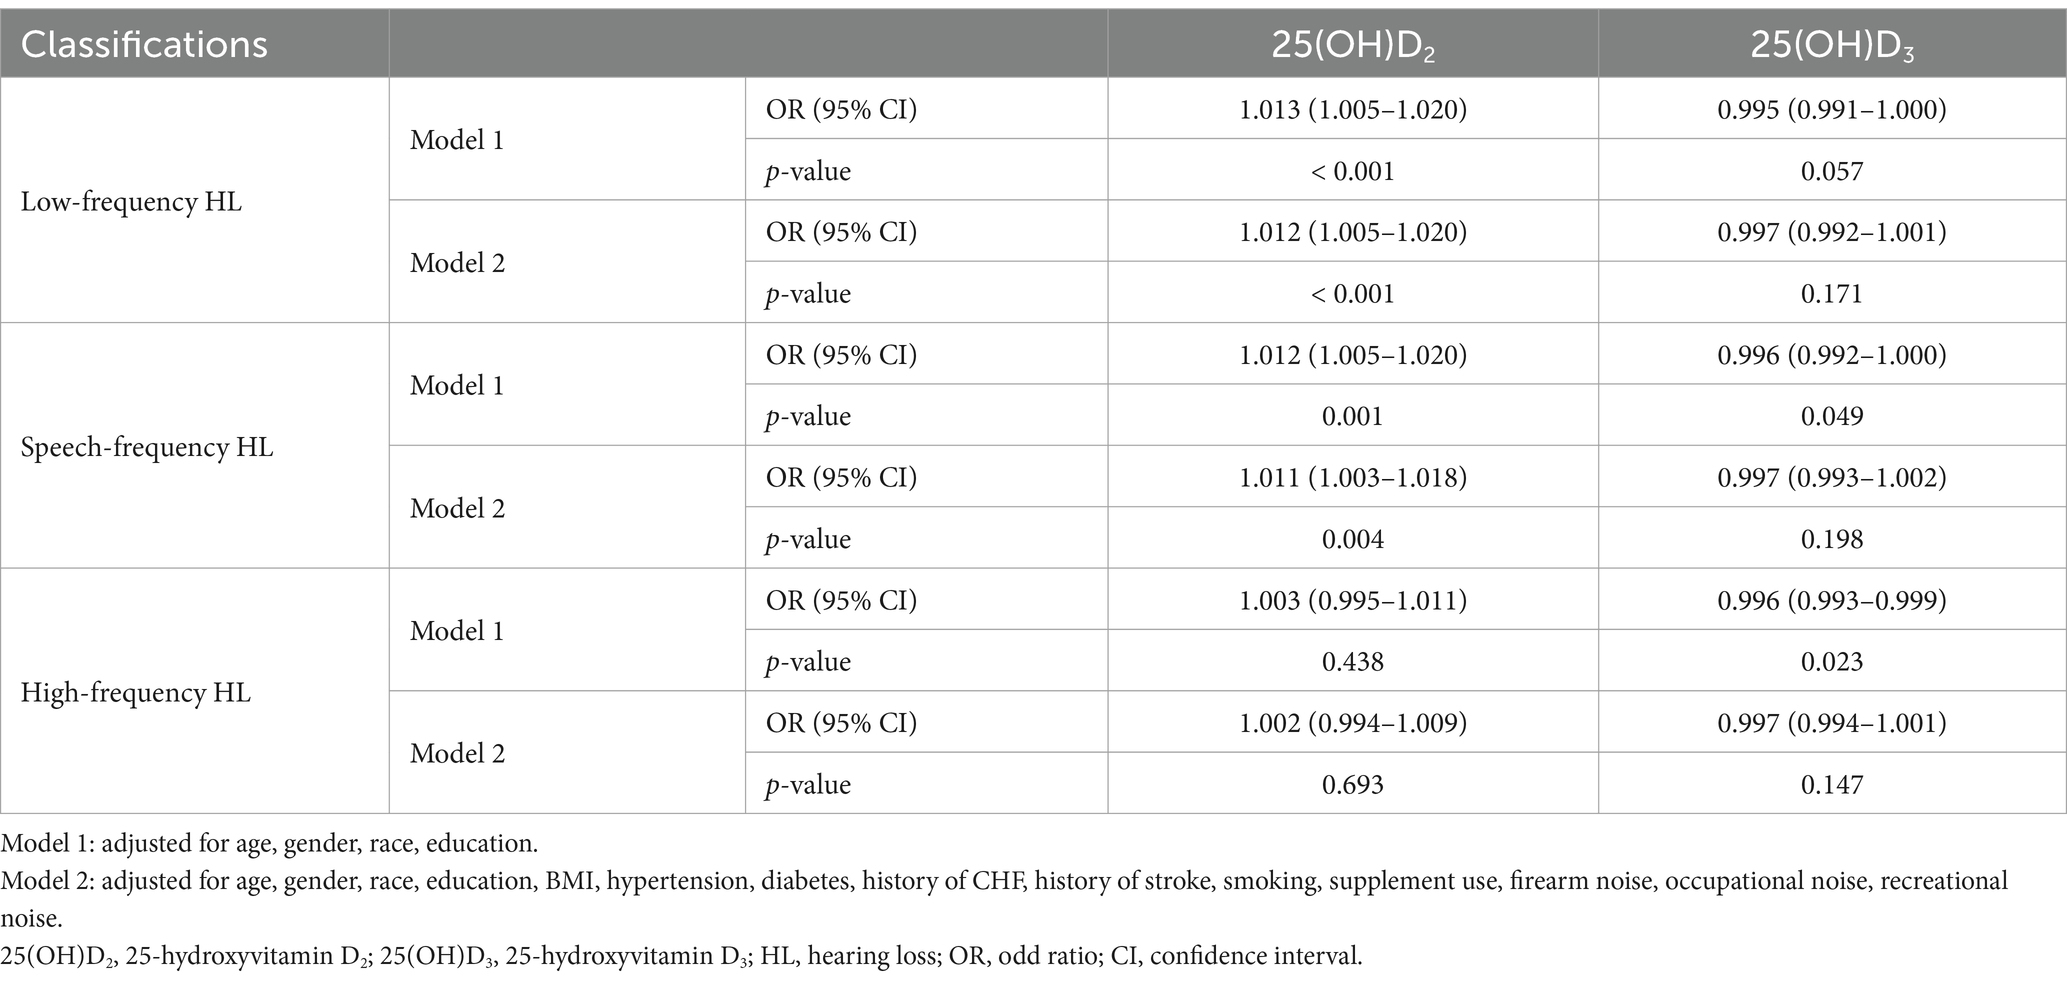
Table 2. Multivariate logistic regression models assessing the relationship between 25-hydroxyvitamin D2, D3 and hearing loss.
In Model 2, serum 25(OH)D2 concentration remained consistent results compared to Model 1. It was found to be associated with LFHL (OR:1.012 [95% CI, 1.005–1.020], p < 0.001) and SFHL (OR:1.011 [95% CI, 1.003–1.018], p = 0.004), but not in HFHL (OR:1.002 [95% CI, 0.994–1.009], p = 0.693). Nevertheless, there was no significance reported for the association between serum 25(OH)D3 concentration and LFHL (OR:0.997 [95% CI, 0.992–1.001], p = 0.171), SFHL (OR:0.997 [95% CI, 0.993–1.002], p = 0.198), or HFHL (OR:0.997 [95% CI, 0.994–1.001], p = 0.147).
3.3 Threshold effects and restricted cubic splines
To further explore whether a nonlinear relationship existed between serum 25(OH)D2, D3, and HL, we implemented piecewise logistic regression using GAM and recursive methods to calculate effect thresholds. Restricted cubic splines were then used to visualize the relationship. We found a linear dose–response relationship between serum 25(OH)D2 and LFHL (p for linearity <0.001) and SFHL (p for linearity = 0.001). Comparatively, serum 25(OH)D3 had an L-shaped relationship with LFHL (p for nonlinearity = 0.014) and SFHL (p for nonlinearity = 0.025), with critical values of 35.3 and 36.5 nmol/L, respectively (Figure 2 and Table 3).
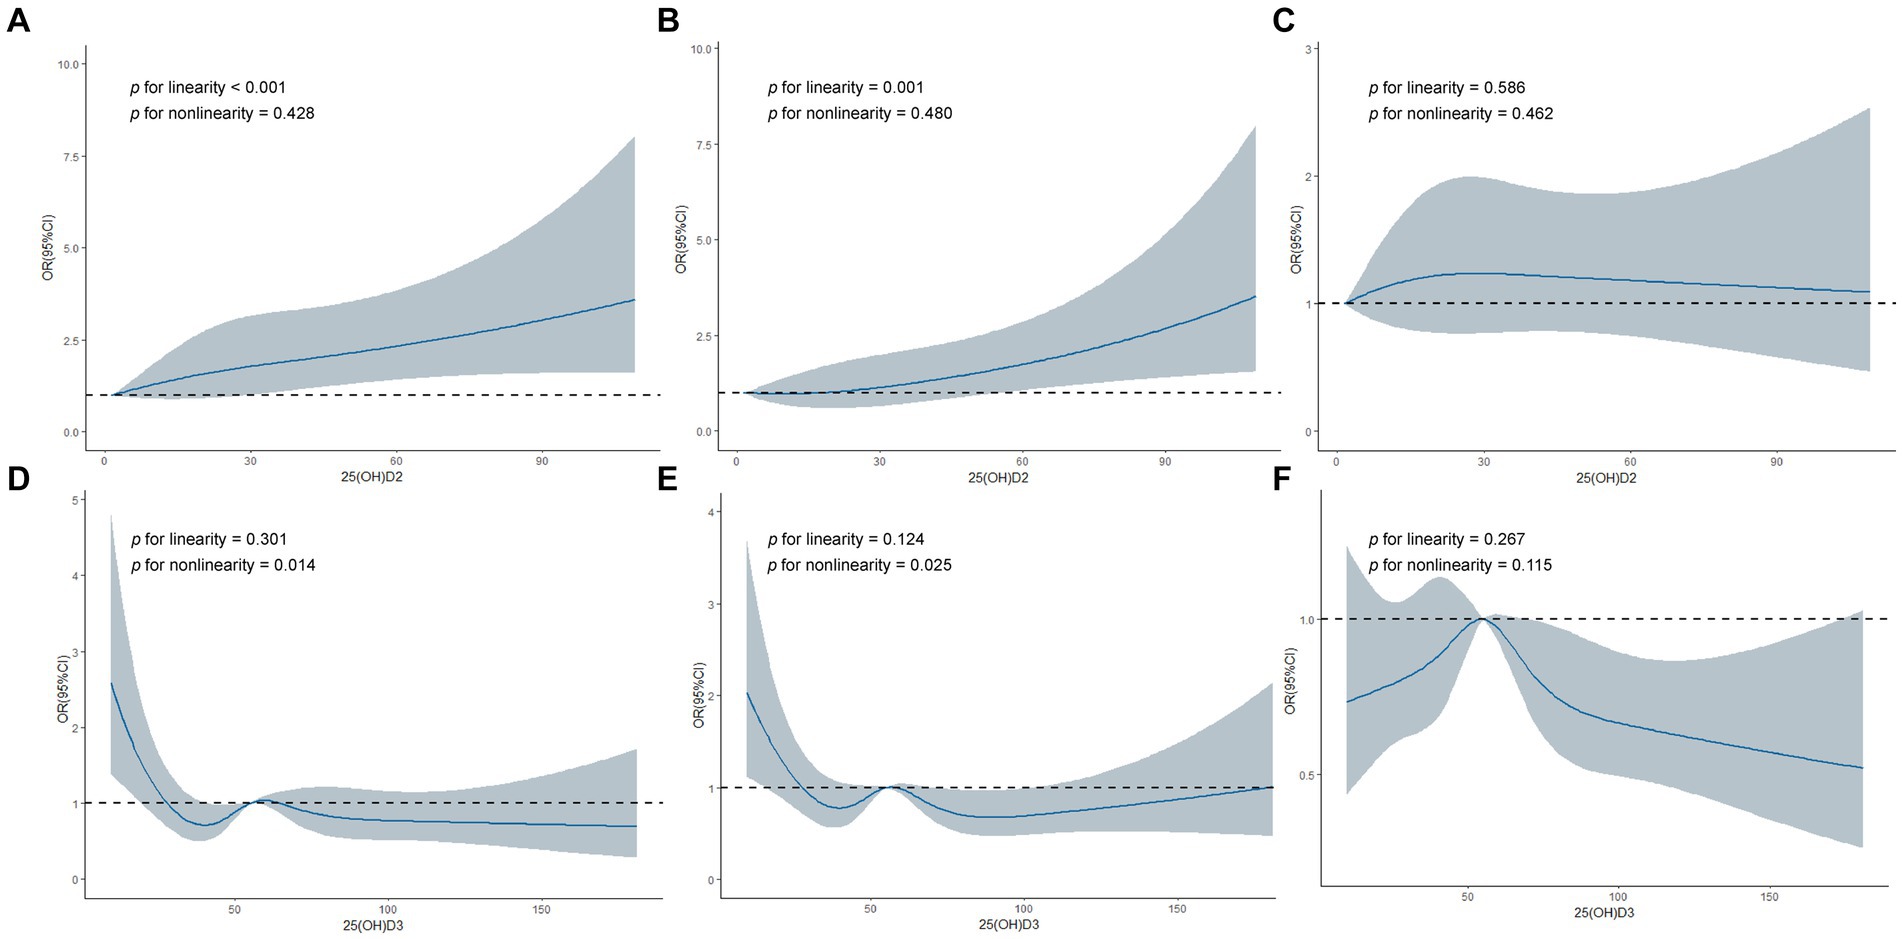
Figure 2. Restricted cubic spline regression analyses of 25-hydroxyvitamin D2, D3 and hearing loss. (A) Association between 25(OH)D2 and Low-frequency HL. (B) Association between 25(OH)D2 and Speech-frequency HL. (C) Association between 25(OH)D2 and High-frequency HL. (D) Association between 25(OH)D3 and Low-frequency HL. (E) Association between 25(OH)D3 and Speech-frequency HL. (F) Association between 25(OH)D3 and High-frequency HL. 25(OH)D2, 25-hydroxyvitamin D2; 25(OH)D3, 25-hydroxyvitamin D3; HL, hearing loss; OR, odd ratio; CI, confidence interval.
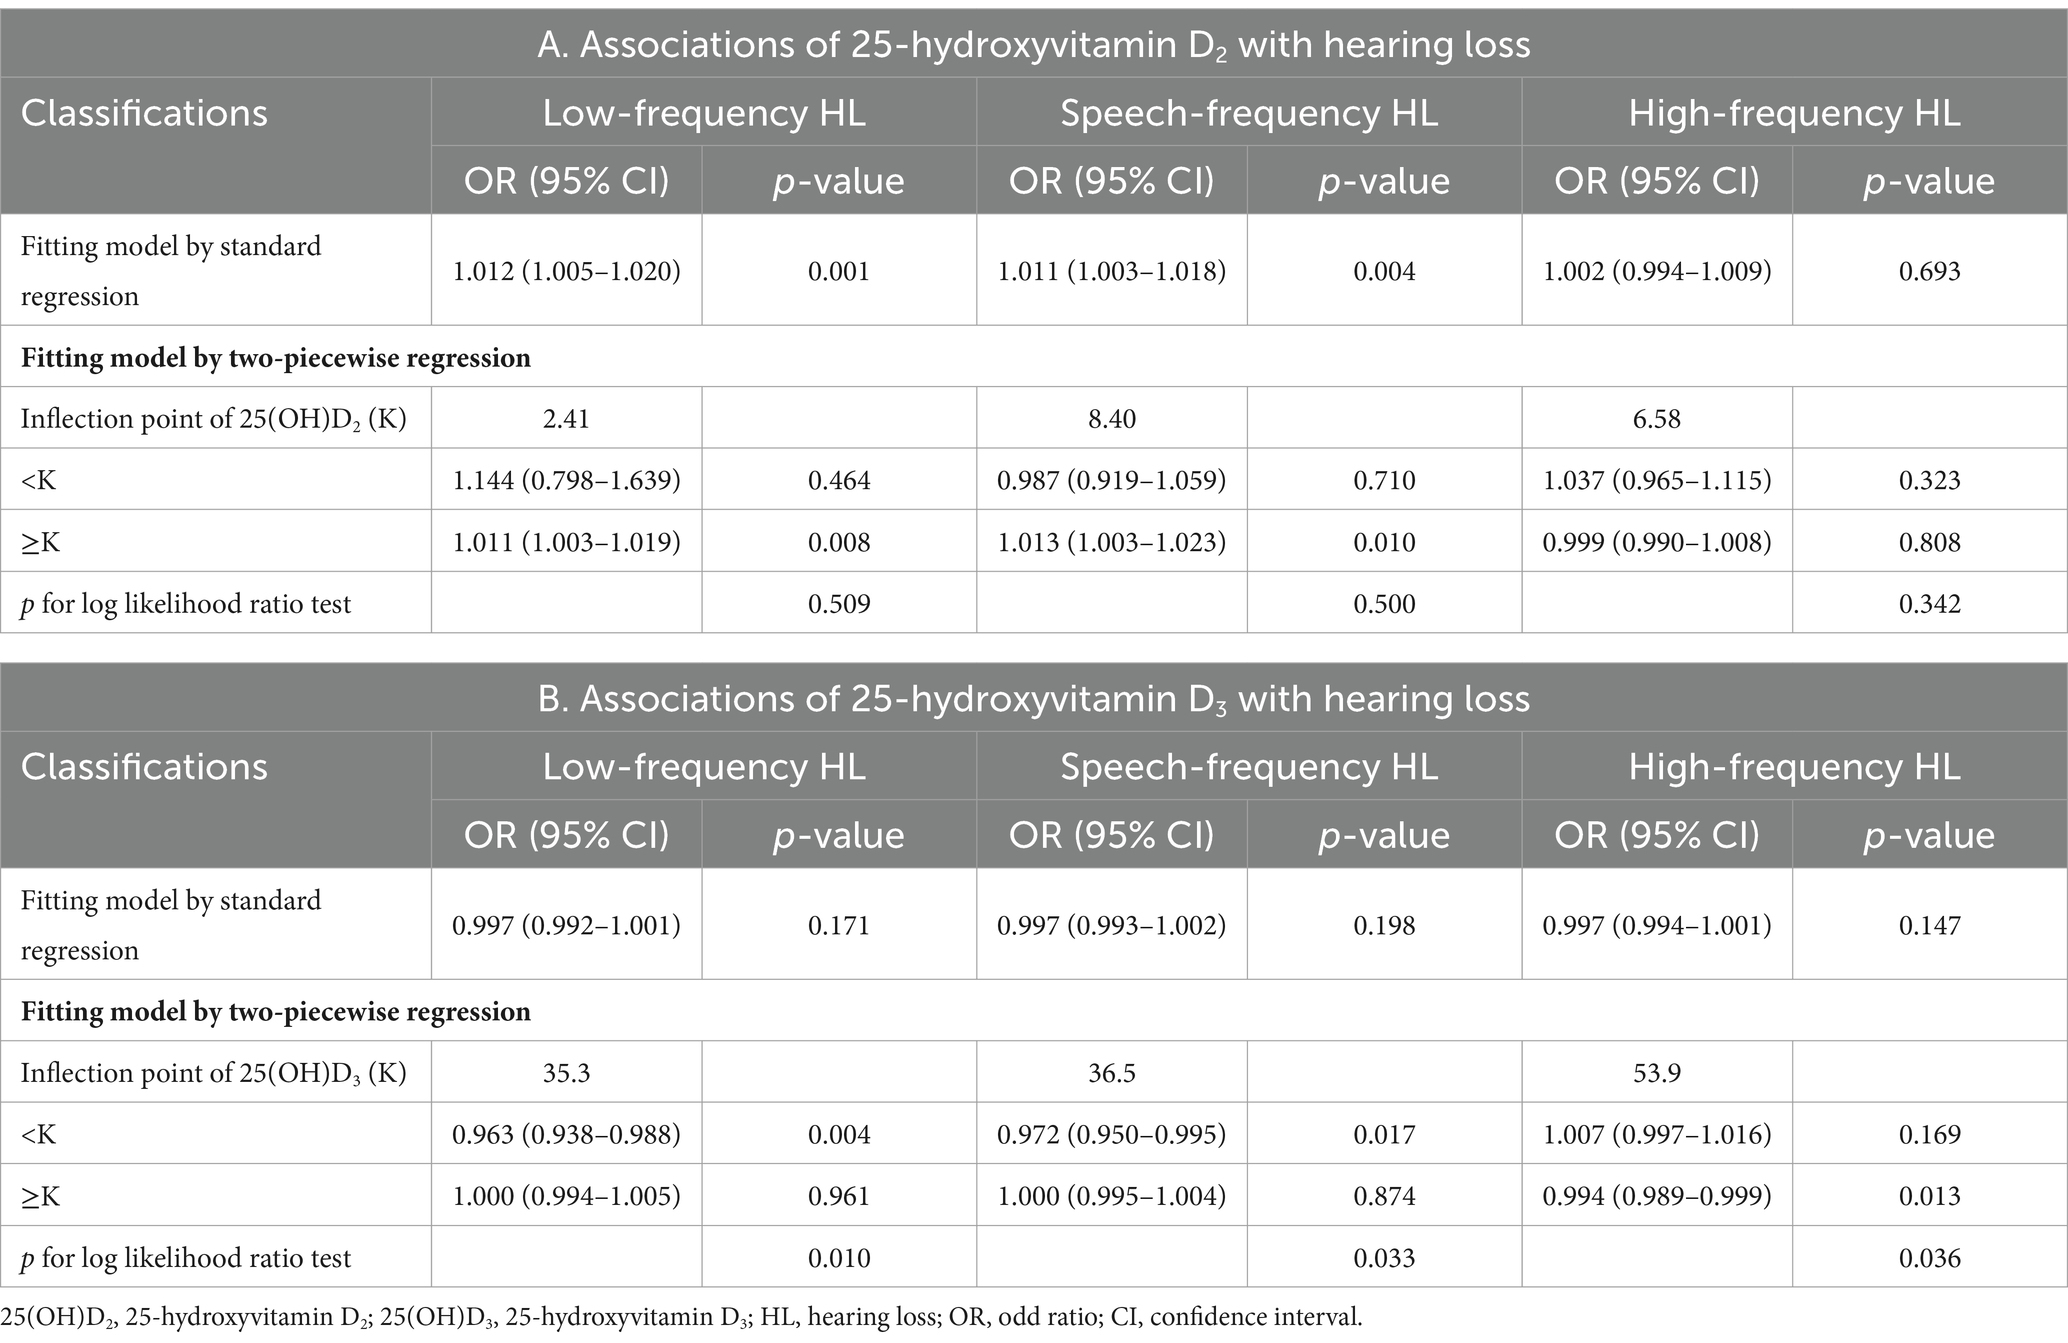
Table 3. The results of two-piecewise logistic regression model.
Piecewise logistic regression showed that serum 25(OH)D2 concentration greater than 2.41 nmol/L was significantly associated with LFHL (OR:1.011 [95% CI, 1.003–1.019], p = 0.008), but there was no statistical difference compared to standard logistic regression (p for log likelihood ratio test = 0.509), indicating no threshold effect. Similarly, serum 25(OH)D2 concentration greater than 8.40 nmol/L was significantly associated with SFHL (OR:1.013 [95% CI, 1.003–1.023], p = 0.010), but there again was no threshold effect (p for log likelihood ratio test = 0.500). As for HFHL, neither standard regression nor piecewise logistic regression indicated any association between serum 25(OH)D2 and HFHL.
Serum 25(OH)D3 demonstrated threshold effects in all three types of HL (p for log likelihood ratio test <0.05). Specifically, lower levels (<35.3 nmol/L) of serum 25(OH)D3 were associated with a higher likelihood of LFHL (OR:0.963 [95% CI, 0.938–0.988], p = 0.004); lower levels (<36.5 nmol/L) of serum 25(OH)D3 were associated with a higher likelihood of SFHL (OR:0.972 [95% CI, 0.950–0.995], p = 0.017); higher levels (>53.9 nmol/L) of serum 25(OH)D3 were associated with a lower likelihood of HFHL (OR:0.994 [95% CI, 0.989–0.999], p = 0.013) (Table 3).
3.4 Subgroup analysis
Subgroup analyses were conducted incorporating covariates of interest, containing age, gender, race, education level, BMI, hypertension, diabetes, and smoking (Supplementary Tables 1, 2). The results revealed a significant interaction between diabetes and serum 25(OH)D2 in LFHL (p = 0.041). Serum 25(OH)D2 retained its association with LFHL in the non-diabetic population (OR:1.020 [95% CI, 1.010–1.031], p < 0.001). Moreover, serum 25(OH)D2 remained associated with LFHL in populations aged 37–69, females, Mexican-Americans, those with a high school education level, and those with a BMI > 30 (p < 0.05). Serum 25(OH)D2 was also associated with SFHL in populations aged 53–69, females, Mexican-Americans, those with less than a ninth-grade education level, with a BMI > 30, with hypertension, non-diabetics, and smokers (p < 0.05). Unfortunately, there present no significant association in HFHL across all subgroups (Supplementary Table 1).
When it comes to the part of serum 25(OH)D3, for Mexican-Americans and those with a high school education level, it was found to be associated with smaller likelihood of SFHL (p < 0.05). Moreover, in females and those with a BMI 25–30 subgroup, 25(OH)D3 was associated with smaller likelihood of HFHL (p < 0.05). No association between serum 25(OH)D3 and LFHL was displayed in the subgroups (Supplementary Table 2).
4 Discussion
Utilizing a considerable sample size from the NHANES 2015–2016 cycle, we investigated potential relationships between serum 25(OH)D2, D3 levels and HL in adults. Major findings suggested that serum 25(OH)D2 had a positive independent association with both LFHL and SFHL. Restricted cubic splines confirmed a linear dose–response relationship between serum 25(OH)D2 and these forms of HL. Interestingly, an L-shaped relationship was observed between serum 25(OH)D3 and both LFHL and SFHL, with critical values of 35.3 nmol/L and 36.5 nmol/L, respectively. Higher levels of serum 25(OH)D3 were associated with a lower likelihood of HFHL, with a critical value of 53.9 nmol/L. Subgroup analysis revealed a significant interaction between diabetes and serum 25(OH)D2 in LFHL outcomes, maintaining its significant association within the non-diabetic population.
Previous studies have primarily focused on the association between serum 25(OH)D concentration and HL (11, 12, 32, 33). One study (13) using a sample of 1,123 older adults from NHANES (2005–2010) suggested that low serum 25(OH)D concentration was positively correlated with the occurrence of LFHL and SFHL but not HFHL. This cross-sectional study’s findings align with our observation of an L-shaped relationship between serum 25(OH)D3 concentration and HL. Another NHANES study (14) also tried to establish a correlation between vitamin D deficiency and bilateral low-frequency hearing impairment and sensorineural HL. Other studies have revealed a negative correlation between serum 25(OH)D3 and depression, while serum 25(OH)D2 has an inverted U-shaped relationship with depression (34). Additionally, serum 25(OH)D and 25(OH)D3 concentrations are positively correlated with cognitive function (23), all linked to mental disorders.
The L-shaped relationship between serum 25(OH)D3 and HL could be explained by several mechanisms. To begin with, the presence of vitamin D deficiency might contribute to HL by affecting cochlear bone density (35), leading to cochlear demineralization and microcirculation changes, altering calcium metabolism, and causing morphological changes in the cochlea that eventually result in hearing decline (6). Another underlying mechanism could be that vitamin D can cross the blood–brain barrier (36) and distribute unevenly among various brain regions (37). This uneven distribution affects the proliferation and differentiation of neural stem cells and progenitors (7), leading to impaired neuronal proliferation and differentiation, affecting vestibuloauditory neural function and resulting in hearing decline if vitamin D is deficient.
The positive independent association identified between serum 25(OH)D2 and low and SFHL can be putatively explained by the interaction between vitamin D2, D3. Previous research (38, 39) has shown that vitamin D2 supplementation can decrease circulating concentrations of 25(OH)D3, potentially as a result of affecting the metabolism of vitamin D3. This might be partly explained by the competition between vitamin D2 and D3 for the same hydroxylation pathways, with vitamin D3 being a more effective factor in maintaining and elevating serum total 25(OH)D levels (40). In light of this, high levels of vitamin D2 might competitively affect the activation of vitamin D3, hindering the body’s ability to maintain adequate levels of total serum 25(OH)D, and ultimately lead to the occurrence of HL.
Subgroup analysis observed a significant interaction between diabetes and serum 25(OH)D2 in LFHL. Previous research (41) has shown that vitamin D are negatively associated with the risk of T2DM, potentially because vitamin D plays a underlying part in regulating the process of immune and inflammatory cells proliferation, differentiation and function, upregulating anti-inflammatory pathways and downregulating the activation of these cells, thereby reducing the risk of T2DM (42). Longitudinal studies have also correlated diabetes with an increased risk of moderate or severe HL (43).
This study has several strengths. Firstly, we separately investigated the associations between serum 25(OH)D2 and 25(OH)D3, and adult HL, uncovering contrasting trends between these markers. To our knowledge, this study is the first to explore the association in this perspective, as previous research was limited to seeking the association between total serum 25(OH)D and HL. Our research underscores the necessity of individually considering serum 25(OH)D2 and 25(OH)D3 when studying the correlation between vitamin D and HL. Secondly, the large sample size provided by NHANES ensured the reliability of our statistical results. Restricted cubic splines and threshold analysis assessed the L-shaped relationship between serum 25(OH)D3 and LFHL and SFHL. The primary limitation of this study lies in its cross-sectional design, which precludes the determination of causality. Additionally, due to database constraints, it was not possible to adjust for all potential confounding variables, such as osteoporosis and parathyroid hormone levels, which may influence vitamin D levels and auditory health. Moreover, when the 25(OH)D2 concentration is below the detection limit, we use the minimum 25(OH)D2 concentration (1.45 nmol/L) as the input value. This does not reflect the patient’s true 25(OH)D2 concentration. Assessing vitamin D levels based on a single test may be insufficient to fully capture its impact on HL, and further research is needed to determine the precise effects and implications of 25(OH)D2 at accurate concentrations. Based on our findings, which provide potential epidemiological evidence for differing vitamin D supplementation categories, further prospective research relating to this topic is encouraged to establish causality between these factors.
5 Conclusion
This study consolidated that in the adult population of the United States, serum 25(OH)D2 concentration was positively associated with LFHL and SFHL, while serum 25(OH)D3 exhibited an L-shaped relationship with LFHL and SFHL, with critical values of 35.3 and 36.5 nmol/L, respectively. Higher levels of serum 25(OH)D3 were associated with a lower likelihood of HFHL, with a critical value of 53.9 nmol/L. Furthermore, serum 25(OH)D2 retained its association with LFHL in the non-diabetic population.
Future research should focus on longitudinal and interventional studies to establish causality and explore the effects of vitamin D supplementation on HL. Mechanistic studies are needed to understand the biological processes involved, while studies on diverse populations can help determine the universal applicability of the findings. Comparative studies between vitamin D2 and D3, as well as genetic studies to explore individual responses, are also recommended.
Data availability statement
Publicly available datasets were analyzed in this study. This data can be found here: https://www.cdc.gov/nchs/nhanes/index.htm.
Ethics statement
The studies involving humans were approved by the ethics protocol was approved by the Research Ethics Review Board of National Center for Health Statistics (https://www.cdc.gov/nchs/nhanes/irba98.htm). The studies were conducted in accordance with the local legislation and institutional requirements. The participants provided their written informed consent to participate in this study.
Author contributions
FC: Writing – original draft. YG: Writing – original draft. YW: Writing – original draft. ZP: Writing – original draft. YC: Writing – original draft. HS: Writing – original draft. QC: Writing – original draft. FY: Writing – review & editing.
Funding
The author(s) declare that no financial support was received for the research, authorship, and/or publication of this article.
Acknowledgments
All authors sincerely thank NHANES for providing publicly available data.
Conflict of interest
The authors declare that the research was conducted in the absence of any commercial or financial relationships that could be construed as a potential conflict of interest.
Publisher’s note
All claims expressed in this article are solely those of the authors and do not necessarily represent those of their affiliated organizations, or those of the publisher, the editors and the reviewers. Any product that may be evaluated in this article, or claim that may be made by its manufacturer, is not guaranteed or endorsed by the publisher.
Supplementary material
The Supplementary material for this article can be found online at: https://www.frontiersin.org/articles/10.3389/fnut.2024.1390953/full#supplementary-material
References
1. World Health Organization. Deafness and hearing loss. (2020). Available at: https://www.who.int/news-room/fact-sheets/detail/deafness-and-hearing-loss
2. World Health Organization. Addressing the rising prevalence of hearing Loss. Geneva: World Health Organization (2018).
3. Hearing loss: an important global health concern. Lancet. (2016) 387:2351. doi: 10.1016/S0140-6736(16)30777-2
4. Blazer, DG, and Tucci, DL. Hearing Loss and psychiatric disorders: a review. Psychol Med. (2019) 49:891–7. doi: 10.1017/S0033291718003409
5. Jones, EM, and White, AJ. Mental health and acquired hearing impairment: a review. Br J Audiol. (1990) 24:3–9. doi: 10.3109/03005369009077837
6. Ikeda, K, Kobayashi, T, Itoh, Z, Kusakari, J, and Takasaka, T. Evaluation of Vitamin D metabolism in patients with bilateral sensorineural hearing Loss. Am J Otol. (1989) 10:11–3.
7. Homem, CC, Repic, M, and Knoblich, JA. Proliferation control in neural stem and progenitor cells. Nat Rev Neurosci. (2015) 16:647–59. doi: 10.1038/nrn4021
8. Kwon, HJ, and Vitamin, D. Receptor deficiency impairs inner ear development in zebrafish. Biochem Biophys Res Commun. (2016) 478:994–8. doi: 10.1016/j.bbrc.2016.08.070
9. Delsmann, MM, Peichl, J, Yorgan, TA, Beil, FT, Amling, M, Demay, MB, et al. Prevention of Hypomineralization in auditory Ossicles of Vitamin D receptor (Vdr) deficient mice. Front Endocrinol. (2022) 13:901265. doi: 10.3389/fendo.2022.901265
10. Zhang, X, Zhou, K, Tian, K, Zhu, Q, Liu, W, Liu, Z, et al. Vdr regulates Bnp promoting neurite growth and survival of Cochlear spiral ganglion neurons through Cgmp-Pkg signaling pathway. Cells. (2022) 11:3746. doi: 10.3390/cells11233746
11. Bener, A, Eliaçık, M, Cincik, H, Öztürk, M, DeFronzo, RA, and Abdul-Ghani, M. The impact of Vitamin D deficiency on retinopathy and hearing loss among type 2 diabetic patients. Biomed Res Int. (2018) 2018:2714590–8. doi: 10.1155/2018/2714590
12. Ghazavi, H, Kargoshaie, AA, and Jamshidi-Koohsari, M. Investigation of Vitamin D levels in patients with sudden sensory-neural hearing Loss and its effect on treatment. Am J Otolaryngol. (2020) 41:102327. doi: 10.1016/j.amjoto.2019.102327
13. Szeto, B, Valentini, C, and Lalwani, AK. Low Vitamin D status is associated with hearing Loss in the elderly: a cross-sectional study. Am J Clin Nutr. (2021) 113:456–66. doi: 10.1093/ajcn/nqaa310
14. Bigman, G. Deficiency in Vitamin D is associated with bilateral hearing impairment and bilateral sensorineural hearing Loss in older adults. Nutr Res. (2022) 105:1–10. doi: 10.1016/j.nutres.2022.05.008
15. Dawes, P, Cruickshanks, KJ, Marsden, A, Moore, DR, and Munro, KJ. Relationship between diet, tinnitus, and hearing difficulties. Ear Hear. (2020) 41:289–99. doi: 10.1097/AUD.0000000000000765
16. Ooley, C, Jun, W, Le, K, Kim, A, Rock, N, Cardenal, M, et al. Correlational study of diabetic retinopathy and hearing Loss. Optom Vis Sci. (2017) 94:339–44. doi: 10.1097/opx.0000000000001025
17. Liu, YJ, Duan, JW, Lu, DH, Zhang, F, and Liu, HL. Association between Vitamin D status and cardiometabolic risk factors in adults with type 2 diabetes in Shenzhen, China. Front Endocrinol. (2024) 15:1346605. doi: 10.3389/fendo.2024.1346605
18. Hosseini, MS, Saeedi, M, and Khalkhali, SA. Prevalence of hearing disorders among type 2 diabetes mellitus patients with and without Vitamin D deficiency. Maedica. (2020) 15:32–6. doi: 10.26574/maedica.2020.15.1.32
19. Giustina, A, Bilezikian, JP, Adler, RA, Banfi, G, Bikle, DD, Binkley, NC, et al. Consensus statement on Vitamin D status assessment and supplementation: whys, Whens, and Hows. Endocr Rev. (2024). doi: 10.1210/endrev/bnae009
20. Nhanes-National Health and Nutrition Examination Survey Homepage. Available at: https://www.cdc.gov/nchs/nhanes/index.htm.
21. Lalwani, AK, Liu, YH, and Weitzman, M. Secondhand smoke and sensorineural hearing Loss in adolescents. Arch Otolaryngol Head Neck Surg. (2011) 137:655–62. doi: 10.1001/archoto.2011.109
22. Weitzman, M, Govil, N, Liu, YH, and Lalwani, AK. Maternal prenatal smoking and hearing Loss among adolescents. JAMA Otolaryngol Head Neck Surg. (2013) 139:669–77. doi: 10.1001/jamaoto.2013.3294
23. Wang, R, Wang, W, Hu, P, Zhang, R, Dong, X, and Zhang, D. Association of Dietary Vitamin D Intake, serum 25(oh)D(3), 25(oh)D(2) with cognitive performance in the elderly. Nutrients. (2021) 13:3089. doi: 10.3390/nu13093089
24. National Health and Nutrition Examination Survey. Nhanes analytical note for 25 hydroxyvitamin D data analysis. Available at: https://wwwn.cdc.gov/Nchs/Nhanes/2015-2016/VID_I.htm.
25. Long, L, and Tang, Y. Association between sleep duration and hearing threshold shifts of adults in the United States: National Health and nutrition examination survey, 2015-2016. BMC Public Health. (2023) 23:2305. doi: 10.1186/s12889-023-17204-3
26. National Health and Nutrition Examination Survey 2015-2016. Data documentation. (2019). Available at: https://wwwn.cdc.gov/Nchs/Nhanes/2015-2016/AUX_I.htm.
27. Fu, Y, Chen, W, Guo, L, and Liu, Y. The inverted-U relationship between dietary inflammatory potential and hearing Loss among adults aged 20 years and over in the United States: a cross-sectional study. J Inflamm Res. (2021) 14:6671–83. doi: 10.2147/JIR.S337737
28. Zhou, J, Fan, Z, Bi, Y, Li, D, Chen, X, Hou, K, et al. The significance of serum klotho to hearing loss: a potential protector under noise pollution. Environ Sci Pollut Res Int. (2023) 30:104464–76. doi: 10.1007/s11356-023-29788-9
29. Ding, N, and Park, SK. Perfluoroalkyl substances exposure and hearing impairment in us adults. Environ Res. (2020) 187:109686. doi: 10.1016/j.envres.2020.109686
30. The R Foundation. The R project for statistical computing. (2023). Available at: https://www.r-project.org/.
31. Empowerstats (2023). Available at: http://www.em-powerstats.com.
32. Xie, R, and Zhang, Y. Association between 19 dietary fatty acids intake and rheumatoid arthritis: results of a Nationwide survey. Prostaglandins Leukot Essent Fatty Acids. (2023) 188:102530. doi: 10.1016/j.plefa.2022.102530
33. Xie, R, and Zhang, Y. Associations between dietary flavonoid intake with hepatic steatosis and fibrosis quantified by Vcte: evidence from Nhanes and Fndds. Nutr Metab Cardiovasc Dis. (2023) 33:1179–89. doi: 10.1016/j.numecd.2023.03.005
34. Li, P, Zhao, Y, Fan, X, Wang, J, Lu, W, and Zheng, X. Independent associations of serum 25-Hydroxyvitamin D(3) and D(2) with depressive symptoms in females. J Affect Disord. (2022) 296:342–9. doi: 10.1016/j.jad.2021.09.102
35. Brookes, GB. Vitamin D deficiency--a new cause of Cochlear deafness. J Laryngol Otol. (1983) 97:405–20. doi: 10.1017/s0022215100094330
36. Eyles, DW, Smith, S, Kinobe, R, Hewison, M, and McGrath, JJ. Distribution of the Vitamin D receptor and 1 alpha-hydroxylase in human brain. J Chem Neuroanat. (2005) 29:21–30. doi: 10.1016/j.jchemneu.2004.08.006
37. Gáll, Z, and Székely, O. Role of Vitamin D in cognitive dysfunction: new molecular concepts and discrepancies between animal and human findings. Nutrients. (2021) 13. doi: 10.3390/nu13113672
38. Forouhi, NG, Menon, RK, Sharp, SJ, Mannan, N, Timms, PM, Martineau, AR, et al. Effects of Vitamin D2 or D3 supplementation on Glycaemic control and Cardiometabolic risk among people at risk of type 2 diabetes: results of a randomized double-blind placebo-controlled trial. Diabetes Obes Metab. (2016) 18:392–400. doi: 10.1111/dom.12625
39. Armas, LA, Hollis, BW, and Heaney, RP. Vitamin D2 is much less effective than Vitamin D3 in humans. J Clin Endocrinol Metab. (2004) 89:5387–91. doi: 10.1210/jc.2004-0360
40. Martineau, AR, Thummel, KE, Wang, Z, Jolliffe, DA, Boucher, BJ, Griffin, SJ, et al. Differential effects of Oral boluses of Vitamin D2 vs Vitamin D3 on Vitamin D metabolism: a randomized controlled trial. J Clin Endocrinol Metab. (2019) 104:5831–9. doi: 10.1210/jc.2019-00207
41. Wang, M, Zhou, T, Li, X, Ma, H, Liang, Z, Fonseca, VA, et al. Baseline Vitamin D status, sleep patterns, and the risk of incident type 2 diabetes in data from the UK biobank study. Diabetes Care. (2020) 43:2776–84. doi: 10.2337/dc20-1109
42. Colotta, F, Jansson, B, and Bonelli, F. Modulation of inflammatory and immune responses by Vitamin D. J Autoimmun. (2017) 85:78–97. doi: 10.1016/j.jaut.2017.07.007
Keywords: hearing loss, 25-hydroxyvitamin D3, 25-hydroxyvitamin D2, L-shaped association, dose–response
Citation: Chen F, Gao Y, Wang Y, Pan Z, Chen Y, Sheng H, Chen Q and Ye F (2024) Association of serum 25-hydroxyvitamins D2 and D3 with hearing loss in US adults: analysis from National Health and Nutrition Examination Survey, 2015–2016. Front. Nutr. 11:1390953. doi: 10.3389/fnut.2024.1390953
Edited by:
Silvia Lai, Sapienza University of Rome, ItalyReviewed by:
Mohamed Abouzid, Poznan University of Medical Sciences, PolandLuca Salomone, Sapienza University of Rome, Italy
Ruijie Xie, University of South China, China
Copyright © 2024 Chen, Gao, Wang, Pan, Chen, Sheng, Chen and Ye. This is an open-access article distributed under the terms of the Creative Commons Attribution License (CC BY). The use, distribution or reproduction in other forums is permitted, provided the original author(s) and the copyright owner(s) are credited and that the original publication in this journal is cited, in accordance with accepted academic practice. No use, distribution or reproduction is permitted which does not comply with these terms.
*Correspondence: Fan Ye, eWZ5ZnlmcHBAMTYzLmNvbQ==
†These authors share first authorship