
94% of researchers rate our articles as excellent or good
Learn more about the work of our research integrity team to safeguard the quality of each article we publish.
Find out more
ORIGINAL RESEARCH article
Front. Nutr. , 16 May 2024
Sec. Nutritional Epidemiology
Volume 11 - 2024 | https://doi.org/10.3389/fnut.2024.1374845
 Werkneh Melkie Tilahun1*
 Mulat Belay Simegn1
 Habtamu Geremew2
 Zenebe Abebe Gebreegziabher3
 Lamrot Yohannes Abay4
 Tigabu Kidie Tesfie5
Background: After 6 months, nutrient-dense, varied diets containing fruits and vegetables are crucial to supplement breastfeeding. Like many other low-income countries, Ethiopia has very low FV consumption. Zero vegetable or fruit (ZVF) consumption has been shown to significantly raise the risk of non-communicable diseases and has been ranked among the top 10 risk factors for mortality. And it is associated with poor health, an increased risk of obesity, and a higher risk of non-communicable diseases. Thus, this study’s goal was to investigate the spatial distribution of ZVF consumption and its spatial determinants among children aged 6–23 months in Ethiopia.
Methods: A cross-sectional study design was employed. A total of 1,489 weighted samples were included from kids’ datasets from the 2019 Ethiopian mini-demographic and health survey. STATA version 16, ArcGIS version 10.8, Kuldorff’s SaTScan version 9.6, and MGWR version 2.0 software were used for analysis. Spatial regression analyses (geographical weighted regression and ordinary least squares analysis) were conducted. Models were compared using AICc and adjusted R2. A p-value of less than 0.05 was used to declare statistically significant spatial predictors, and the corresponding local coefficients were mapped.
Results: The spatial distribution of ZVF consumption among children aged 6–23 months was non-random in Ethiopia. Spatial scan analysis revealed a total of 120 significant clusters. Maternal education, wealth status, age of the child, place of delivery, number of under-five children in the house, and current pregnancy status were significant predictors of the spatial variation of ZVF consumption.
Conclusion: Significant geographic variation in ZVF consumption was found in this study throughout Ethiopia’s regions. Significant predictors of the spatial variation in ZVF consumption were maternal education, wealth status, child age, place of delivery, number of under-five children in the home, and status as a pregnant woman at the time of birth. Therefore, in order to improve children’s adequate consumption of fruit and vegetables, area-based interventions that can consider these significant factors into account are needed.
A balanced diet should include a variety of fruits and vegetables (FV) since they are excellent providers of dietary fiber, vitamins, and minerals, as well as a number of other helpful non-nutrients like flavonoids, plant sterols, and other antioxidants. Eating them contributes to making sure that several of these vital elements are taken in sufficient amounts (1). It is recommended to have one vegetable serving with every meal, and consuming no FV at all is an unhealthy practice, even if there is no consensus recommendation for the ideal amount of servings of FV per day for children older than 6 months (2). To enhance general health and lower the risk of certain non-communicable diseases (NCDs), the World Health Organization (WHO) recommends consuming approximately 400 grams of FV daily as part of a healthy diet low in fat, sugar, and sodium (1).
After 6 months, children undergo rapid growth and development, for which breastmilk alone is inadequate. Thus, it’s fundamental to supplement breastfeeding with nutrient-dense, diversified diets that include fruits and vegetables (3, 4). Zero vegetable or fruit consumption (ZVF), which is one of many elements of minimum dietary diversity (MDD), is a novel metric introduced by the United Nations Children’s Fund (WHO-UNICEF) to assess infant and young child feeding (IYCF). ZVF measures the proportion of children between the ages of 6 and 23 months who have not consumed any vegetables or fruits in the 24 h prior to the query (3).
It was discovered that 90.22% of Ethiopians engaged in poor child feeding practices (5). Although there was a notable 9% rise in minimum dietary diversity from 2011 to 2016 and a 3.4% reduction in the same period, only 4.1% of Ethiopian children aged 6–23 months were fed the minimum permissible diet (6).
With West and Central Africa having the greatest incidence (56.1%) and Latin America and the Caribbean having the lowest (34.5%), the global prevalence of ZVF consumption was 45.7% (3). Like many other low-income countries, Ethiopia has very low FV consumption (7–10). According to one study, 1.5% of Ethiopians consume FV (10), and 69.3% of children in Ethiopia between the ages of 6 and 23 months consume ZVF (11). According to a study done in Southern Ethiopia, 7.2 and 39.1% of the children consumed FV rich in vitamin A, respectively (12), while a study done using nationally representative data showed that 28.2 and 10.3% of children consumed both vitamin A-rich and other FV (13). In 2019, this prevalence rose to 39% (14).
Zero vegetable or fruit consumption during this crucial developing phase has been shown to significantly raise the risk of non-communicable diseases, and WHO-UNICEF has ranked it among the top 10 risk factors for mortality globally (2, 3). Low fruit and vegetable consumption has a major negative influence on public health; globally, it is responsible for 1.7 million (2.8%) deaths and 16 million (1.0%) disability-adjusted life years (DALYs) (15, 16). Another piece of evidence revealed that up to 2.635 million deaths are thought to occur annually worldwide as a result of poor fruit and vegetable consumption (17). In 2017, it was predicted that 3.9 million deaths globally could be attributed to insufficient consumption of fruits and vegetables (2). A lower intake of fruits and vegetables is associated with poor health, an increased risk of obesity (1), and a higher risk of non-communicable diseases such as hypertriglyceridemia, stomach cancer, colorectal cancer, and cardiovascular disorders (1, 9, 15–19). Furthermore, studies revealed that consuming more fruits and green leafy vegetables is linked to a markedly lower risk of type 2 diabetes (20, 21). Furthermore, over half of young Ethiopian children suffer from anemia and micronutrient deficiencies like vitamin A (8). In all, only 13.3% of children in 2011 and 24% in 2016 attained MDD (22), and the nutrition quality of infants and young children in Ethiopia between the ages of 6 and 23 months was impacted by these incorrect complementary feeding methods (5).
Previous studies conducted in Ethiopia revealed inappropriate child feeding practices (5), poor vitamin A-rich food intake (14), and dietary diversity (22, 23) among children was distributed non-randomly across Ethiopia’s regions. Spatial variation of folate nutrition (24) and crop diversity in agroforestry home gardens (25) was observed between farming systems in Ethiopia. A study conducted using the 2019 Ethiopian mini-demographic and health survey data revealed that factors such as middle and rich household wealth quintile, 25–34 maternal age, Muslim religion, having more than four ANC visits during pregnancy, children in the age group of 12–23 months negatively and being married, and health facility delivery positively associated significantly with children’s ZVF consumption (11).
Despite the fact that variations in crop diversity and availability, non-random distribution of dietary diversity, consumption of foods high in vitamin A, and inappropriate feeding practices for infants are indicated, there is no evidence to determine the spatial distribution of ZVF consumption across Ethiopia’s regions. Investigating the spatial distribution of ZVF consumption across Ethiopian regions is advantageous for targeting undernutrition, ensuring proper child feeding practices, and lowering morbidity and mortality from non-communicable diseases in later life.
This study aimed to investigate the spatial distribution of ZVF consumption and its spatial determinants among children aged 6–23 months in Ethiopia.
This study has been conducted based on the 2019 Ethiopian mini-demographic and health survey (EMDHS) dataset, a nationally representative household survey conducted between March 21 and June 28, 2019. The survey was collected across the nine regions and two city administrations that were available at the time of data collection. As part of the sample frame, 149,093 enumeration areas (EAs) were created for the 2019 Ethiopian Population and Housing Census (EPHC). To select participants, a two-stage stratified sampling technique was used. A total of 305 EAs (93 in urban and 212 in rural areas) were chosen in the first stage using a probability proportionate to the size of the EA (based on the 2019 EPHC frame). An equal allocation method was used to choose the sample, and 25 EAs were chosen from eight areas. However, from the three major regions (Amhara, Oromia, and the Southern Nations, Nationalities, and Peoples’ Region (SNNPR)), 35 EAs were chosen. During the second round of choosing, a set number of thirty households were chosen with an equal chance of systematic selection. Interviews were conducted with all females aged 15 to 49 who either lived permanently in the chosen households or were guests who spent the night before the study. Children aged 0 to 59 months had their anthropometric measurements taken in each of the chosen households, and women between the ages of 15 and 49 were questioned (26). Children aged 6–23 months were included. Thus a total of 1,489 weighted sample from Kids Record (KR) file were included. The data were derived from1 based on online request and permission.
Our dependent variable was ZVF consumption among children aged 6–23 months. Percentage of children aged 6–23 months who did not consume any vegetables or fruits during the previous day. This indicator is based on consumption of vitamin A-rich fruits and vegetables and other fruits and vegetables described in the MDD indicator above. These were part of the 24 h dietary recall used to estimate MDD in the DHS data set. Children were counted if there was no consumption of either food group (15, 27).
The explanatory variables included in our study were based on their significance in the previous study conducted on similar data, and such variables were wealth index, maternal age, ANC visits during pregnancy, age of the child, marital status, place of delivery (11), and recommendations from experts (nutritionists and clinical midwives) such as current pregnancy, current breast feeding status, place of residence, maternal education, postnatal care, age at first birth, sex of household head, altitude, and number of under-five children in the house.
The variables considered and the proportion calculated for the analysis were presented in Table 1.
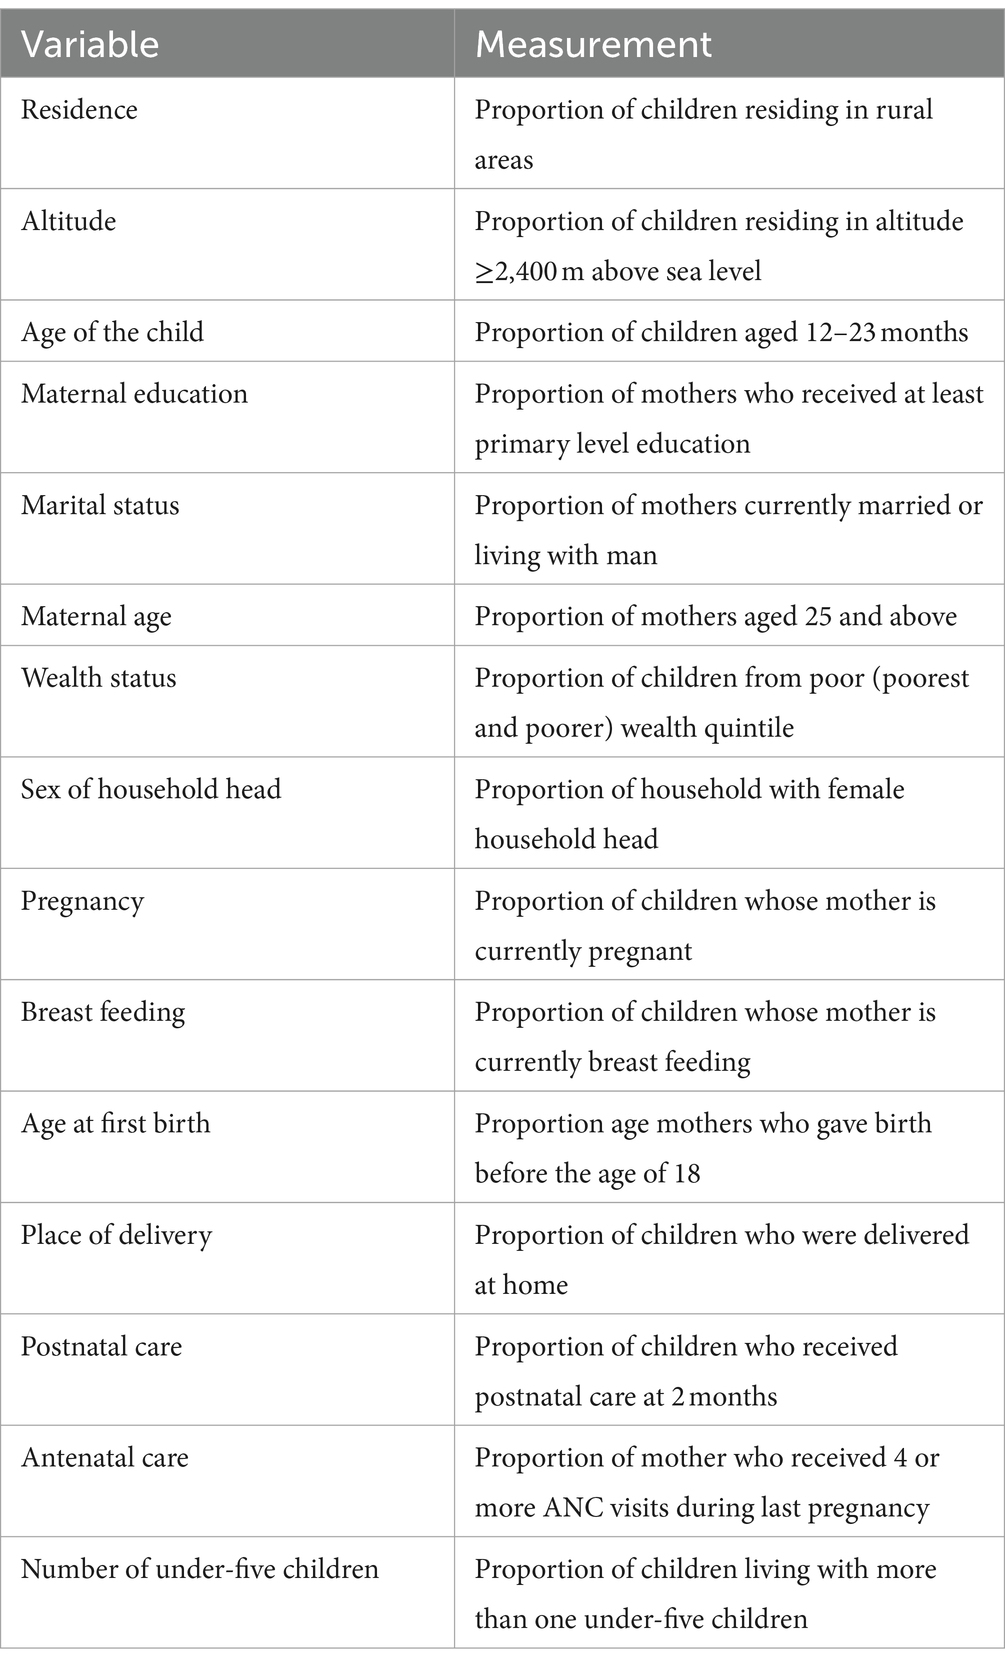
Table 1. Measurements of explanatory variables in the study, 2019 EMDHS.
The MEASURE DHS website provided the data. Excel, Stata version 16, Arc-GIS version 10.7, and MGWR version 2.0 were statistical software that were utilized for data extraction, re-coding, visualization, and other statistical analysis. The study utilized descriptive statistics, and the findings were displayed through the use of text, figures, and tables.
Global Moran’s I has been used to identify patterns with significant clustering (28). The value is in the interval-1 to 1. If Moran’s I value is zero, values around +1 suggest that the event was randomly distributed and clustered, while values near −1 imply that the event was scattered. Based on statistically significant global Moran’s I (p < 0.05) (29), spatial autocorrelation is verified. To determine if the pattern revealed by our data is clustered, distributed, or random, we looked into the spatial pattern of ZVF among Ethiopian children aged 6 to 23 months.
Estimating the distribution of events at the local level enables us to examine spatial relations in the study area. Local indicators of spatial autocorrelation, such as the Gettis-Ord Gi*statistic, which identifies statistically significant hot and cold spots by computing a Z score and p-value for each grid cell, provide us with more information (30). Usually represented as the ratio of the total values in a given region to the total values, statistical significance is set at a certain confidence level (31).
The hot spot analysis was eventually smoothed using an empirical Bayesian Kriging interpolation mapping technique to predict the potential value of un-sampled areas for ZVF among Ethiopian children aged 6–23 months. Because the Bayesian method can reduce the number of false positives and negatives by 50% when compared to conventional methods (31).
Using Kuldorff’s SaTScan version 9.6 software, a Bernoulli-based model spatial scan analysis was carried out to find important primary and secondary clusters of ZVF in Ethiopian children aged 6 to 23 months. In a circular scanning window spanning the Ethiopian region, children who had not consumed any fruit or vegetables over the previous 24 h were classified as cases, whereas those who consumed them were classified as controls. An upper bound was set at a maximum spatial cluster size of less than 50% of the population. Using likelihood ratio tests and matching significance levels based on the default 999 Monte Carlo replications, the most likely clusters were found.
Spatial regression is necessary to comprehend the relationship between the density of specific events and other environmental, demographic, and socioeconomic aspects (32). Therefore, our objective was to understand how other explanatory variables and the prevalence of ZVF consumption among children aged 6–23 months relate to each other.
This regression evaluates all possible combinations of candidate explanatory variables that best explain the dependent variable within the context of user-specified criteria (33). Thus, possible combinations that can best explain the geographical variation of the outcome variable were first determined. Then, OLS regression was performed and Checks were made on model diagnostics such R2, adjusted R2, VIF, Jarque-Bera statistic, joint F, joint Wald, and Koenker (BP) statistic.
The amount of variation in the desired outcome that the explanatory variables in the model could account for was measured using adjusted R2. The joint F and Wald statistics show the overall model’s significance. If the Koenker statistic is significant (p < 0.01), the Wald statistic is a better assessment. The model’s prediction reliability is indicated by the Jarque Bera statistic, which shows that non-random model residuals show a substantial Jarque Bera statistic. The consistency of the spatial processes was evaluated by the Koenker statistic. If it is significant, non-stationarity is the reason. The existence of redundant variables in the model is taken into account by the variance inflation factor (34). Spatial autocorrelation in the residuals was checked. The proved unreliable because residuals were sufficiently autocorrelated. The modeling process was spatially non-stationary or heterogeneous. Consequently, it is essential to use GWR to produce accurate estimates.
For each cluster, the total proportion of ZVF consumption and predictor variables was determined. The GWR utilized dependent and explanatory variables that were similar to those included in the global model. Software called Multiscale Geographically Weighted Regression (MGWR) version 2.0 was used to calibrate the GWR model’s parameter estimates. Weights are determined by a method known as the kernel distance decay function (35). Selecting the kernel type is primarily based on the feature’s spatial configuration. Given that the observations are clustered, we employed adaptive bi-square kernels for geographical weighting, as this type of kernel is suitable for the given data (36).
One crucial factor to consider in GWR is the bandwidth parameter. The number of neighbors or the distance band determines the amount of smoothing that occurs in the model (35). Because it can reduce model complexity due to the number of variables included in the study and the bandwidth as well, the AICc approach automatically identifies a bandwidth with the least AICc (36). Five explanatory factors were included in our analysis, and considerable clustering was noted. We were therefore interested in utilizing the adaptive kernel type found by the golden section search method based on AICc in order to reduce model complexity. The model with the lowest AICc was found to be the best fit for the estimations of local parameters.
The adjusted R2 and AICc values were used to compare the GWR and OLS models. The ideal model was one with a low AICc and a high adjusted R2 (37). After adjusting for the spatial dependencies found in the OLS model residuals, we lastly tested the spatial autocorrelation of the GWR model’s residuals to see if they were randomly distributed.
Missing data were managed according to the DHS guideline. Thus, the final model was based on complete observation.
Since the study was a secondary data analysis based on publicly accessible DHS records, participant participation and ethical approval were not required. Nevertheless, we asked the MEASURE DHS Program for the data, and we were given permission to download and utilize it.
Our study included a total of 1,489 weighted samples of children aged 6–23 months. More than two-thirds (68.5%) of children’s mothers were aged 25 and above. More than half (55.45%) of the children’s mothers had attended formal education. Almost all (95.44%) of children’s mothers were married. About 57.98% of children were living in a house with more than one under-five children. Majority (71.34%) were living in rural areas of Ethiopia, while about 36.74% were residing in the Oromia region (Table 2).
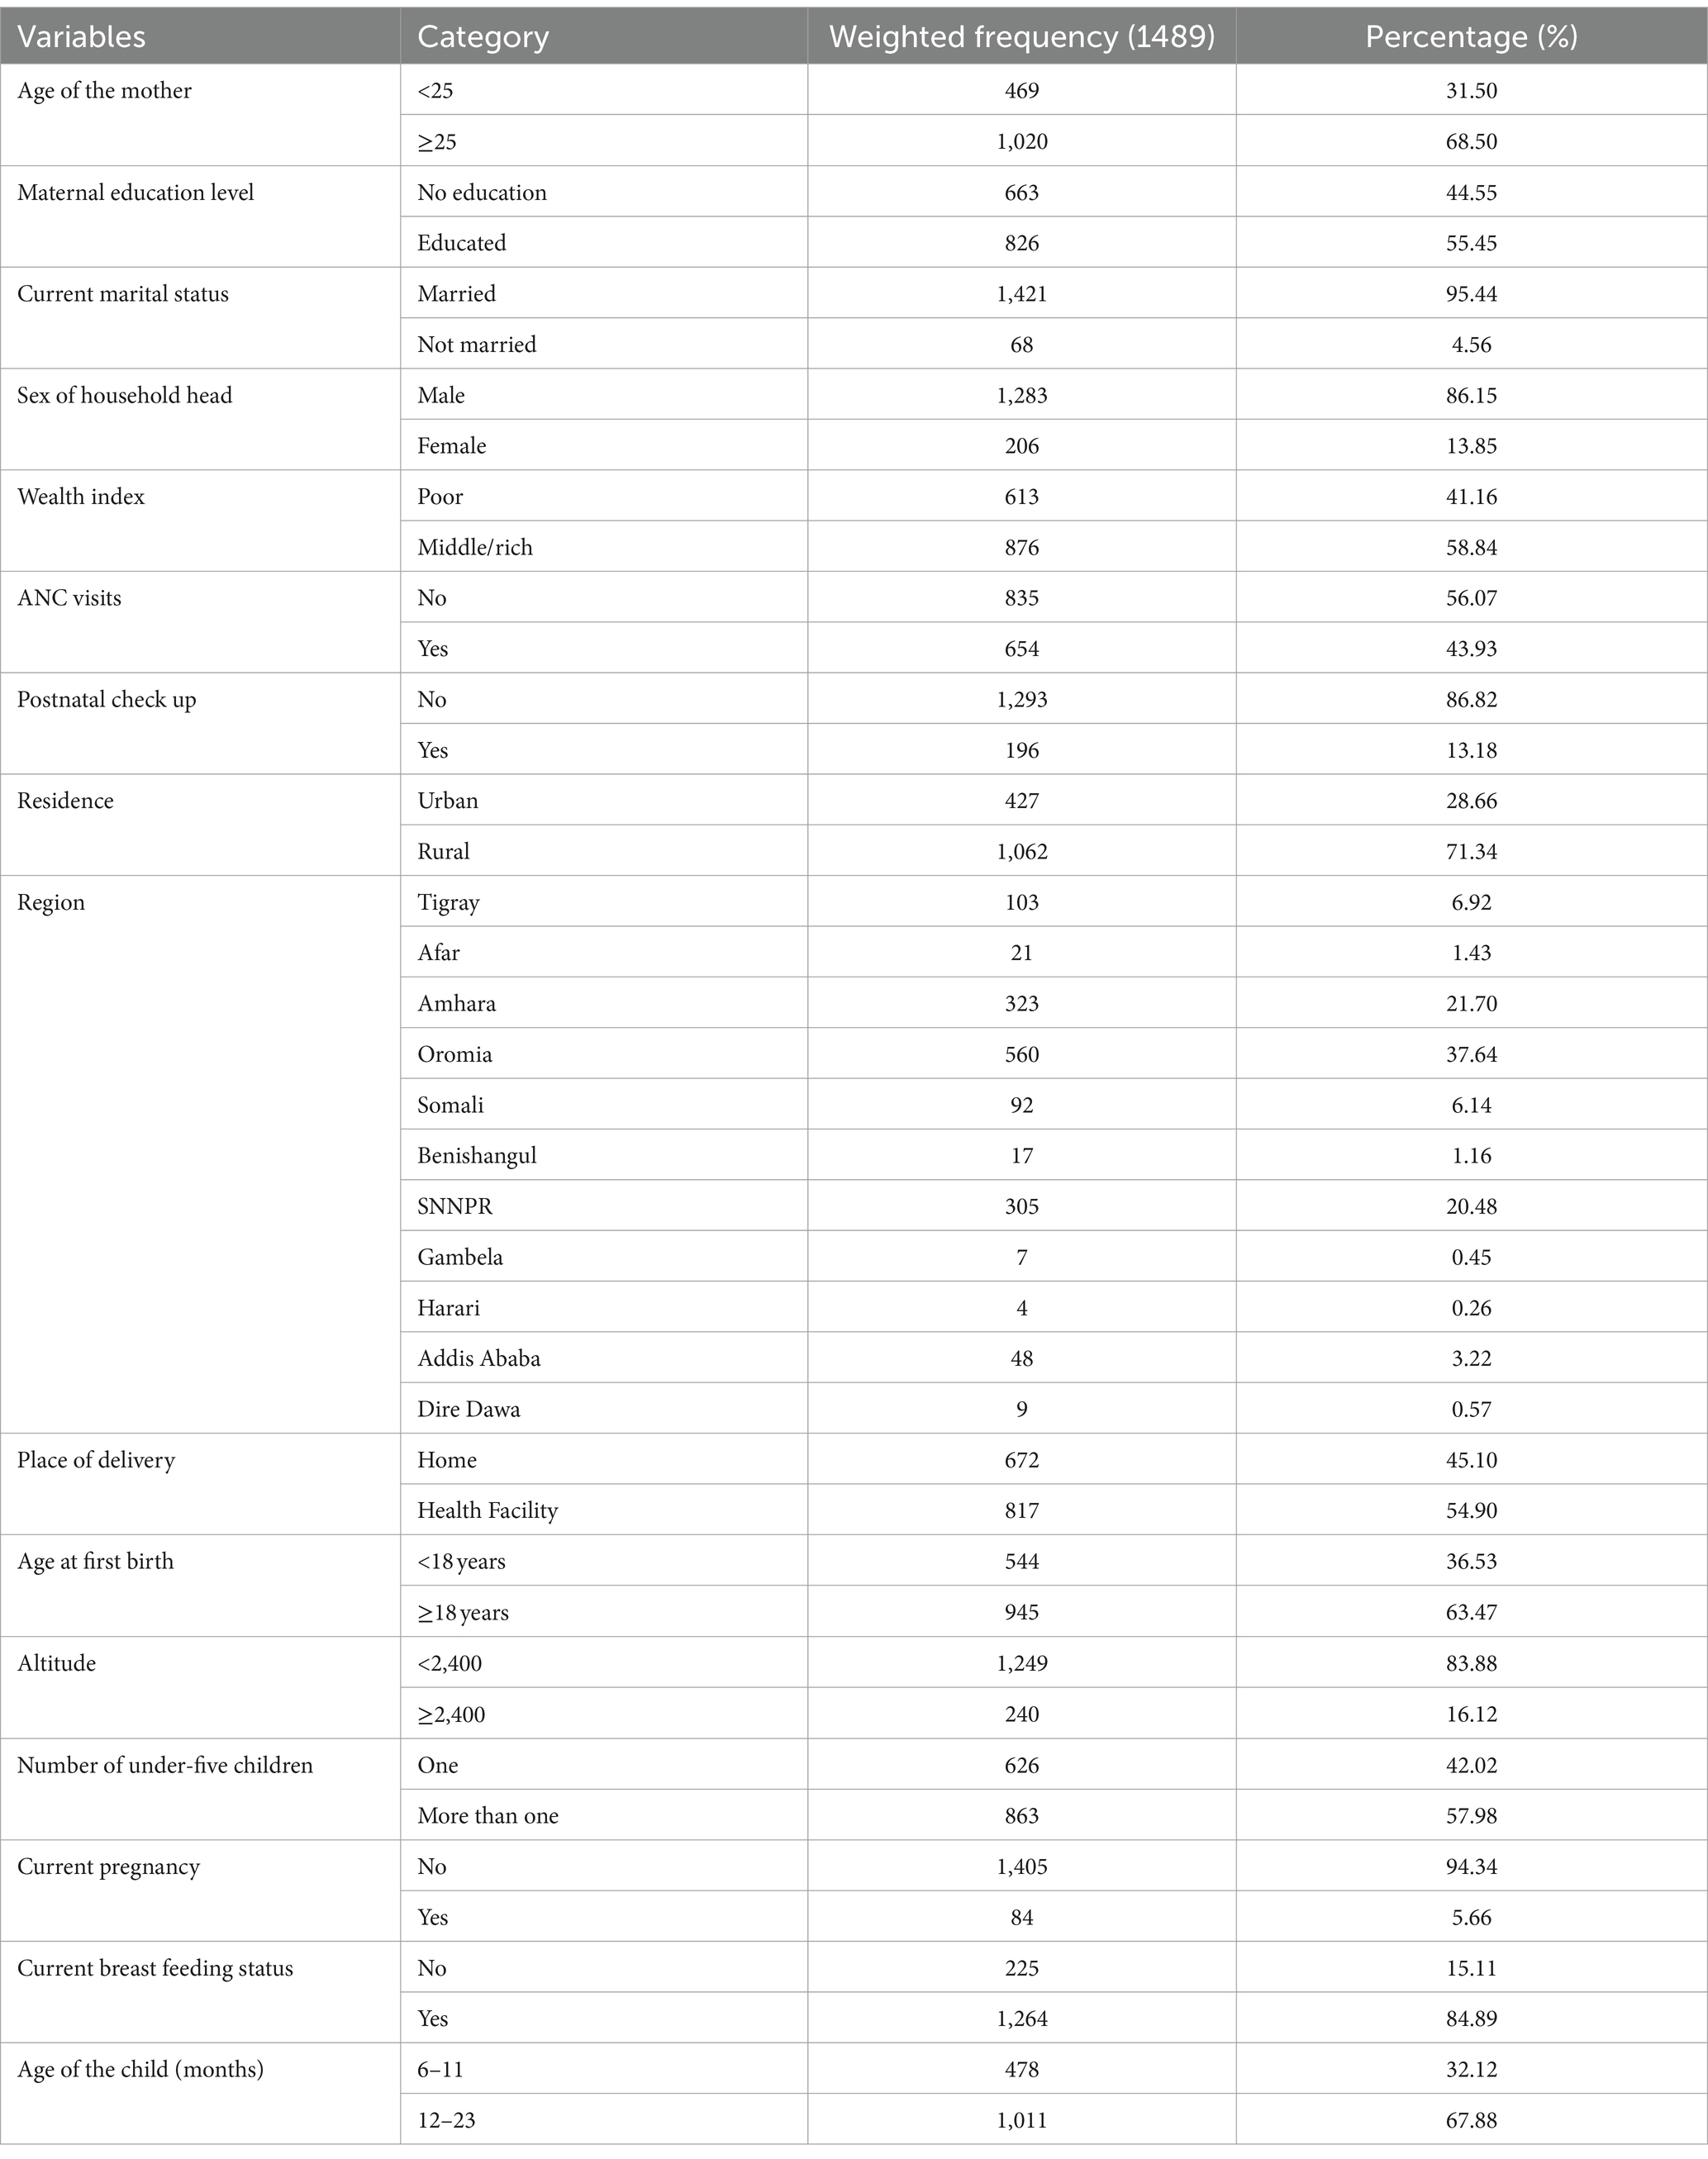
Table 2. Socio-demographic characteristics of the participants and participant’s mothers, Ethiopia, 2019.
Significant spatial clustering of ZVF consumption was observed with a significant global Moran’s index (I) of 0.21 (p-value = 0.000) and a Z-Score of 8.20 (Figure 1). The hot spot analysis using the Getis-Ord Gi* statistics showed significant cold spot areas in Benishangul, Gambela, SNNPR, central Oromia, Dire Dawa, Addis Ababa, some parts of Tigray, and some parts of Hareri (Figure 2). This indicates that there was a clustering of low prevalence of ZVF among children aged 6–23 months in the mentioned areas.
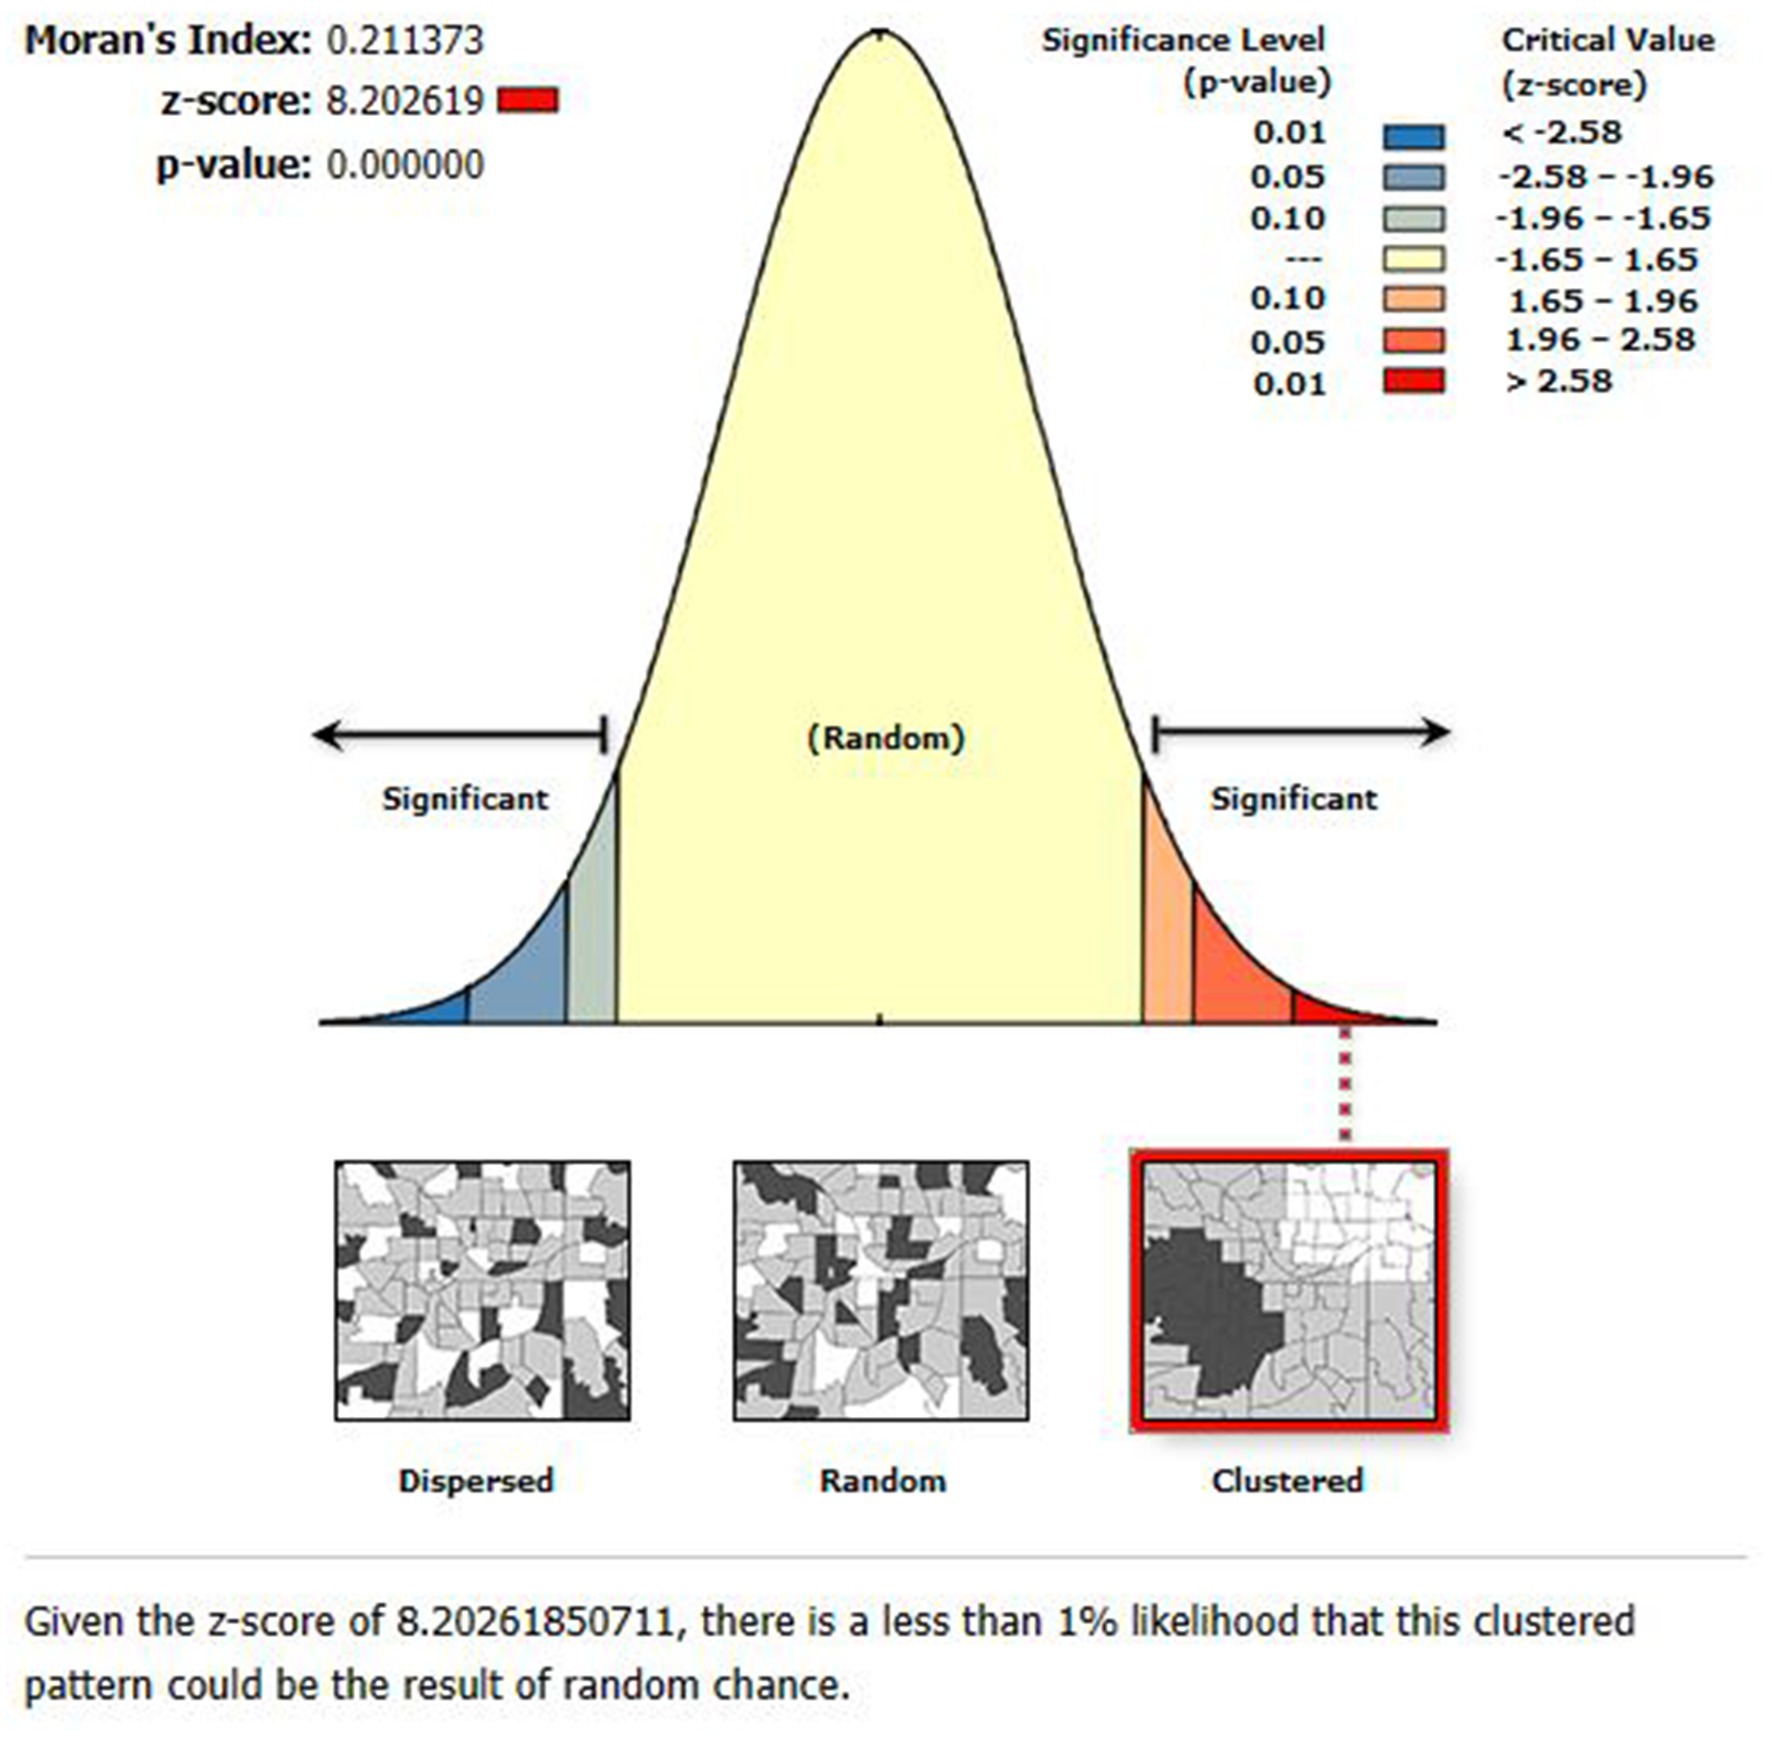
Figure 1. The global spatial autocorrelation analysis of ZVF consumption among children aged 6–23 months in Ethiopia.
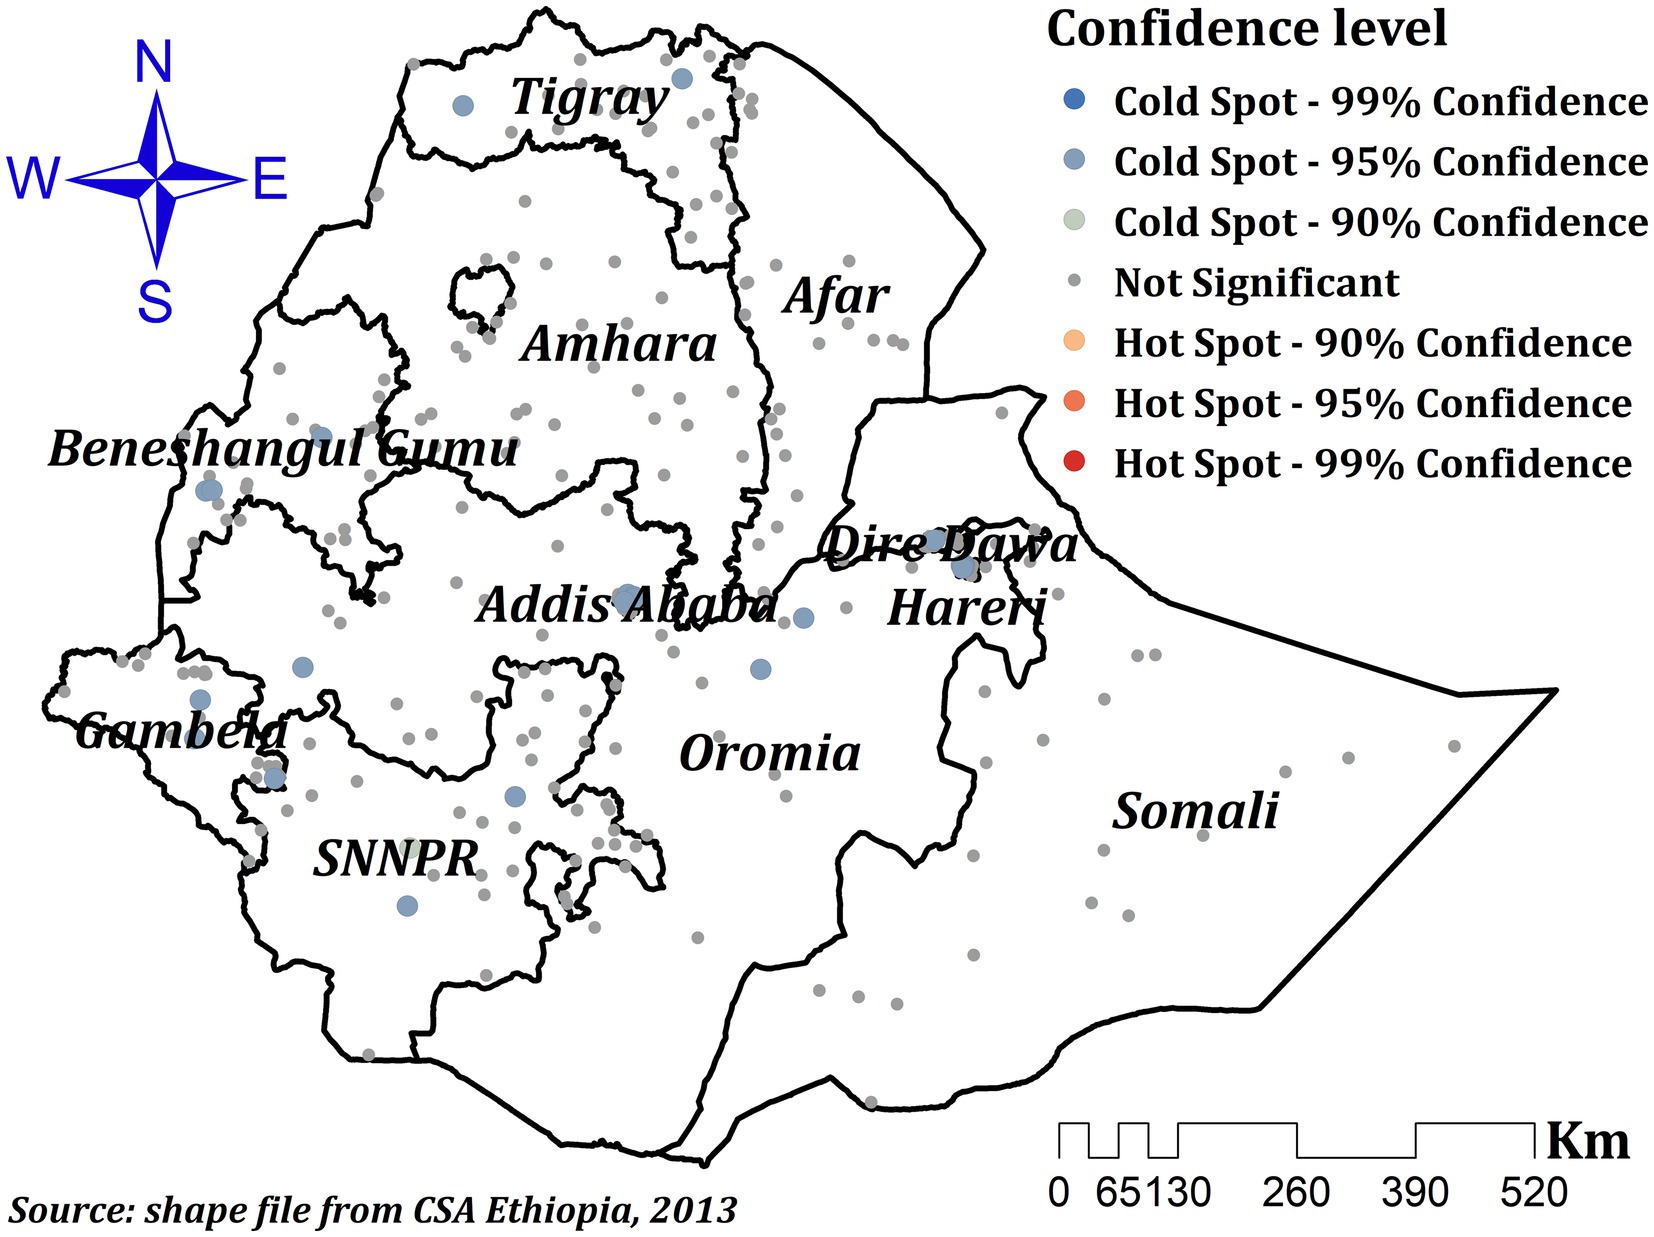
Figure 2. Hot spot analysis of ZVF consumption among children aged 6–23 months in Ethiopia.
For Ethiopian children aged 6–23 months, the empirical Bayesian Kriging interpolation predicted high and low prevalence areas of ZVF consumption. As a result, ZVF consumption was found to be highly clustered throughout Somali, central and southeast Amhara, and western and north-western Afar, whereas the entire region of Gambela, most of western Oromia, the majority of western Benishangul, the majority of SNNPR, and certain areas of northwest Tigray showed the lowest prevalence (Figure 3).
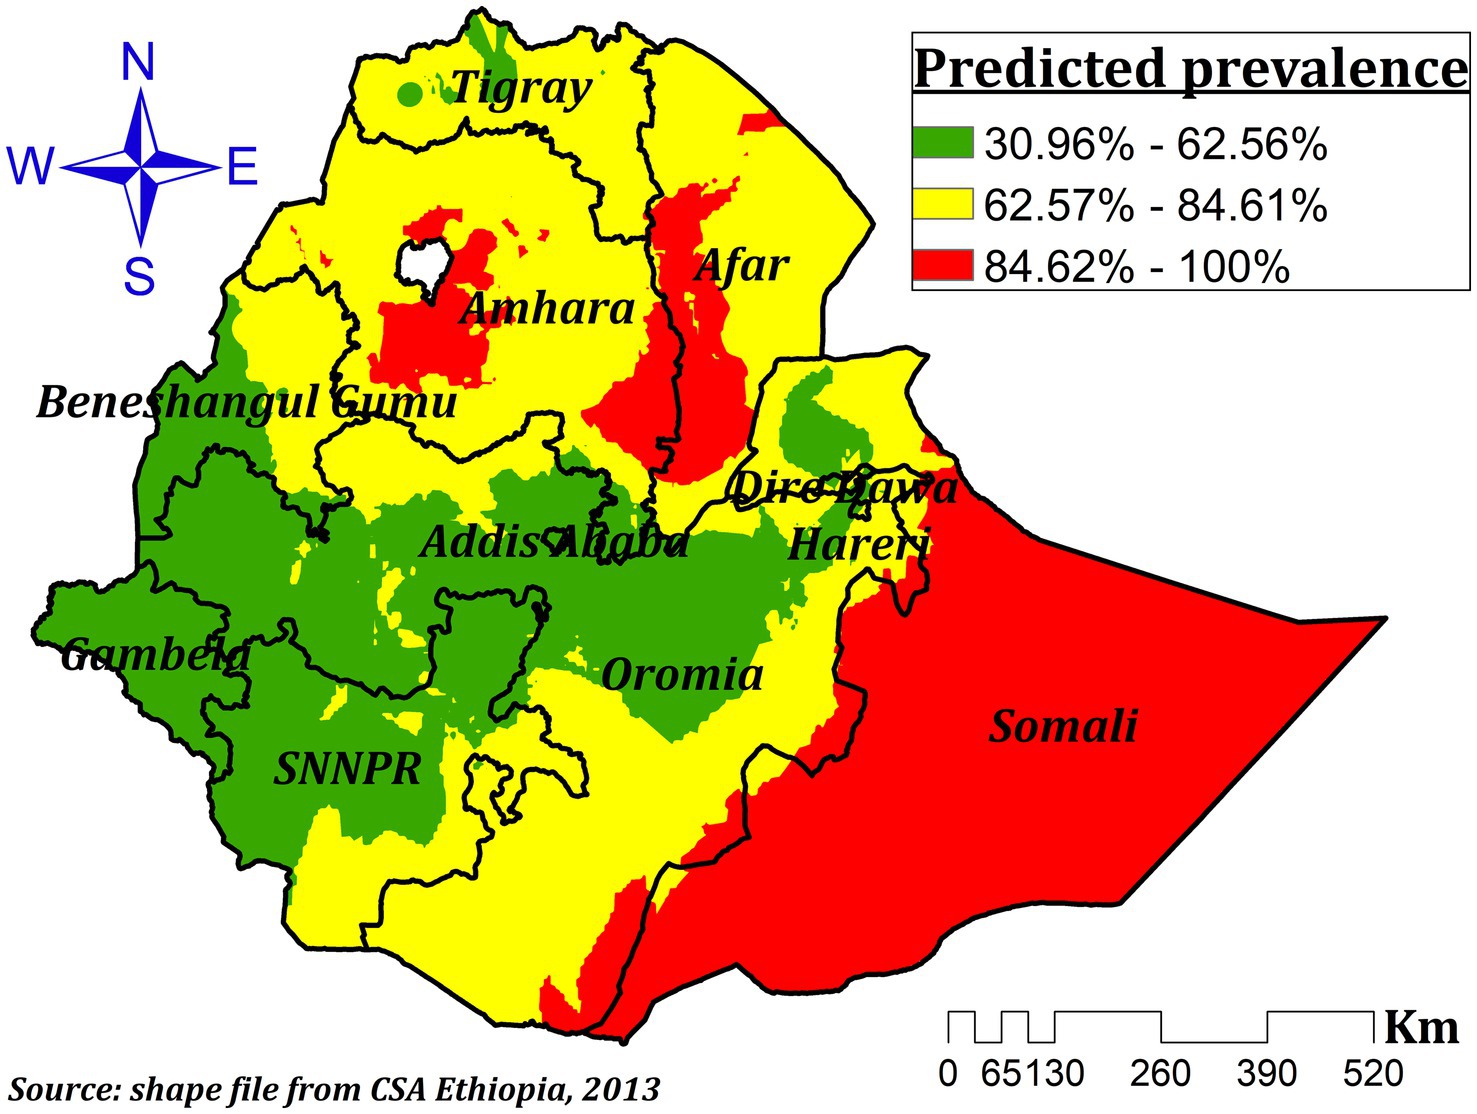
Figure 3. Interpolated prevalence of ZVF consumption among children aged 6–23 months in Ethiopia.
A total of 120 significant clusters were found using spatial scan statistics. Out of those, 96 were secondary clusters and 24 were most likely clusters. The primary clusters were found in Somali, eastern Hareri, and eastern Oromia at 6.639662 N, 44.465855 E/385.91 Km radius (Figure 4). Children residing in these clusters were 46% more likely to have ZVF consumption (RR = 1.46, LLR = 40.46, p-value <0.001) compared to children residing outside the window. The second significant clusters were found at 14.344790 N, 39.167347 E/582.62 Km in Tigray, afar, Amhara, parts of northern Oromia, parts of northeast Somali, and the northern half of Benishangul regions (Figure 4). Children from these areas were 28% more likely to have ZVF consumptions (RR = 1.28, LLR = 26.44, p-value <0.001) than children outside the window (Table 3).
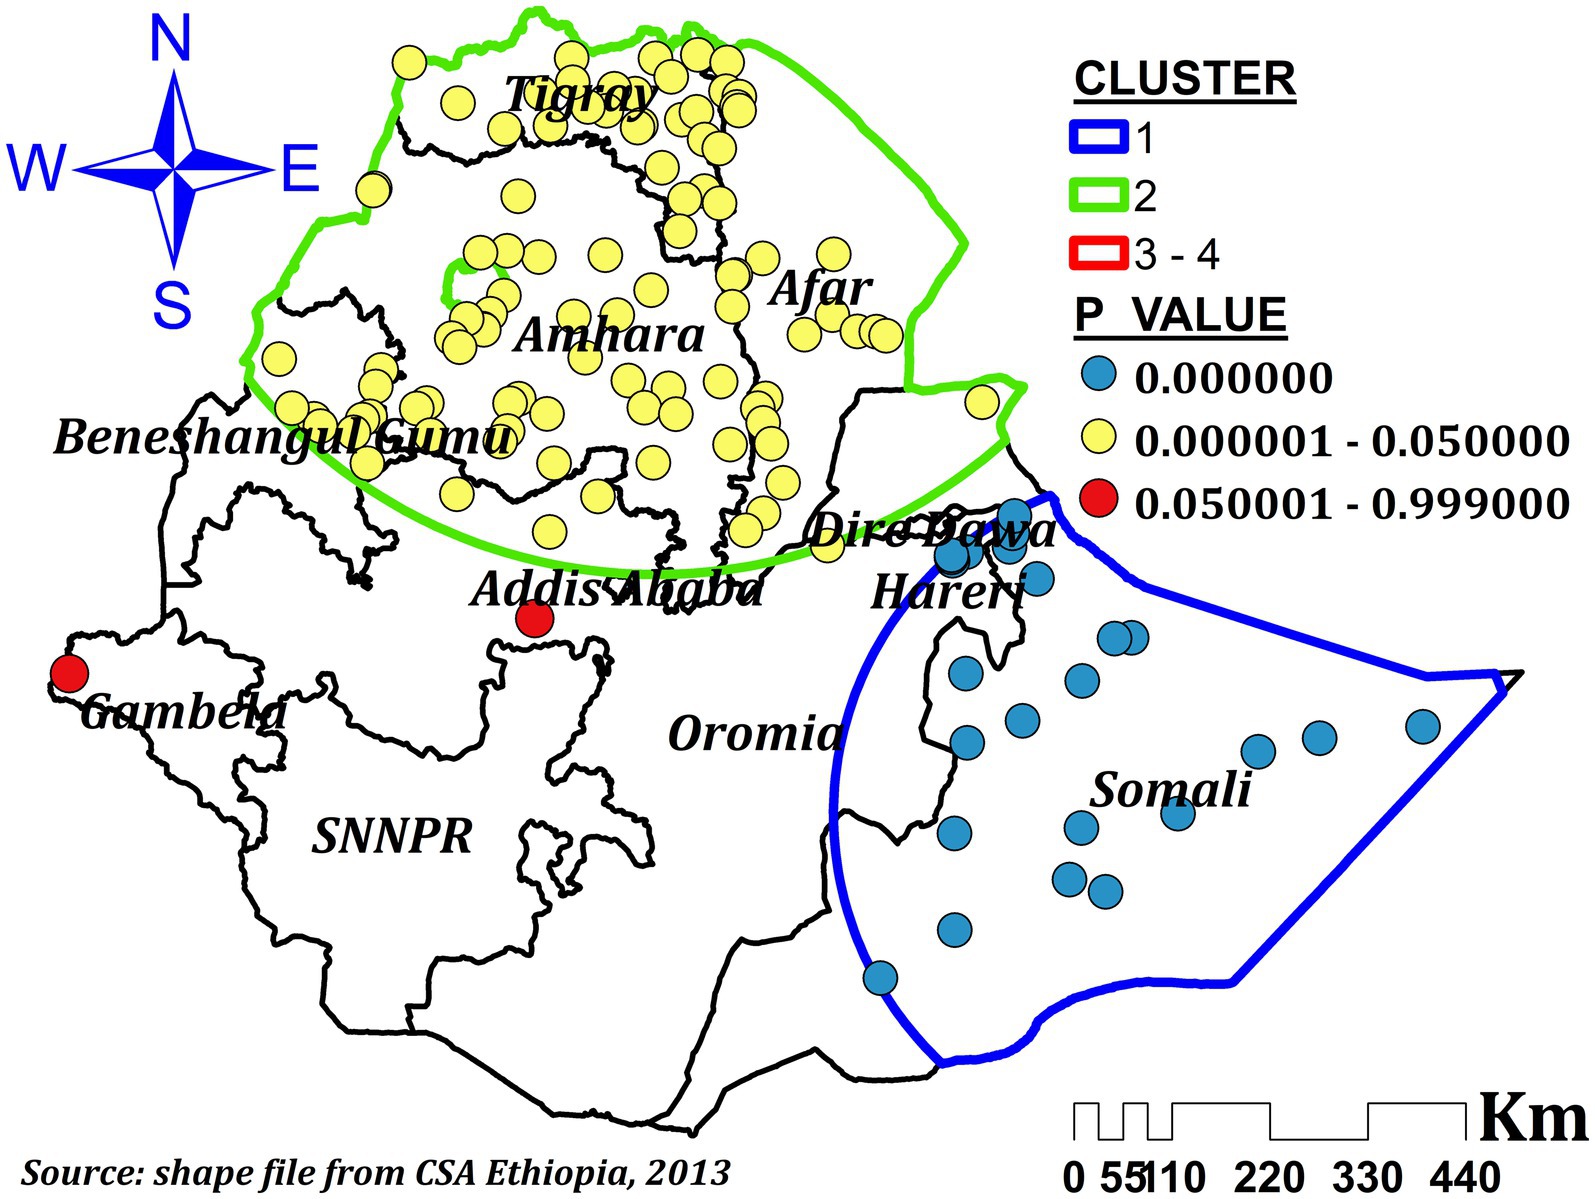
Figure 4. Spatial scan analysis of ZVF consumption among children aged 6–23 months in Ethiopia.
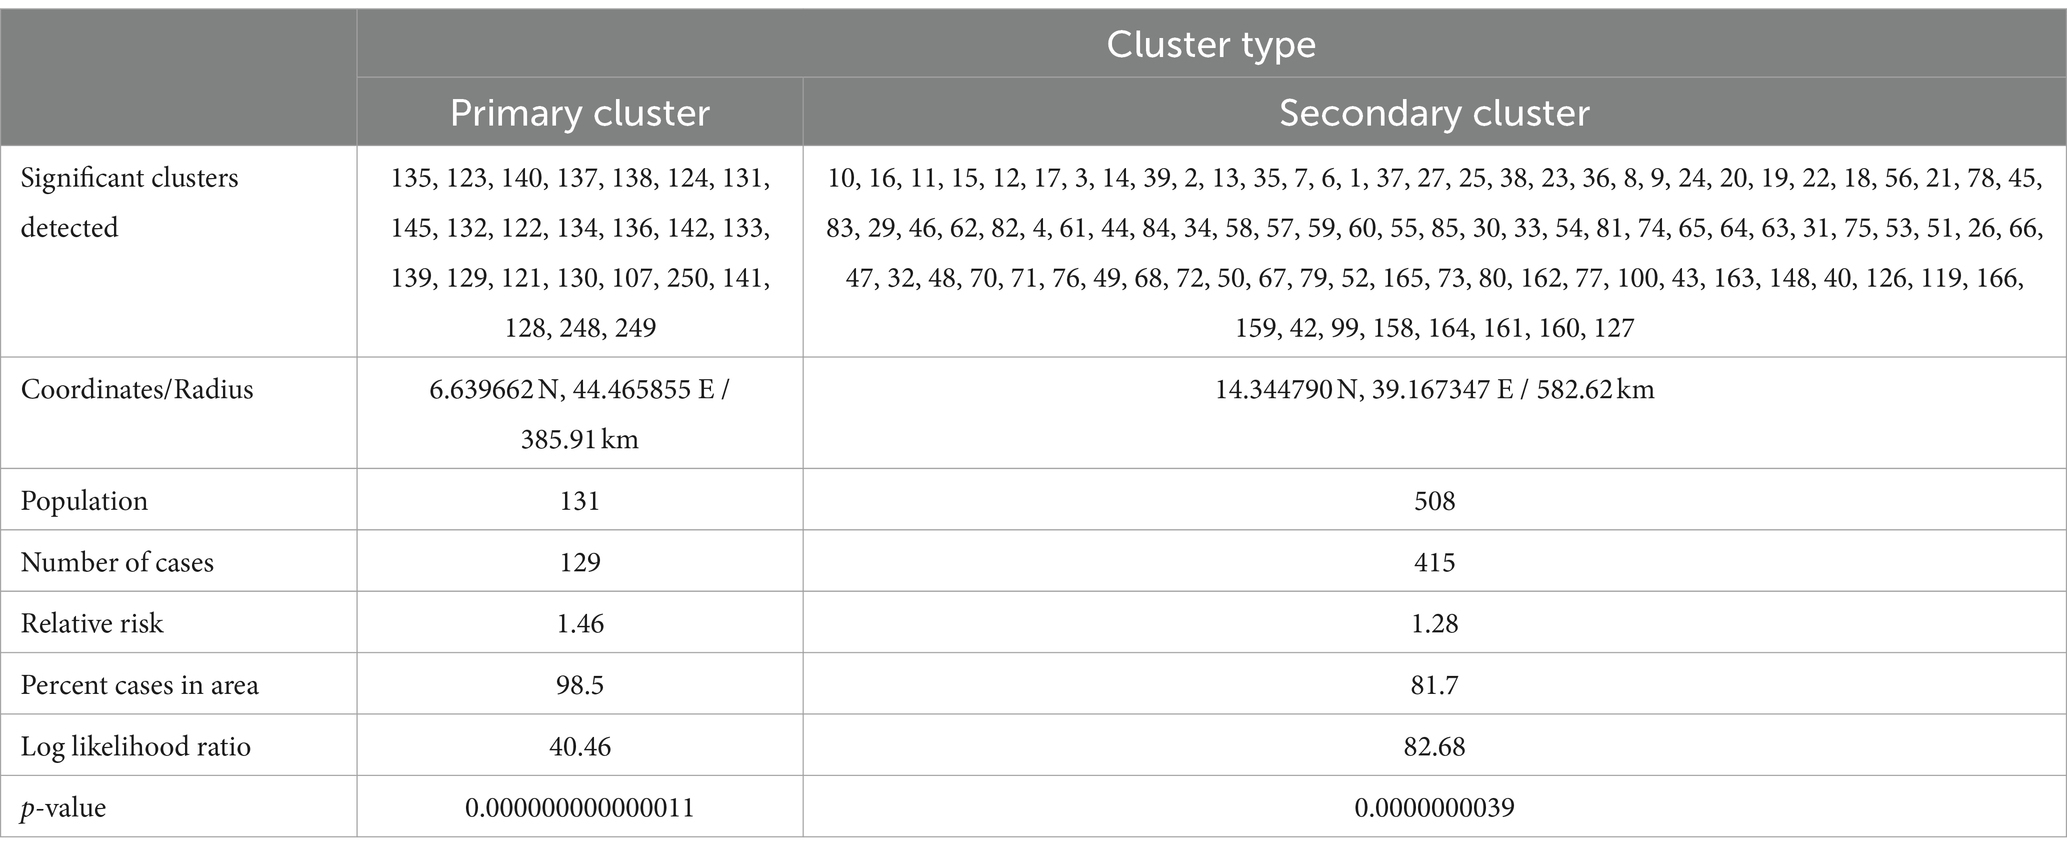
Table 3. Spatial scan analysis results of ZVF consumption among children aged 6–23 months in Ethiopia.
We have used a total of sixteen (16) different significant variables, six from the previous study conducted with similar data (11), and ten other variables in exploratory regression. Accordingly, three possible combinations resulted, and we compared their OLS regression results with the corresponding GWR results. Finally, one combination was found to be a better explanatory and well-designed model. These combinations were proportions of children living with pregnant mothers, educated mothers, children of age 12–23, children delivered at home, and children living with more than one under five children in the house. Thus, our OLS as well as the GWR model considered only these mentioned variables.
A significant combined F and Wald statistic from the OLS model suggests that the model as a whole is significant. The Jarque Bera statistic was significant (p = 0.019), indicating that the residuals were not distributed randomly across areas and that the model’s anticipated values were skewed. Breusch-Pagan hetroscedasticity coefficient, as revealed by the Koenker statistic, was statistically significant (p = 0.000) (Table 4). It suggests that, as a result of hetroscedasticity or non-stationarity, there is an inconsistent relationship between the proportion of ZVF consumption and other explanatory variables. One of the assumptions of OLS regression analysis was violated when the spatial autocorrelation of the residuals from the OLS model was not independent and was identically distributed (substantially auto-correlated). Consequently, the OLS regression’s findings are not trustworthy. We require GWR to account for the spatial autocorrelation and varying relationship across space in order to map area-specific coefficient estimates of explanatory variables that explain the heterogeneity, improve the reliability of the predictions, and account for the heterogeneous relationship of the process in our model. The model’s explanatory variables’ collinearity or redundancy is measured by the Variance Inflation Factor (VIF). The cutoff value for VIF is generally set at 7.5. In light of this, an explanatory variable having a VIF value higher than 7.5 ought to be removed (34). But all of the explanatory variables in our OLS model had a VIF value of less than 7.5, indicating that multicollinearity was not a significant issue for further investigation (Table 4).
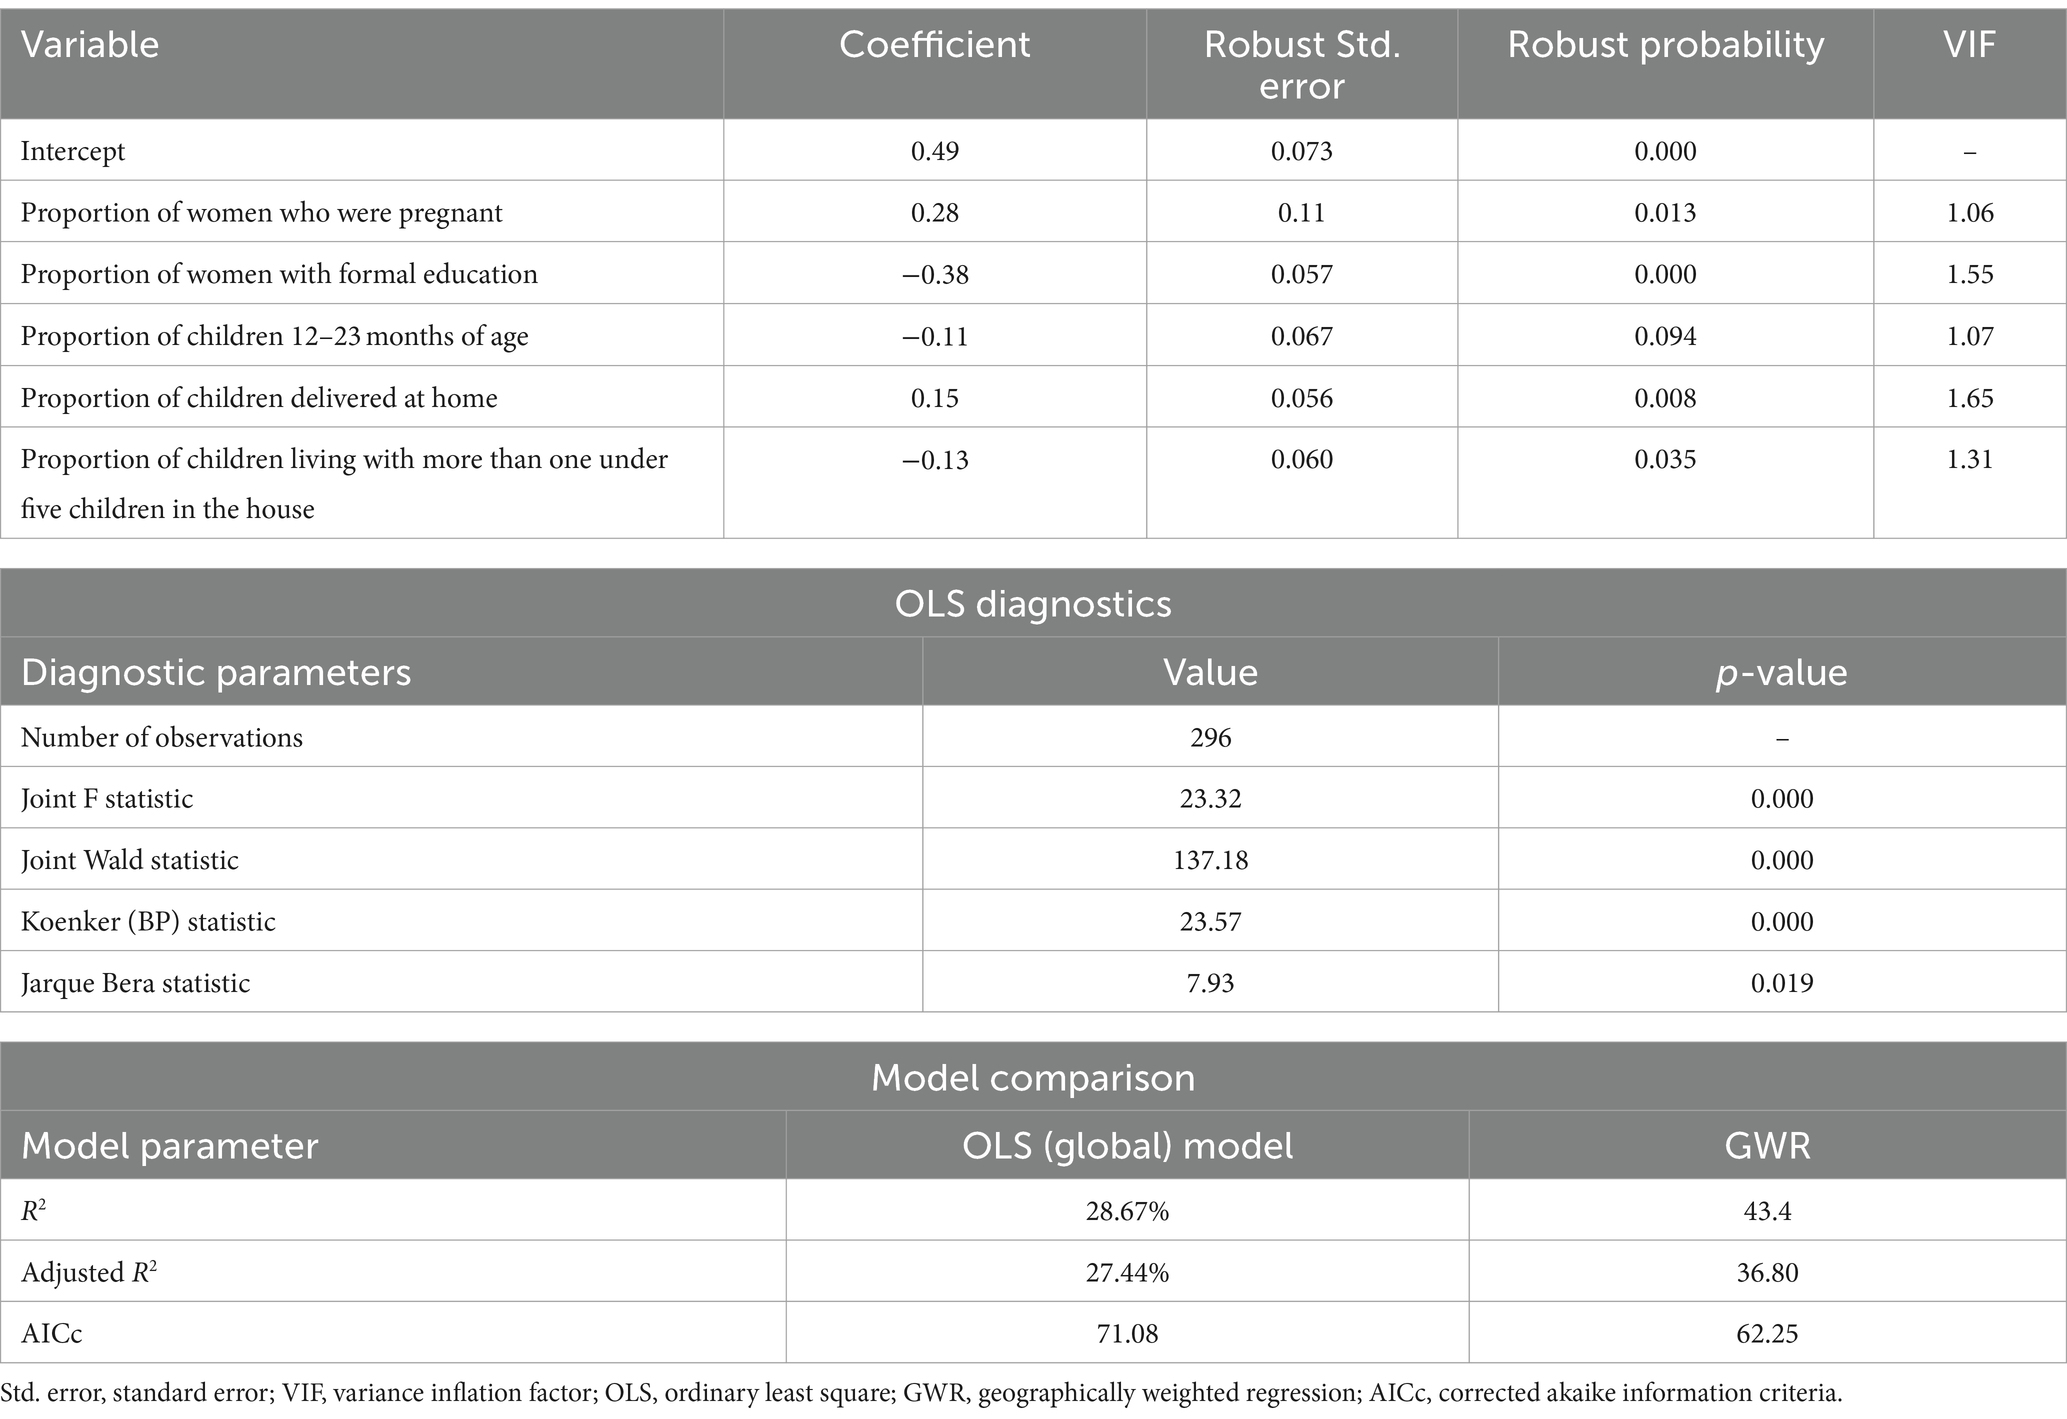
Table 4. The OLS regression analysis results for ZVF consumption among children aged 6–23 months in Ethiopia.
Similar explanatory variables as those in the OLS model were used for the GWR analysis. The GWR model showed better performance than the global OLS model. In the GWR, the adjusted R2 increased from 27.44% in the OLS to 36.80%. This suggests that the GWR model explained an additional 9.36% of the variation in the prevalence of ZVF intake across regions. Furthermore, the GWR showed a drop in the AICc value from 71.08 to 62.25 (difference = 8.83) (Table 4). As a result, the geographical heterogeneity was adequately explained by the GWR model.
We first looked at the residual spatial autocorrelation before interpreting the results of the GWR analysis. Because the residuals’ autocorrelation was randomly distributed following GWR, the residuals’ Moran’s I was-0.028 (p = 0.339). The lack of autocorrelation in Figure 5 suggests that the model was appropriately specified and that the variables taken into account in the model adequately explained the spatial dependencies found in the residuals for the global OLS model.
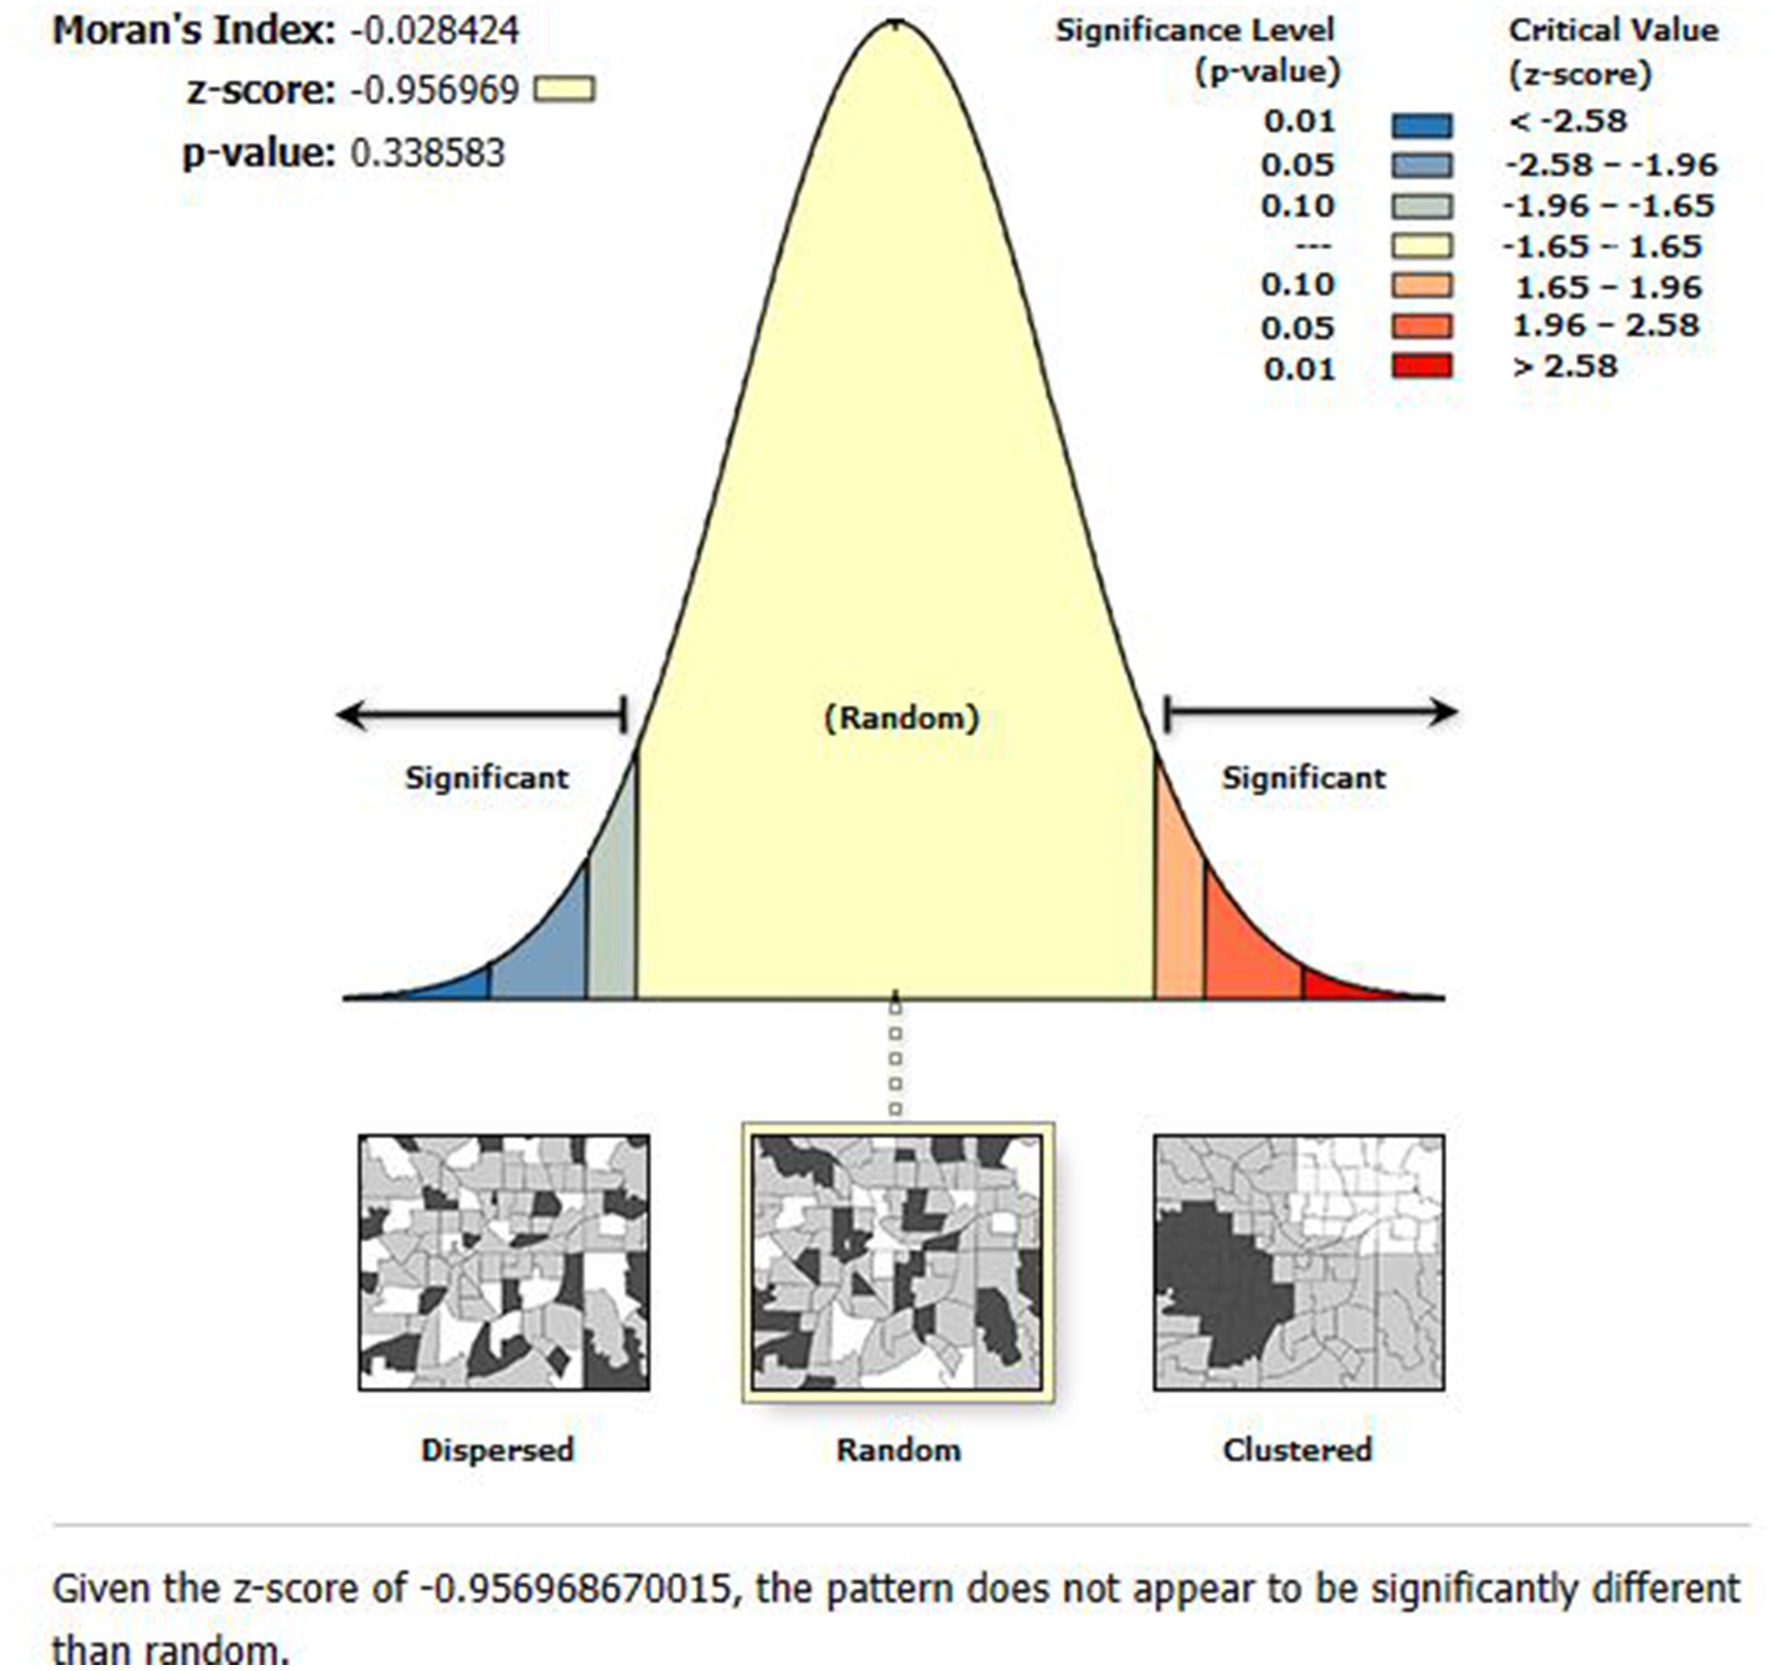
Figure 5. The global spatial autocorrelation analysis of residuals of the GWR model.
Mother education had a negative effect on children’s ZVF intake in our final model (GWR), which ranged from-0.488 to-0.191 and was significant practically everywhere in Ethiopia. According to Figure 6, a 1% increase in the percentage of women with formal education results in a 19.1 to 48.8% drop in ZVF intake among children. The areas of Dire Dawa, Hareri, eastern Oromia, and southwest Somalia showed the strongest protective effects.
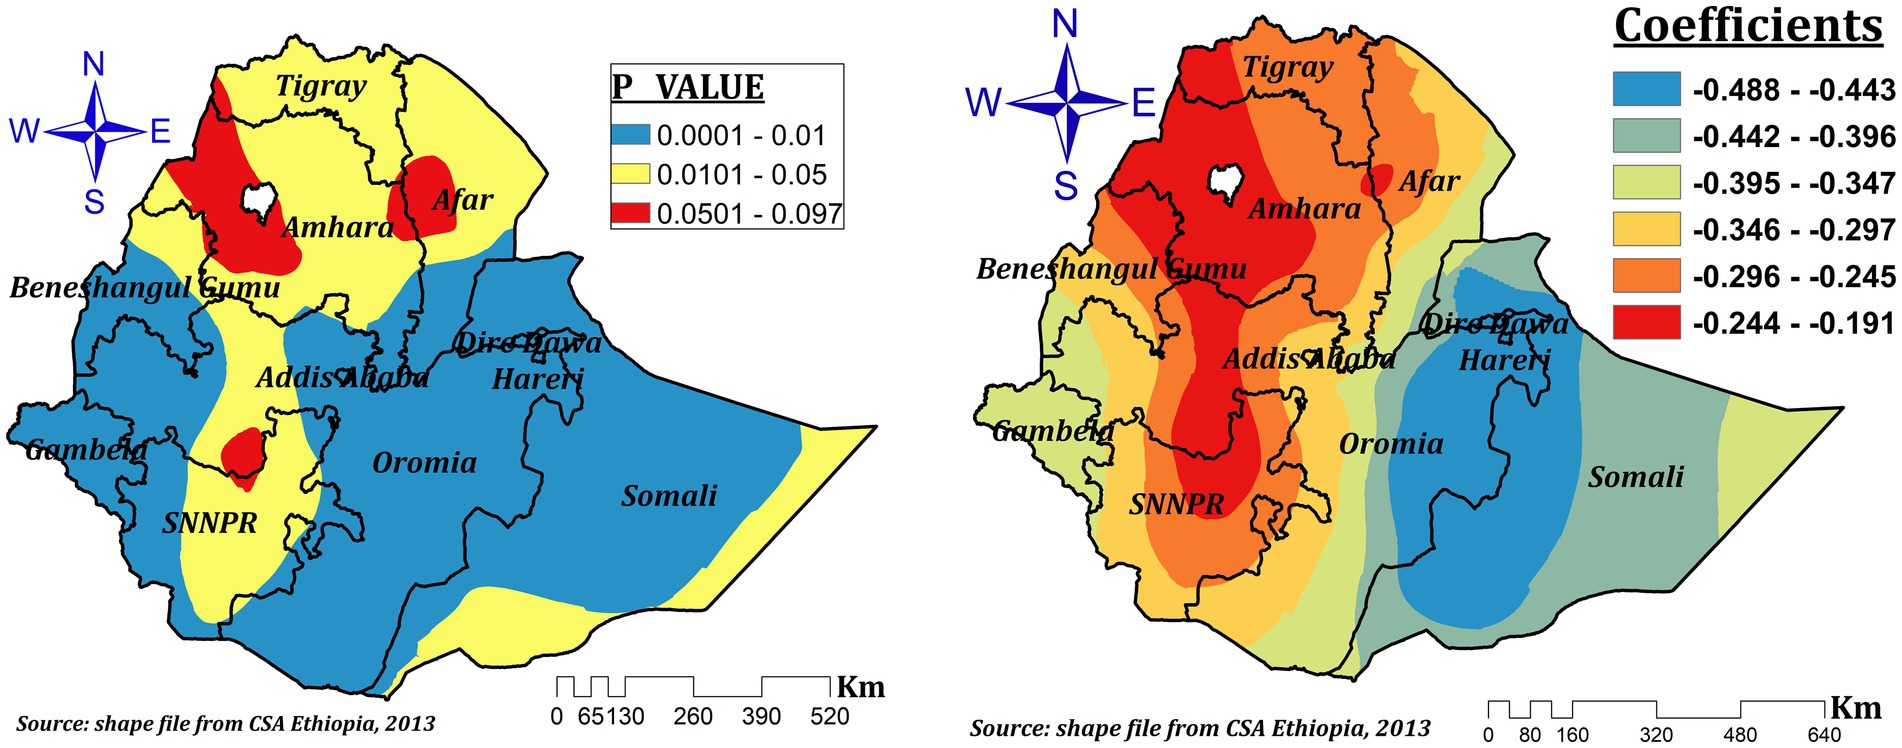
Figure 6. The GWR coefficients and spatially varying significant level of maternal education predicting ZVF intake among children 6–23 months in Ethiopia.
The relationship between the proportion of children aged 12–23 and the prevalence of ZVF consumption was spatially different and both negative and positive, which ranges between-0.267 and 0.253. In the significant areas (northwest Benishangul, west and northwest Amhara, Dire Dawa, Hareri, parts of eastern Somali, some parts of northeastern Oromia, the southern tip of Afar, southeast SNNPR, and the southern tip of Oromia). As the proportion of children aged 12–23 increased by 1%, the prevalence of ZVF intake decreased by 26.7 to 20% in northwest Benishangul, west and northwest Amhara, Dire Dawa, Hareri, parts of eastern Somali, some parts of northeastern Oromia, and the southern tip of Afar regions, while it increased by a range of 2.3 to 25.3% in southeastern SNNPR and the southern tip of Oromia (Figure 7).
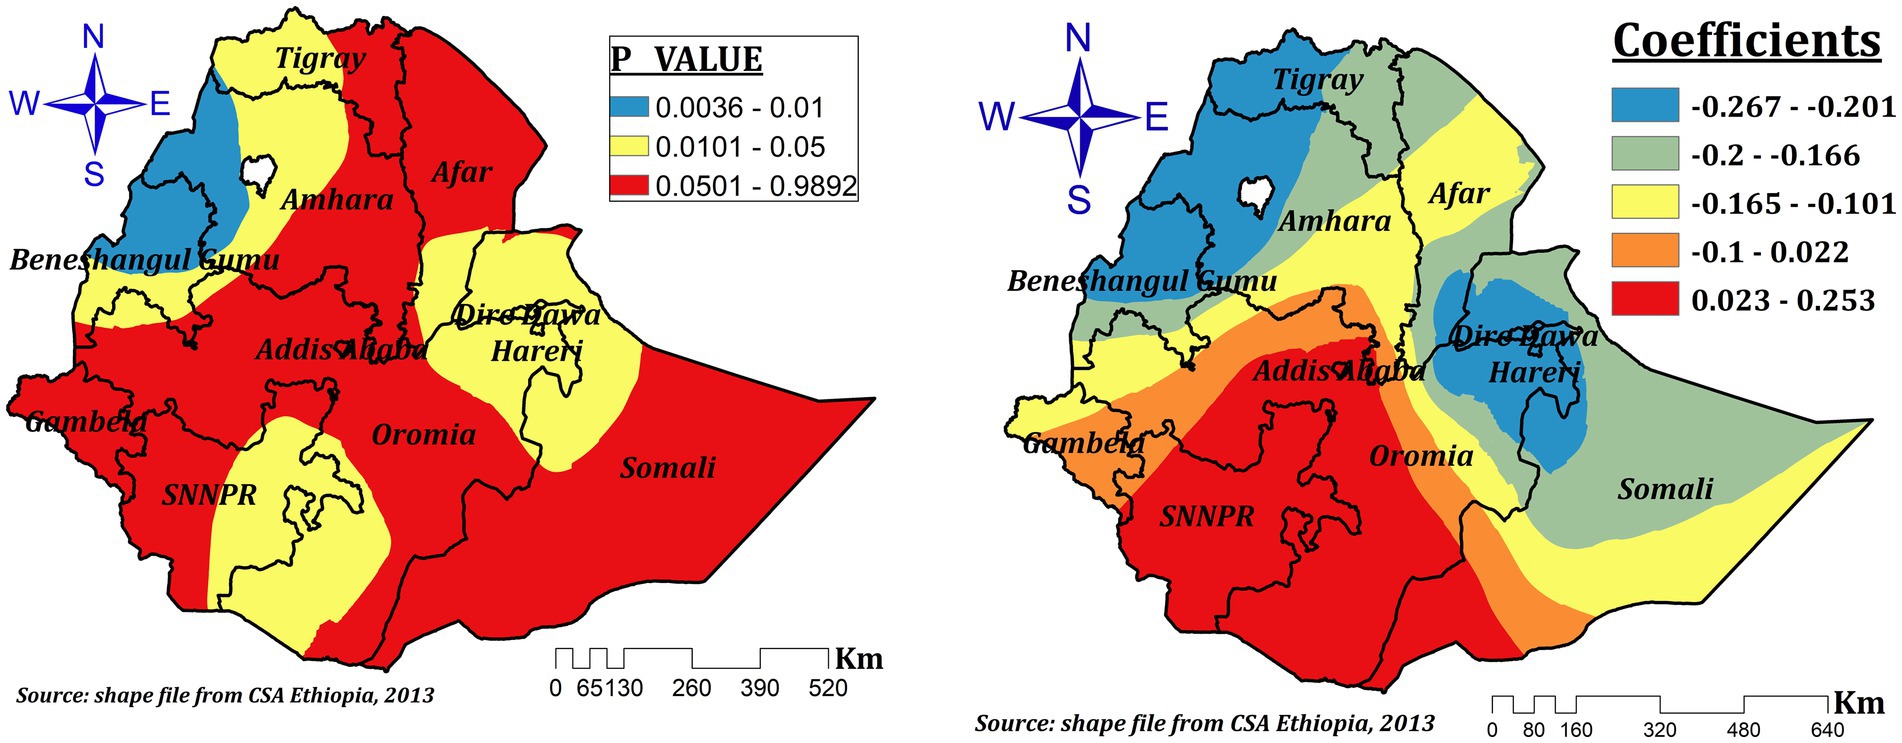
Figure 7. The GWR coefficients and spatially varying significant level of age of the child (12–23) predicting ZVF consumption among children 6–23 months in Ethiopia.
In Ethiopia, the impact of delivery at home on ZVF intake among children aged 6–23 months varies in statistical significance across the regions. The spatial variation of the coefficients, ranging from-0.02 to 0.512, suggests home delivery had both positive and negative spatial effects. Nonetheless, the effect size varies from 0.208 to 0.512 in the significant regions (the entire of Benishangul, the majority of Amhara, southern Afar, some areas of northwest and central Oromia, and Addis Ababa). This suggests that ZVF can rise by a range of 20.8 to 51.2%, with a 1% increase in the percentage of children delivered at home in these areas (Figure 8).
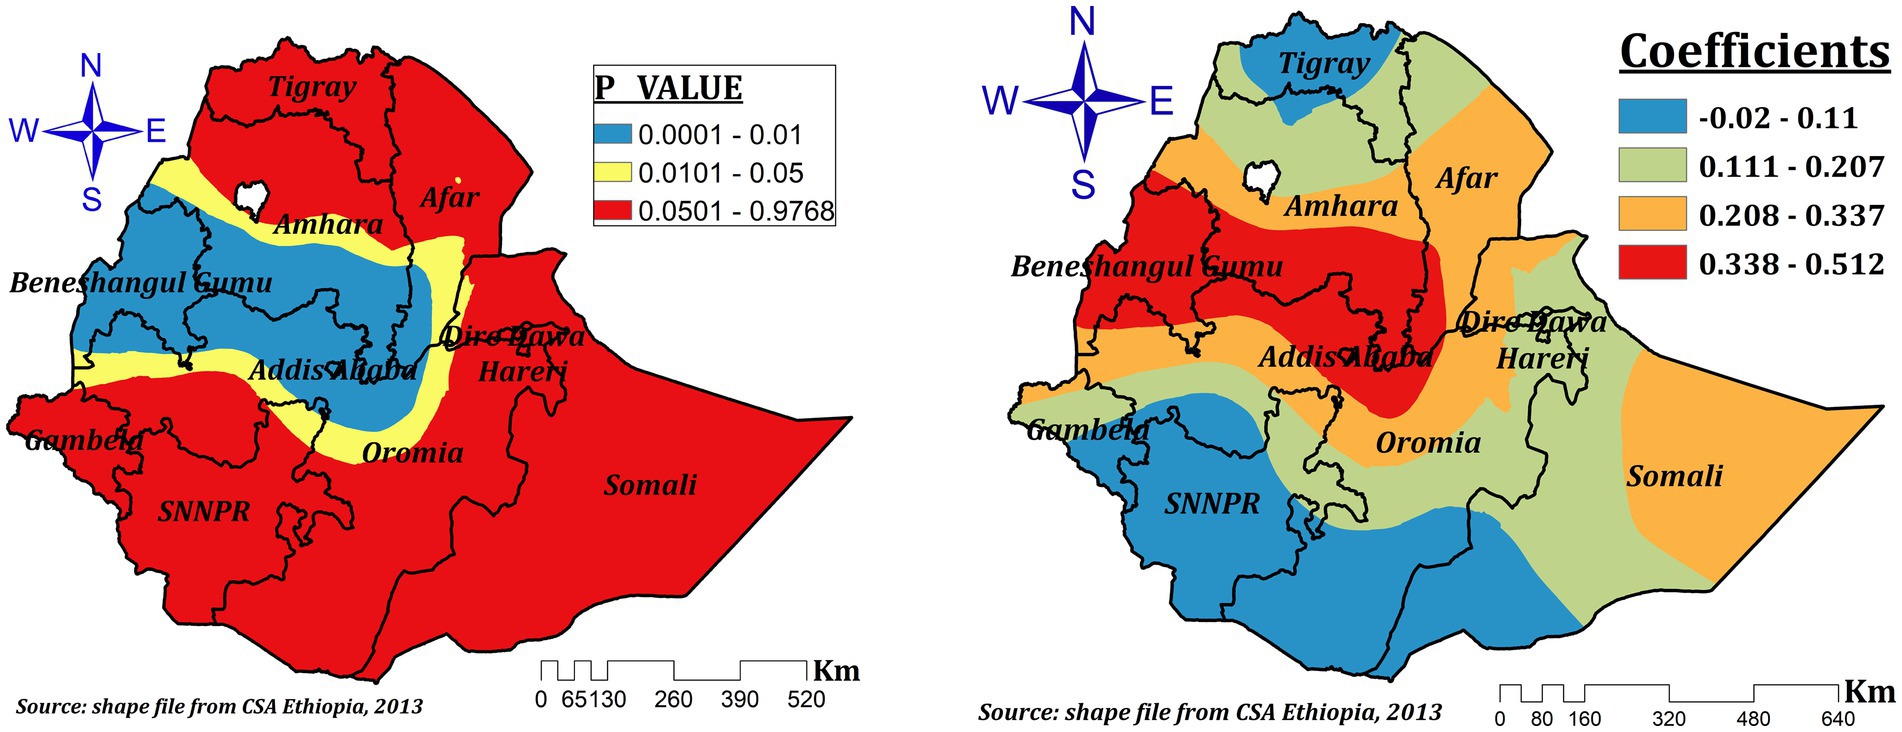
Figure 8. The GWR coefficients and spatially varying significant level of home delivery predicting ZVF intake among children 6–23 months in Ethiopia.
The presence of more than one under five children in the house had a varying protective effect in different parts of Ethiopia for ZVF consumption among children aged 6–23 months in Ethiopia. The coefficients vary spatially between-0.494 and-0.024, which indicates that the number of under-five children had a negative spatial effect. However, in the significant areas (Addis Ababa, central Oromia, southern Amhara and afar, some parts of northeast SNNPR, and southeastern Benishangul), the effect size ranges between-0.494 and-0.289. This indicates a 1% increase in the proportion of children living with more than one under five children, which decreases ZVF by a range of 28.9 to 49.4% (Figure 9).
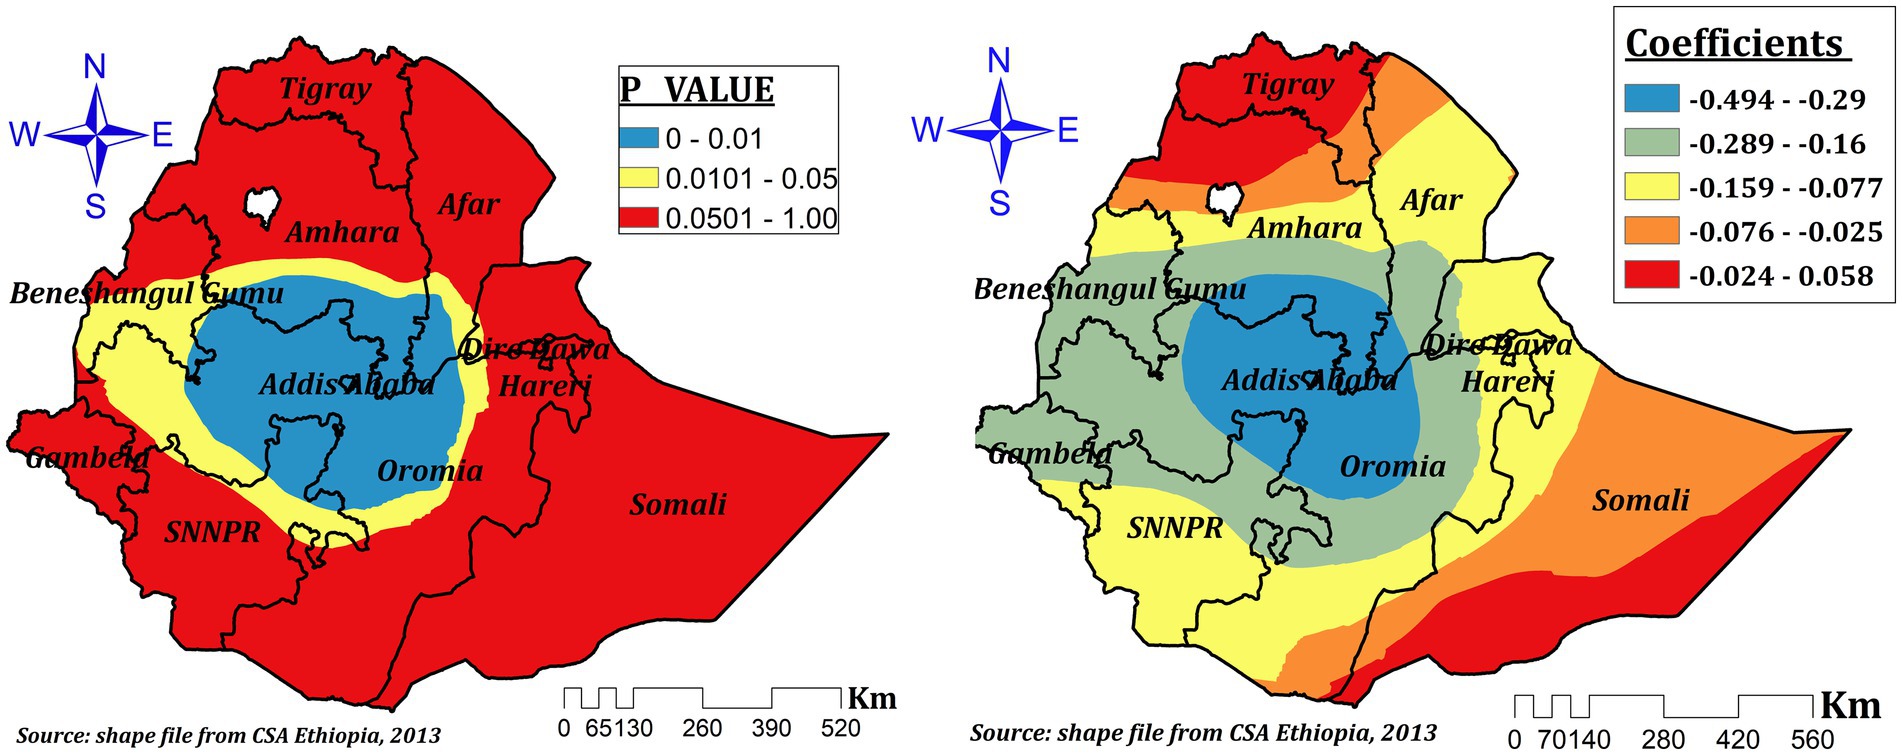
Figure 9. The GWR coefficients and spatially varying significant level of number of under-five children in the house predicting ZVF intake among children 6–23 months in Ethiopia.
The relationship between mother’s current pregnancy status and the prevalence ZVF was spatially different and both negative and positive which ranges between-0.085 and 0.226. In the significant areas (some parts of southeast and central Oromia and parts of western Somali), a 1% increase in the proportion of pregnant women increases ZVF by a range of 11.2 to 22.6% (Figure 10).
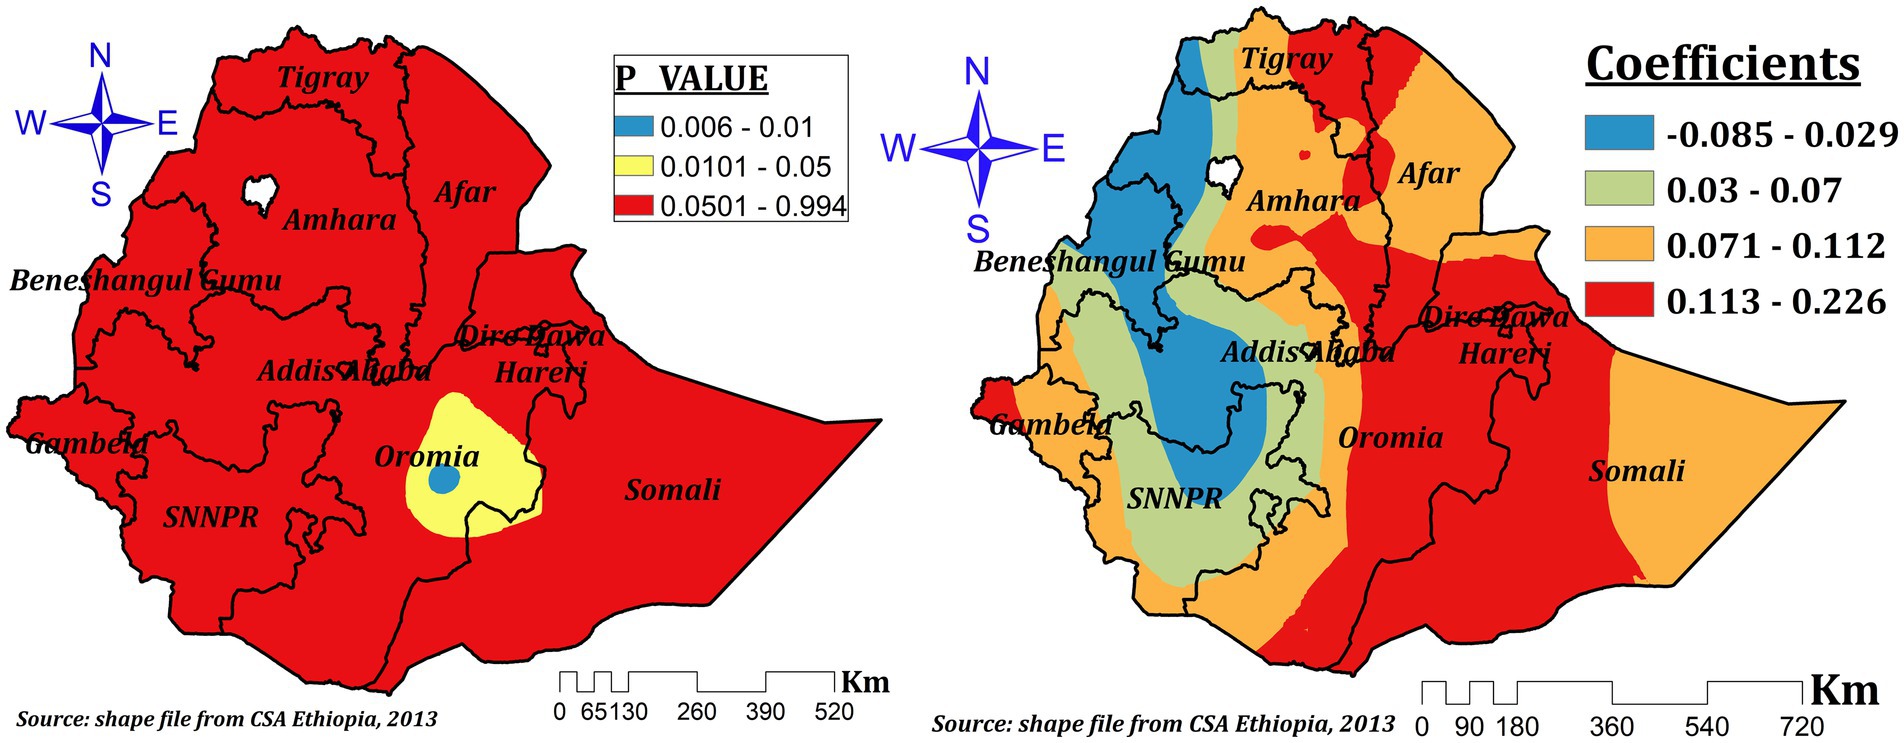
Figure 10. The GWR coefficients and spatially varying significant level of current pregnancy status predicting ZVF intake among children 6–23 months in Ethiopia.
In order to comprehend regional variation and distribution as well as factors contributing to the observed regional variation, this study looked at the spatial variation of ZVF consumption and its associated factors among children aged 6–23 months in Ethiopia. The majority of the Benishangul Gumuz, Gambela, Somali, and SNNPR areas had a highly clustered intake of ZVF. Additionally, a spatial scan analysis resulted in a total of 120 significant clusters. All explanatory factor taken into account in the final model including mother education, the child’s age (12–13 months), home delivery, having more than one child under the age of five living in the house, and being currently pregnant were significant explanatory factors for the regional variation of ZVF. As a result, we mapped these important variables’ local coefficients.
Accordingly, the spatial distribution of ZVF was non-random in Ethiopia and highly clustered in the entire Somali region, central and southeast Amhara, and western and northwest Afar regions. A previous study also indicated that ZVF intake varies spatially (3). And it is also fair to interpret our result relative to other studies conducted to determine the spatial distribution of vitamin A-rich food consumption. Thus, previous studies conducted in Ethiopia revealed that low consumption of foods rich in vitamin A was significantly clustered in the Dire Dawa, Harari, Somali, Afar, eastern Tigray, and southeast Amhara regions (14, 38–40). A study conducted in Vietnam also revealed a spatial variation of vitamin A-rich foods (41). A study conducted in Nigeria also reported geographical differences in the consumption of fruits (42). Fruit and vegetables are one indicator of MDD, and inadequate dietary diversity was highly clustered in the Amhara, Tigray, and Afar regions (22). Moreover, MDD, which involves fruit and vegetable consumption among children (12), is one indicator of appropriate complementary feeding (43). In Ethiopia, inappropriate child feeding practices had a non-random spatial distribution where high clustering was observed in western Tigray, Afar, western Amhara, and Southern Oromia, as well as eastern SNNPR, and low clustering was seen in Addis Ababa, central Oromia, the southern Amhara region, northern SNNPR, southern Benishangul Gumuz, Harari, Dre-Dawa, and the Northern Somali regions (5).
The observed variation in the consumption of fruits and vegetables can be attributed to multiple factors. The type of food consumed and the concentration of micronutrients in Ethiopia can be greatly influenced by a variety of factors, including variations in farming systems across the regions, affordability, utilization, food preferences, lack of nutrition education and storage facilities, and differences in residential food availability (24, 44–46), as well as by the seasonality of fresh vegetables and fruits that are available (3). In addition, prices are rapidly increasing, both in real terms and when compared to cereal. At the end of 2019, vegetables and fruits were significantly more expensive than 15 years earlier. Especially green leafy vegetables show a significant price rise. There is also a significant spatial price variation in Ethiopia, where vegetable prices are 60 percent more expensive in lowland regions than in the Amhara region, where vegetables are the cheapest. Fruit prices in the lowlands are double the prices in the major producing area, the Southern Nations, Nationalities, and Peoples’ (SNNP) region (47). That is the reason for the lowest prevalence, which was seen in the entire Gambela, the majority of western Oromia, western Benishangul, the majority of SNNPR, and some parts of the northwest Tigray regions, where fruit production is comparatively better as spatial and temporal variation in crop diversity in Ethiopia is known (25). Due to rainfall, temperature, and altitude differences in the country, the eastern part of the country (East Hararghe) with vegetables dominating; Central Oromia Regional State (which produces both fruits and vegetables); SNNPR (Gamo Goffa, Woliata and Sidama zones); and eastern Ethiopia (Dire Dawa and Harari) are also well-known production and supply areas of both FV; some parts of Tigray and Amhara regions are the major fruit and vegetable growing areas of the country (48). Other sociodemographic factor variation across the regions may contribute to the spatial variation of ZVF consumption in Ethiopia (4, 49).
Our study revealed that mother education was a spatially significant predictor variable for ZVF consumption. It had a significant negative effect almost across all regions that ranged between-0.488 and-0.191. This indicates a 1% increase in the proportion of women with formal education, which decreases ZVF intake by a range of 19.1 to 48.8% among children aged 6–23 months. This finding is supported by previous reports (3, 18). Other studies also revealed that mother education was positively associated with different micronutrient rich food intakes (14, 40), dietary diversity (22, 23), and the minimum acceptable diet intake (6). The highest effect was seen in less developed regions and this might be due to regional inequalities in educational achievement and opportunities among women (49). Our finding is in contrast to the previous multilevel analysis (11). This might be due to the effect of space and spatial relationships in our analysis (50).
Children’s age (12–23 months) was another significant spatial predictor for ZVF intake. It had a spatially negative and positive effect that ranged between-0.267 and 0.253. A 1% increase in the proportion of children aged 12–23 decreases the prevalence of ZVF intake by 26.7 to 20% in northwest Benishangul, western and northwest Amhara, Dire Dawa, Hareri, some parts of eastern Somali, some parts of northeastern Oromia, and the southern tip of the Afar regions. This finding is consistent with the results of previous studies (3, 11). However, our result also indicated that a 1% increase in the proportion of children aged 12–23 increases ZVF intake by a range of 2.3 to 25.3% in southeastern SNNPR and southern Oromia. This might be due to the lack of availability of fruit and vegetables in these specific areas (48) or decreased maternal care and attention given to children as they grew up (51).
The effect of home delivery had varying statistical significance for ZVF consumption among children aged 6–23 months in Ethiopia. It’s the coefficients that vary spatially between-0.02 and 0.512. However, in the significant areas (entire Benishangul, the majority of Amhara, southern Afar, some parts of northwest and central Oromia, and Addis Ababa), the effect size ranges between 0.208 and 0.512. This indicates that a 1% increase in the proportion of children delivered at home in these areas can increase ZVF intake by a range of 20.8 to 51.2%. Another study also supports this evidence (52). This might be due to the reduced effect of home delivery on good infant and young child feeding practice (53–55), since health facility delivery creates opportunities for advice and encouragement that foster child feeding practice. However, our finding is in contrast to the previous report (11). This might be the reason why spatial analysis is more advantageous over other statistical analysis methods since it integrates space and spatial relationships (50).
The presence of more than one under five children in the house had a varying negative effect in different parts of Ethiopia on ZVF intake among children aged 6–23 months in Ethiopia. It’s the coefficients that vary spatially between-0.494 and-0.024. However, in the most significant areas, the effect size ranges between-0.494 and-0.289. This indicates a 1% increase in the proportion of children living with more than one under five children in the house, which decreases ZVF intake by a range of 28.9 to 49.4%. A previous study revealed that having three or more under-five children in the house increases undernutrition status (56). However, this significant effect was seen in Addis Ababa, central Oromia, southern Amhara and afar, some parts of northeast SNNPR, and southeastern Benishangul, where a better availability of fruits and vegetables is indicated (48). Thus, if the number of under-five children in the house increases, mothers may give better attention to caring for their children.
The relationship between mother’s current pregnancy status and the prevalence ZVF intake was spatially different and both negative and positive which ranges between-0.085 and 0.226. In the significant areas, a 1% increase in the proportion of pregnant women increases ZVF consumption by a range of 11.2 to 22.6%. Mothers may worry more about their pregnancies than their children, which could be the cause of the positive effect of pregnancy on ZVF consumption.
The data used in this investigation were gathered using a validated instrument and are nationally representative. In order to determine hotspots and cold spots with ZVF consumption as well as spatial predictors for this spatial variation in a particular geographic area, we used a spatial analysis. To protect respondent anonymity, our study’s GPS position is, however, randomly moved. Consequently, positional errors amount to 0–2 kilometers in urban clusters, 0–5 kilometers in rural clusters, and 0–10 kilometers in 1% of the rural clusters. This could have an impact on local estimates and make it more difficult to determine where the instances are located.
Significant geographic variation in ZVF consumption was found in this study throughout Ethiopia’s regions. Significant explanatory factors for the spatial variation in ZVF consumption among children aged 6–23 months were the formal education level of the mother, wealth status, the child’s age, place of delivery, number of under-five children living in the home, and pregnancy status of the woman. Our research shows that improving children’s consumption of fruits and vegetables in hotspot areas is a critical requirement. Therefore, in order to lower children’s rising ZVF consumption rate, boosting household wealth status and expanding access to education should take precedence. Consequently, rather than implementing services randomly in hotspot regions, area-based interventional strategies that take spatial explanatory factors into account would make regional nutritional and educational interventions more cost-effective. Lastly, our findings should encourage public health authorities to develop targeted nutritional education.
Publicly available datasets were analyzed in this study. This data can be found here: http://www.dhsprogram.com.
Ethical approval was not required for the studies involving humans because this study was conducted using the 2019 Ethiopian demographic and health survey datasets. To use the datasets we granted a permission from the MEASURES DHS program and the authorization letter is attached with files. The studies were conducted in accordance with the local legislation and institutional requirements. Written informed consent for participation was not required from the participants or the participants’ legal guardians/next of kin in accordance with the national legislation and institutional requirements because this study is a secondary data analysis. Thus, it is not applicable.
WT: Conceptualization, Data curation, Formal analysis, Investigation, Methodology, Project administration, Resources, Software, Supervision, Validation, Visualization, Writing – original draft, Writing – review & editing. MS: Investigation, Methodology, Project administration, Resources, Supervision, Validation, Visualization, Writing – review & editing. HG: Investigation, Methodology, Project administration, Resources, Supervision, Validation, Visualization, Writing – review & editing. ZG: Investigation, Methodology, Project administration, Resources, Supervision, Validation, Visualization, Writing – review & editing. LA: Investigation, Methodology, Project administration, Resources, Supervision, Validation, Visualization, Writing – review & editing. TT: Investigation, Methodology, Project administration, Resources, Supervision, Validation, Visualization, Writing – review & editing.
The author(s) declare that no financial support was received for the research, authorship, and/or publication of this article.
We appreciate that access to the DHS datasets was made possible by the MEASURE DHS initiative.
The authors declare that the research was conducted in the absence of any commercial or financial relationships that could be construed as a potential conflict of interest.
All claims expressed in this article are solely those of the authors and do not necessarily represent those of their affiliated organizations, or those of the publisher, the editors and the reviewers. Any product that may be evaluated in this article, or claim that may be made by its manufacturer, is not guaranteed or endorsed by the publisher.
AICc, Corrected Akaike Information Criteria; DHS, Demographic and Health Survey; FV, Fruits and Vegetables; GWR, Geographical Weighted Regression; OLS, Ordinary Least Square; VIF, Variance Inflation Factor; ZVF, Zero Vegetables or Fruits.
1. World Health Organization (e-Library of Evidence for Nutrition Actions (eLENA)). Increasing fruit and vegetable consumption to reduce the risk of noncommunicable diseases. (2023); Available at: https://www.who.int/tools/elena/interventions/fruit-vegetables-ncds.
2. World Health Organization (THE GLOBAL HEALTH OBSERVATORY). Zero vegetable or fruit consumption (6–23 months) associated Indicators. (2023). Available at: https://www.who.int/data/gho/indicator-metadata-registry/imr-details/7048 (Accessed December 22, 2023).
3. Allen, CK, Assaf, S, Namaste, S, and Benedict, RK. Estimates and trends of zero vegetable or fruit consumption among children aged 6–23 months in 64 countries. PLOS Glob Public Health. (2023) 3:e0001662. doi: 10.1371/journal.pgph.0001662
4. Choudhury, S, Headey, DD, and Masters, WA. First foods: diet quality among infants aged 6–23 months in 42 countries. Food Policy. (2019) 88:101762. doi: 10.1016/j.foodpol.2019.101762
5. Derseh, NM, Agimas, MC, Shewaye, DA, Alemayehu, MA, and Aragaw, FM. Spatial variation and determinants of inappropriate complementary feeding practice and its effect on the undernutrition of infants and young children aged 6 to 23 months in Ethiopia by using the Ethiopian Mini-demographic and health survey, 2019: spatial and multilevel analysis. Front Public Health. (2023) 11:1158397. doi: 10.3389/fpubh.2023.1158397
6. Teshome, F, and Tadele, A. Trends and determinants of minimum acceptable diet intake among infant and young children aged 6–23 months in Ethiopia: a multilevel analysis of Ethiopian demographic and health survey. BMC Nutr. (2022) 8:44. doi: 10.1186/s40795-022-00533-8
7. Hengsdijk, H, Sertse, Y, Tesfaye, S, and Likoko, E. Scoping study on fruits and vegetables: results from Ethiopia. Netherlands: Wageningen Economic Research (2021).
8. Hirvonen, K, Wolle, A, and Minten, B. Affordability of fruits and vegetables in Ethiopia. Washington, DC, USA: International Food Policy Research Institute (IFPRI) (2018).
9. Yip, CSC, Chan, W, and Fielding, R. The associations of fruit and vegetable intakes with burden of diseases: a systematic review of Meta-analyses. J Acad Nutr Diet. (2019) 119:464–81. doi: 10.1016/j.jand.2018.11.007
10. Gelibo, T, Amenu, K, Taddele, T, Taye, G, Getnet, M, Getachew, T, et al. Low fruit and vegetable intake and its associated factors in Ethiopia: a community based cross sectional NCD steps survey. Ethiop J Health Dev. (2017) 31:355–61.
11. Semagn, BE, and Abubakari, A. Zero fruits/vegetables consumption and associated factors among children aged 6–23 months in Ethiopia: mixed effect logistic regression analysis. PLoS One. (2023) 18:e0288732. doi: 10.1371/journal.pone.0288732
12. Dangura, D, and Gebremedhin, S. Dietary diversity and associated factors among children 6–23 months of age in Gorche district, southern Ethiopia: cross-sectional study. BMC Pediatr. (2017) 17:6. doi: 10.1186/s12887-016-0764-x
13. Sisay, BG, Afework, T, Jima, BR, Gebru, NW, Zebene, A, and Hassen, HY. Dietary diversity and its determinants among children aged 6–23 months in Ethiopia: evidence from the 2016 demographic and health survey. J Nutr Sci. (2022) 11:e88. doi: 10.1017/jns.2022.87
14. Demsash, AW, Chereka, AA, Kassie, SY, Donacho, DO, Ngusie, HS, Tegegne, MD, et al. Spatial distribution of vitamin a rich foods intake and associated factors among children aged 6–23 months in Ethiopia: spatial and multilevel analysis of 2019 Ethiopian mini demographic and health survey. BMC Nutr. (2022) 8:77. doi: 10.1186/s40795-022-00573-0
15. World Health Organization. The global health observatory. (2023). Available at: https://www.who.int/data/gho/indicator-metadata-registry/imr-details/3417#:~:text=Approximately%2016%20million%20(1.0%25),stomach%20cancer%20and%20colorectal%20cancer (Accessed December 22, 2023).
16. Prevention, W. , Control of noncommunicable diseases: Formal meeting of member states to conclude the work on the comprehensive global monitoring framework, including indicators, and a set of voluntary global targets for the prevention and control of noncommunicable diseases; report by the director-general of the World Health Organisation. Geneva: WHO, (2012): p. 3–9.
17. Lock, K, Pomerleau, J, Causer, L, Altmann, DR, and McKee, M. The global burden of disease attributable to low consumption of fruit and vegetables: implications for the global strategy on diet. Bull World Health Organ. (2005) 83:100–8.
18. Kjøllesdal, M, Htet, AS, Stigum, H, Hla, NY, Hlaing, HH, Khaine, EK, et al. Consumption of fruits and vegetables and associations with risk factors for non-communicable diseases in the Yangon region of Myanmar: a cross-sectional study. BMJ Open. (2016) 6:e011649. doi: 10.1136/bmjopen-2016-011649
19. Rippin, HL, Maximova, K, Loyola, E, Breda, J, Wickramasinghe, K, Ferreira-Borges, C, et al. Peer reviewed: suboptimal intake of fruits and vegetables in nine selected countries of the World Health Organization European region. Prev Chronic Dis. (2023) 20:E104. doi: 10.5888/pcd20.230159
20. Li, M, Fan, Y, Zhang, X, Hou, W, and Tang, Z. Fruit and vegetable intake and risk of type 2 diabetes mellitus: meta-analysis of prospective cohort studies. BMJ Open. (2014) 4:e005497. doi: 10.1136/bmjopen-2014-005497
21. Cooper, AJ, Forouhi, NG, Ye, Z, Buijsse, B, Arriola, L, Balkau, B, et al. Fruit and vegetable intake and type 2 diabetes: EPIC-InterAct prospective study and meta-analysis. Eur J Clin Nutr. (2012) 66:1082–92. doi: 10.1038/ejcn.2012.85
22. Seboka, BT, Hailegebreal, S, Yehualashet, DE, Gilano, G, Kabthymer, RH, Ewune, HA, et al. Exploring spatial variations and determinants of dietary diversity among children in Ethiopia: spatial and multilevel analysis using EDHS (2011–2016). J Multidiscip Healthc. (2021) 14:2633–50. doi: 10.2147/JMDH.S327456
23. Alemu, TG, Techane, MA, Wubneh, CA, Assimamaw, NT, Belay, GM, Tamir, TT, et al. Spatial variation and determinates of dietary diversity among children aged 6–23 months in Ethiopia: spatial and multilevel analysis using Ethiopian demography health survey (EDHS) 2019. Arch Public Health. (2022) 80:152. doi: 10.1186/s13690-022-00905-3
24. Sisay, BG, Tamirat, H, Sandalinas, F, Joy, EJM, Zerfu, D, Belay, A, et al. Folate deficiency is spatially dependent and associated with local farming systems among women in Ethiopia. Current developments. Nutrition. (2022) 6:nzac088. doi: 10.1093/cdn/nzac088
25. Abebe, T, Wiersum, K, and Bongers, F. Spatial and temporal variation in crop diversity in agroforestry homegardens of southern Ethiopia. Agrofor Syst. (2010) 78:309–22. doi: 10.1007/s10457-009-9246-6
26. Indicators, K . Mini demographic and health survey. Rockville, Maryland, USA: EPHI and ICF (2019).
27. UNICEF, Indicators for assessing infant and young child feeding practices: definitions and measurement methods. (2021). Available at: https://data.unicef.org/resources/indicators-for-assessing-infant-and-young-child-feeding-practices/
28. Oden, N . Adjusting Moran's I for population density. Stat Med. (1995) 14:17–26. doi: 10.1002/sim.4780140104
29. Pandey, M, Singh, V, and Vaishya, R. Geomatics approach for assessment of respiratory disease mapping. Int Arch Photogramm Remote Sens Spat Inf Sci. (2014) XL-8:205–11. doi: 10.5194/isprsarchives-XL-8-205-2014
30. Anselin, L . Local indicators of spatial association—LISA. Geogr Anal. (1995) 27:93–115. doi: 10.1111/j.1538-4632.1995.tb00338.x
31. Cheng, W, and Washington, SP. Experimental evaluation of hotspot identification methods. Accid Anal Prev. (2005) 37:870–81. doi: 10.1016/j.aap.2005.04.015
32. Srinivasan, S . Spatial regression models In: S Shekhar and H Xiong, editors. Encyclopedia of GIS. Boston, MA: Springer US (2008). 1102–5.
33. Rosenshein, L, Scott, L, and Pratt, M. Exploratory regression: a tool for modeling complex phenomena. Redlands, California: ESRI Redlands (2011). 1 p.
34. ESRI Press. How OLS regression works. Available at: https://pro.arcgis.com/en/pro-app/latest/tool-reference/spatial-statistics/how-ols-regression-works.htm (Accessed March 10, 2023).
35. ESRI Press. ArcGIS pro tool reference (how geographically weighted regression (GWR) works). Available at: https://pro.arcgis.com/en/pro-app/latest/tool-reference/spatial-statistics/how-geographicallyweightedregression-works.htm.
36. Martin, C., and Stewart, F., Geographically weighted regression: a tutorial on using GWR in ArcGIS 9.3. Maynooth, County Kildare, Ireland: National Centre for Geocomputation, National University of Ireland Maynooth, (2009): p. 1–27.
37. Burnham, K.P. , Model selection and multimodel inference. 2nd ed. Burnham KP, Anderson DR editors. New York, NY: Springer (1998).
38. Tiruneh, SA, Fentie, DT, Yigizaw, ST, Abebe, AA, and Gelaye, KA. Spatial distribution and geographical heterogeneity factors associated with poor consumption of foods rich in vitamin a among children age 6–23 months in Ethiopia: geographical weighted regression analysis. PLoS One. (2021) 16:e0252639. doi: 10.1371/journal.pone.0252639
39. Muhye, AB, Assimamaw, N, Tamir, TT, Alemu, TG, Techane, MA, Wubneh, CA, et al. Spatial distribution and determinates of poor consumption of foods rich in vitamin a among children aged 6–23 months in Ethiopia using data from Ethiopia demographic and health survey 2019: spatial and multilevel analysis. 2022 p. Available at: https://assets.researchsquare.com/files/rs-1419428/v1/17af0301-963c-4a29-ae1b-36fec1ccd347.pdf?c=1650213863
40. Gilano, G, Hailegebreal, S, and Seboka, BT. Geographical variation and associated factors of vitamin a supplementation among 6–59-month children in Ethiopia. PLoS One. (2022) 16:e0261959. doi: 10.1371/journal.pone.0261959
41. Kim, C, Alvarez, C, Sattar, A, Bandyopadhyay, A, Azzarri, C, Moltedo, A, et al. Production, consumption, and food security in Viet Nam diagnostic overview. Washington, DC: International Food Policy Research Institute and Food and Agriculture Organization (2021).
42. Mekonnen, DA, Trijsburg, L, Achterbosch, T, Brouwer, ID, Kennedy, G, Linderhof, V, et al. Food consumption patterns, nutrient adequacy, and the food systems in Nigeria. Agric Food Econ. (2021) 9:16. doi: 10.1186/s40100-021-00188-2
43. White, JM, Bégin, F, Kumapley, R, Murray, C, and Krasevec, J. Complementary feeding practices: current global and regional estimates. Matern Child Nutr. (2017) 13:e12505. doi: 10.1111/mcn.12505
44. Kebede, A, Jirström, M, Worku, A, Alemu, K, Berhane, HY, Turner, C, et al. Residential food environment, household wealth and maternal education association to preschoolers’ consumption of plant-based vitamin A-rich foods: the EAT Addis survey in Addis Ababa. Nutrients. (2022) 14:296. doi: 10.3390/nu14020296
45. Vuong, T. , Availability and consumption of vitamin a foods among southern Ethiopian and Zambian primary students. (2020). Available at: https://digitalcommons.unl.edu/cgi/viewcontent.cgi?article=1007&context=nutritionglobalresearch
46. Nankumbi, J, Grant, FKE, Sibeko, L, Mercado, E, Kwikiriza, N, Heck, S, et al. Predictors of vitamin a rich food consumption among women living in households growing orange-fleshed sweetpotatoes in selected regions in Uganda. Frontiers. Public Health. (2023) 10:10. doi: 10.3389/fpubh.2022.880166
47. Bachewe, FN, and Minten, B. Prices of vegetables and fruits in Ethiopia: trends and implications for consumption and nutrition. Intl Food Policy Res Inst. (2021) 157:5–26.
48. Wiersinga, RC, and de Jager, A. Business opportunities in the Ethiopian fruit and vegetable sector. Nature and Food Quality: Ministry of Agriculture (2009).
49. Tesema, MT, and Braeken, J. Regional inequalities and gender differences in academic achievement as a function of educational opportunities: evidence from Ethiopia. Int J Educ Dev. (2018) 60:51–9. doi: 10.1016/j.ijedudev.2017.10.023
50. Sankey, TT . Statistical descriptions of spatial patterns In: S Shekhar, H Xiong, and X Zhou, editors. Encyclopedia of GIS. Cham: Springer International Publishing (2017). 2196–204.
51. Geda, NR, Feng, CX, Janzen, B, Lepnurm, R, Henry, CJ, and Whiting, SJ. Infant and young child feeding practices in Ethiopia: analysis of socioeconomic disparities based on nationally representative data. Arch Public Health. (2021) 79:35. doi: 10.1186/s13690-021-00555-x
52. Marroda, KR, Berti, C, la Vecchia, A, Agostoni, C, Baroni, BN, Bettocchi, S, et al. Infant and young child feeding practices up to 23 months in Namuno District, Cabo Delgado, Mozambique. Ital J Pediatr. (2023) 49:110. doi: 10.1186/s13052-023-01517-5
53. Hassen, SL, Temesgen, MM, Marefiaw, TA, Ayalew, BS, Abebe, DD, and Desalegn, SA. Infant and young child feeding practice status and its determinants in Kalu District, Northeast Ethiopia: community-based cross-sectional study. Nutr Diet Suppl. (2021) 13:67–81. doi: 10.2147/NDS.S294230
54. Kahssay, M, Ebrahim, E, Seid, O, Woldu, E, and Reddy, S. Infant and young child feeding practices and associated factors among children aged 0–23 months in Assayita District Afar region Ethiopia. J Food Nutr Sci. (2019) 7:96–104. doi: 10.11648/j.jfns.20190706.13
55. Adhikari, N, Acharya, K, Upadhya, DP, Pathak, S, Pokharel, S, and Pradhan, PMS. Infant and young child feeding practices and its associated factors among mothers of under two years children in a western hilly region of Nepal. PLoS One. (2021) 16:e0261301. doi: 10.1371/journal.pone.0261301
Keywords: zero fruits or vegetables consumption, children, spatial analysis, Ethiopia, DHS
Citation: Tilahun WM, Simegn MB, Geremew H, Gebreegziabher ZA, Abay LY and Tesfie TK (2024) Spatial variation of zero fruits/vegetables consumption and associated factors among children aged 6–23 months in Ethiopia: geographical weighted regression analysis. Front. Nutr. 11:1374845. doi: 10.3389/fnut.2024.1374845
Edited by:
Rahnuma Ahmad, Medical College for Women and Hospital, BangladeshReviewed by:
Susmita Sinha, Khulna City Medical College and Hospital, BangladeshCopyright © 2024 Tilahun, Simegn, Geremew, Gebreegziabher, Abay and Tesfie. This is an open-access article distributed under the terms of the Creative Commons Attribution License (CC BY). The use, distribution or reproduction in other forums is permitted, provided the original author(s) and the copyright owner(s) are credited and that the original publication in this journal is cited, in accordance with accepted academic practice. No use, distribution or reproduction is permitted which does not comply with these terms.
*Correspondence: Werkneh Melkie Tilahun, d2Vya25laDd3bXRAZ21haWwuY29t
Disclaimer: All claims expressed in this article are solely those of the authors and do not necessarily represent those of their affiliated organizations, or those of the publisher, the editors and the reviewers. Any product that may be evaluated in this article or claim that may be made by its manufacturer is not guaranteed or endorsed by the publisher.
Research integrity at Frontiers
Learn more about the work of our research integrity team to safeguard the quality of each article we publish.