 Mary M. Ahern
 Emma J. Stinson
 Paolo Piaggi
 Jonathan Krakoff
 Susanne B. Votruba
- Obesity and Diabetes Clinical Research Section, Phoenix Epidemiology and Clinical Research Branch, National Institute of Diabetes and Digestive and Kidney Diseases, National Institutes of Health, Phoenix, AZ, United States
Introduction: Historically, secular and seasonal trend analyses have been examined using self-report measures of intake. Rarely are objective measures and known determinants of dietary intake used in these analyses. Our objective was to quantify the seasonal and secular differences in an objective ad libitum intake paradigm while considering the contribution of determinants, such as fat-free mass (FFM) index and spontaneous physical activity (SPA) limited to the restricted space of a whole-room calorimeter.
Methods: For this study, recruitment of N = 292 healthy, diabetes free, adults occurred from 1999 to 2020. Assessment during their 10-day stay included body composition (by DXA), SPA (by an approximately 24-h stay in whole-room calorimetry), and ad libitum intake (by a vending machine for 3 days). This secondary analysis used general linear models (GLM) to investigate secular and seasonal differences while adjusting for sex, age, FFM index, FM (fat mass) index, SPA, and race/ethnicity.
Results: FFM index and SPA were positively associated with all intake measures (p < 0.05). In all adjusted seasonal models, season did not affect intake. Adjusted secular trends models (kcals/year) demonstrated a decrease in total kcals (β = −55), intake as percent weight maintaining energy needs (β = −2), protein kcals (β = −10), fat kcals (β = −27), and carbohydrates kcals (β = −22) (all p < 0.05). After further adjustment for SPA, significance remained in all intake measures (p < 0.05). Secular trends in body composition revealed no changes in weight, BMI, and percent body fat (all p > 0.20).
Discussion: Our results indicate that over time, ad libitum intake decreased in this controlled research setting and remained significant even after accounting for positive determinants of intake. A significant ad libitum decrease, coupled with no change in body composition, may highlight a participant bias toward calorie restriction in a controlled setting over time and deserves further investigation.
1 Introduction
Changes in food intake patterns may vary over different temporal scales, including seasonally and over more extended periods (secular trends), and are influenced by shifts in agricultural, cultural, socioeconomic, and environmental factors (1–3). Understanding the temporal changes in energy intake may help elucidate mechanistic or physiological reasons for the rise in obesity rates over the last few decades (4). Rates of obesity have risen around the world since the 1980s, with the current prevalence in American adults at approximately 42% (4). Examining changes in components of energy balance principles may help understand this increase. Energy balance considers the relationship between two components of human metabolism: energy intake and expenditure (5). Fundamentally, the energy balance equation argues that energy intake in excess of energy expenditure leads to weight gain (5). Therefore, understanding the role of energy intake in secular and seasonal models will be important to understanding how trends in dietary intake have changed over time.
Evidence for a seasonal effect on dietary intake is inconsistent (6, 7). A meta-analysis showed slightly higher intake in winter compared to other seasons (7). Another study in the US also demonstrated increases in overall dietary intake in winter and attributed this to a holiday season effect (8). However, results are not consistent across populations. Yoshimura et al. (6) demonstrated that participants in Japan ate significantly fewer overall calories, less protein, and less fat in winter than in autumn. Still, other studies have found no effect of seasonality on intake. Bernstein et al. (9) found no relationship between seasons and the intake of macronutrients, micronutrients, or food groups. Ma et al. (10) demonstrated slight fluctuations in total energy intake, fat, and carbohydrate intake throughout the year but no clear seasonal pattern.
Research supporting changes in dietary intake over time (secular trends) is mixed as well. In the last few decades, the impact of diet on obesity has been a huge concern of governments and public health officials. In the United States alone, we have implemented several nutrition policies to try to impact dietary intake over the years, including improving school lunches, taxing soda, and adding calories to menu items at restaurants, all in an effort to improve nutrition and decrease unhealthy calorie intake (11). Despite all these efforts, individuals still eat more today than they were decades ago. Le et al. (12), using food availability data published by the Food and Agriculture Organization at the United Nations, demonstrated an increase in the global average calories consumed per person from approximately 2,250 in 1960 to 2,800 in the 2010s. Therefore, in order to understand trends in dietary intake, it is important to look at secular trends in addition to seasonal ones.
The National Health and Nutrition Examination Survey (NHANES) data from 1999 to 2016 reported a decrease in the percent energy intake of carbohydrates and an increase in the percent intake of protein and fat (13). During this time, NHANES data also recorded increased high-quality carbohydrates, saturated and unsaturated fatty acids, and an overall rise in the Healthy Eating Index score (13). Despite an apparent increase in diet quality, intakes of low-quality carbohydrates and saturated fats remained high (13). Using NHANES data from 1971 to 2008, Brown et al. (1) reported decreased total fat and protein intake and increased carbohydrates, overall intake, leisure time, physical activity, and BMI. This inconsistency in secular trends results may be due to the inherent limitations and bias of self-reported dietary intake measures, such as recall bias and measurement error (14). Historically, secular and season trend analyses, such as with NHANES collected data, have used subjective self-reported measures of dietary intake (14).
Additionally, our group has previously identified temporal decreases in spontaneous physical activity (SPA) and a positive association between SPA, as used in the constrained space of the whole-room calorimeter, and energy intake (5, 15). Briefly, in our study, SPA is a measure of physical activity that is associated with fidgeting-like behaviors and small preferences for movement, such as standing instead of sitting (15). Even though it is a small component of overall energy expenditure, it is highly variable and easily measured in certain study paradigms (like a metabolic chamber) (15). Thus, SPA was included in models to investigate how temporal factors (i.e., seasonality and secular trends over time) affect the relationship between SPA and food intake. Lastly, it has been shown that fat-free mass (FFM) index is a significant positive predictor of energy intake and should also be included in the models (16).
The primary aim of the current study was to assess the effects of seasonality and secular trends on ad libitum dietary intake as objectively quantified in an inpatient setting. The secondary aim was to evaluate whether the relationships between known determinants of energy intake, SPA, and fat-free mass (FFM) index account for these trends (5, 16). We hypothesize that there will be a time-related change in dietary intake on our vending machine paradigm, which will be impacted by the inclusion of a measurement of physical activity (SPA) and body composition (FFM index).
2 Materials and methods
2.1 Recruitment
Recruitment for this study occurred at the NIDDK Obesity and Diabetes Clinical Research section in Phoenix, Arizona. Participants were recruited by NIDDK staff through flyers, newspaper ads, the internet (clinicaltrials.gov), and word of mouth. It was part of a larger inpatient study, the Food Intake Phenotype Study, that assessed changes in food preferences and intake, which has been actively recruiting since 1999 (ClinicalTrails.gov identifier NCT00342732) (17). All participants consented to participate in this study by giving written informed consent. This was approved by the NIH IRB.
2.2 Inclusion and exclusion criteria
Participants selected for analysis from 1999 to 2020 were healthy adults (based on falling within the normal range for screening labs, medical history, and a physical exam), free from diabetes (based on oral glucose tolerance test (OGTT) on day 4). N = 314 individuals were available for this analysis based on available and complete vending machine information (Figure 1). Participants were further excluded from this analysis if OGTT results revealed they had diabetes (n = 6) or missing data for the OGTT (n = 5). Lastly, participants (n = 11) were excluded for missing DXA information such as height and weight. In total, n = 22 of the initial 314 were excluded for the above reasons, leaving n = 292 for subsequent analysis. All analyses with SPA were conducted on a subset, n = 206, as some participants were missing SPA data (n = 86). No metabolic chamber dates were recorded from November 2005 to September 2009; however, the recruitment and data collections methods did not change over this time.
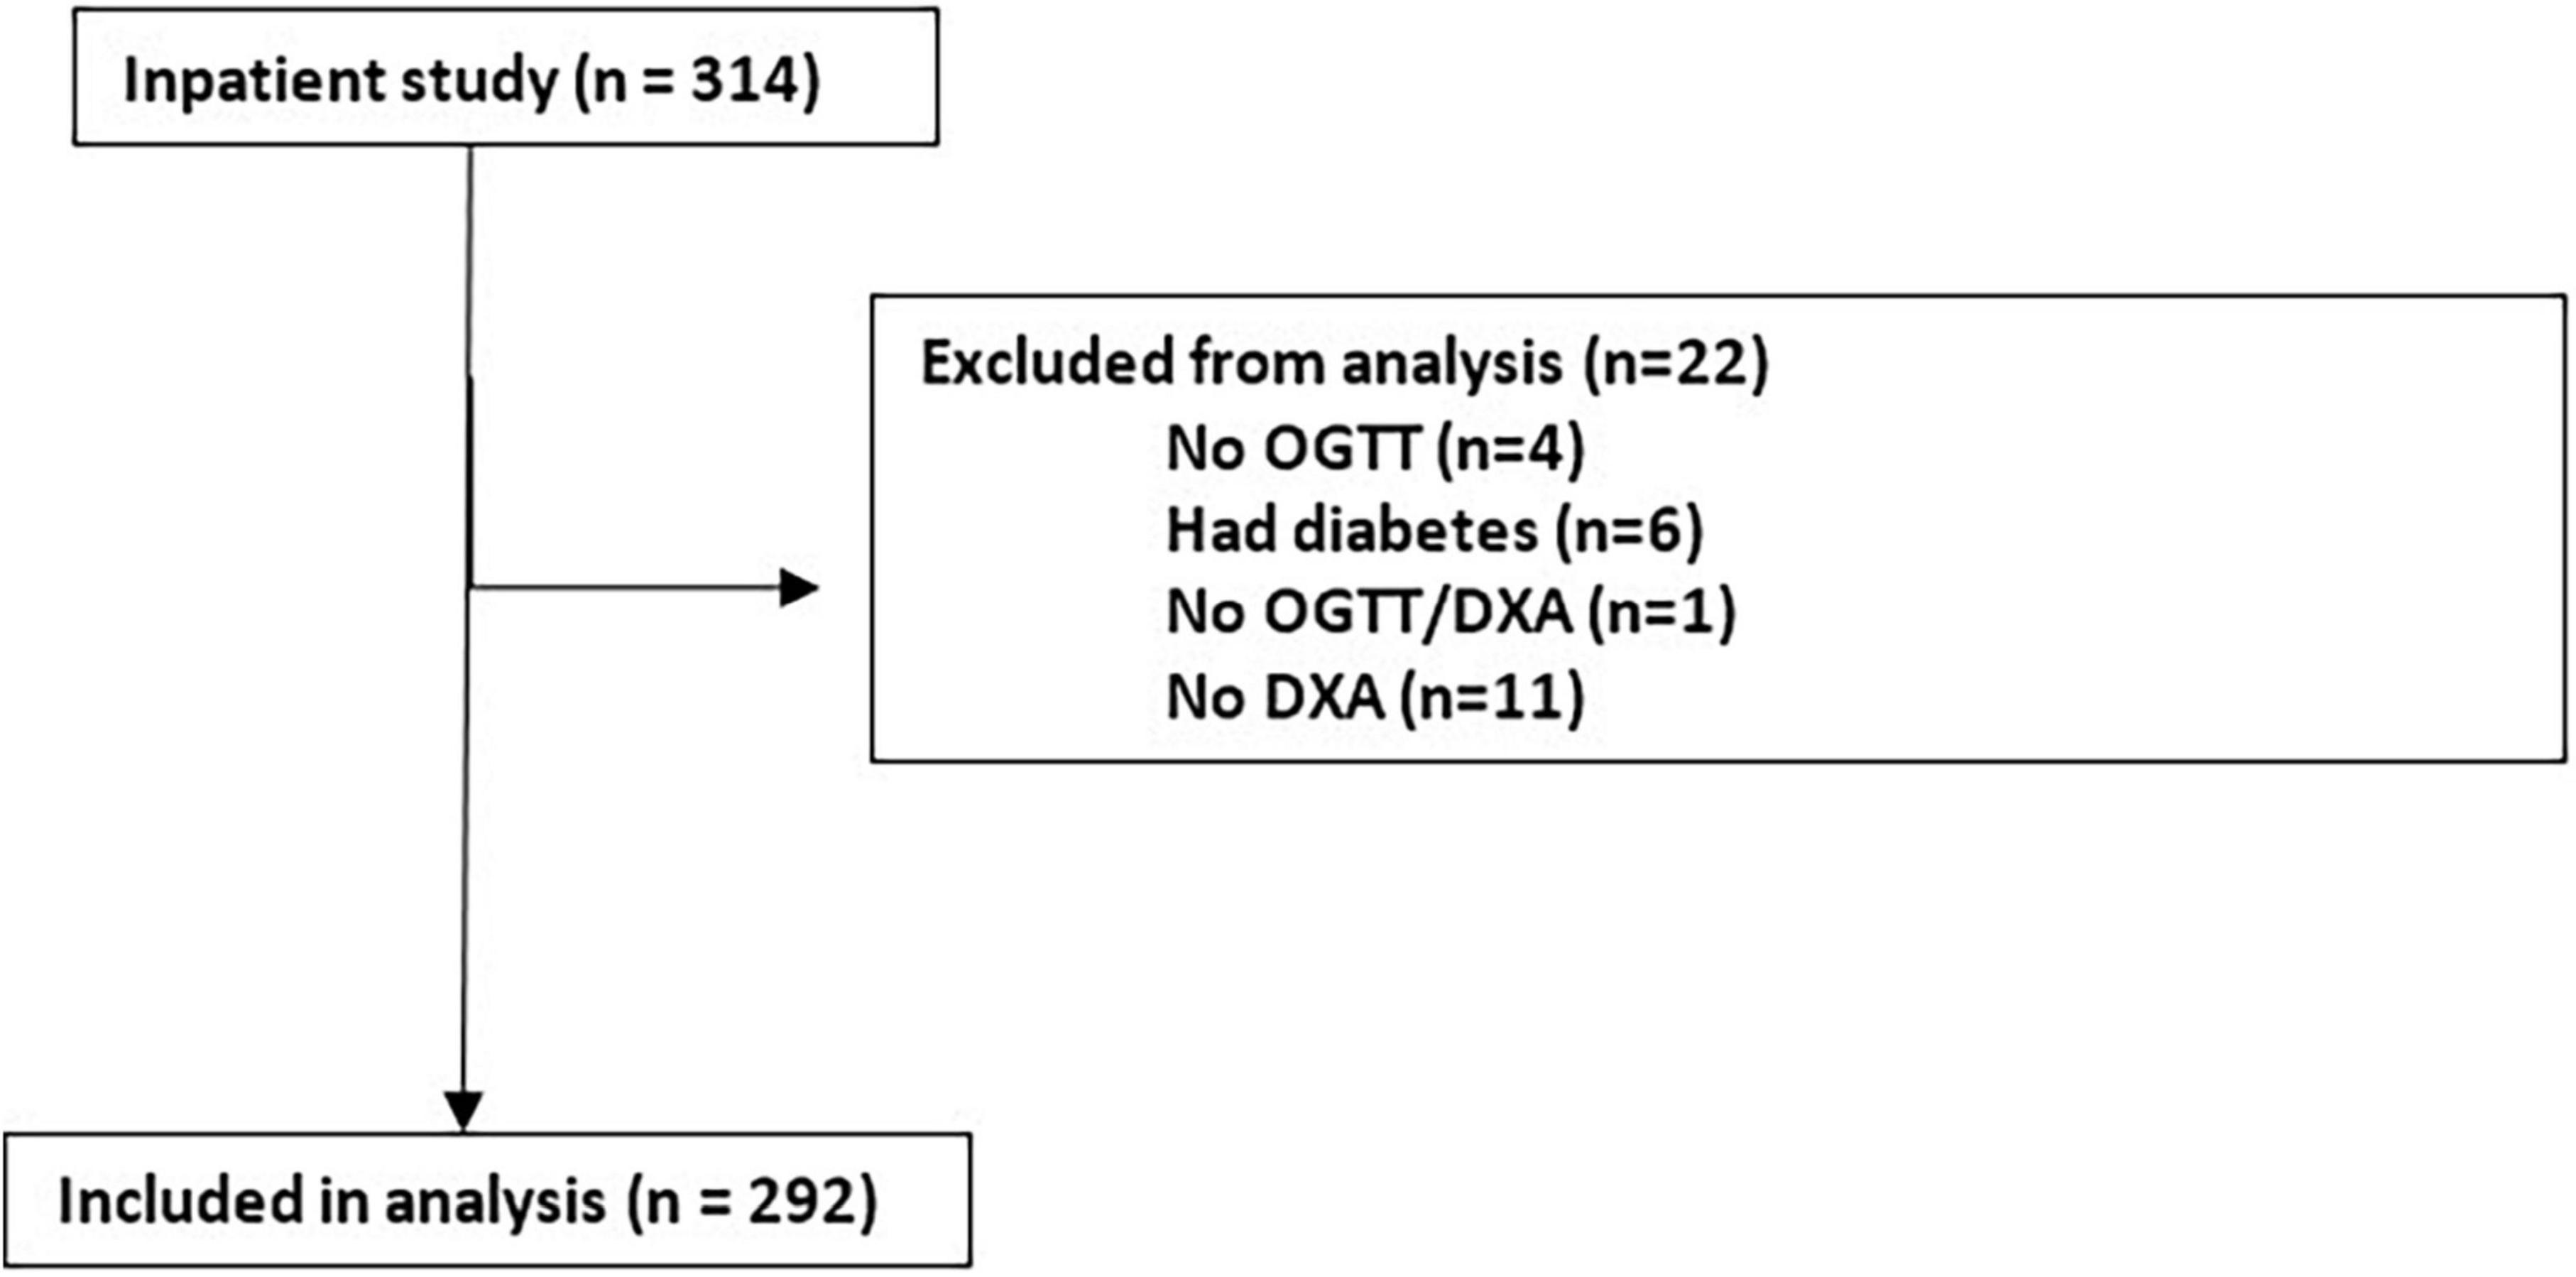
Figure 1. Inclusion and exclusion criteria for participants included in this secular and seasonal analysis. Based on valid vending machine information, N = 314 participants in Phoenix, Arizona, were selected for this analysis. N = 22 were excluded from the analysis for the reasons listed above. Leaving N = 292 participants for analysis.
2.3 Data collection
Once admitted to the inpatient study floor at the NIH Phoenix, patients began a weight-maintaining diet for the first three days of their ten-day inpatient stay. The weight-maintaining energy needs (WMEN; 50% carbohydrates, 30% fat, and 20% protein) were first calculated using Ferraro et al.’s equation based on weight and gender and then adjusted daily by the research dietitian to ensure stable weight throughout the baseline period before volunteers had access to the vending machines (18, 19). During this time, a DXA (DPX-1, Lunar Radiation Corp, Madison, Wisconsin) machine assessed body composition measurements such as fat-free mass (FFM) and fat mass (FM). These measurements were used to determine the FFM index and FM index, which considers height in addition to overall fat-free mass or fat mass (20). Due to the long recruitment period of these studies, from 1999 to 2020, different DXA machines were used. Therefore, values were standardized across DXA machines using comparative equations (21, 22). Next, participants spent roughly twenty-four hours in a metabolic calorimeter, which measured twenty-four-hour energy expenditure and its components, including SPA (23). While not a measure of overall physical activity, SPA reflects small restless movements participants make in the respiratory chambers, like sitting to standing. During their stay in the metabolic calorimeter, participants were fed a weight-maintaining diet and asked not to exercise.
2.4 Dietary intake collection
Following the stay in the metabolic calorimeter, participants ate ad libitum using an automated vending machine paradigm for three days, as previously described (17). Each participant was assigned their own vending machine, and the foods selected for that vending machine were individualized for each participant based on their answers to a hedonic food assessment (24). Foods that appeared on this assessment ranged from single food items such as eggs or spinach to full meals like spaghetti and meat sauce. A full list of food items can be seen in Table 1. Barring some changes in the availability of certain food items, the food list has been consistent since the beginning of the study. Participants then selected these foods by completing an 80-item Food Selection Questionnaire containing ordinary mealtime foods by rating their preference for the items listed on a scale from 1 (extremely dislike) to 9 (extremely like), with 5 being neutral. Foods selected for the vending machine ranged from 4 to 8 to serve participants food they liked while trying not to encourage overconsumption (24). Before being placed in the vending machines in the morning, all selected food and packaging for the day were inventoried and weighed.
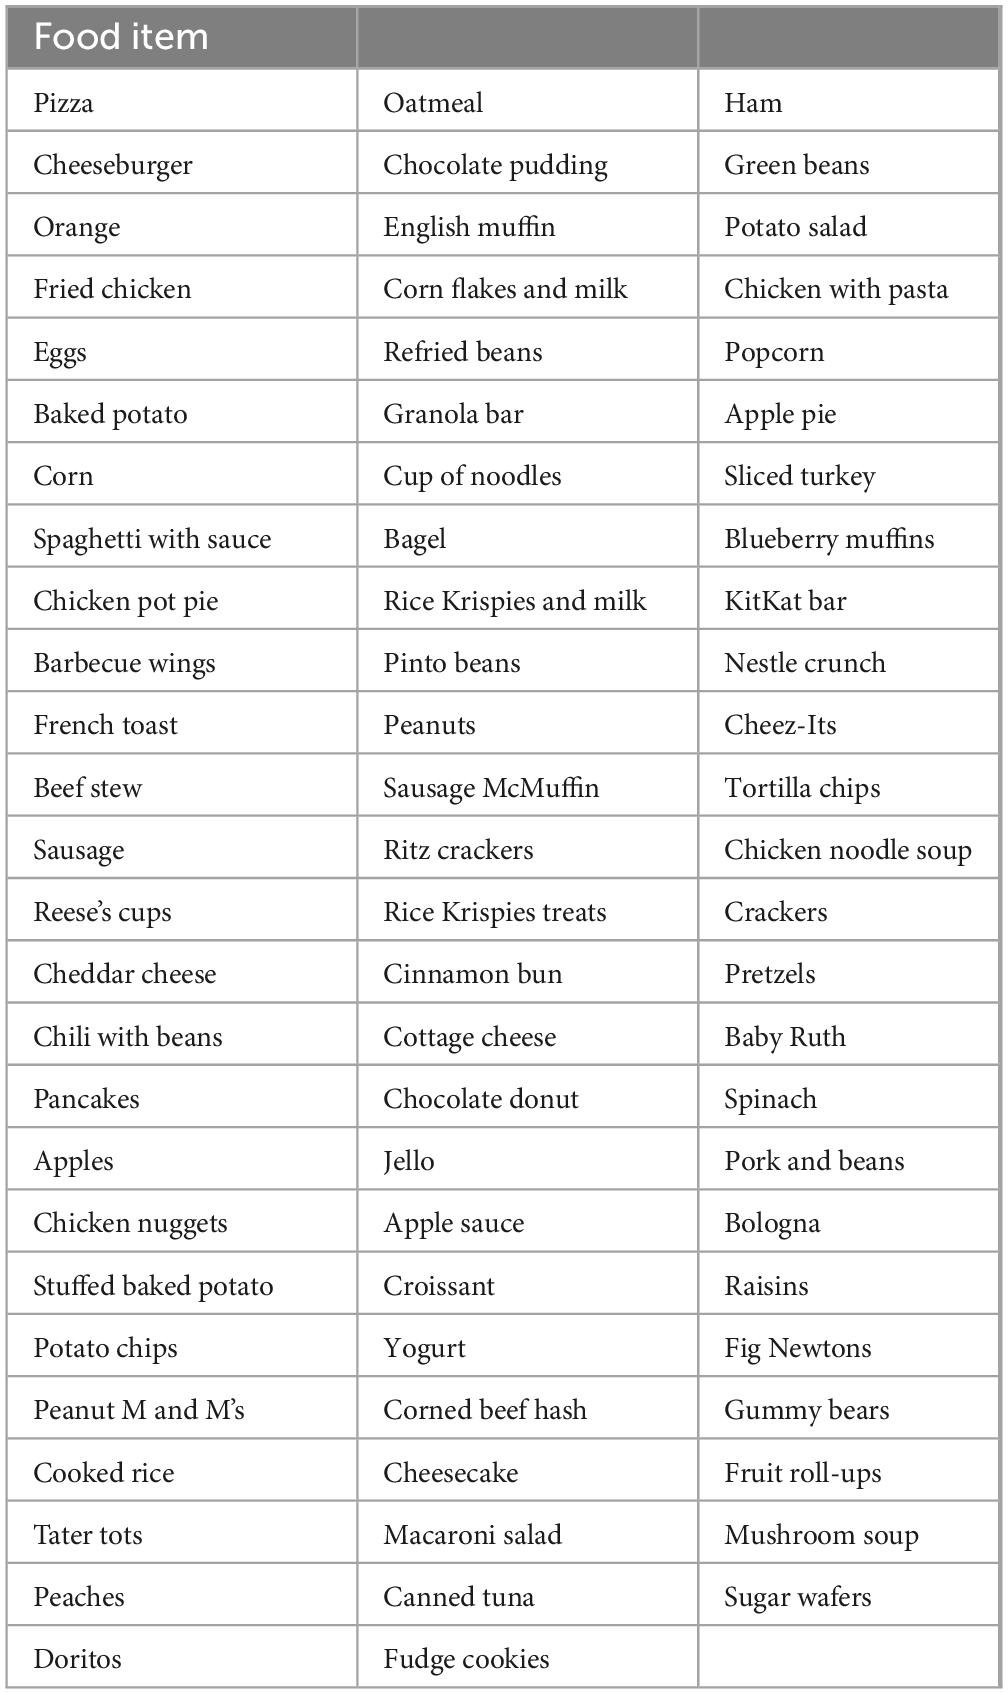
Table 1. List of 77 food items offered in the vending machine protocol.
During the three days in which patients were encouraged to eat ad libitum from the vending machines, study participants were required to eat alone in a specified vending machine room without distractions such as TV, personal devices, or phones. Typical condiments and bread were available in this room. When they were hungry, participants chose the food they wished to eat, and time was recorded. All packaging and any leftover food were reweighed after the meal to calculate an accurate intake for each eating episode (including bread and condiment intake). The reproducibility of this paradigm has been validated in previous studies, with an ICC of 0.90 (17, 19).
Macronutrient intake assessment was completed using CBORD Professional Diet Analyzer Program (CBORD Inc., Ithaca, NY, USA) and Food Processor (version 10.0.0; ESHA Research, Salem, OR, USA) (25, 26). Intake variables on the vending machines, such as total energy intake, carbohydrate kcal intake, protein kcal intake, and fat kcal intake, were averaged for the three days inpatient and are reported as the mean calorie intake, which was also expressed as a percentage of WMEN (%WMEN).
2.5 Categorizing seasonality
Seasonality was defined using temperatures from the Global Daily Climatology Network dataset archived with the US NOAA/National Climatic Data Center. See Aydin et al. (27) for a more detailed explanation of how the seasonal cut-offs were determined. Here, season definitions are winter defined as December 21st to March 20th, spring as March 21st to June 20th, summer as June 21st to September 20th, and fall as September 21st to December 20th (27).
2.6 Demographic data collection
Race/ethnicity, sex, and age were collected via self-report on a demographic questionnaire during intake. Race/ethnicity was divided into four distinct categories: Indigenous Americans, White, Black, and Other (the other category comprised Asian, Hispanic, and people who identified as multiple races). Indigenous Americans accounted for a large percentage of participants. Therefore, sensitivity analyses were also conducted for all models, including only Indigenous Americans, which did not change the results (data not shown).
2.7 Statistical analysis
SAS (version 9.4, SAS Institute Inc., Cary, NC, USA) was used for the statistical analysis (28). An alpha of 0.05 was set as the significance level for all tests. Normally distributed data are expressed in mean +/− standard deviation (SD). First, dietary intake measures were assessed without seasonal or secular trends variables to understand the impact of the determinants of dietary intake in the models. This was done using general linear models (GLMs) adjusted for sex, age, race/ethnicity, FFM index, FM index, and SPA in all intake measurements. Next, separate GLMs were used to assess seasonality and secular trends in food intake by including either season (seasonality: winter = reference) or date (secular trends) in the abovementioned model. Models were further adjusted for SPA to assess its relationship with time-related trends and dietary intake. Separate general linear models assessed secular trends in body composition measures (weight, percent body fat, and BMI) over time while adjusting for sex, age, and race/ethnicity. R-squared for certain GLMs were reported in the results as well. All secular trends data was reported in change by year. Results were also quantified using partial correlations (partial r) adjusting for the same covariates. Beta coefficients for these models are abbreviated with “β” representing a change of kcal or percent for a 1 unit change in the predictors.
Our research unit has two respiratory chambers. To ensure this did not impact the data, a sensitivity analysis was run controlling for the chamber, and the results remained the same (data not shown). Twenty-four-hour energy expenditure, another major determinant of energy intake, was also adjusted for all models in place of body composition measurements, and results remained the same (data not shown).
3 Results
The following analysis included a total of 292 participants (Table 2). The majority were male (n = 178, 61%), Indigenous American (n = 171, 59%), with obesity (n = 145, 50%) and a mean BMI of 31.6 ± 8.03. Participants were roughly evenly distributed across seasons, with fall having the most participants (n = 79), followed by spring (n = 76), winter (n = 75), and summer (n = 62). The average total energy intake of all the participants on the vending machines was 3,896 ± 1,375 kcal/day, and the average percent of weight-maintaining diet eaten of 140% ± 46%, demonstrating the documented propensity of participants to overeat on this reproducible vending machine paradigm (17).
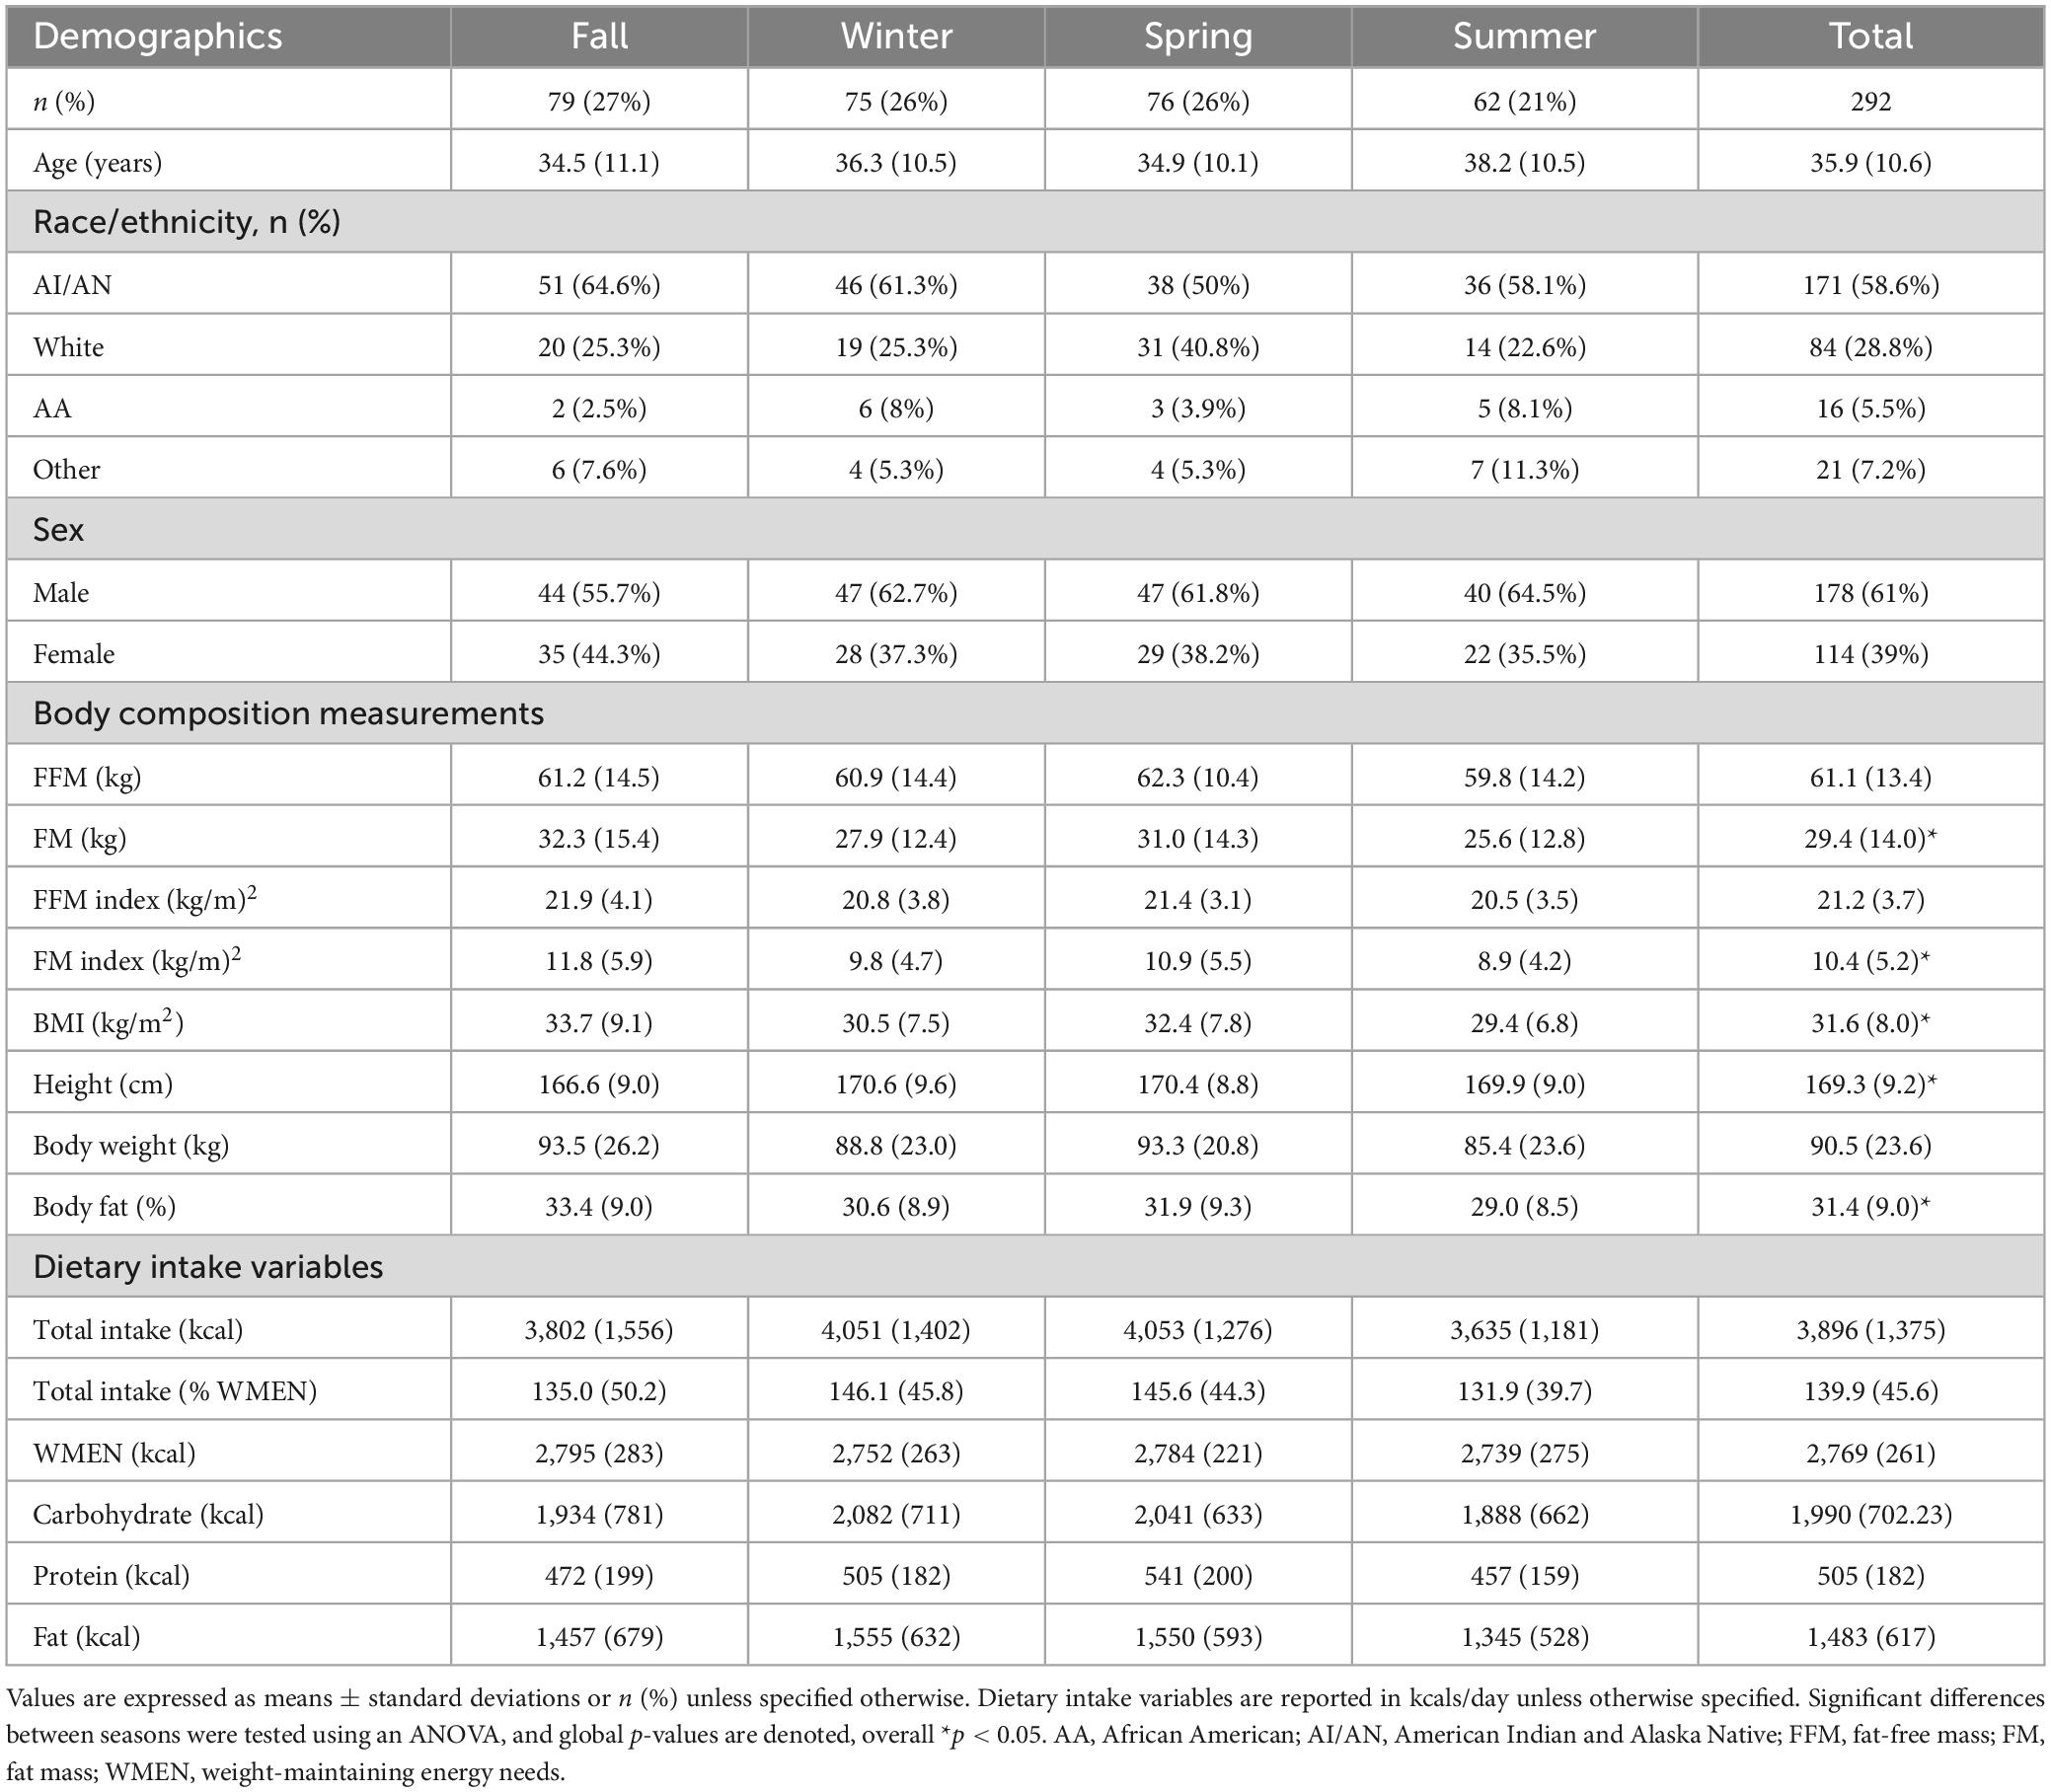
Table 2. Demographics, anthropometrics, and intake of 292 healthy study participants by season collected from 1999 to 2020.
3.1 Determinants of dietary intake
FFM index was a significant positive predictor of all energy intake measures: total (β = 173 kcal, p < 0.0001), %WMEN (β = 5%, p = 0.002), protein (β = 28 kcal, p < 0.0001), fat (β = 83 kcal, p < 0.0001), and carbohydrate (β = 69 kcal, p = 0.0017). In addition, SPA was also a significant positive predictor in all energy intake models: total (β = 37 kcal, p = 0.0033), %WMEN (β = 1%, p = 0.011), protein (β = 5 kcal, p = 0.0042), fat (β = 13 kcal, p = 0.020), and carbohydrate (β = 20 kcal, p = 0.0033). Conversely, FM index was consistently a significant negative predictor of intake: total (β = −101 kcal, p = 0.0016), %WMEN (β = −5%, p < 0.0001), protein (β = −17 kcal, p = 0.0002), fat (β = −44 kcal, p = 0.0024), and carbohydrate (β = −44 kcal, p = 0.0095). These determinants mostly remained significant in adjusted models assessing secular and seasonal trends (Tables 3, 4).
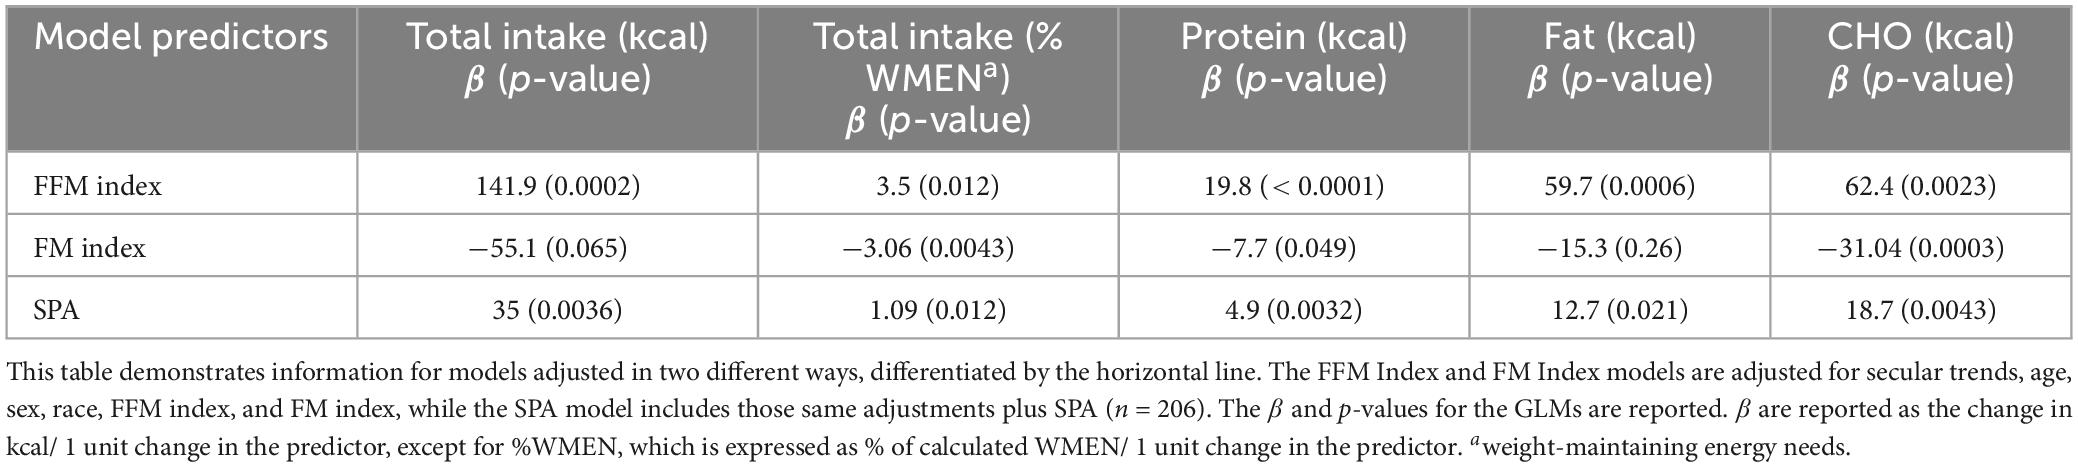
Table 3. General linear models adjusted secular trends demonstrating the significance of determinants of dietary intake.
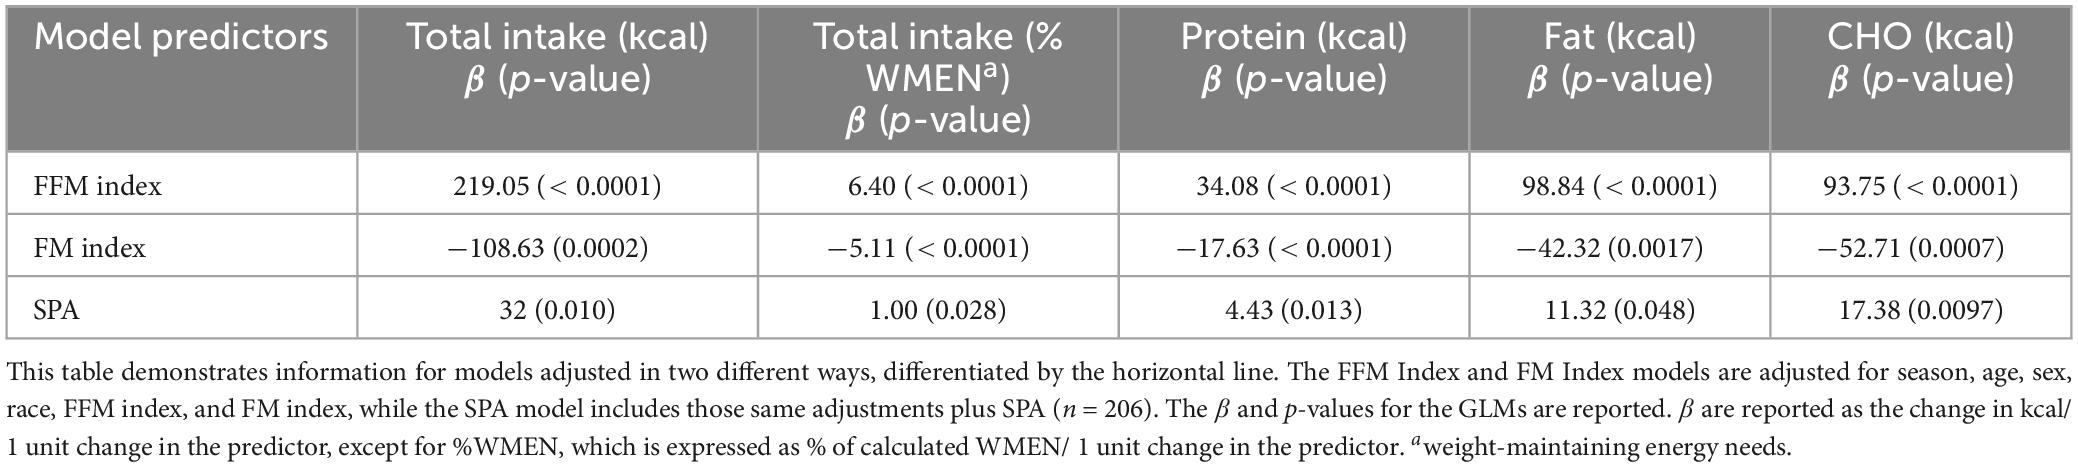
Table 4. General linear models adjusted seasonality demonstrating the significance of determinants of dietary intake.
3.2 Seasonality trends of dietary intake and related body composition measures
Overall, there was no significant effect of season in any measure of intake, in either unadjusted (Table 5) or adjusted models. In adjusted models, there were no seasonal differences in total kcal intake (overall p-value for season = 0.10), %WMEN (overall p-value for season = 0.061), fat intake (overall p-value for season = 0.12), carbohydrate intake (overall p-value for season, p = 0.16), and protein intake (overall p-value for season, p = 0.024, all post-hoc p > 0.05).
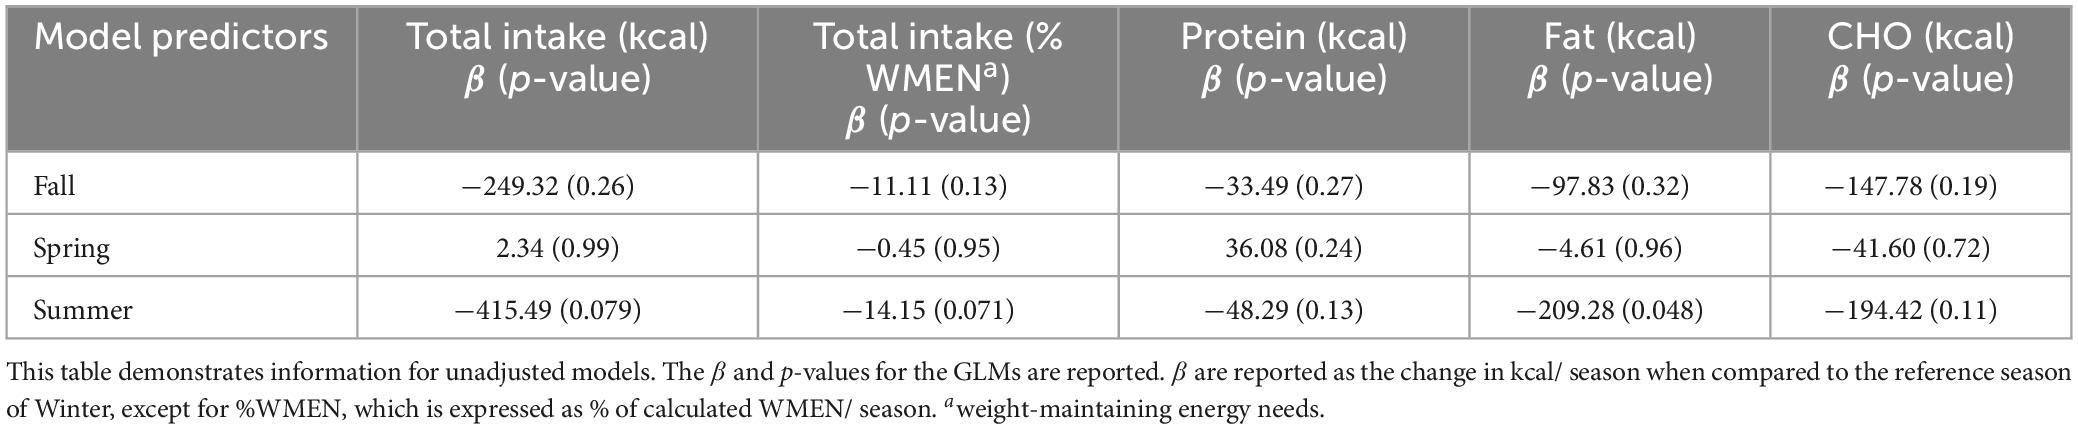
Table 5. Unadjusted general linear models demonstrating a lack of significance between measures of intake and seasons.
3.3 Secular trends of body composition
The secular trend in body composition metrics was analyzed to assess whether there were any concurrent changes in body composition during the analyzed changes in dietary intake. Separate models were adjusted for sex, age, race/ethnicity, and date, with body size or composition as the dependent variable. Over time, there was no significant change in weight (β = 0.099 kg/year, p = 0.70), BMI (β = −0.10 kg/m2/year, p = 0.15), and body fat (%) (β = −0.023%/year, p = 0.37).
3.4 Secular trends of dietary intake
Unadjusted models for total energy intake, %WMEN, fat, carbohydrate, and protein intake were negatively associated with time (Table 6). The effect size in these GLMs for intake variables was expressed as change in kcals over a year. After adjustments for age, race/ethnicity, sex, FFM index, and FM index, secular decreases in total energy intake (β = −55 kcal/year, p < 0.0001), %WMEN (β = −2%/year, p < 0.0001), protein intake (β = −10 kcal/year, p < 0.0001), fat intake (β = −27 kcal/year, p < 0.0001), and carbohydrate intake (β = −22 kcal/year, p = 0.0003) remained significant (Figure 2). Additional models were run with percent total energy intake by macronutrient instead of total macronutrient calories, and results remained largely similar (Table 7).
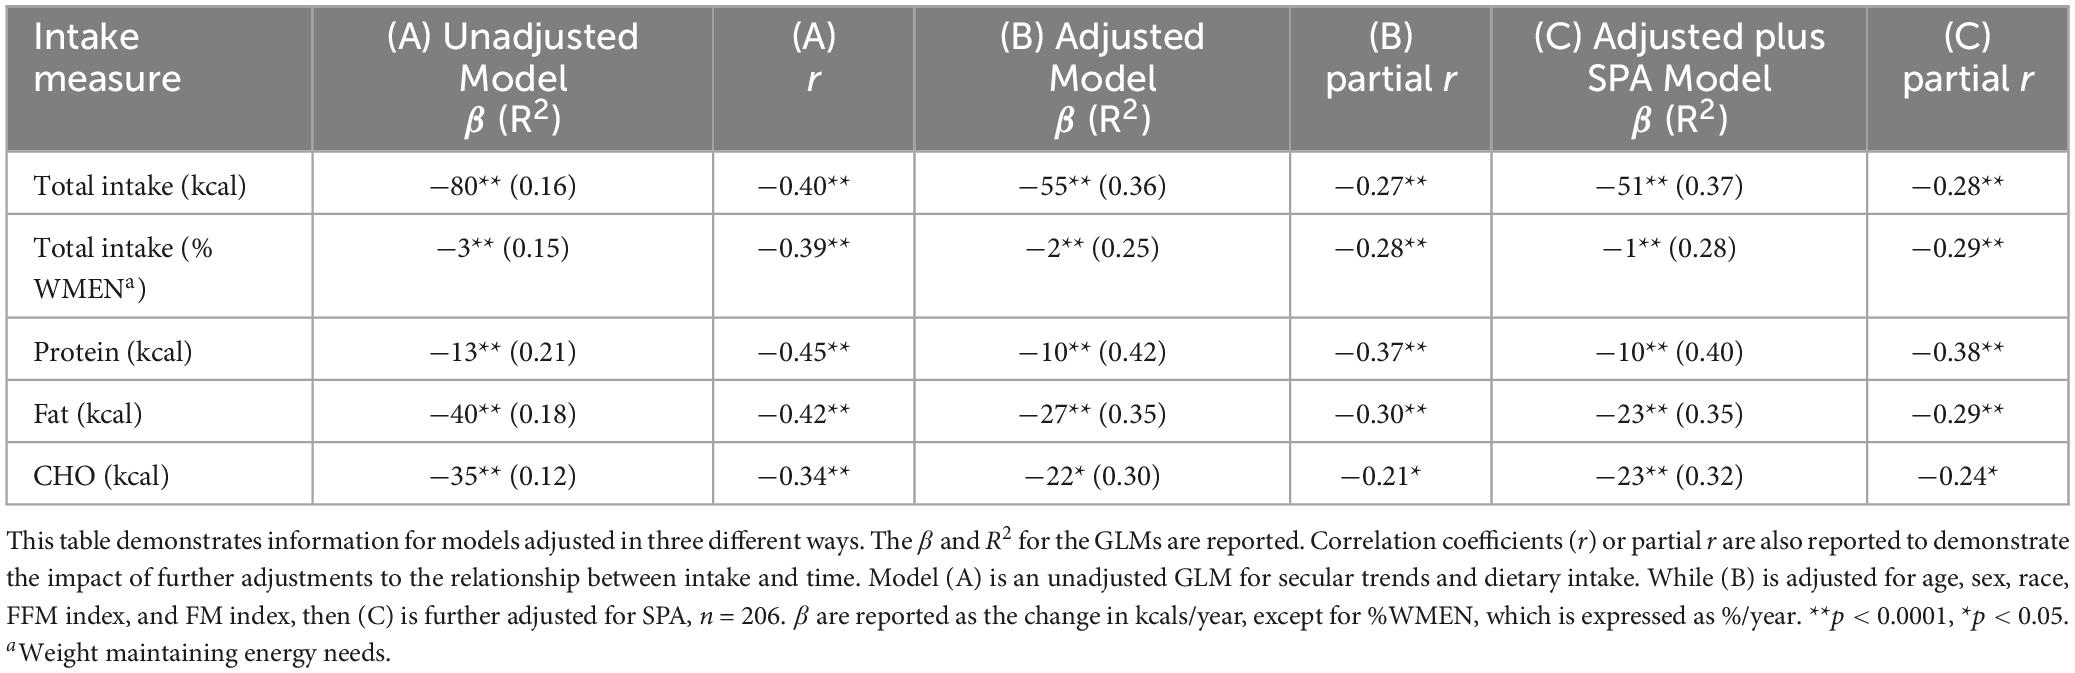
Table 6. General linear models with varying adjustments demonstrating a decline in ad libitum intake and the significance of the adjustments in the models from 1990 to 2020.
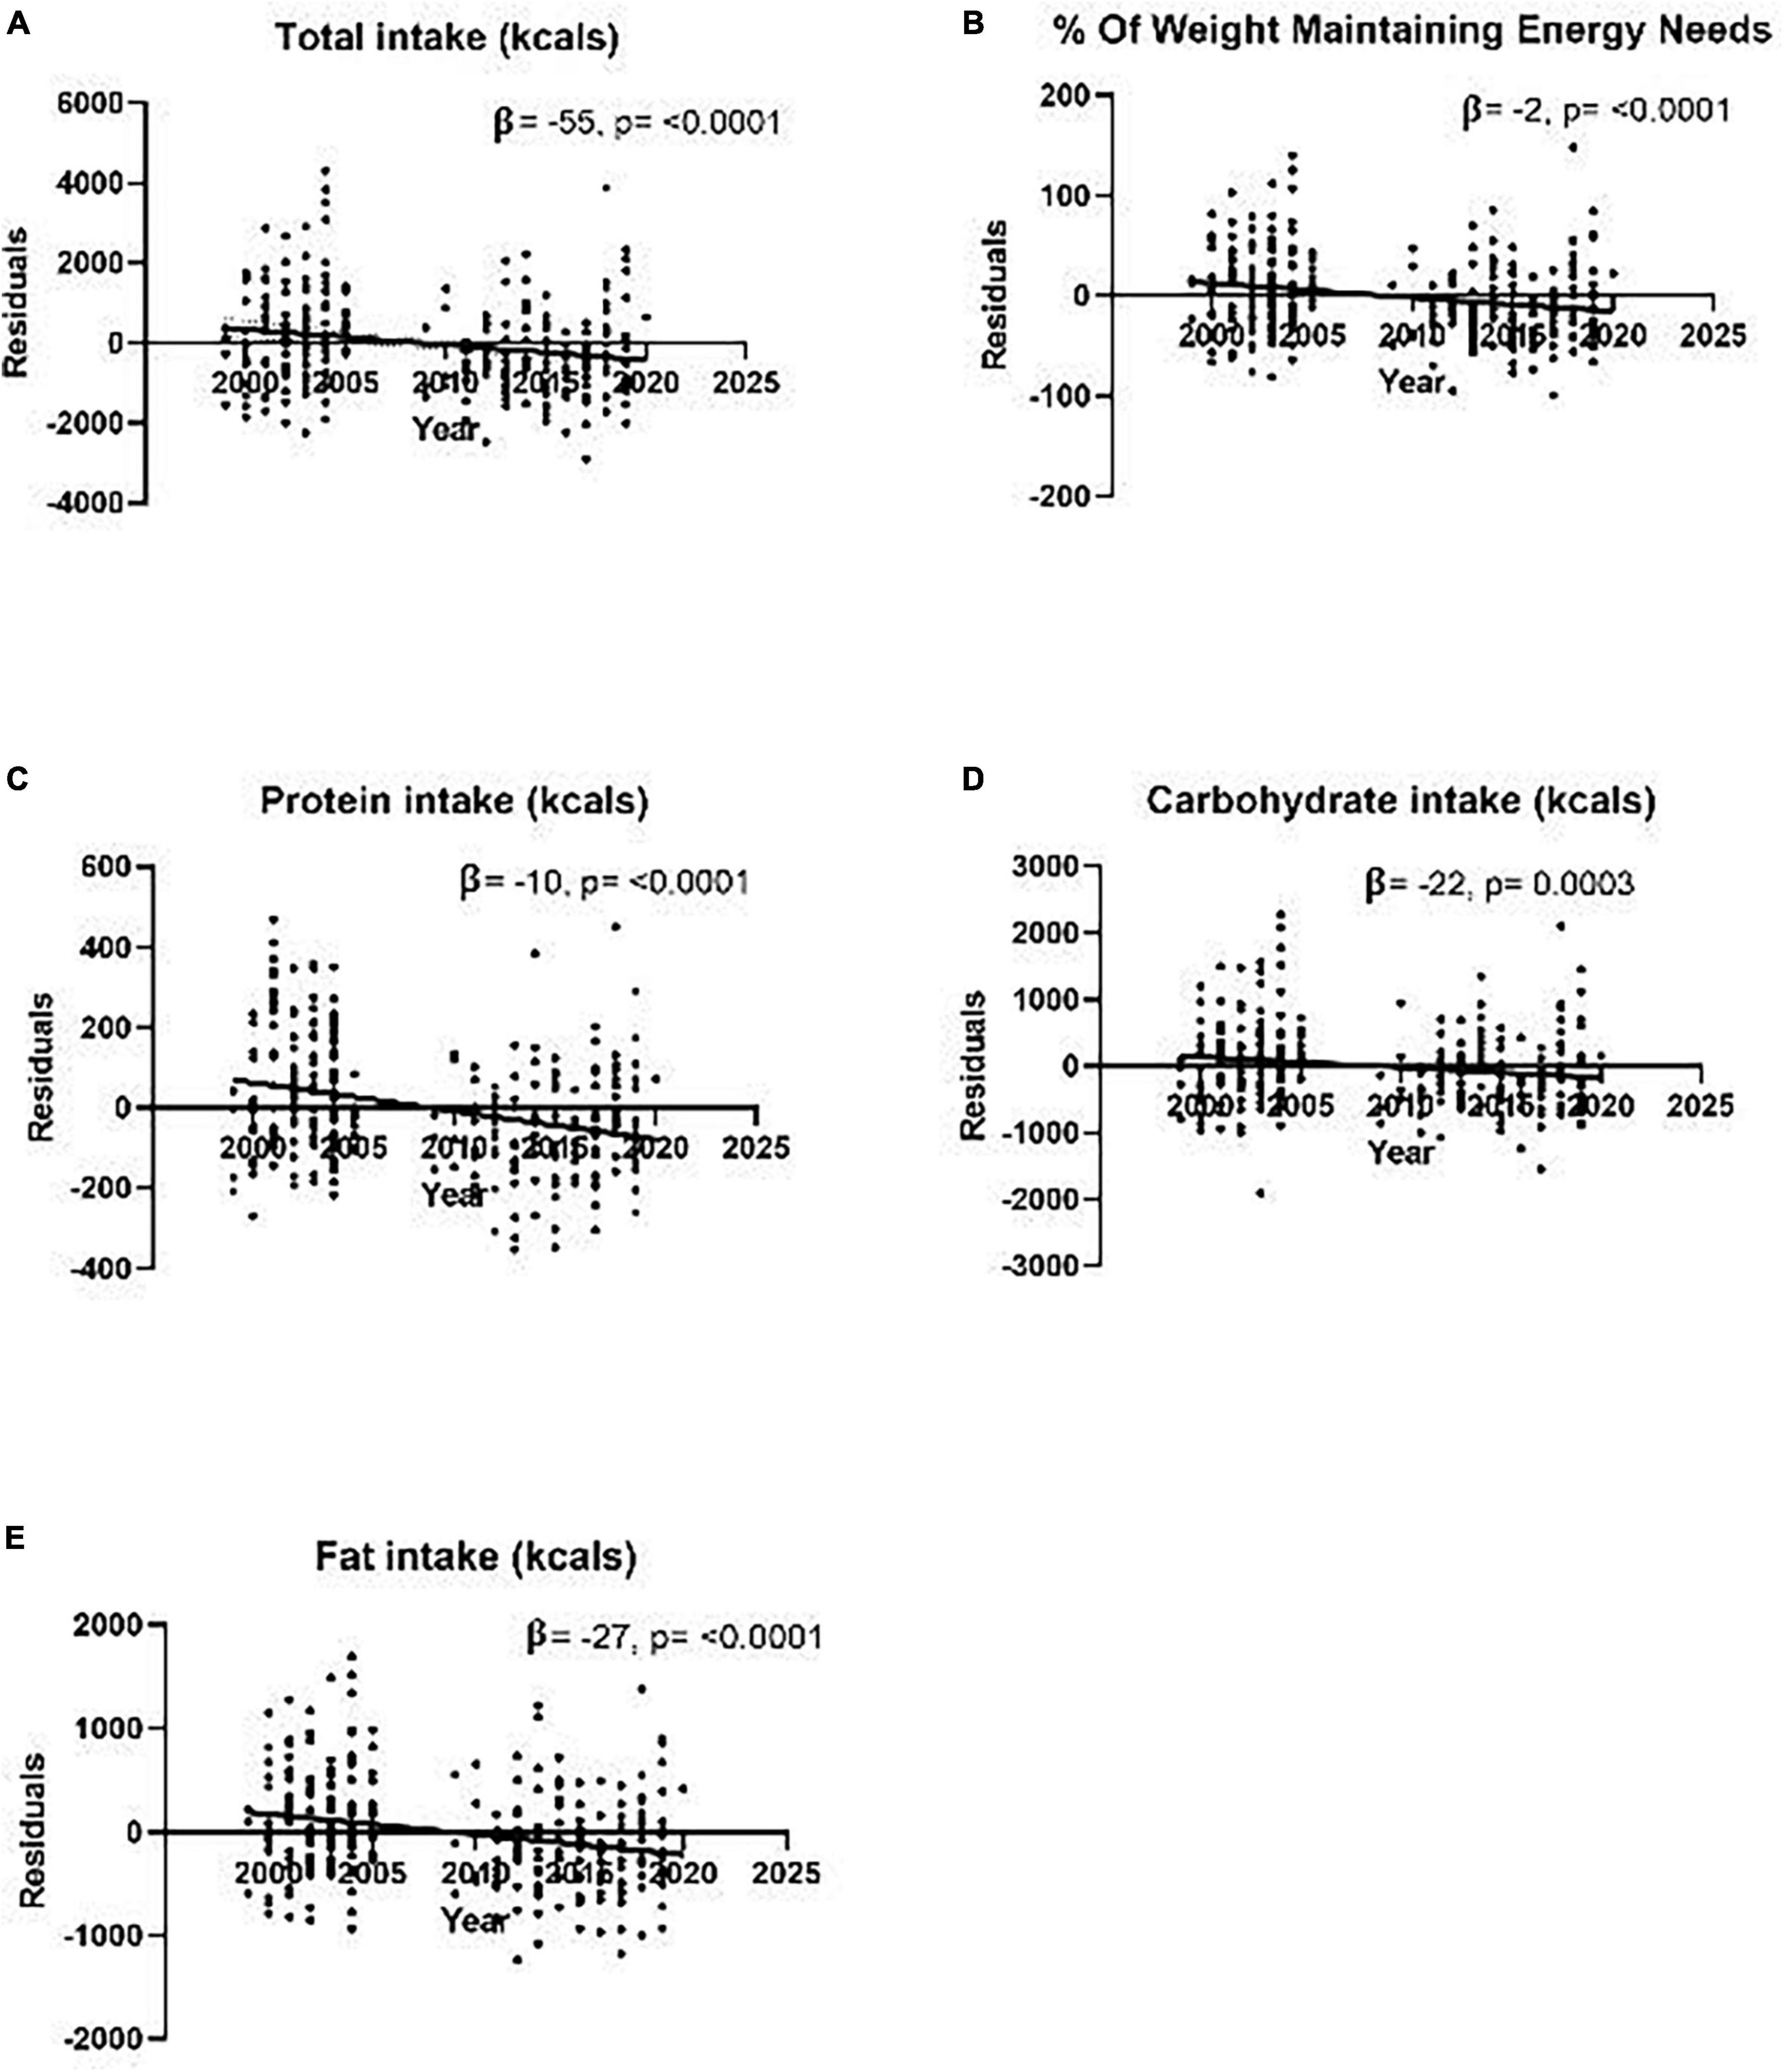
Figure 2. Graphs of adjusted residual models for secular trends analyses of various measures of dietary intake as measured by an objective vending machine paradigm from 1999 to 2020 during a 10-day inpatient study. Models are adjusted for age, sex, race, FFM index, FM index, and date and demonstrate the secular trend in (A) residual total calorie intake (r2 = 0.36) (B) residual %WMEN (r2 = 0.25) (C) residual total protein intake in kcals (r2 = 0.42) (D) residual total carbohydrate intake reported in kcals (r2 = 0.30) (E) residual total fat intake reported in kcals (r2 = 0.35). β are reported as the change in kcals/year. No participants were recruited for this study from 2006 to 2008, leaving a small break in the middle, as seen in the graphs above.
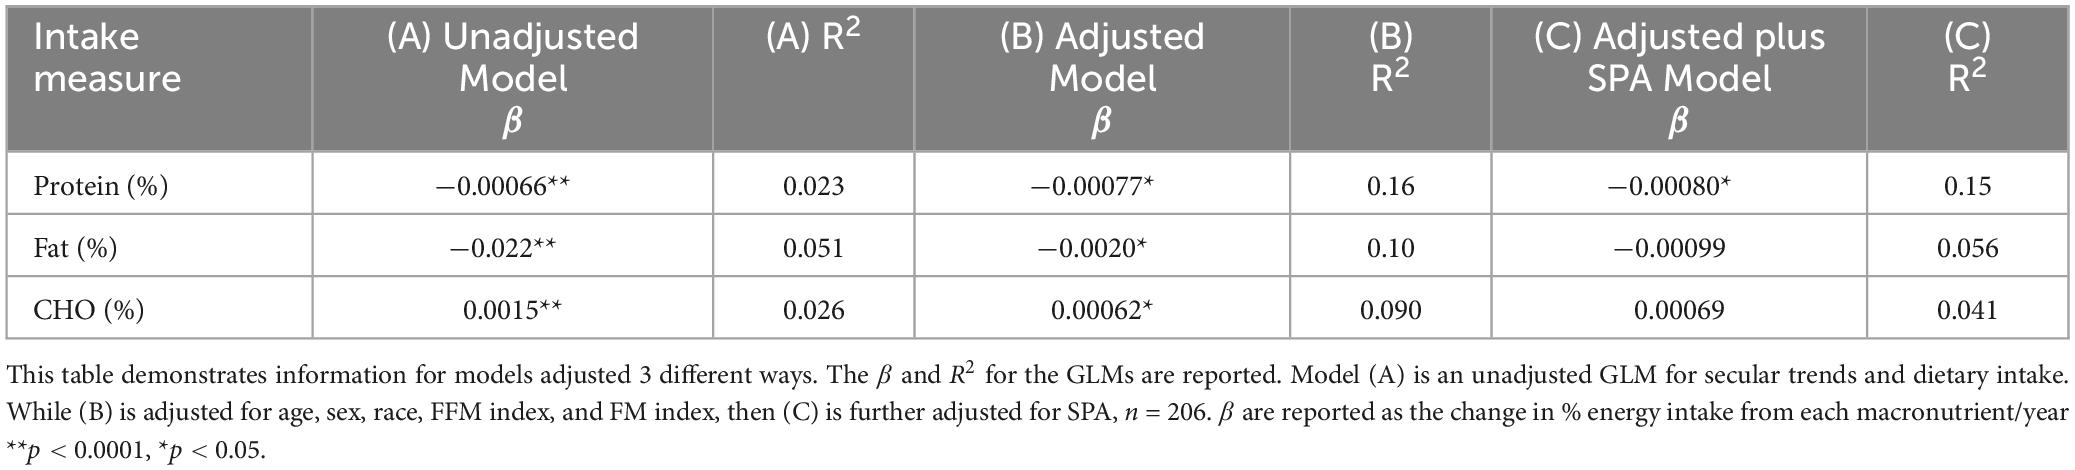
Table 7. General linear models with varying adjustments demonstrating a decline in ad libitum percent macronutrient intake and variance in the models from 1990 to 2020.
3.5 Secular trends of dietary intake and SPA
In previous studies, SPA demonstrated a significant change over time and was therefore added to time and intake models (15). After including SPA, time remained significant in all intake models: total (β = −51 kcal/year, p < 0.0001), %WMEN (β = −2%/year, p < 0.0001), protein (β = −10 kcal/year, p < 0.0001), fat (β = −23 kcal/year, p < 0.0001), and carbohydrate (β = −23 kcal/year, p < 0.0001). Interestingly, as seen in Table 2, including SPA in the models led to a decline in effect size while remaining a significant positive predictor or intake.
4 Discussion
In this analysis of food intake data over twenty years, while season had no effect, there was an overall secular decline in ad libitum food intake in all recorded measures. FFM index and SPA were positive determinants of energy intake and accounted for a large proportion of the variance. With each further adjustment of the secular trends models to include these determinants of intake, there was a decline in overall effect size with a concomitant increase in R2. Despite SPA and body composition adjustment, the secular decrease in intake was still present. In addition, there were no changes in body composition measurements, including body weight, BMI, and body fat percentage.
Previous studies in our unit have associated both SPA and FFM index with dietary intake (5, 16). In this case, SPA reflects small restless physical movements participants make in the respiratory chambers, like sitting to standing, and is a tiny yet highly variable component of energy expenditure (15). In all season and secular models, FFM index and SPA were significant positive predictors of intake and thus were essential features of each model. Models were also adjusted for FFM, FM, and height separately, as opposed to FFM index, and significance remained (data not shown). Other secular and seasonal analyses mentioned above, such as Brown et al., used NHANES cross-sectional data and did not adjust for these known determinants in their models (1, 13, 29, 30). As shown in Table 6, the secular decline in intake persisted despite adjustment for these parameters. With each model adjustment, the parameter estimates decreased, but overall R2 increased, indicating that the FFM index and SPA accounted for some of the decline. While the FFM index was a significant positive predictor in dietary intake models, the FM index was a significant negative predictor of intake. While this is unexpected, other research from our unit found similar results and attributed them to the potential interactions with hormones in obese individuals (16).
Previous studies have reported mixed results on the seasonality of dietary intake (6–10). Winter has been significantly associated with increased dietary intake in several studies (6–8). It is worth noting that while Phoenix, the location of the above analysis, can be characterized by a milder winter compared to these other studies, results in winter have been inconsistent nonetheless. In these studies, seasonal effects varied, with individuals in the US eating more in winter and Japanese eating less (6). Several other analyses have found no significant relationships between dietary intake and season (9, 10). Studies demonstrating seasonal changes in dietary intake relied on methods such as 24-h recall, dietary questionnaires, and food diaries (6–10). In contrast, this above analysis used objective measures of dietary intake on a validated vending machine paradigm (17). There was no overall effect of season for overall or macronutrient intake, even in models adjusted for confounders such as FFM-index or SPA.
When considering these known determinants, the secular trends analysis results showed an unexpected decline in intake across all macronutrient intake measures. Previous reports demonstrating temporal trends in dietary intake are varied. Shan et al. (13) also reported decreases in carbohydrate kcal intake over a similar period, from 1999 to 2016. However, they found increases in protein and fat kcals. (13) In contrast, Brown et al. (1) found increases in carbohydrate intake and decreases in protein and fat. Lastly, Ford and Dietz (29) reported an increase in overall kcals from the 1971–1975 NHANES to the 2003–2004 NHANES but a significant decrease from the 2009–2010 NHANES. Ford and Dietz (29) concluded that dietary intake appears to peak in the 2003–2004 NHANES data and is beginning to trend downward (29). A similar trend was demonstrated with added sugar by Wang et al. (30), with added sugar intake peaking in 2000–2002 and declining by 2009–2010.
A potential explanation for this decrease in measures of intake lies in previously published data on the decrease in SPA. In several previously reported studies, as well as our results above, intake was significantly positively associated with SPA that is limited to restless and fidgeting-like behaviors possible in the whole-room calorimeter (1, 5). Additionally, Travis et al. (15) demonstrated a secular decline in SPA. If the decline in SPA is representative of an overall decrease in physical activity, this could be reflected in less drive to eat (e.g., reduced activity reducing drive for intake). Thus, the secular trend described may be an adaptation to unhealthy and increasingly sedentary conditions. This trend toward increasing sedentary behavior, which, despite reduced energy intake, may be why there aren’t accompanying body composition changes. However, Travis et al. (15) also found significant secular decreases in BMI to accompany their decreases in SPA. Interestingly, no changes in body composition measures (BMI, weight, and percent body fat) were found in this current analysis.
Another possible explanation for the secular decline in energy intake may be increased awareness of nutrition science and government health promotion during this time (11, 31). In particular, the emphasis on overconsumption as a public health issue (32). The beginning of the 21st century was a time marked by an obesogenic food environment of unlimited access to highly palatable foods (12). While we still live in this environment today, the public discourse around the health implications of this environment has increased. This can potentially impact a participant’s eating behavior in controlled conditions. In fact, one study demonstrated that participants tended to eat more at home than in the lab (33). Previous research has also shown that participants who are being watched or know they are being watched tend to restrict their calories (33). Therefore, participants under experimental conditions may have an unintentional bias and increased intake awareness, leading to an inadvertent restriction in energy intake under controlled conditions. This may offer an additional or alternate reason for participants’ eating less on our vending machines over time, without a corresponding decrease in weight or BMI. Unfortunately, this is something that could not be measured in this present analysis but is an interesting consideration for researchers moving forward.
There are a few limitations of this study that need to be acknowledged. First, the population was predominantly Indigenous American, thus possibly limiting the generalizability of these results. However, in other studies from our unit, similarities in the physiology of energy intake have been demonstrated across populations (34). Secondly, food consumption in this vending machine paradigm is done in an inpatient setting, thus not in line with standard dietary intake in a free-living population. However, the vending machine paradigm has high reproducibility across repeated visits (ICC = 0.90), indicating people consistently eat the same across vending days (17). Additional information on secular or seasonal changes in satiety may have provided further insight into dietary intake trends but unfortunately was not collected in this study. Lastly, similar to our food intake measurement, spontaneous physical activity was measured under controlled conditions in the respiratory chamber. Therefore, this may not be entirely reflective of an individual’s free-living physical activity. However, since the measurement of spontaneous physical activity (SPA) has not changed significantly in this time, it may still demonstrate an overall trend of less physical activity while in the chamber, as previously published (5).
Herein, we report a secular decrease in ad libitum intake during an inpatient research study. Increased public health awareness around excessive dietary intake, in addition to previously published work showing a decline in SPA, may be factors driving this current observation of a decrease in energy intake. This suggests that when conducting dietary intake measurements in controlled settings, one should consider the possibility of unintentional dietary restriction among participants. Overall, these findings may elucidate trends in energy intake, its determinants over time, and can inform future analyses into this relationship.
Data availability statement
The datasets presented in this article are not readily available due to the enrollment of Indigenous Americans of Southwestern heritage. Requests to access the datasets should be directed to SV, dm90cnViYXNAbmlkZGsubmloLmdvdg==.
Ethics statement
The studies involving humans were approved by the National Institute of Health IRB. The studies were conducted in accordance with the local legislation and institutional requirements. The participants provided their written informed consent to participate in this study.
Author contributions
MA: Formal analysis, Visualization, Writing – original draft, Writing – review & editing. ES: Data curation, Formal analysis, Visualization, Writing – original draft, Writing – review & editing. PP: Formal analysis, Writing – original draft, Writing – review & editing. JK: Conceptualization, Data curation, Formal analysis, Funding acquisition, Investigation, Methodology, Project administration, Supervision, Writing – original draft, Writing – review & editing. SV: Conceptualization, Formal analysis, Funding acquisition, Investigation, Methodology, Project administration, Resources, Supervision, Writing – original draft, Writing – review & editing.
Funding
The authors declare that financial support was received for the research, authorship, and/or publication of this article. This study was supported by the Intramural Research Program of the National Institutes of Health (NIH) National Institute of Diabetes and Digestive and Kidney Diseases (NIDDK).
Acknowledgments
This research was supported by the Intramural Research Program of the NIH, The National Institute of Diabetes and Digestive and Kidney Diseases (NIDDK).
Conflict of interest
The authors declare that the research was conducted in the absence of any commercial or financial relationships that could be construed as a potential conflict of interest.
The authors declared that they were an editorial board member of Frontiers, at the time of submission. This had no impact on the peer review process and the final decision.
Publisher’s note
All claims expressed in this article are solely those of the authors and do not necessarily represent those of their affiliated organizations, or those of the publisher, the editors and the reviewers. Any product that may be evaluated in this article, or claim that may be made by its manufacturer, is not guaranteed or endorsed by the publisher.
References
1. Brown RE, Sharma AM, Ardern CI, Mirdamadi P, Mirdamadi P, Kuk JL. Secular differences in the association between caloric intake, macronutrient intake, and physical activity with obesity. Obes Res Clin Pract. (2016) 10:243–55.
2. Spence C. Explaining seasonal patterns of food consumption. Int J Gastron Food Sci. (2021) 24:100332.
3. Champagne CM, Han H, Bajpeyi S, Rood J, Johnson WD, Lammi-Keefe CJ, et al. Day-to-day variation in food intake and energy expenditure in healthy women: The Dietitian II study. J Acad Nutr Diet. (2021) 113:1532–8. doi: 10.1016/j.jand.2013.07.001
4. Hales CM, Carroll MD, Fryar C, Ogden CL. Prevalence of obesity and severe obesity among adults. Natl Center Health Stat. (2020) 360:1–8.
5. Piaggi P, Vinales KL, Basolo A, Santini F, Krakoff J. Energy expenditure in the etiology of human obesity: Spendthrift and thrifty metabolic phenotypes and energy-sensing mechanisms. J Endocrinol Invest. (2018) 41:83–9. doi: 10.1007/s40618-017-0732-9
6. Yoshimura E, Tajiri E, Hatamoto Y, Tanaka S. Changes in season affect body weight, physical activity, food intake, and sleep in female college students: A preliminary study. Int J Environ Res Public Health (2020) 17:8713. doi: 10.3390/ijerph17238713
7. Stelmach-Mardas M, Kleiser C, Uzhova I, Penalvo JL, La Torre G, Palys W, et al. Seasonality of food groups and total energy intake: A systematic review and meta-analysis. Eur J Clin Nutr. (2016) 70:700–8. doi: 10.1038/ejcn.2015.224
8. Bhutani S, Wells N, Finlayson G, Schoeller DA. Change in eating pattern as a contributor to energy intake and weight gain during the winter holiday period in obese adults. Int J Obes (Lond). (2020) 44:1586–95. doi: 10.1038/s41366-020-0562-2
9. Bernstein S, Zambell K, Amar MJ, Arango C, Kelley RC, Miszewski SG, et al. Dietary intake patterns are consistent across seasons in a cohort of healthy adults in a metropolitan population. J Acad Nutr Diet. (2016) 116:38–45. doi: 10.1016/j.jand.2015.08.008
10. Ma Y, Olendzki BC, Li W, Hafner AR, Chiriboga D, Hebert JR, et al. Seasonal variation in food intake, physical activity, and body weight in a predominantly overweight population. Eur J Clin Nutr. (2006) 60:519–28. doi: 10.1038/sj.ejcn.1602346
11. Russo R, Li Y, Chong S, Siscovick D, Trinh-Shevrin C, Yi S. Dietary policies and programs in the United States: A narrative review. Prev Med Rep. (2020) 19:101135.
12. Le TH, Disegna M, Lloyd T. National food consumption patterns: Converging trends and the implications for health. EuroChoices. (2023) 22:66–73.
13. Shan Z, Rehm CD, Rogers G, Ruan M, Wang DD, Hu FB, et al. Trends in dietary carbohydrate, protein, and fat intake and diet quality among US adults, 1999-2016. JAMA. (2019) 322:1178–87.
14. Dhurandhar NV, Schoeller D, Brown AW, Heymsfield SB, Thomas D, Sørensen TIA, et al. Energy balance measurement: When something is not better than nothing. Int J Obes. (2015) 39:1109–13.
15. Travis KT, Ando T, Stinson EJ, Krakoff J, Gluck ME, Piaggi P, et al. Trends in spontaneous physical activity and energy expenditure among adults in a respiratory chamber, 1985 to 2005. Obesity (Silver Spring). (2022) 30:645–54. doi: 10.1002/oby.23347
16. Piaggi P, Thearle MS, Krakoff J, Votruba SB. Higher daily energy expenditure and respiratory quotient, rather than fat-free mass, independently determine greater ad libitum overeating. J Clin Endocrinol Metab. (2015) 100:3011–20. doi: 10.1210/jc.2015-2164
17. Venti CA, Votruba SB, Franks PW, Krakoff J, Salbe AD. Reproducibility of ad libitum energy intake with the use of a computerized vending machine system. Am J Clin Nutr. (2010) 91:343–8. doi: 10.3945/ajcn.2009.28315
18. Ferraro R, Boyce V, Swimburn B, De Gregorio M, Ravussin E. Energy cost of physical activity on a metabolic ward in relationsip to obesity. Am J Clin Nutr. (1991) 53:1368–71. doi: 10.1093/ajcn/53.6.1368
19. Penesova A, Venti CA, Bunt JC, Bonfiglio SM, Votruba SB, Krakoff J. Short-term isocaloric manipulation of carbohydrate intake: Effect on subsequent ad libitum energy intake. Eur J Nutr. (2011) 50:455–63. doi: 10.1007/s00394-010-0152-5
20. Weise CM, Hohenadel MG, Krakoff J, Votruba SB. Body composition and energy expenditure predict ad-libitum food and macronutrient intake in humans. Int J Obes (Lond). (2014) 38:243–51.
21. Reinhardt M, Piaggi P, DeMers B, Trinidad C, Krakoff J. Cross calibration of two dual-energy X-ray densitometers and comparison of visceral adipose tissue measurements by iDXA and MRI. Obesity (Silver Spring). (2017) 25:332–7. doi: 10.1002/oby.21722
22. Vozarova B, Wang J, Weyer C, Tataranni PA. Comparison of two software versions for assessment of body-composition analysis by DXA. Obes Res. (2001) 9:229–32.
23. Ravussin E, Lillioja S, Anderson T, Christin L, Bogardus C. Determinants of 24-hour energy expenditure in man: Methods and results using a respiratory chamber. J Clin Invest. (1986) 78:1568–78.
24. Geiselman PJ, Anderson AM, Dowdy ML, West DB, Redmann SM, Smith SR. Reliability and validity of a macronutrient self-selection paradigm and a food preference questionnaire. Physiol Behav. (1998) 63:919–28. doi: 10.1016/s0031-9384(97)00542-8
27. Aydin BN, Stinson EJ, Cabeza De Baca T, Ando T, Travis KT, Piaggi P, et al. Investigation of seasonality of human spontaneous physical activity and energy expenditure in respiratory chamber in Phoenix, Arizona. Eur J Clin Nutr. (2023) 3:1–7. doi: 10.1038/s41430-023-01347-y
29. Ford ES, Dietz WH. Trends in energy intake among adults in the United States: Findings from NHANES. Am J Clin Nutr. (2013) 97:848–53.
30. Wang H, Steffen LM, Zhou X, Harnack L, Luepker RV. Consistency between increasing trends in added-sugar intake and body mass index among adults: The Minnesota heart survey, 1980-1982 to 2007-2009. Am J Public Health. (2013) 103:501–7. doi: 10.2105/AJPH.2011.300562
31. Ellison B, Lusk JL, Davis D. the impact of restaurant calorie labels on food choice: Results from a field experiment. Econ Inq. (2014) 52:666–81. doi: 10.1016/j.ehb.2016.03.001
32. Hall KD. Did the food environment cause the obesity epidemic? Obesity (Silver Spring). (2018) 26:11–3.
33. Gough T, Haynes A, Clarke K, Hansell A, Kaimkhani M, Price B, et al. Out of the lab and into the wild: The influence of portion size on food intake in laboratory vs. real-world settings. Appetite. (2021) 162:105160. doi: 10.1016/j.appet.2021.105160
Keywords: dietary intake, secular trends, seasonality, spontaneous physical activity, self-report dietary intake
Citation: Ahern MM, Stinson EJ, Piaggi P, Krakoff J and Votruba SB (2024) Secular trends and determinants of ad libitum energy intake measured in a research setting from 1999-2020. Front. Nutr. 11:1374386. doi: 10.3389/fnut.2024.1374386
Received: 22 January 2024; Accepted: 27 May 2024;
Published: 12 June 2024.
Edited by:
Amanda Jane Lloyd, Aberystwyth University, United KingdomReviewed by:
Hideki Matsumoto, Ajinomoto, JapanKatarina Tomljenovic Borer, The University of Michigan, United States
Copyright © 2024 Ahern, Stinson, Piaggi, Krakoff and Votruba. This is an open-access article distributed under the terms of the Creative Commons Attribution License (CC BY). The use, distribution or reproduction in other forums is permitted, provided the original author(s) and the copyright owner(s) are credited and that the original publication in this journal is cited, in accordance with accepted academic practice. No use, distribution or reproduction is permitted which does not comply with these terms.
*Correspondence: Susanne B. Votruba, dm90cnViYXNAbmlkZGsubmloLmdvdg==