
95% of researchers rate our articles as excellent or good
Learn more about the work of our research integrity team to safeguard the quality of each article we publish.
Find out more
ORIGINAL RESEARCH article
Front. Nutr. , 17 June 2024
Sec. Nutritional Epidemiology
Volume 11 - 2024 | https://doi.org/10.3389/fnut.2024.1366525
This article is part of the Research Topic Objective Dietary Assessment in Nutrition Epidemiology Studies - Volume II View all 20 articles
 Xuesong Yang1†
 Cheng Liu1†
 Yanbo Liu1
 Zhigang He1
 Juan Li1Yijing Li1Yanqiong Wu1
 Anne Manyande2Maohui Feng3*
 Hongbing Xiang1,4*
Objective: The objective of this study was to assess the global burden of disease for developmental and intellectual disabilities caused by iodine deficiency from 1990 to 2019.
Methods: Using data from the global burden of disease (GBD) 2019, we conducted a cross-country inequity analysis to examine the worldwide burden of developmental and intellectual disabilities caused by the issue of iodine deficiency from 1990 to 2019. Absolute and relative inequality were assessed by the slope index of inequality and the concentration index, respectively. After summarising the latest evidence, we also projected the age-standardized prevalence and years lived with disability (YLD) rates up to 2030 using the BAPC and INLA packages in R statistical software.
Results: In 2019, the global age-standardized prevalence and YLD rates for developmental and intellectual disabilities due to iodine deficiency were 22.54 per 100,000 population (95% UI 14.47 to 29.23) and 4.12 per 100,000 population (95% UI 2.25 to 6.4), respectively. From 1990 to 2019, the age-standardized prevalence and YLD rates of developmental and intellectual disabilities due to iodine deficiency decreased significantly. Geographic distribution showed that areas with lower socio-demographic indices (SDI) were the most affected. The correlation between higher SDI and lower prevalence highlights the role of economic and social factors in the prevalence of the disease. Cross-national inequity analysis shows that disparities persist despite improvements in health inequalities. In addition, projections suggest that the disease burden may decline until 2030.
Conclusion: This research underscores the necessity for targeted interventions, such as enhancing iodine supplementation and nutritional education, especially in areas with lower SDI. We aim to provide a foundation for policymakers further to research effective preventative and potential alternative treatment strategies.
Iodine deficiency, a significant contributor to the global burden of disease, affects the synthesis of thyroid hormones, leading to many diseases related to metabolism and growth, that threaten people’s physical health and development (1, 2). Thyroid hormones are iodine-containing compounds, representing a combination of T3, T4, and rT3 (3). Among these, T4 is the most abundantly secreted (4), while T3 the most biologically active, and is approximately five times more potent than the former (5–8). The synthesis of thyroid hormones is dependent on the intake of iodine, which serves as an essential raw material for thyroid hormone production (9). Approximately 80–90% of the required iodine comes from iodide compounds found in food, primarily iodized sodium and potassium (10). The World Health Organization (WHO) recommends a daily iodine intake of 150 micrograms for adults (11). However, the physiological iodine requirements increase during pregnancy and lactation, but the daily dose should not exceed 200 micrograms (11). In addition to obtaining iodine from external sources, the iodine needed for thyroid hormone synthesis can also be recycled from iodine-containing compounds within the thyroid gland (12).
Thyroid hormones act on nearly all tissues in the body and play a crucial role in regulating various stages of promoting and maintaining growth, development, and metabolism (13), with a wide range of biological effects. During the embryonic and neonatal stages, thyroid hormones facilitate the proliferation and differentiation of neurons as well as the formation of synapses (14). Therefore, thyroid hormone deficiency during early childhood can lead to irreversible developmental disorders of the nervous system, known as cretinism (15). This condition is characterized by delayed intellectual development, stunted growth, and incomplete tooth development. Compared to the general population, individuals with intellectual disabilities are more likely to face challenges in accessing equitable healthcare and experience premature mortality (16). A study conducted in the United States by Gaylord et al. (17) reported that the difference in cost attributed to intellectual disabilities (from 2001 to 2016) would continue to yield ongoing benefits of $38 billion. Therefore, it is essential for us to comprehend the epidemiological characteristics of this disease. In humans, throughout the first three months of fetal development, the fetus is unable to synthesize thyroid hormones on its own (18). During this period, the thyroid hormones required for fetal growth and development are entirely supplied by the mother (19). Therefore, pregnant women with a history of iodine deficiency particularly need iodine supplementation to reduce the risk of cretinism (19).
Previous GBD studies have emphasized the burden of disease due to iodine deficiency or mental retardation (20–22), or have examined developmental and intellectual disabilities caused by other factors such as lead exposure (23). Rather than specifically addressing the burden of developmental and intellectual disabilities due to iodine deficiency. Despite the fact that iodine deficiency is the most prevalent and preventable cause of developmental and intellectual disabilities (2), there is a paucity of research on intellectual and developmental disabilities due to iodine deficiency based on GBD data. There is also a lack of studies predicting the burden of disease for developmental and intellectual disabilities due to iodine deficiency based on GBD data. Therefore, we used data from GBD 2019 to iodine deficiency trends in prevalence and YLD at the global, regional, and national levels, stratified by sex, age, SDI, and level of developmental and intellectual disability. Our study aims to analyze the global burden of developmental and intellectual disabilities due to iodine deficiency, provide a reference for scholars in the field, and promote the prevention of this condition.
In the GBD study, developmental and intellectual disabilities refer to situations where an individual’s intellectual abilities are below the average. The severity of intellectual disabilities is categorized into five levels based on IQ test scores (standardized with a mean of 100), including borderline (IQ scores of 70–85), mild (IQ scores of 50–69), moderate (IQ scores of 35–49), severe (IQ scores of 20–34), and profound (IQ scores of 0–19) (24). The nonfatal iodine deficiency burden includes estimates for visible goiter (grade 2) and its associated consequences such as thyroid dysfunction, heart failure, and intellectual disability but excludes estimates for subclinical iodine deficiency or nonvisible goiter (grade 1) caused by iodine deficiency (25).
An extensive analysis was conducted to extract prevalence and YLD data related to developmental and intellectual disability associated with iodine deficiency. The analysis covered a global perspective and further profiled data from 1990 to 2019 by region, income group, and sex. Our estimates are presented in both raw values and age-standardized rates. YLD serves as a crucial metric in gauging the impact of this condition on individuals’ and societies’ quality of life. It relies on standardized disability weights assigned to each health state. The methodology for calculating YLD has been described in detail in previous studies (26–28). To compile these data, we leveraged the GBD study, which aggregates clinically informative data from various sources, including hospital records, ambulatory care (such as general practitioner visits) and health insurance claims. For each GBD cause (disease), we computed ratios of non-primary to primary diagnosis rates and ratios of outpatient to inpatient care across multiple regions. In our modeling process, we employed DisMod-MR. The strategy allowed us to generate precise estimates for each metric of interest, including prevalence and YLD, while accounting for variables such as age, sex, location, and year of analysis. We estimated the developmental and intellectual disabilities of two extended categories: severe intellectual disability and profound intellectual disability from the GBD 2019. The classification information of developmental and intellectual disabilities came from a 2008 systematic review (29). We conducted all statistical analyses and generated visualizations using R statistical software (version 4.2.3). Statistical significance was determined with a p-value < 0.05.
Our estimates are categorized according to the socio-demographic index (SDI), determined by factors such as income per capita, educational attainment, and the total fertility rate among women under the age of 25 years. SDI is classified into five categories: low (< 0.46), low-middle (0.46–0.61), middle (0.61–0.69), high-middle (0.69–0.80), and high (> 0.80) (30, 31).
In this study, we utilized the concentration index (CI) and the slope index to measure the health inequalities. The slope index of inequality and concentration index, are the two established standard indicators of absolute and relative inequality, respectively (32). The slope index of inequality is determined through regression analysis of the national YLDs ratio across all age groups against a relative positional scale linked to the SDI. It’s defined as the midpoint of the population’s cumulative range ranked according to the SDI (33, 34). Heteroscedasticity is addressed using a weighted regression model. The concentration index is computed by numerically integrating the area under the Lorenz concentration curve. This curve is constructed by fitting the cumulative scores of YLDs against the cumulative relative distribution of the population according to the SDI (35). The concentration index is signed, and if the Lorenz curve is above the diagonal line, the concentration index is negative, indicating that the disease burden is concentrated in poorer countries. If the Lorenz curve is below the diagonal line, it suggests that the disease burden is concentrated in wealthier countries.
We used Bayesian age-period-cohort (BAPC) models to assess and project the prevalence and YLDs rates till 2030 (36, 37). The BAPC model relies on an integrated nested Laplacian approximation to estimate marginal posterior distributions, helping circumvent some of the mixing and convergence issues associated with the traditional Bayesian method of Markov Chain Monte Carlo sampling (38). The BAPC and INLA packages in R statistical software (version 4.2.3) were used for BAPC analyses.
After controlling the effect of population and age structure, age-standardized prevalence rates for developmental and intellectual disabilities due to iodine deficiency fell by 58.54%, from 54.37 (95 % UI 38.57 to 67.63) per 100 000 population in 1990 to 22.54 (95 % UI 14.47 to 29.23) per 100 000 population in 2019 (Supplementary Table 1).
Similarly, global age-standardized YLD rates decreased by 57.08 %, from 9.6 (95 % UI 5.61 to 14.39) per 100 000 population in 1990 to 4.12 (95 % UI 2.25 to 6.4) per 100 000 population in 2019. From 1990, the age-standardized prevalence and YLD rates showed a downward trend (Figures 1A, B). In 2019, the prevalence and YLD rates of developmental and intellectual disabilities gradually increased with age, and all reached a peak in the 15–19 age group (Figures 1C, D). Then, the prevalence and YLD rates by age declined rapidly in the 15–19 age group and slowly in those above the age of 20 to 24. For each age group, profound intellectual disability levels were higher than severe intellectual disability in 2019. Regardless of age, year, or degree of developmental and intellectual disabilities, the age-standardized prevalence and YLD rates were consistently higher in females than in males.
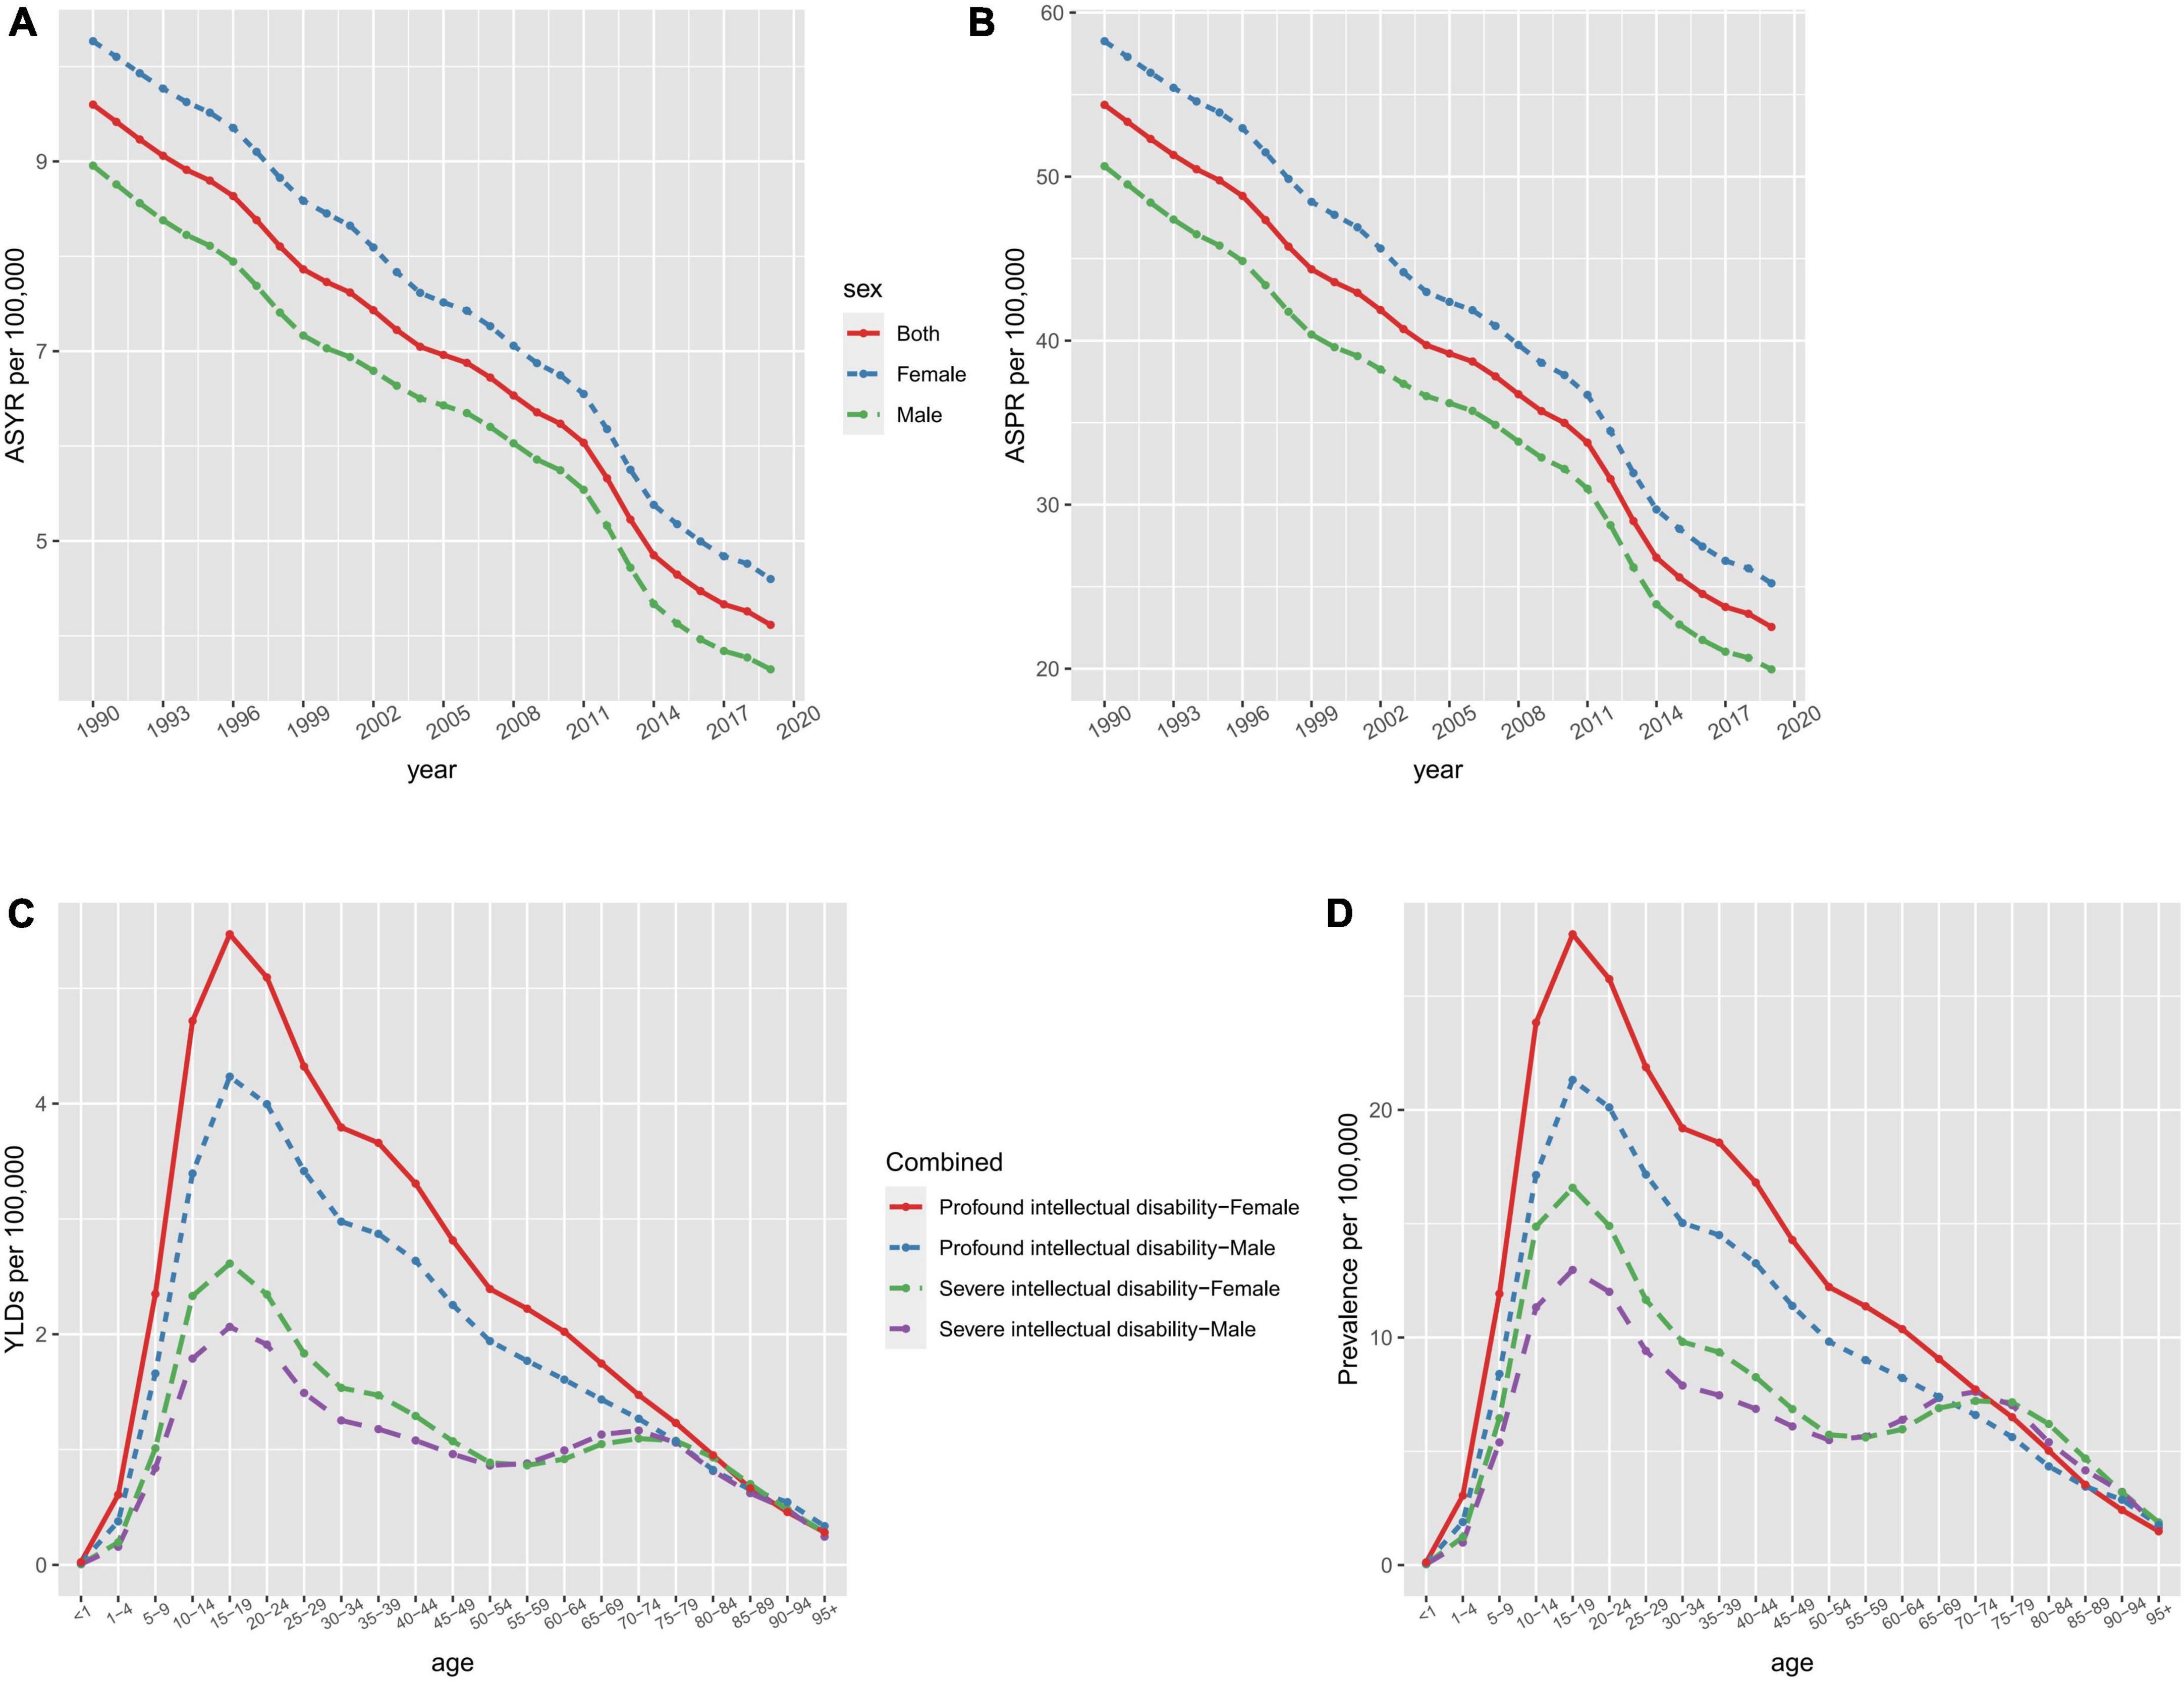
Figure 1. The ASYR (A) and ASPR (B) of developmental and intellectual disabilities attributable to iodine deficiency per 100,000 people from 1990 to 2019 and age-specific rates of YLDs (C) and prevalence (D) of developmental intellectual disability attributable to iodine deficiency by sex and type in 2019. ASPR, age-standardized prevalence rate; ASYR, age standardized YLDs rate.
These heatmaps illustrate the distributional situation of sex and developmental and intellectual disabilities of burden due to iodine deficiency in GBD regions in 2019 (Figure 2 and Supplementary Figure 1). The shade of color of each block in the heatmap represents the size of the numerical value, and the figure inside, the absolute number of the age-standardized prevalence and YLD rates. The Low SDI region had the highest total age-standardized prevalence rates and YLD rates in both sexes, followed by South Asia and Central Sub-Saharan Africa. Profound intellectual disability accounted for the majority of the age-standardized prevalence and YLD rates of all GBD regions and the Low SDI region had the highest age-standardized prevalence rates and YLD rates for profound intellectual disability. But the lowest age-standardized prevalence rates and YLD rates were seen in South Asia.
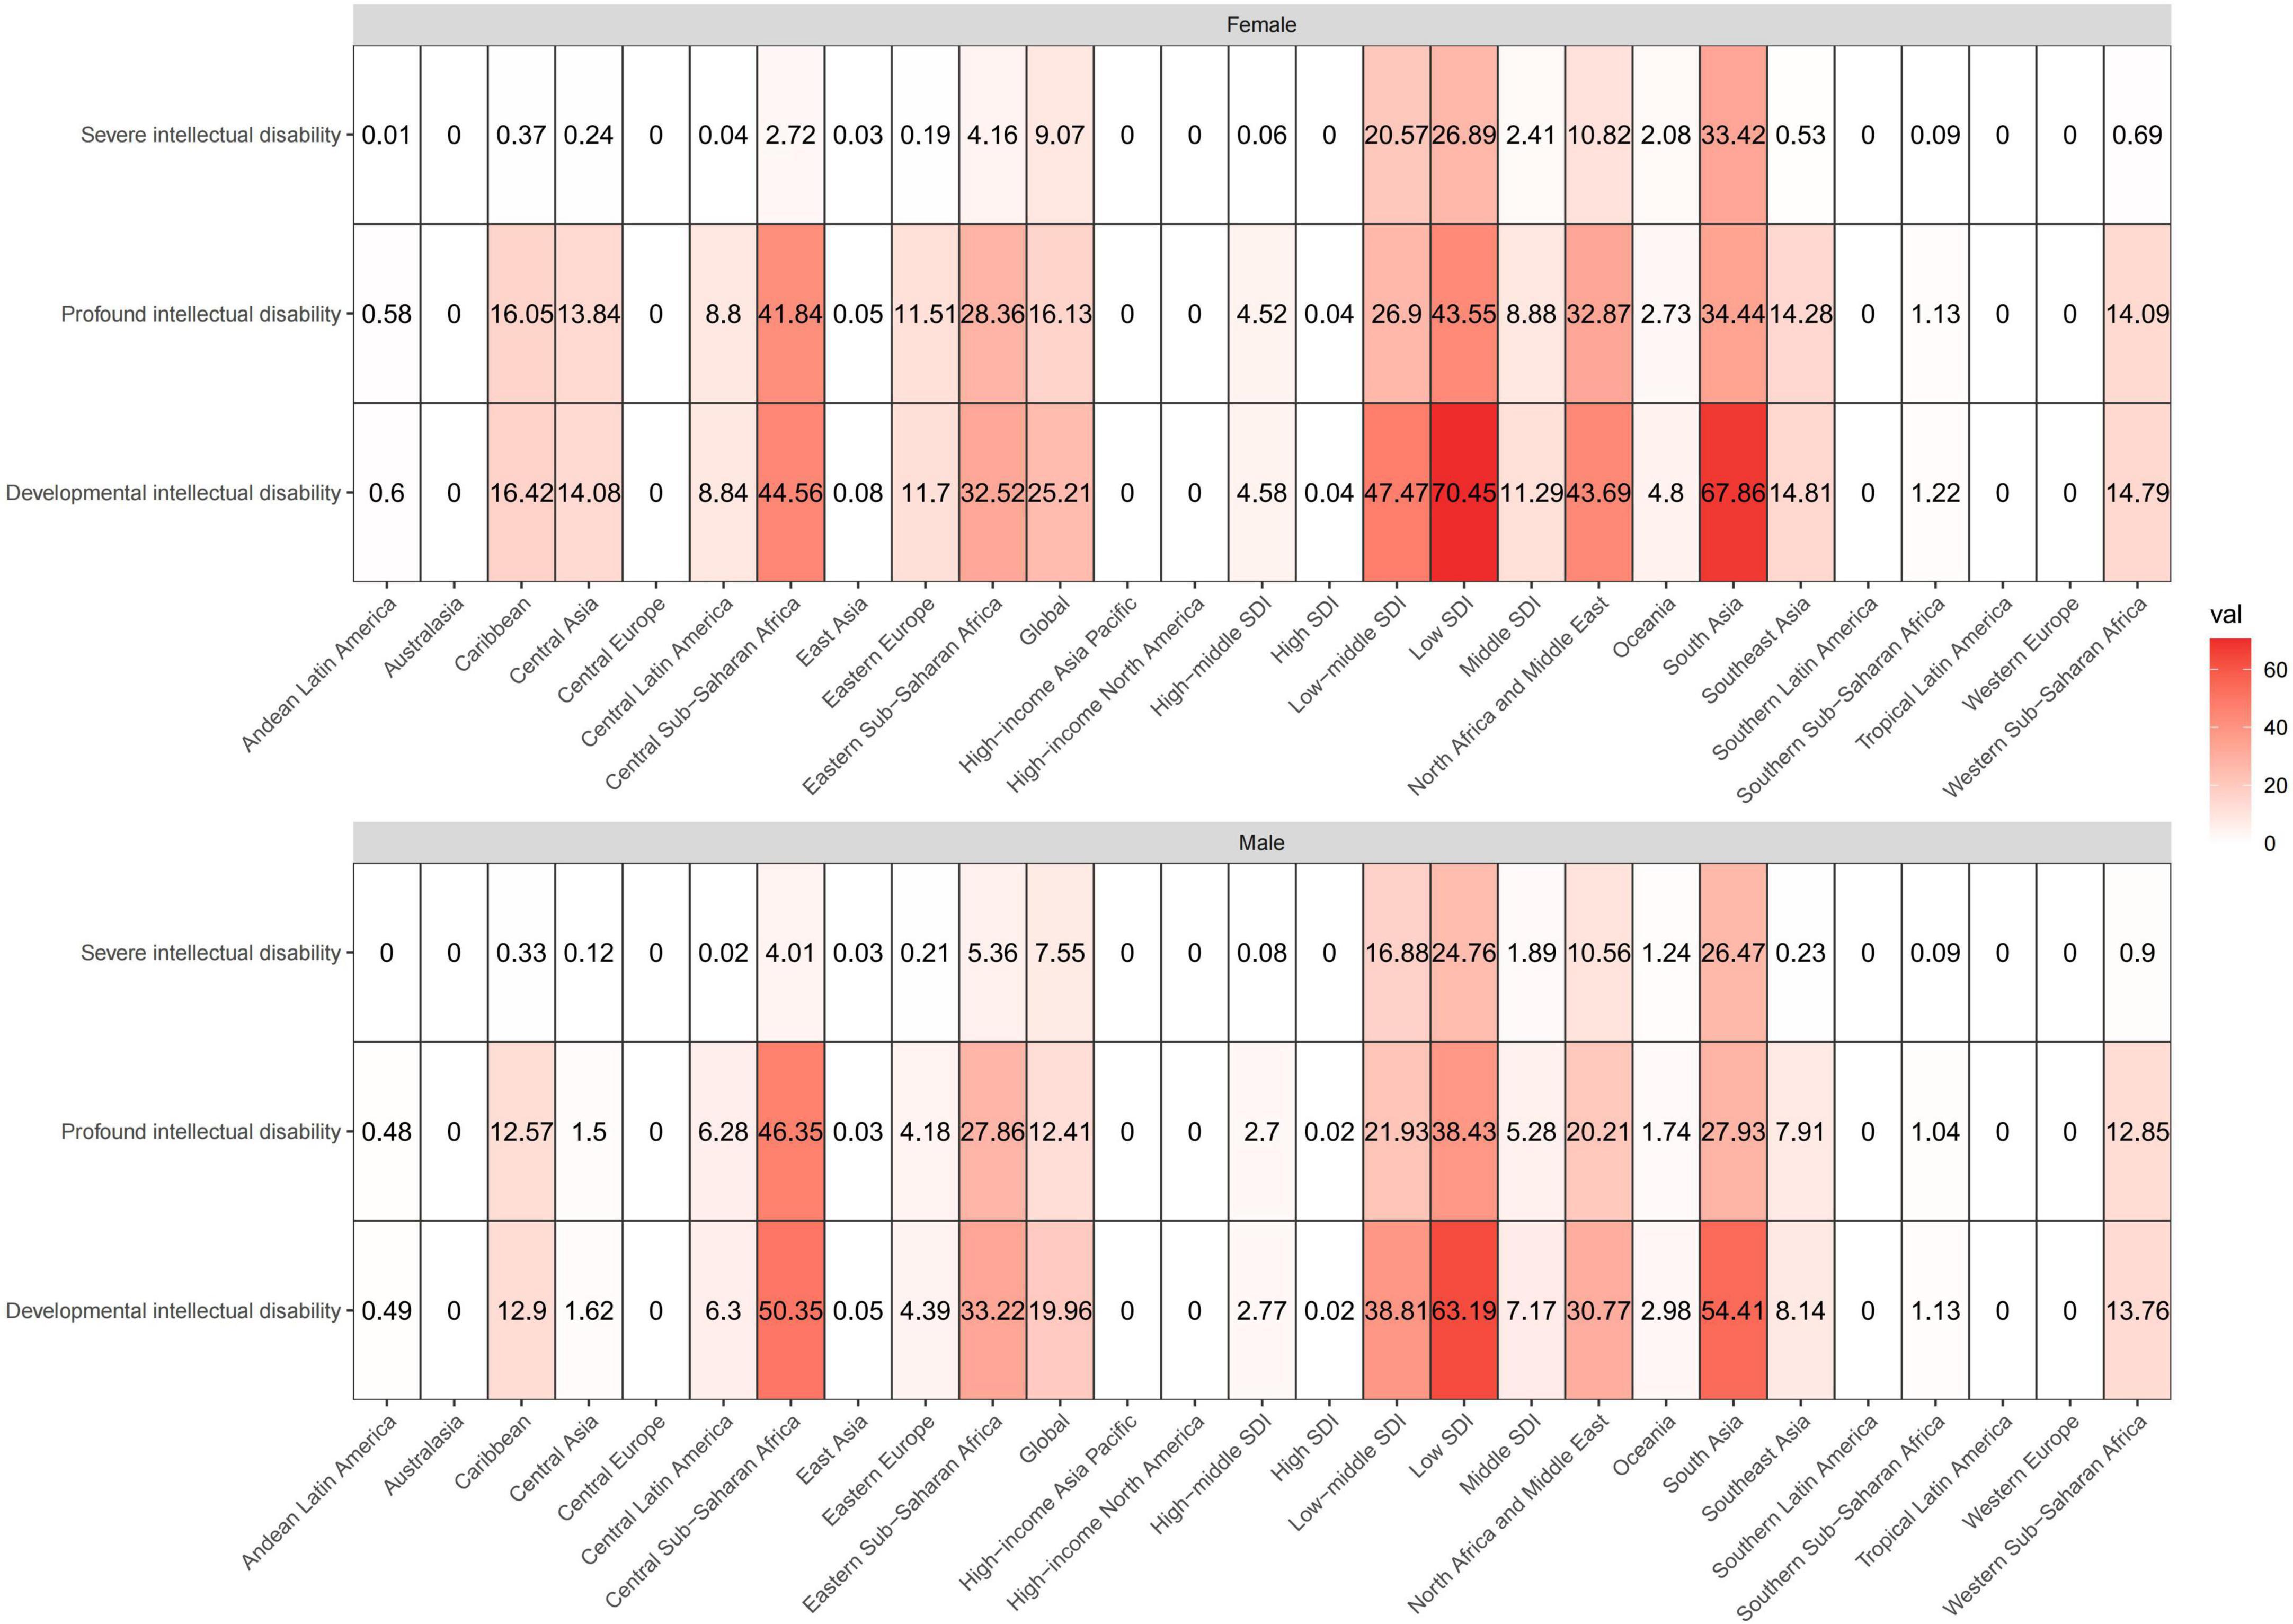
Figure 2. These heatmaps show the ASPR of developmental intellectual disability attributable to iodine deficiency in GBD regions by sex and severity categories in 2019. The shade of color of each block in the heatmap represents the size of the numerical value, and the figure inside represents the absolute number of the age-standardized prevalence. ASPR, age-standardized prevalence rate.
Figure 3 maps the distribution of the health burden of developmental and intellectual disabilities due to iodine deficiency worldwide in 2019. The age-standardized prevalence rate (Figure 3A) was highest in Somalia [162.42 (95 % UI 99.59 to 216.34) per 100 000 population], followed by Yemen [121.68 (95 % UI 65.61 to 174.69) per 100 000 population] and Afghanistan [117.09 (95 % UI 78.01 to 146.97) per 100 000 population] (Figure 3A and Supplementary Table 2). The highest age-standardized YLD rate was also found in Somalia [28.74 (95 % UI 15.49 to 45.61) per 100 000 population], followed by Yemen [21.9 (95 % UI 10.71 to 35.69) per 100 000 population] and Afghanistan [20.54 (95 % UI 12.11 to 31.52) per 100 000 population] (Figure 3B and Supplementary Table 2). HDI data in 2019 were available for 204 countries and territories, including thirty-three in the low HDI group, forty-two in low-middle SDI, forty one in middle SDI group, forty-two in high-middle SDI group, and forty-six in high HDI group.
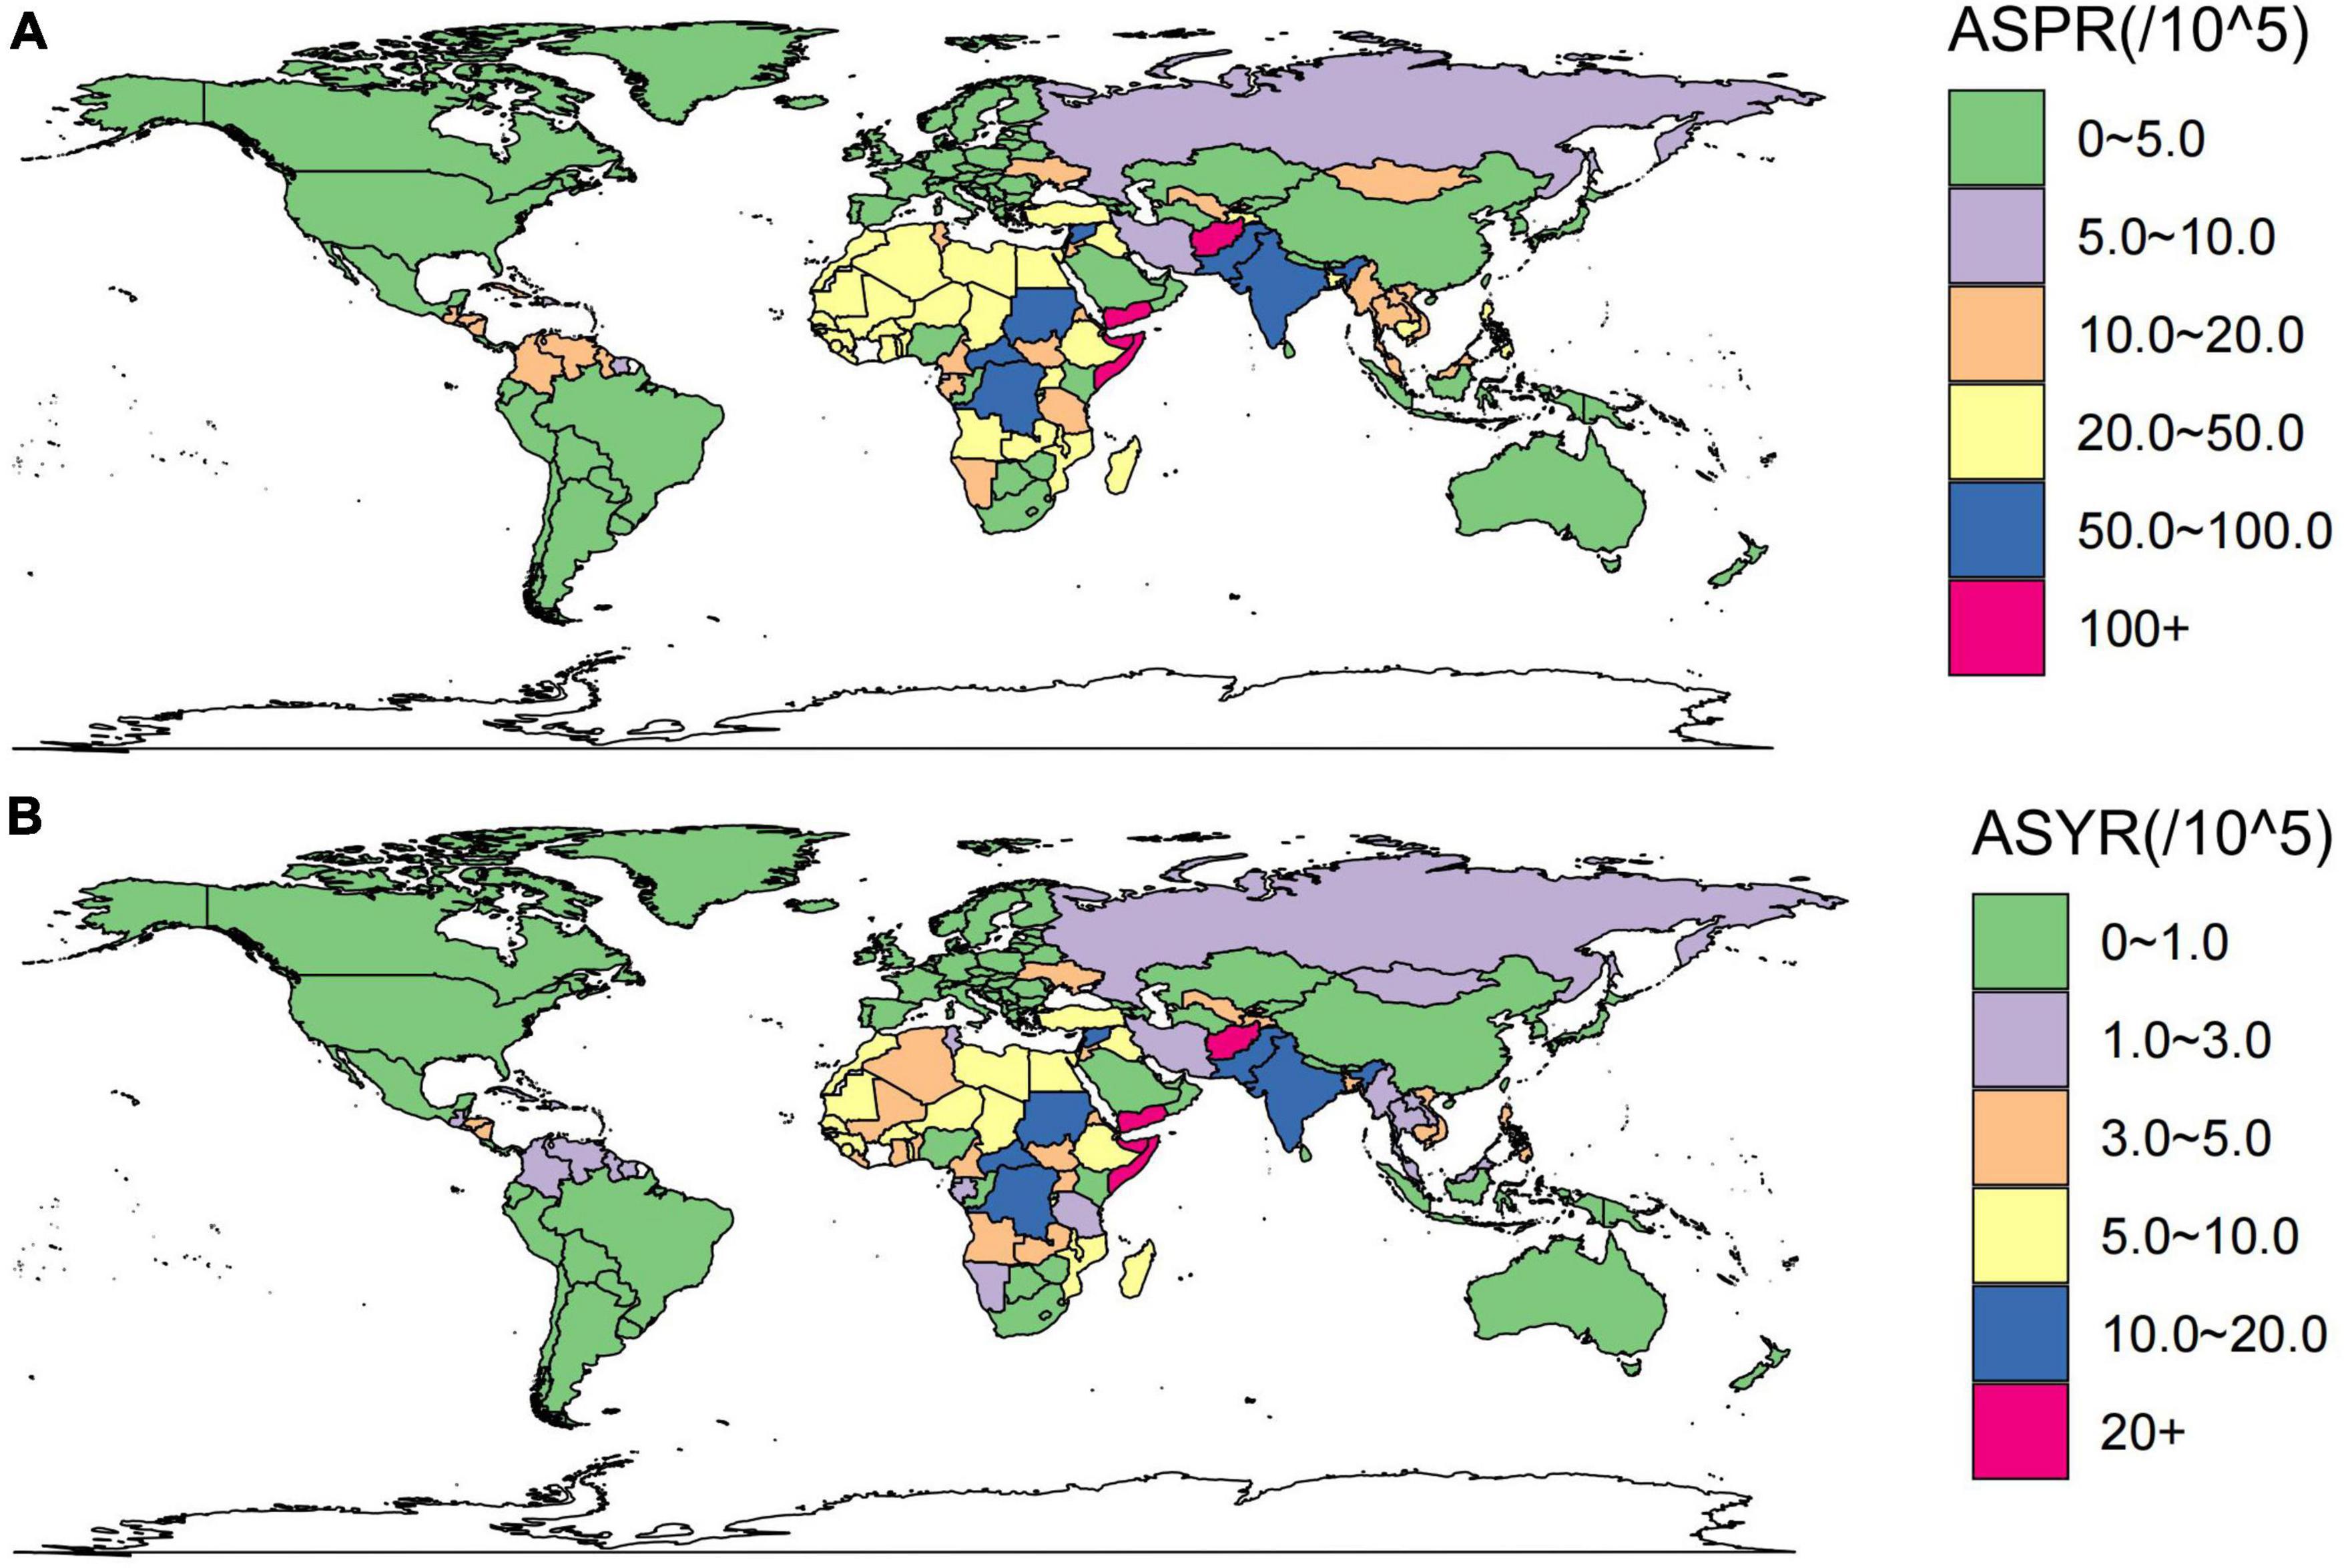
Figure 3. These maps show the ASPR (A) and ASYR (B) of developmental and intellectual disabilities attributable to iodine deficiency per 100,000 people in 2019. ASPR, age-standardized prevalence rate; ASYR, age standardized YLDs rate.
In 2019, countries with higher socio-demographic indexes tended to have lower prevalence rates than those with a low socio-demographic index (Figure 4). Spearman rank-order analysis revealed a strong, negative correlation between the age-standardized prevalence rate (rho = −0.689; p < 0.001) and socio-demographic index (Figure 4A), and likewise, a clear negative correlation was also seen between the age-standardized YLD rate and socio-demographic index (rho = −0.668; p < 0.001) (Figure 4B). The estimated annual percentage change of age-standardized prevalence and YLD rates from 1990 to 2019 showed weak correlations (rho = −0.186, P = 0.033; rho = −0.216, P = 0.013) with the socio-demographic index (Figures 4C, D).
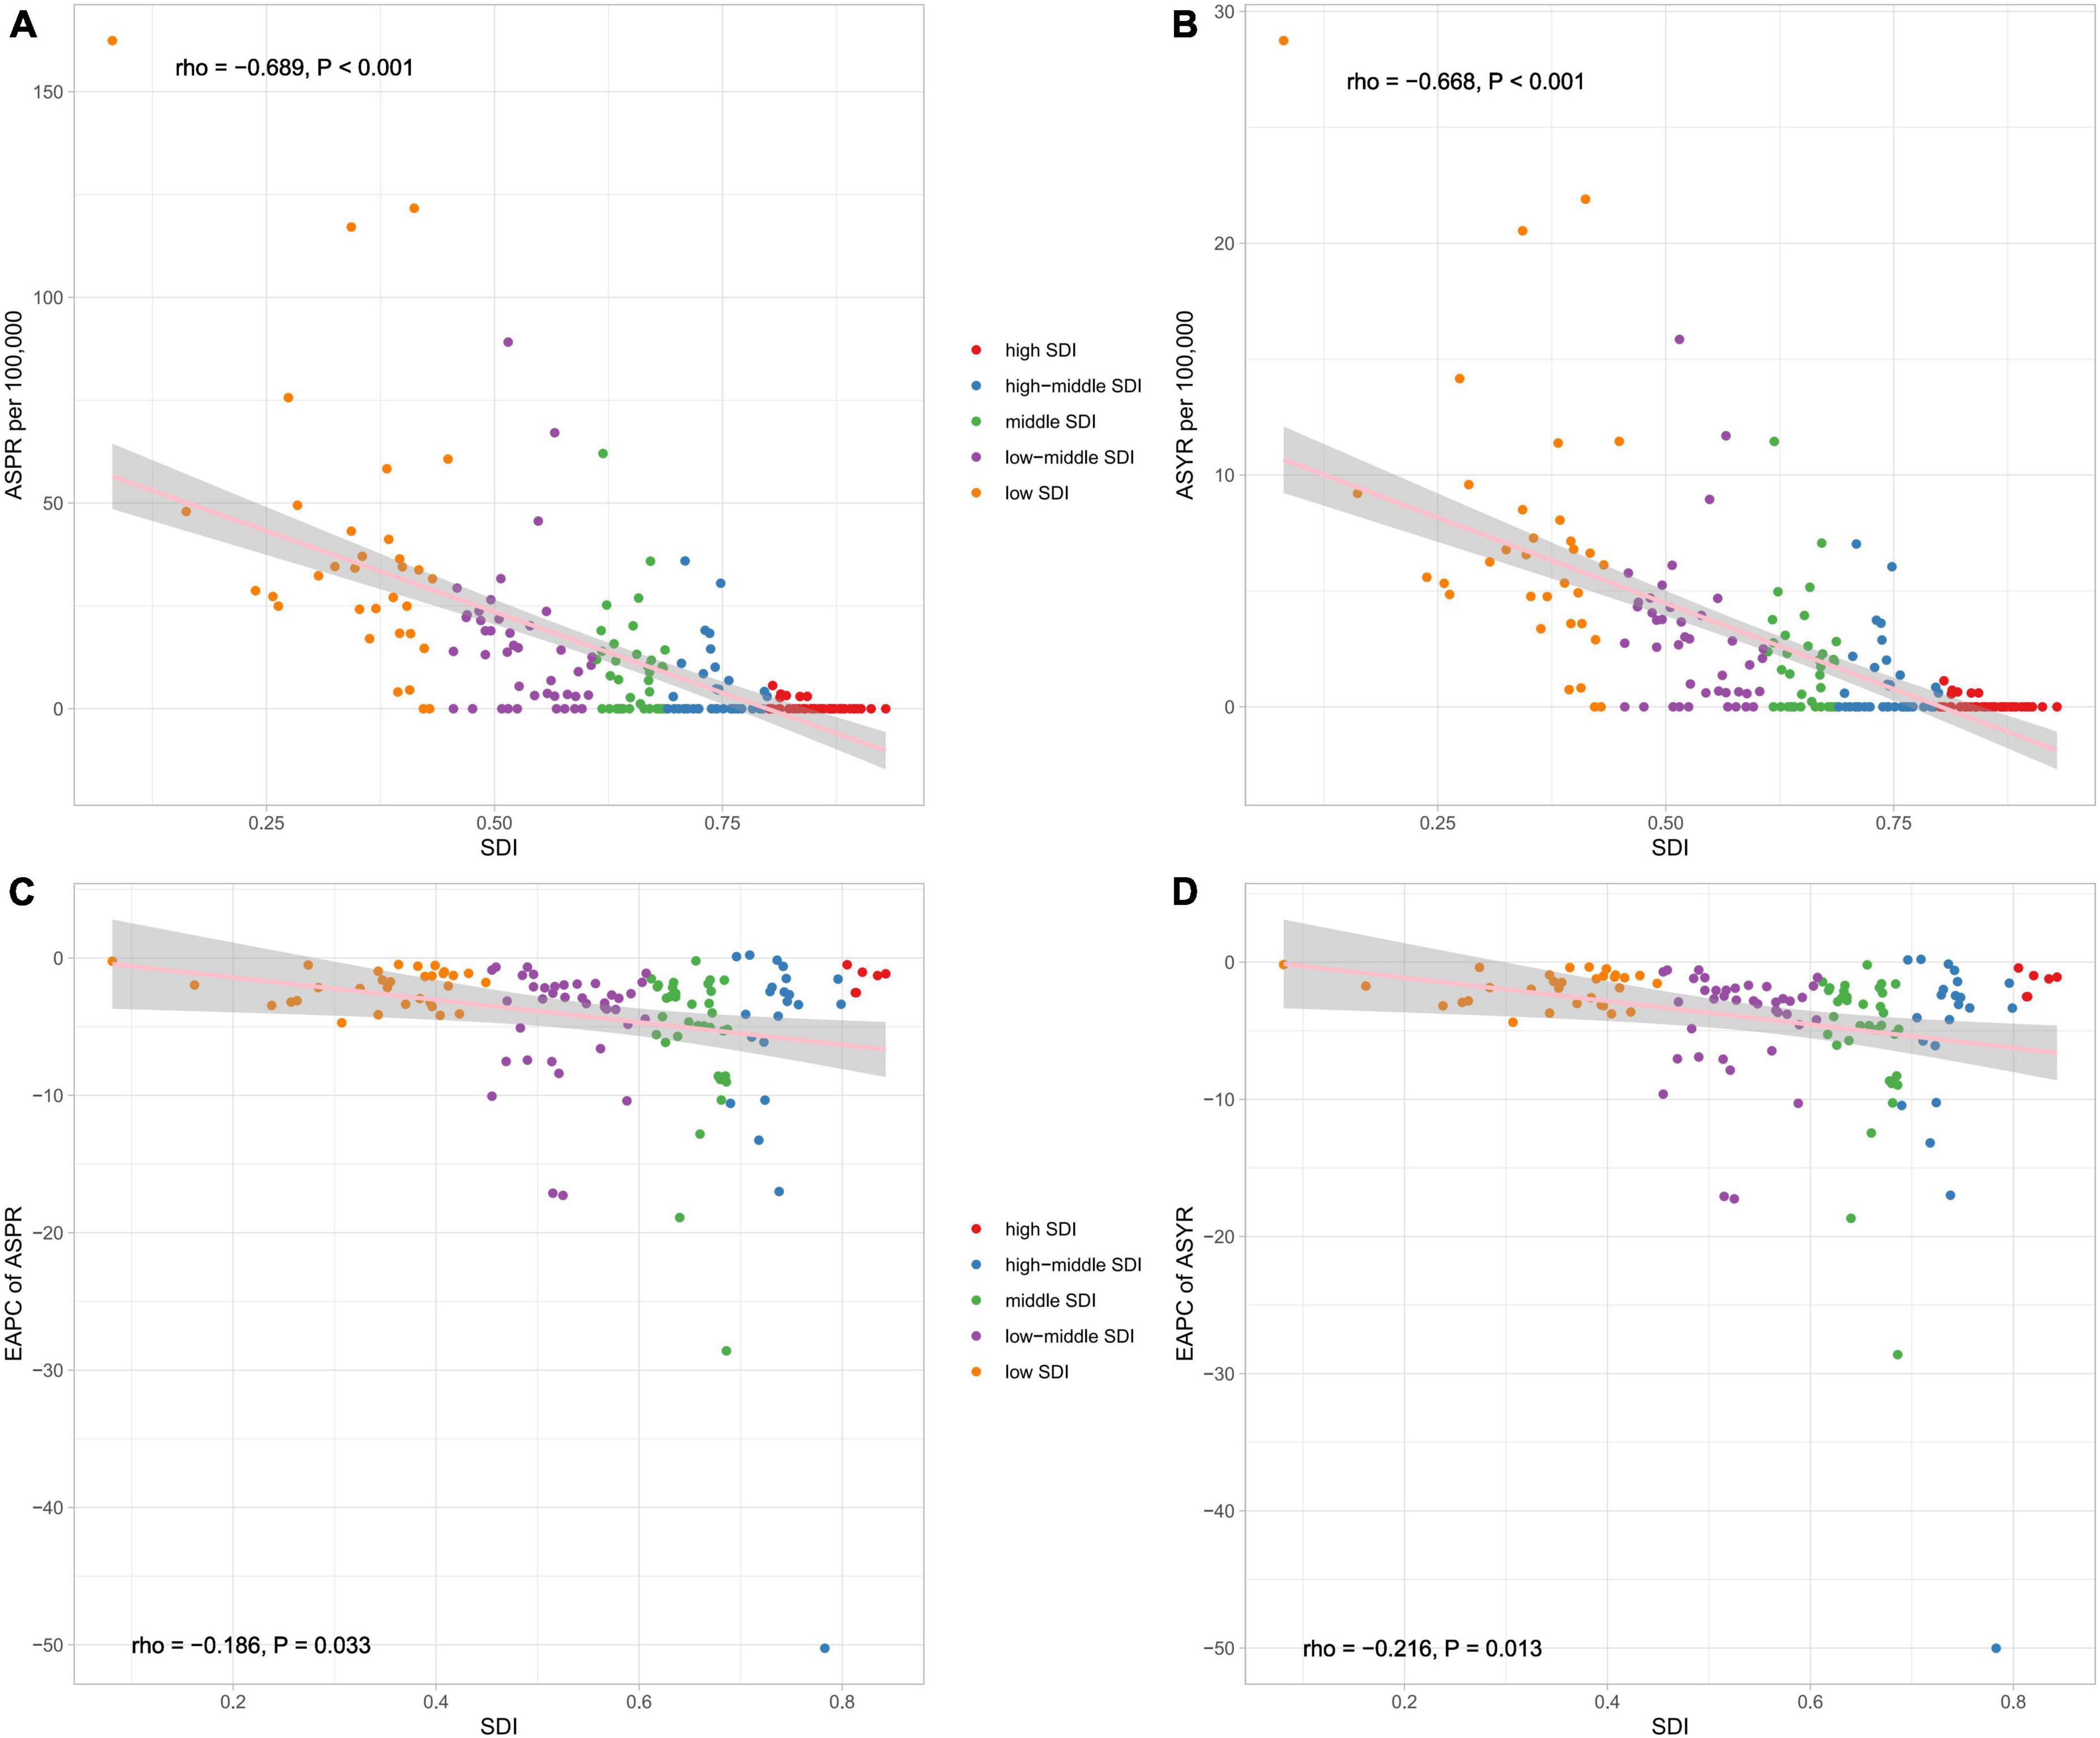
Figure 4. The correlation between global ASPR (A), ASYR (B), EAPC of ASPR (C), and EAPC of ASYR (D) and socio-demographic index (SDI) for developmental and intellectual disabilities attributable to iodine deficiency for both sexes. ASPR, age-standardized prevalence rate; ASYR, age standardized YLDs rate. EAPC, estimated annual percentage change.
In terms of the number of intellectual disabilities due to iodine deficiency in different SDI regions, in 1990, the low-middle SDI region had the largest number of prevalence and YLDs, accounting for 48.5 and 49.1%, followed by Middle SDI and Low SDI regions (Figures 5A, C). The high SDI region had the smallest number of prevalence and YLDs, accounting for only 0.02%. But in 2019, the proportion of the number of prevalence and YLDs cases with low SDI region increased and exceeded that of the number of cases with middle SDI region, and the other regions proportion was about the same as 1990 (Figures 5B, D).

Figure 5. The proportion of the number of prevalence (A) and YLDs (C) in 1990 and 2019 (B,D) for different socio-demographic index (SDI) regions and income-related health inequality regression (E) and concentration curves (F) for YLDs of developmental and intellectual disabilities attributable to iodine deficiency across 204 counties and territories, 1990 vs. 2019.
Significant absolute and relative SDI-related inequalities in the burden of developmental and intellectual disabilities due to iodine deficiency were observed, with a disproportionately higher burden shouldered by countries with lower SDI. As illustrated by the slope index of inequality, the gap in YLDs rate between the highest and the lowest SDI country decreased from −9.7 (95% CI −10.7 to −8.7) in 1990 to −4.9 (95% CI −5.4 to −4.3) in 2019 (Figure 5E and Table 1). The results of the concentration index indicate that the between-country inequality in the distribution of the developmental and intellectual disabilities due to iodine deficiency burden declined, from −48.0 (95% CI −60.0 to −36.0) in 1990 to −45.5 (95% CI −56.8 to −34.2) in 2019 (Figure 5F and Table 1).
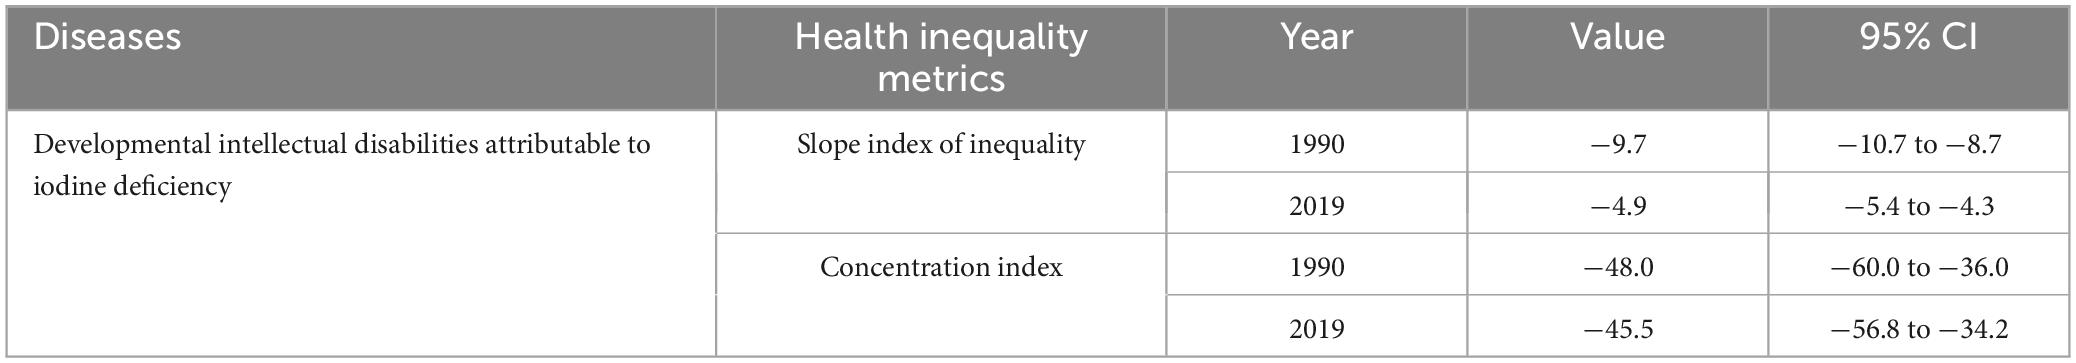
Table 1. Summary measures for cross-country inequalities related to SDI in YLDs of developmental and intellectual disabilities attributable to iodine deficiency.
The ASPR and ASYR for both sexes are projected to see a gradual decline from 2020 to 2030, as depicted in Figures 6A–D. It is worth noting that the trend for age-specific prevalence rate for both sexes will fall across all age groups and the highest level is found in the 5–19 year age group (Supplementary Figures 2, 3). The pattern of age-specific YLDs rate closely aligns with the global age-specific prevalence rate trend (Supplementary Figures 4, 5). It is anticipated that from 2020 to 2030, both mortality cases and YLDs will diminish annually, with the numbers for females significantly outweighing those of males (Figures 6E, F).
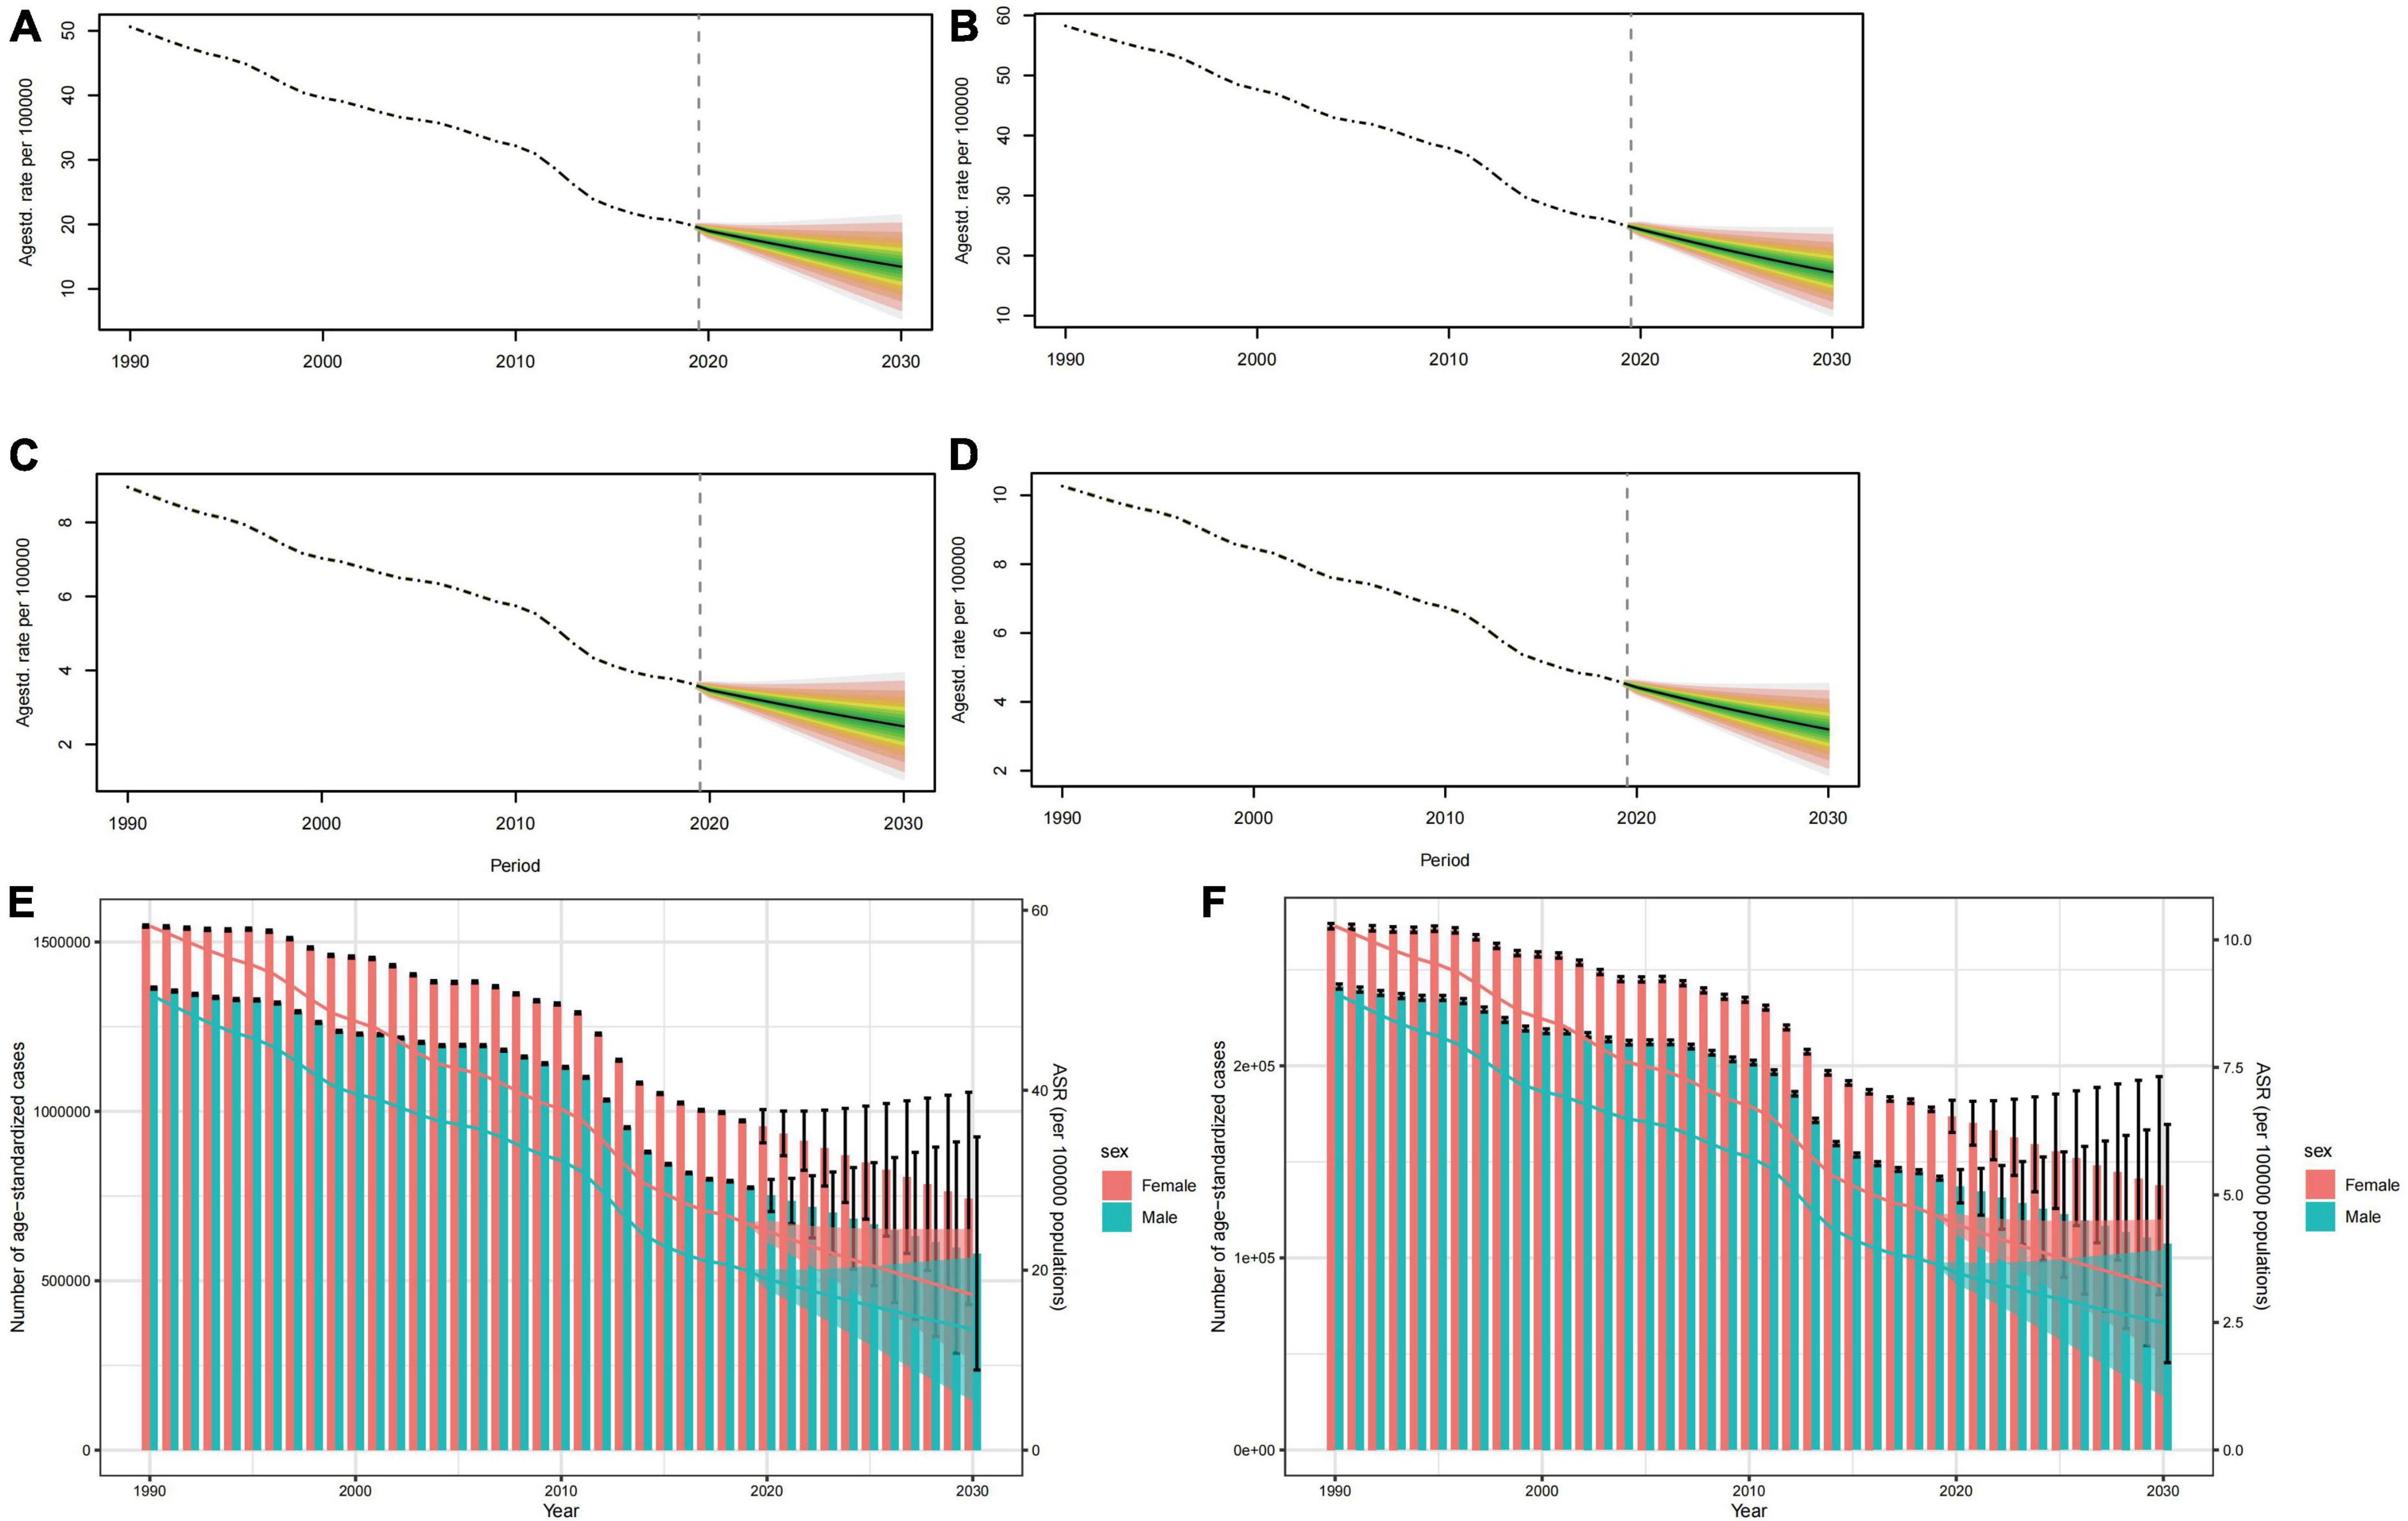
Figure 6. Projections of ASPR (A,B) and ASYR (C,D) in males and females from 2020 to 2030. The open dot represents the observed value, and the fan the predicted distribution between the 2.5 and 97.5% quantiles. The forecast average is shown as a solid line. The vertical dotted line indicates where the prediction begins. The projections of prevalence cases (E) and YLDs (F) by sexes of developmental and intellectual disabilities attributable to iodine deficiency from 2020 to 2030. The error bar denotes the 95% credible interval of the predictive value.
This review presents a comprehensive analysis of the global burden of developmental and intellectual disabilities due to iodine deficiency from 1990 to 2019, and uncovered a promising decline in age-standardized prevalence and YLD rates over this period. It also exhibited age and sex patterns, which suggest the importance of addressing iodine deficiency during adolescence and recognizing sex-specific vulnerabilities. Geographical distribution analysis underscores the need for targeted interventions in regions with limited access to iodine-rich foods and low socio-economic status. Surprisingly, we also found correlations between SDI and lower prevalence rates. These results show that economic and social factors also affect the incidence of such a disease. Developed countries with a high level of socio-economic development have already taken effective interventions to alleviate the health burdens arising from iodine deficiency. While health inequalities show improvement, a framework for action is needed to facilitate equitable distribution.
In our study, the highest burden of developmental and intellectual disabilities due to iodine deficiency was observed in regions with low-middle SDI in 2019, and this cross-country health inequalities on iodine deficiency has been found in other studies (39). The burden is high in sub-Saharan Africa and South Asia, a finding that is consistent with that of the 2015 GBD study (40). In addition, consistent results were also obtained in a GBD-based study in 2022 (20). Between 1999 and 2000, the global prevalence, however, sharply decreased. This could likely be attributed to the proportion of the population consuming iodized salt increasing from less than 20% in 1990 to 70% in 2000 (41, 42). More importantly, the United Nations Children’s Fund (UNICEF) set a goal in 1990 to eliminate Iodine Deficiency Disorders (IDD) as a public health issue by 2000 and promoted USI worldwide (21). Although progress has been made in the elimination of iodine deficiency, over two billion people worldwide still face the risk of insufficient iodine intake (43, 44). This might be due to limited dietary diversity, poor sanitary conditions, and interactions with infectious diseases (45). We also found that the declining trend in ASPR at the global and regional levels aligns with a similar trend in ASYR.
Iodine deficiency has adverse effects on people of all age groups as the highest age-standardized prevalence rate of developmental and intellectual disabilities caused by iodine deficiency was observed in the 10–19 age group. This could be due to the increased demand for iodine during adolescence, and its decreased content derived from food and salt (46). Even a mild iodine deficiency during pregnancy can result in a lowered IQ and inferior academic performance in primary school when compared to peers (47, 48). Adolescents should ensure that they consume enough iodine every day. By consuming iodised salt or iodine-rich foods, iodine deficiency can be effectively prevented and treated, and the improvement of adolescents’ iodine nutritional status can be promoted. At the same time, adolescents should undergo regular medical check-ups, including thyroid function and blood iodine levels, in order to detect and treat iodine deficiency in a timely manner. In adults, iodine deficiency can impair cognitive functions, resulting in emotional apathy, reduced learning capacity, and decreased productivity, which in turn has adverse effects on the country’s population and economy (2). The substantial expenditures associated with providing extra resources to address intellectual disabilities place a significant burden on society, not to mention the accompanying shame and the various mental and physical illnesses and their associated complications (49). This suggests that in future research, we should conduct a thorough assessment of the costs imposed on society by intellectual disabilities. Moreover, our data also highlights that the burden of developmental and intellectual disabilities resulting from iodine deficiency is greater in females than in males, potentially because male hormones stimulate thyroid growth while female hormones have an inhibitory effect (50). Hence, the increasing trend of iodine deficiency in females is indeed a matter of concern. Females should be urged not to try to avoid weight gain by dieting, vomiting or taking laxatives, as the relative lack of food intake and excessive nutrient loss may not meet iodine requirements, leading to iodine deficiency (21). In addition, females’ iodine requirements increase by more than 50 percent during pregnancy due to the increased iodine loss from the kidneys and the developmental needs of the fetus. During breastfeeding, in order to make up for the loss of iodine in breast milk, females need more iodine intake (51). Therefore, the relevant organizations should step up health education and promotion work, so that pregnant females can correctly understand the effects of iodine deficiency diseases on their health, especially in the areas that are hardest hit by iodine deficiency diseases, and should use the community as the unit of health education and promotion, so as to raise the people’s awareness of iodine deficiency diseases.
In short, although we have made significant progress in reducing the burden of diseases caused by iodine deficiency, continued efforts are essential, especially in low-SDI regions. To further alleviate this burden, it is imperative to strengthen public health strategies, promote health education, and optimize the supply of essential nutrients.
The study serves as a vital resource for scholars and policymakers in guiding prevention efforts, with a focus on improving iodine supplementation, nutritional education, and sex-specific health initiatives in at-risk regions, while encouraging further research into effective interventions and treatments. However, our review does have some limitations. The data source of this review is generated from a GBD database, which may be subject to variations in reporting and recording across different organizations, potentially affecting data accuracy. The study also primarily focuses on the prevalence and YLD rates of developmental and intellectual disabilities due to iodine deficiency and does not delve into specific interventions and treatments. Future research should, therefore, explore effective actionable strategies for prevention and management.
From 1990 to 2019, the global burden of developmental and intellectual disabilities caused by iodine deficiency has decreased, especially in regions with a high socio-demographic index (SDI). However, its burden remains high in children and adolescents, as well as in low and middle-income countries, with females experiencing a higher level than males. The findings of this study are valuable for policymakers in assessing current intervention measures and guiding future nutritional supplementation strategies to alleviate the burden of intellectual and developmental disorders caused by iodine deficiency.
The original contributions presented in this study are included in the article/Supplementary material, further inquiries can be directed to the corresponding authors.
The manuscript presents research on animals that do not require ethical approval for their study.
XY: Data curation, Investigation, Software, Writing – original draft. CL: Data curation, Investigation, Software, Writing – original draft. YaL: Data curation, Investigation, Software, Writing – review & editing. ZH: Data curation, Investigation, Software, Writing – review & editing. JL: Data curation, Investigation, Writing – review & editing. YiL: Data curation, Investigation, Writing – review & editing. YW: Data curation, Formal analysis, Investigation, Writing – review & editing. AM: Conceptualization, Supervision, Writing – review & editing. MF: Conceptualization, Formal analysis, Funding acquisition, Supervision, Writing – review & editing. HX: Conceptualization, Formal analysis, Funding acquisition, Writing – original draft, Writing – review & editing.
The authors declare financial support was received for the research, authorship, and/or publication of this article. The research was funded by the National Natural Science Foundation of China (nos. 82070302 and 81873467); The Clinical Medical Research Center of Peritoneal Cancer of Wuhan (2015060911020462); The Clinical Research Projects of Wu JiePing Medical Foundation (320.6750.2023-11-9); Science and Technology Innovation Cultivation Fund of Zhong Nan Hospital of Wuhan University (CXPY2022055); and The Medical Science and Technology Innovation Platform Support Project of Zhong Nan Hospital of Wuhan University (PTXM2023004 and PTXM2023020).
The authors declare that the research was conducted in the absence of any commercial or financial relationships that could be construed as a potential conflict of interest.
All claims expressed in this article are solely those of the authors and do not necessarily represent those of their affiliated organizations, or those of the publisher, the editors and the reviewers. Any product that may be evaluated in this article, or claim that may be made by its manufacturer, is not guaranteed or endorsed by the publisher.
The Supplementary Material for this article can be found online at: https://www.frontiersin.org/articles/10.3389/fnut.2024.1366525/full#supplementary-material
Supplementary Figure 1 | These heatmap show the ASYR of developmental intellectual disability attributable to iodine deficiency in GBD regions by sex and severity categories in 2019. The shade of color of each block in the heatmap represents the size of the numerical value, and the figure inside represents the absolute number of the age-standardized prevalence. ASYR, age standardized YLDs rate.
Supplementary Figure 2 | The projections of ASPR by age for males of developmental intellectual disability attributable to iodine deficiency from 2020 to 2030. ASPR, age-standardized prevalence rate.
Supplementary Figure 3 | The projections of ASPR by age for females of developmental intellectual disability attributable to iodine deficiency from 2020 to 2030. ASPR, age-standardized prevalence rate.
Supplementary Figure 4 | The projections of ASYR by age for males of developmental intellectual disability attributable to iodine deficiency from 2020 to 2030. ASYR, age standardized YLDs rate.
Supplementary Figure 5 | The projections of ASYR by age for females of developmental intellectual disability attributable to iodine deficiency from 2020 to 2030. ASYR, age standardized YLDs rate.
3. Cheng SY, Leonard JL, Davis PJ. Molecular aspects of thyroid hormone actions. Endocr Rev. (2010) 31:139–70.
4. Wu SY, Green WL, Huang W-S, Hays MT, Chopra IJ. Alternate pathways of thyroid hormone metabolism. Thyroid. (2005) 15:943–58.
5. Gross J, Pitt-Rivers R. Physiological activity of 3:5:3’-L-triiodothyronine. Lancet. (1952) 1:593–4.
6. Pitt-Rivers R. Metabolic effects of compounds structurally related to thyroxine in vivo: Thyroxine derivatives. J Clin Endocrinol Metab. (1954) 14:1444–50.
7. Mussett MV, Pitt-Rivers R. The thyroid-like activity of triiodothyronine analogues. Lancet. (1954) 267:1212–3.
8. Lerman J. The contribution of triiodothyronine to thyroid physiology. J Clin Endocrinol Metab. (1954) 14:690–3.
9. Leung A, Pearce EN, Braverman LE. Role of iodine in thyroid physiology. Expert Rev Endocrinol Metab. (2010) 5:593–602.
10. Sorrenti S, Baldini E, Pironi D, Lauro A, D’Orazi V, Tartaglia F, et al. Iodine: Its role in thyroid hormone biosynthesis and beyond. Nutrients. (2021) 13:4469.
11. World Health Organization. Assessment of iodine deficiency disorders and monitoring their elimination: A guide for programme managers. Geneva: World Health Organization (2007).
12. Bianco AC, da Conceição RR. The deiodinase trio and thyroid hormone signaling. Methods Protoc. (2018) 180:67–83. doi: 10.1007/978-1-4939-7902-8_8
13. Shahid M, Ashraf M, Sharma S. Physiology, thyroid hormone. Treasure Island, FL: StatPearls Publishing (2023).
16. Liao P, Vajdic C, Trollor J, Reppermund S. Prevalence and incidence of physical health conditions in people with intellectual disability–a systematic review. PLoS One. (2021) 16:e0256294. doi: 10.1371/journal.pone.0256294
17. Gaylord A, Osborne G, Ghassabian A, Malits J, Attina T, Trasande L. Trends in neurodevelopmental disability burden due to early life chemical exposure in the USA from 2001 to 2016: A population-based disease burden and cost analysis. Mol cell Endocrinol. (2020) 502:110666. doi: 10.1016/j.mce.2019.110666
18. Glinoer D. The regulation of thyroid function during normal pregnancy: Importance of the iodine nutrition status. Best Pract Res Clin Endocrinol Metab. (2004) 18:133–52.
19. Moleti M, Bella BD, Giorgianni G, Mancuso A, Vivo AD, Alibrandi A, et al. Maternal thyroid function in different conditions of iodine nutrition in pregnant women exposed to mild-moderate iodine deficiency: An observational study. Clin Endocrinol. (2011) 74:762–8. doi: 10.1111/j.1365-2265.2011.04007.x
20. Han X, Ding S, Lu J, Li Y. Global, regional, and national burdens of common micronutrient deficiencies from 1990 to 2019: A secondary trend analysis based on the global burden of disease 2019 study. EClinicalMedicine. (2022) 44:101299. doi: 10.1016/j.eclinm.2022.101299
21. Wei R, Wang Z, Zhang X, Wang X, Xu Y, Li Q. Burden and trends of iodine deficiency in Asia from 1990 to 2019. Public Health. (2023) 222:75–84.
22. Olusanya B, Gladstone M, Wright SM, Hadders-Algra M, Boo NY, Nair MKC, et al. Cerebral palsy and developmental intellectual disability in children younger than 5 years: Findings from the GBD-WHO Rehabilitation Database 2019. Front Public Health. (2022) 10:894546. doi: 10.3389/fpubh.2022.894546
23. Zhang T, Yin X, Chen H, Li Y, Chen J, Yang X. Global magnitude and temporal trends of idiopathic developmental intellectual disability attributable to lead exposure from 1990 to 2019: Results from global burden of disease study. Sci Total Environ. (2022) 834:155366. doi: 10.1016/j.scitotenv.2022.155366
24. Collaborators GBD 2019 Diseases and Injuries. Global burden of 369 diseases and injuries in 204 countries and territories, 1990–2019: A systematic analysis for the global burden of disease study 2019. Lancet. (2020) 396:1204–22.
25. GBD 2019 Diseases and Injuries Collaborators. Global burden of 369 diseases and injuries in 204 countries and territories, 1990-2019: A systematic analysis for the global burden of disease study 2019. Lancet. (2020) 396:1204–22.
26. GBD 2017 Disease and Injury Incidence and Prevalence Collaborators. Global, regional, and national incidence, prevalence, and years lived with disability for 354 diseases and injuries for 195 countries and territories, 1990-2017: A systematic analysis for the global burden of disease study 2017. Lancet. (2018) 392: 1789–858.
27. GBD 2017 Causes of Death Collaborators. Global, regional, and national age-sex-specific mortality for 282 causes of death in 195 countries and territories, 1980-2017: A systematic analysis for the global burden of disease study 2017. Lancet. (2018) 392:1736–88.
28. GBD 2017 DALYs and Hale Collaborators. Global, regional, and national disability-adjusted life-years (DALYs) for 359 diseases and injuries and healthy life expectancy (HALE) for 195 countries and territories, 1990-2017: A systematic analysis for the global burden of disease study 2017. Lancet. (2018) 392:1859–922. doi: 10.1016/S0140-6736(18)32335-3
29. Katz G, Lazcano-Ponce E. Intellectual disability: Definition, etiological factors, classification, diagnosis, treatment and prognosis. Salud Publica Mex. (2008) 50:s132–41.
30. Wang H, Zhao S, Wang S, Zheng Y, Wang S, Chen H, et al. Global magnitude of encephalitis burden and its evolving pattern over the past 30 years. J Infect. (2022) 84:777–87. doi: 10.1016/j.jinf.2022.04.026
31. Zhao S, Wang H, Chen H, Wang S, Ma J, Zhang D, et al. Global magnitude and long-term trend of ischemic heart disease burden attributed to household air pollution from solid fuels in 204 countries and territories, 1990-2019. Indoor Air. (2022) 32:e12981. doi: 10.1111/ina.12981
32. World Health Organization. Handbook on health inequality monitoring: With a special focus on low-and middle-income countries. Geneva: World Health Organization (2023).
33. Peng J, Xu H, Tang X. Global inequalities in the burden of digestive diseases from 1990 to 2019: Findings from the global burden of disease study 2019. Gastroenterology. (2023) 166:223–224.e1.
34. Yang X, Wu D, Liu Y, He Z, Manyande A, Fu H, et al. Global disease burden linked to diet high in red meat and colorectal cancer from 1990 to 2019 and its prediction up to 2030. Front Nutr. (2024) 11:1366553. doi: 10.3389/fnut.2024.1366553
35. Ordunez P, Martinez R, Soliz P, Giraldo G, Mujica OJ, Nordet P. Rheumatic heart disease burden, trends, and inequalities in the Americas, 1990-2017: A population-based study. Lancet Glob Health. (2019) 7:e1388–97. doi: 10.1016/S2214-109X(19)30360-2
36. Riebler A, Held L. Projecting the future burden of cancer: Bayesian age–period–cohort analysis with integrated nested Laplace approximations. Biometr J. (2017) 59:531–49.
37. Liu Y, Yang X, He Z, Li J, Li Y, Wu Y, et al. Spinal cord injury: Global burden from 1990 to 2019 and projections up to 2030 using Bayesian age-period-cohort analysis. Front Neurol. (2023) 14:1304153. doi: 10.3389/fneur.2023.1304153
38. Huang J, Li H, Yan H, Li F-X, Tang M, Lu D-L. The comparative burden of brain and central nervous system cancers from 1990 to 2019 between China and the United States and predicting the future burden. Front. Public Health. (2022) 10:1018836. doi: 10.3389/fpubh.2022.1018836
39. Jiang W, Li X, Wang R, Du Y, Zhou W. Cross-country health inequalities of four common nutritional deficiencies among children, 1990 to 2019: Data from the Global Burden of Disease Study 2019. BMC Public Health. (2024) 24:486. doi: 10.1186/s12889-024-17942-y
40. Collaboration Global Burden of Disease Child and Adolescent Health, Kassebaum N, Kyu HH, Zoeckler L, Olsen HE, Thomas K, et al. Child and adolescent health from 1990 to 2015: Findings from the global burden of diseases, injuries, and risk factors 2015 study. JAMA Pediatr. (2017) 171573–92. doi: 10.1001/jamapediatrics.2017.0250
41. UNICEF. Sustainable elimination of iodine deficiency: Progress since the 1990 world summit for children. New York, NY: UNICEF (2008).
42. Delange F, Bürgi H, Chen ZP, Dunn JT. World status of monitoring of iodine deficiency disorders control programs. Thyroid. (2002) 12:915–24.
43. Benoist B, McLean E, Andersson M, Rogers L. Iodine deficiency in 2007: Global progress since 2003. Food Nutr Bull. (2008) 29:195–202.
44. Andersson M, de Benoist B, Rogers L. Epidemiology of iodine deficiency: Salt iodisation and iodine status. Best Pract Res Clin Endocrinol Metab. (2010) 24:1–11.
45. Hassen HY, Ali JH, Gebreyesus SH, Endris BS, Temesgen AM. National incidence, prevalence and disability-adjusted life years (DALYs) of common micronutrient deficiencies in Ethiopia from 1990 to 2017: Estimates from the global burden of diseases study. Glob Health Act. (2020) 13:1776507. doi: 10.1080/16549716.2020.1776507
46. Dodd N, Samuel A. Iodine deficiency in adolescents from Bombay slums. Natl. Med J India. (1993) 6:110–3.
47. Qian M, Wang D, Watkins WE, Gebski V, Yan YQ, Li M, et al. The effects of iodine on intelligence in children: A meta-analysis of studies conducted in China. Asia Pac J Clin Nutr. (2005) 14:32–42.
48. Hynes KL, Otahal P, Hay I, Burgess JR. Mild iodine deficiency during pregnancy is associated with reduced educational outcomes in the offspring: 9-year follow-up of the gestational iodine cohort. J Clin Endocrinol Metab. (2013) 98:1954–62. doi: 10.1210/jc.2012-4249
49. Maulik PK, Mascarenhas MN, Mathers CD, Dua T, Saxena S. Prevalence of intellectual disability: A meta-analysis of population-based studies. Res Dev Disabil. (2011) 32:419–36.
50. Rossi R, Zatelli MC, Valentini A, Cavazzini P, Fallo F, Senno L, et al. Evidence for androgen receptor gene expression and growth inhibitory effect of dihydrotestosterone on human adrenocortical cells. J Endocrinol. (1998) 159:373–80. doi: 10.1677/joe.0.1590373
Keywords: developmental and intellectual disabilities, iodine deficiency, systematic analysis, global burden, the global burden of disease
Citation: Yang X, Liu C, Liu Y, He Z, Li J, Li Y, Wu Y, Manyande A, Feng M and Xiang H (2024) The global burden, trends, and inequalities of individuals with developmental and intellectual disabilities attributable to iodine deficiency from 1990 to 2019 and its prediction up to 2030. Front. Nutr. 11:1366525. doi: 10.3389/fnut.2024.1366525
Received: 21 February 2024; Accepted: 04 June 2024;
Published: 17 June 2024.
Edited by:
Amanda Jane Lloyd, Aberystwyth University, United KingdomReviewed by:
Yizhong Yan, Shihezi University, ChinaCopyright © 2024 Yang, Liu, Liu, He, Li, Li, Wu, Manyande, Feng and Xiang. This is an open-access article distributed under the terms of the Creative Commons Attribution License (CC BY). The use, distribution or reproduction in other forums is permitted, provided the original author(s) and the copyright owner(s) are credited and that the original publication in this journal is cited, in accordance with accepted academic practice. No use, distribution or reproduction is permitted which does not comply with these terms.
*Correspondence: Hongbing Xiang, aGJ4aWFuZ0B0amgudGptdS5lZHUuY24=; Maohui Feng, ZmVuZ21oNTY5MEAxNjMuY29t
†These authors have contributed equally to this work
Disclaimer: All claims expressed in this article are solely those of the authors and do not necessarily represent those of their affiliated organizations, or those of the publisher, the editors and the reviewers. Any product that may be evaluated in this article or claim that may be made by its manufacturer is not guaranteed or endorsed by the publisher.
Research integrity at Frontiers
Learn more about the work of our research integrity team to safeguard the quality of each article we publish.