- 1School of Life Science and Technology, Xinjiang University, Urumqi, China
- 2Xinjiang Huize Food Limited Liability Company, Urumqi, China
Tomato (Solanum lycopersicum L.) is a nutritious fruit and vegetable. Fermentation can be used to enhance their nutritional value. In this study, the tomato juice was co-fermented with multistrains, optimized by uniform experimental design and response surface methodology. Superoxide dismutase activity reached 496.67 U/g and lycopene content reached 77.12μg/g when P. pentosaceus (53.79%), L. casei (13.17%), L. plantarum (19.87%), L. fermentum (13.17%). To gain insight into the dynamics of metabolites during the tomato fermentation juice process multivariate statistical analysis was performed using the UHPLC-QE-MS/MS method. The main metabolites are peptides, amino acids carbohydrates, organic acids, and phospholipids. Carbohydrates were fully retained at the end of fermentation.The content of galactitol increased from the initial 5.389 to 6.607 while the content of cytarabine decreased by 29% and uridine by 44%. Meanwhile, phospholipids (PS, PE, PC, PG, PI) were all retained by more than 70%. Terpenoids (16-deacetylgairin, (+)-Royleanone, artemisinin) were increased to varying degrees, which gives them good nutritional value and biological activity. Organic acids (malic and citric) were reduced and lactic acid content was increased, changing its original flavor and making it more palatable to the general population. The research results have demonstrated the benefits of lactic acid bacteria fermentation on tomato juice, providing a theoretical basis and reference for the fermentation metabolism process of tomato juice.
1 Introduction
Tomato (Solanum lycopersicum L.) is a colorful, sweet and sour, nutritious fruit vegetable that is produced in large quantities globally, which is grown in almost all countries, and more than 80% are consumed as processed products (1). The global tomato production exceeded 186 million tons in 2020.1 Tomatoes contain a variety of bioactive substances, such as polyphenols, carotenoids, and vitamins, which have a positive impact on human health and well-being owing to their antioxidant, hypolipidemic, and anticancer properties (2). Recent studies have indicated that a quarter of the global tomato production is used for processing tomato products like sauces and ketchup, which are popular among consumers (3). The primary bioactive components in tomato products are carotenoids, particularly lycopene (LYC), which has been extensively utilized in the food industry as a functional ingredient in food supplements or new food products (4). Moreover, LYC has been shown to significantly contribute to cancer prevention and the management of chronic diseases in various pathological studies (5, 6). Although tomato products have been demonstrated to contain health-promoting nutrients and micronutrients, the research on tomato products mostly focuses on tomato sauces and ketchup, while there are few reports on deep-processing products derived from tomatoes (7).
Fermentation is a process that utilizes the growth and metabolic activities of microorganisms to stabilize and transform biomass. Beneficial metabolites, including extracellular polysaccharides, bioactive peptides, and lactic acid, can be generated by microorganisms in food matrices throughout the process of fermentation (8). Besides, fermentation techniques can effectively release bound bioactive compounds. Lactic acid bacteria (LAB) are widely used to ferment vegetables, dairy products, meats, and grains with bioactivities and a variety of health-promoting effects, including immunomodulatory, antiallergic, antio-besity, and antioxidant effects (9–11). The fermentation of fruit and vegetable juices by LAB not only preserves the nutrients and flavor of the juices but also generates bioactive substances through microbial metabolism. Compared to other strains, Lactobacillus paracasei fermentation of fermented orange juice was found to produce better flavor and sensory attributes as well as increased antioxidant activity (12). Furthermore, the bioactive compounds significantly increased in LAB-fermented Chinese wolfberry juice, particularly when using Lactobacillus paracasei and Lactobacillus acidophilus (13). Among LAB- fermented tomato juice (FTJ), Lactobacillus plantarum and Lactobacillus casei were found to be more suitable for developing FTJ with favorable flavor and health benefits (14). To address the challenges of tomato storage and diversify tomato products, this study aimed to develop a high-nutritional-value FTJ product.
In recent years, metabolomics has been applied to elucidate metabolite changes and biotransformation during food processes (15). UHPLC-QE-MS/MS(LC–MS) was widely used in many fields (e.g., medical research, environmental analysis, and food analysis) because of its high separation ability for complicated samples, relatively short and high sensitivity, and its ability to obtain rich structural information and molecular weight of each component. Food samples typically contain many small molecular weight metabolites that span a wide dynamic range of concentration and polarities (16). Therefore, LC–MS was chosen for its high sensitivity and resolution to analyze metabolites during the fermentation of tomato juice (17).
Currently, there is a paucity of information on the FTJ with LAB to enhance its bioactive function and its use of LC–MS for the analysis of non-volatile metabolites during FTJ. To the best of our knowledge, mixed LAB fermentation can produce a higher abundance of metabolites than single- strain LAB fermentation (18). To maximize FTJ’s mixed bacteria fermentation mechanism, it is essential to choose appropriate dominant strains that promote it, as each strain possesses unique traits and substrate adaptations. Therefore, this study was conducted to analyze the bioactive functions of LAB- FTJ and to examine the non-volatile metabolites during fermentation.
The objectives of this study were (1) Firstly, four strains with high Superoxide dismutase (SOD) activity and high LYC content were screened by a one-way test. The process was optimized by using homogeneous setup experiments and response surface methodology (RSM) to maximize SOD activity and LYC content, to improve bioaccessibility. (2) Samples were collected under different fermentation times (0, 10, 16, 20, and 22 h). Changes in chemical composition over time were traced by LC–MS analysis. The dynamic changes of carbohydrates (galactitol, aglycone, uridine), phospholipids (PS, PE, PC, PG, PI), organic acids (malic, citric, lactic), and terpenoids ((+)-Royleanone, 16-deacetylgalloylgalloylene, and artemisinin) were analyzed throughout the fermentation process. Overall, this study provides valuable new information on the benefits of fermentation in enhancing the potential nutritional value of tomatoes and other products.
2 Materials and methods
2.1 Materials
Tomato Sauce were provided by Xinjiang University (Xinjiang, China). Methanol, toluene, from Tianjin Shengao Chemical Reagent Co., Ltd. (Tianjin, China). MRS from Hangzhou Best Biotechnology Co, Ltd. (Hangzhou, China). Lactobacillus fermentum (L. fermentum) CICC 21800, Lactobacillus acidophilus (L. acidophilus) CICC 6085, Lactobacillus reuteri (L. reuteri) CICC 6126, Lactobacillus plantarum (L. plantarum) CICC 21797, Lactobacillus paracasei (L. paracasei) CICC 22709, Lactobacillus casei (L. casei) CICC 6114, Lactobacillus delbrueckii subsp bulgaricus (L. bulgaricus) CICC 20247, Pediococcus pentosaceus (P. pentosaceus) CICC 21862, Pediococcus acidilacriti (P. acidilacriti) CICC 20720, Lactobacillus rhamnosus (L. rhamnosus) CICC 6135 were obtained from the China Center of Industrial Culture Collection (CICC) (Beijing, China). Pectinase, cellulase, and hemicellulase were purchased from Fibrochem Biochemicals Co., Ltd. (Shanghai, China). All strains were activated twice and incubated at 37°C for 24 h before use. Methanol and acetonitrile were supplied by Meguiar’s. The SOD kit was purchased from Beijing Solebo Technology Co., Ltd. (Beijing, China).
2.2 Preparation and fermentation of tomato juice
First, tomato paste was mixed well with water 1:2.6. The Total Soluble Solid (TSS) was adjusted to 12.5°Brix, Then, sterilized in water at 90°C for 10 min and cooled down subsequently. Add 1.5% (w/v) pectinase, 1% (w/v) cellulase, and 1% (w/v) hemicellulase in the sample and enzymatically digest for 3 h at 57°C. Following, the samples were sterilized at 90°C for 30 min. After cooling, the strains were accessed into samples and placed under a Constant temperature oscillation incubator (ZD-85A, Changzhou, China, Setting 37°C) for 22 h of fermentation.
2.3 Screening of dominant strains and determination of their optimal proportions
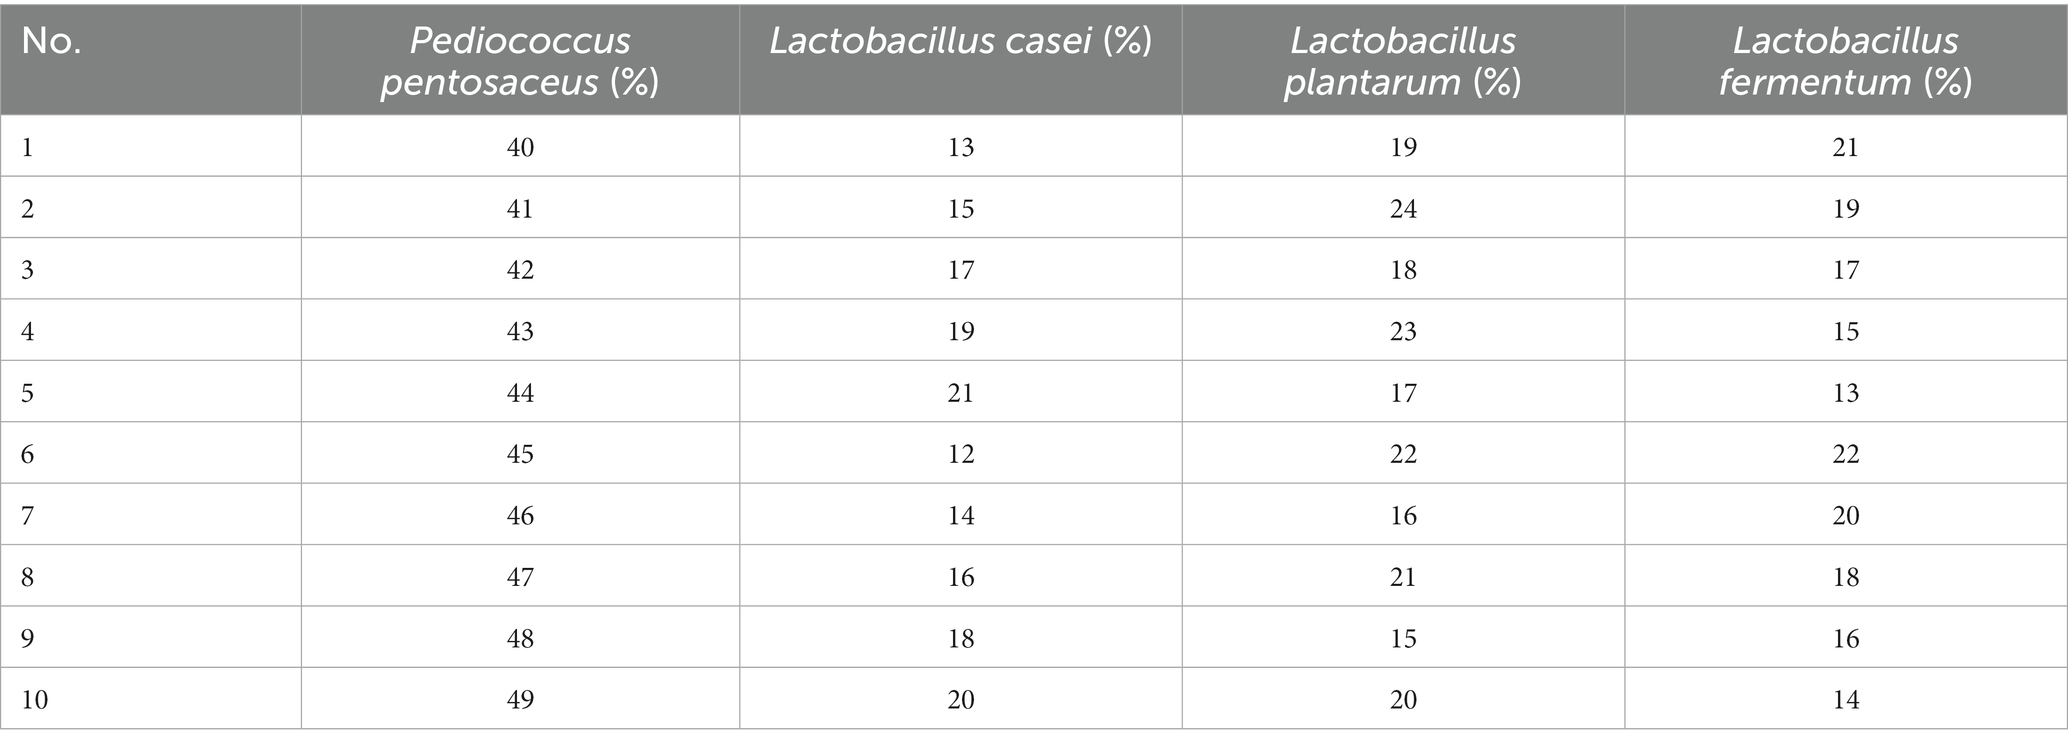
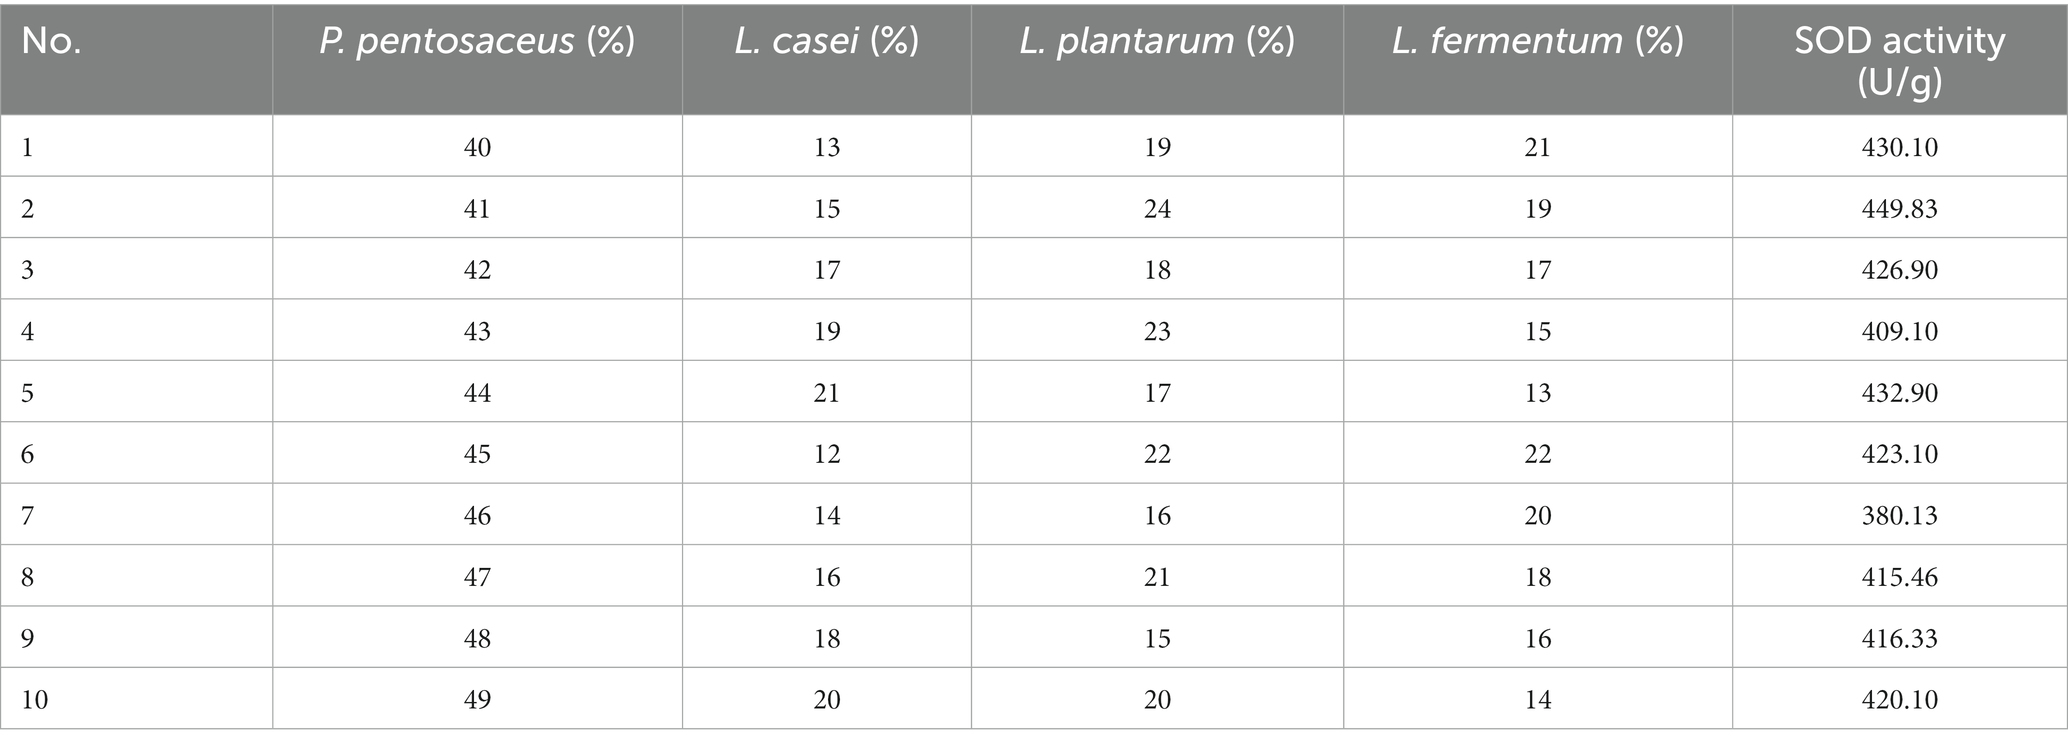
Ten strains (L. fermentum, L. acidophilus, L. reuteri, L. plantarum, L. paracasei, L. casei, L. bulgaricus, P. pentosaceus, P. acidilacriti, L. rhamnosus) of fermented tomato homogenate were used and fermented in an incubator at 37°C for 22 h. After fermentation, the best four dominant strains were selected based on pH, SOD, LYC, TSS and sensory scores. The optimal ratio of these 4 strains were determined by four factors, a10-level, uniform design table. The results were analyzed and calculated through SPSS 26 and Excel (Table 1).
2.4 Optimization of the fermentation process
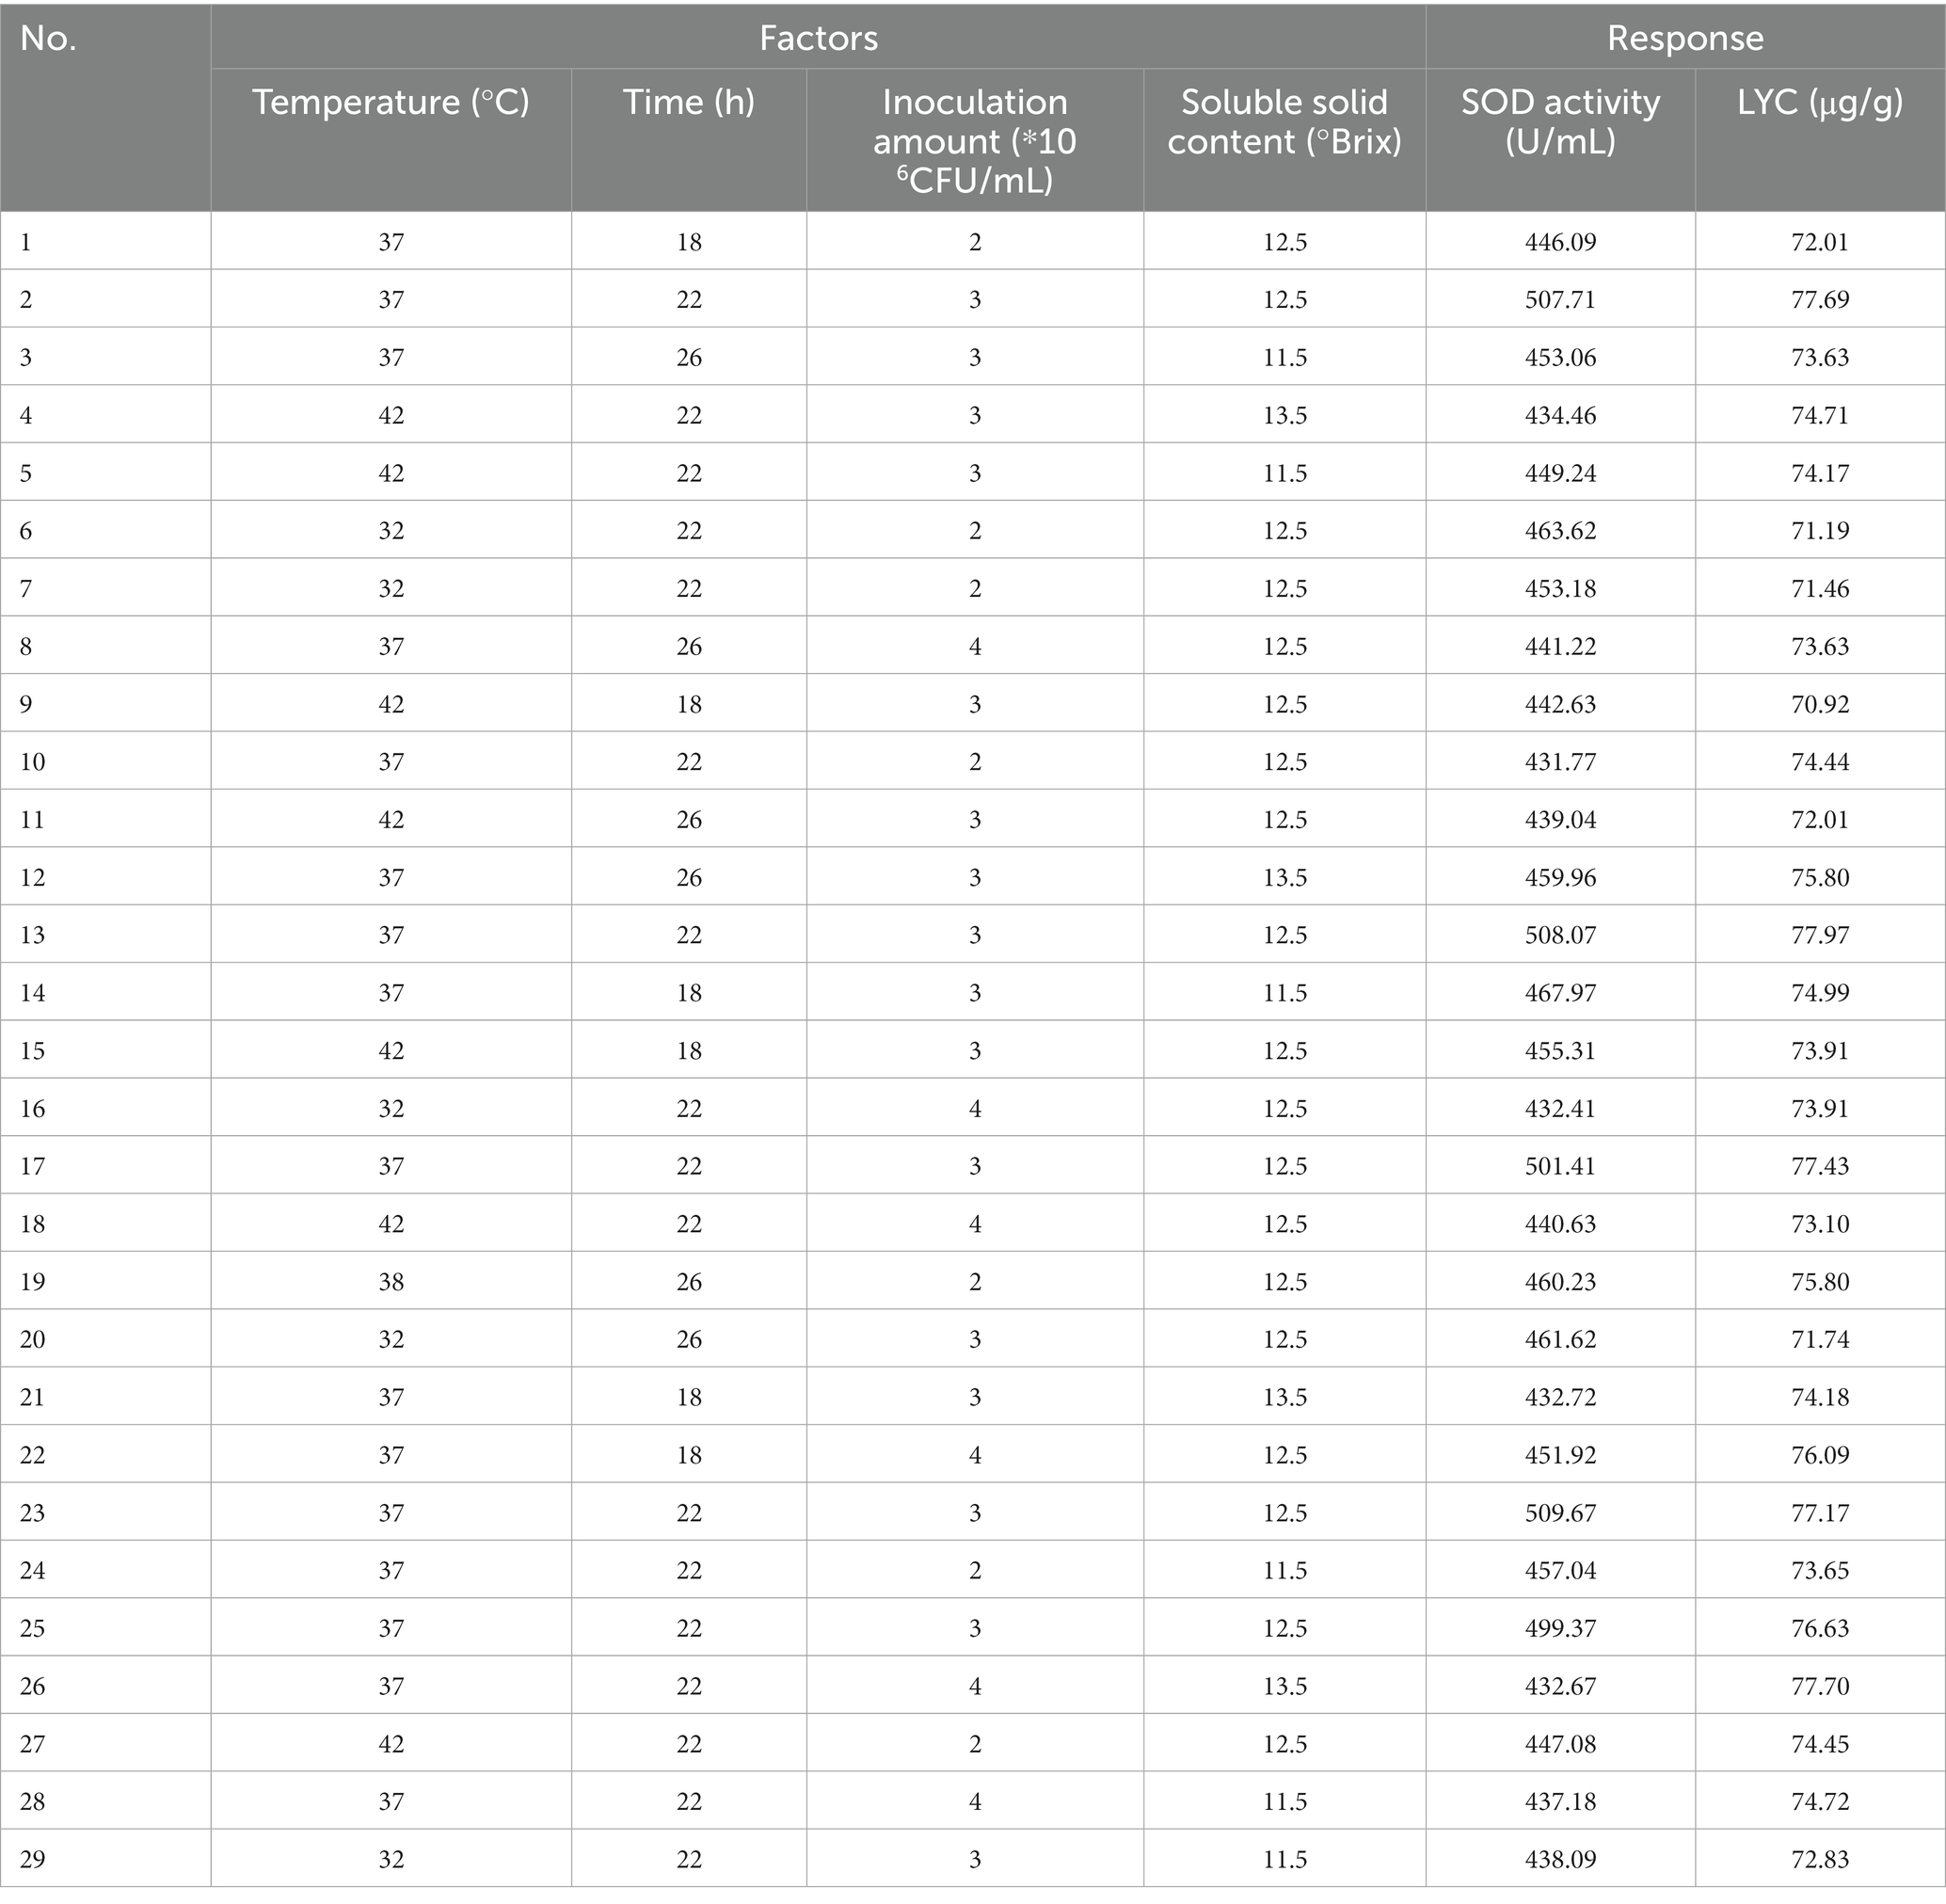
After determining the fermentation strain category and ratio, the SOD activity value and LYC value obtained after fermentation were used as indicators. The one-way experimental conditions were set as follows Soluble solids content (10.5, 11.5, 12.5, 13.5, 14.5°Brix), Inoculum volume (1.2.3.4.5*106 CFU/mL), Fermentation temperature (27.32.37.42.47°C), Fermentation time (14.18.22.26.30 h), with the above four factors as the independent variables, and SOD (Y1) and LYC (Y2) as the response values, to design a Box–Behnken test. Each factor has 3 levels (−1, 0, 1) and the design includes 5 centroids for a total of 29 sets of experiments. The factors and levels of Box–Behnken are tabulated in Table 2. Response surface results are shown in Table 3.
2.5 Measurement of physicochemical indicators
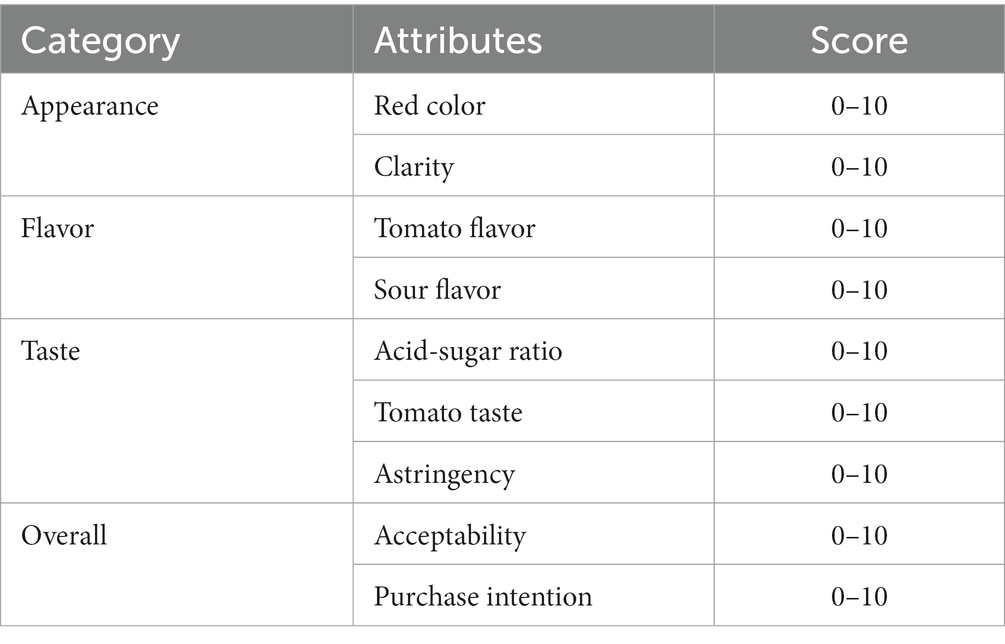
The activity of SOD was determined according to the instructions of the kit. LYC was determined using the national standard method. The soluble solid solids content was determined using a digital refractometer (TD-45, Zhejiang, China). pH was determined by a digital desktop acidimeter (PHS-3C, Shanghai, China). The sensory evaluation was performed on the fermented samples. Samples of the fermentation broth produced under different conditions were numbered, and then 10 people trained in the sensory evaluation were asked to rate the fermentation broth product’s sensory, flavor, acceptability, and hypothetical purchase intent for a total score of 90. The details were shown in Table 4.
2.6 Metabolites extraction and LC–MS analysis
Each sample (200 μL) was mixed with 800 μL of extraction solution (methanol: acetonitrile = 1:1, containing an isotope-labeled internal standard mixture) in an EP tube. The samples were then vortexed for 30 s, extracted by low-temperature ultrasound for 30 min (5°C, 40 KHz), and allowed to stand for 30 min at −20°C. The samples were then centrifuged again for 15 min (13,000 g, 4°C), and the supernatant was dried with nitrogen, followed by the addition of 120 μL of the compound solution (acetonitrile: water = 1:1). The sample was vortexed again for 30s, extracted by low-temperature ultrasonic extraction for 5 min (5°C, 40 KHz), centrifuged for 10 min (13,000 g, 4°C), and the supernatant was put into vials to be analyzed on the machine. In addition, 20 μL of supernatant from each sample was mixed as quality control (QC).
Metabolite detection was performed on an ACQUITY UPLC HSST3 column (100 mm × 2.1 mm i.d., 1.8 μm, Waters, Milford, USA) with two mobile phases: 95% ultrapure water +5% acetonitrile (containing 0.1% formic acid) and 5% ultrapure water +47.5% acetonitrile +47.5% isopropanol +5% ultrapure water (containing 0.1% formic acid). The two mobile phases were 0.1% formic acid, the temperature of the autosampler was 40°C, and the injection volume was 3 μL. The ion source was electrospray ionization (ESI), and the ionization modes: positive (ESI+) and negative (ESI-) scanning modes were used to collect mass spectrometry signals. The scanning range was 70 ~ 1,050 m/z; the intrathecal gas flow rate was 50 Arb, the auxiliary gas flow rate was 13 Arb, and the capillary temperature was 325°C. The resolution of the full mass spectrum was 60,000, and the resolution of the MS2 was 7,500. The collision energies were 20, 40, and 60 eV.
2.7 Data processing and statistical analysis
Data were expressed as mean plus or minus standard deviation and analyzed using SPSS26 software [In SPSS 26, we use the one-way ANOVA test to compare means. Statistical significance (p < 0.05; Duncan test)]. Plotting was done using Origin 2021 software. Multivariate analysis was performed using SIMCA 16.0 software. Principal Component Analysis (PCA) and Partial Least Squares Discriminant Analysis (PLS-DA) were performed to reduce the dimensionality of the data by visualizing sample distribution and grouping. Subsequently, supervised Orthogonal Projection-Least Squares Discriminant and Applied Analysis (OPLS-DA) of the underlying structure was performed, and additionally, to assess the importance of the variables in the projection, the importance of the projected variables of the initial principal components (VIP) was determined in Orthogonal Partial Least Squares Discriminant Analysis (OPLS-DA). This technique allows for summarizing and determining the contribution of each variable. Metabolites with VIP > 1 and p < 0.05 were considered as significantly changed metabolites.
3 Results
3.1 Strain screening and ratio determination
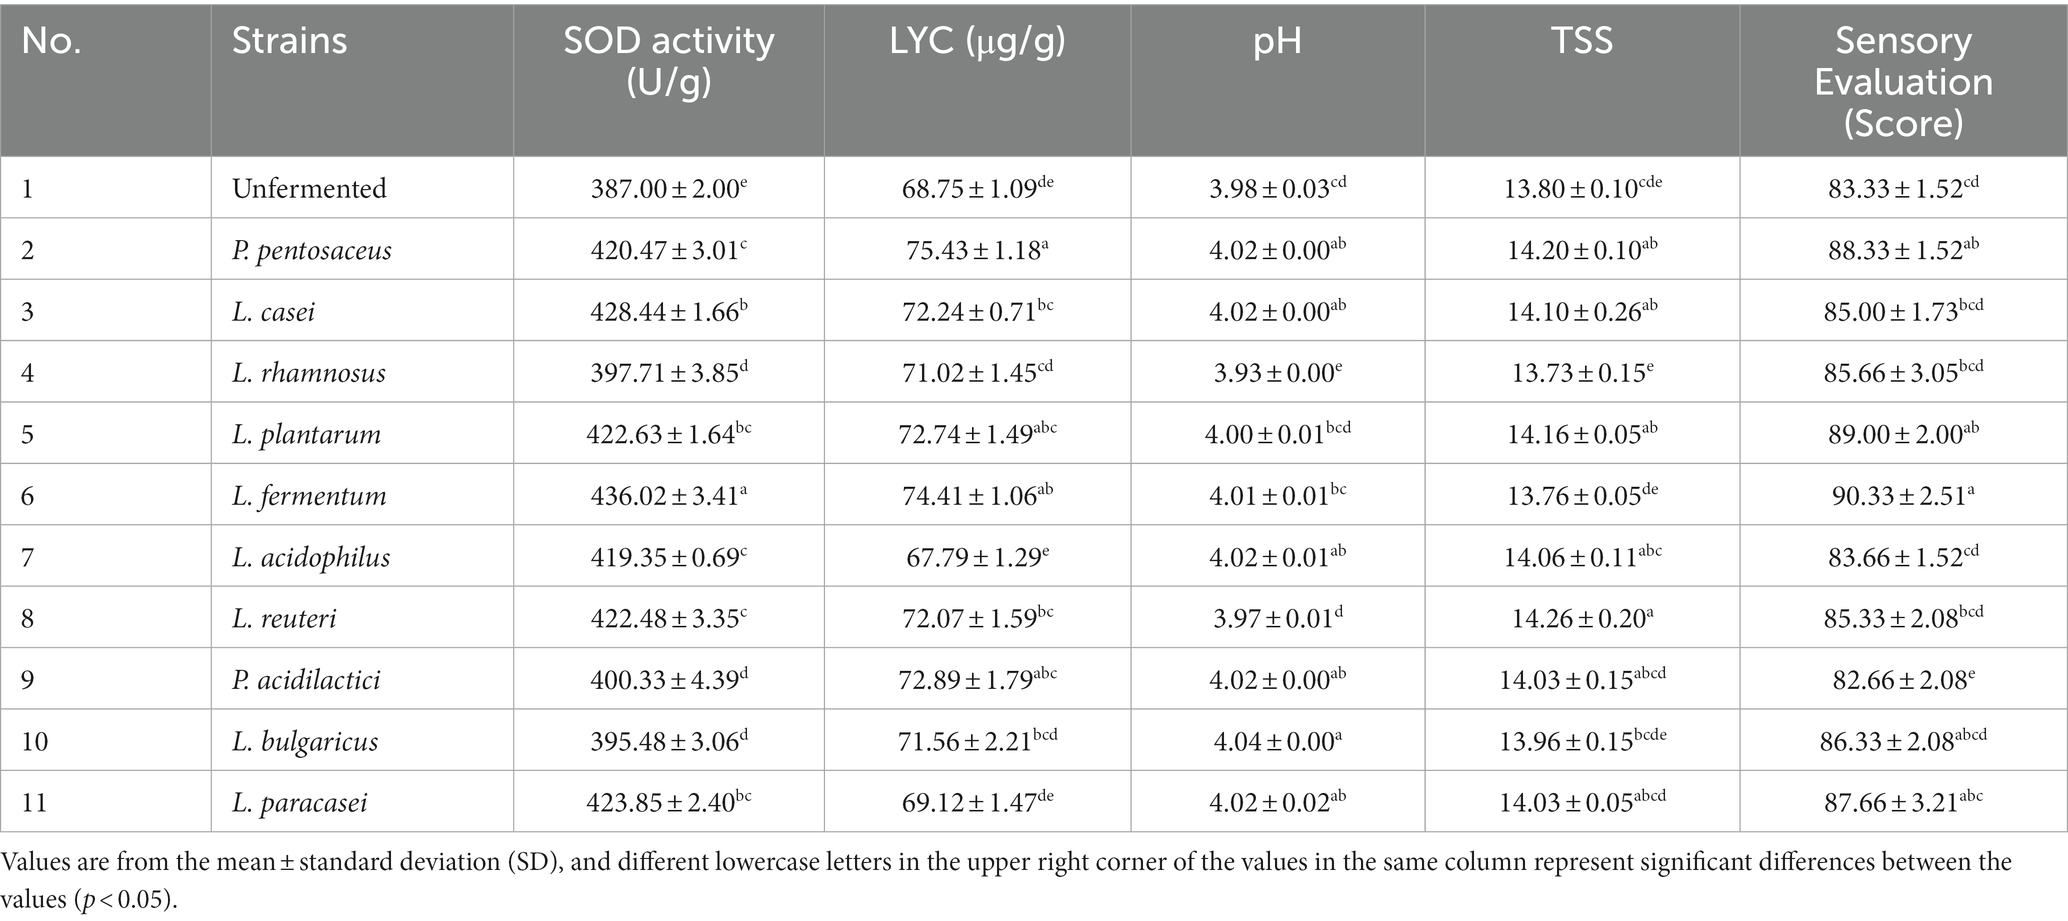
Each strain has its characteristics during the fermentation process, so it is important to consider the characteristics of each strain when selecting the appropriate strain for tomato juice. The effect of multi- strain association on fermentation is more beneficial than single-train fermentation due to the reciprocal symbiotic interaction between microorganisms and products derived from mixed fermentation containing more metabolites (19). In this experiment, 10 strains were used for fermentation, SOD, LYC, pH, TSS, and sensory during fermentation were determined, and finally four strains were selected for mixed fermentation. The results were shown in Table 5.
SOD is an important component of the antioxidant enzyme system in biological systems and has a strong antioxidant ability. SOD is not only naturally present in fruit and vegetable juices, it is also produced during the metabolism of LAB (20). After the fermentation of tomato juice, the SOD activity increased in all groups. Compared to the original solution producing, the L. casei, L. plantarum, L. fermentum, L. paracasei increased the SOD by 41.44, 35.63, 49.02, and 36.85 U/g, respectively. Explanations for these differences may include strain-specific functions, differences in growth rates and environments, and differences in carbon source utilization.
Xinjiang tomato fruits contain higher levels of LYC than those from other regions (21). LYC has been shown to have beneficial effects on human health. The LYC content produced by different strains varied. P. pentosaceus, L. fermentum, P. acidilactici,. L. plantarum was increased by 9.7, 8.2, 6.0, and 5.8%, respectively, compared to the unfermented samples. It may be due to fermentation hydrolysis and the destruction of the cell walls of tomato cells by LAB during the fermentation process. The destruction of the cells leads to a decrease in the pectin content and reduces the size of the tissue fragments, which reduces gravitational separation and promotes the release of LYC, thereby increasing the content (22).
The proportion of flavoring substances influences affects the sensation. The decrease in pH during fermentation may be due to the production of organic acids, and the absorption of a portion of glycogen by microorganisms, which leads to a decrease in TSS and destroys the flavor of the fermented juice. The highest sensory evaluation scores were given by L. fermentum, L. plantarum, P. pentosaceus, and L. paracasei, with scores of 90.33, 89.00, 88.33, and 87.66, respectively. For these results, the differences are due to the unique properties of each strain resulting in fermented samples with different acidic flavors and different organic acid compositions that give each sample a unique flavor. Besides, the volatile compound composition of the FTJ varies from strain to strain, and the senses will be different (23).
Combined fermentation of multiple strains can make up for the defects of other single strains in fermentation. Based on the three factors of high SOD, LYC, the best four strains, P. pentosaceus, L. casei, L. plantarum, and L. fermentum were selected for mixed fermentation. The optimum percentage of each strain was determined using a homogeneous design and the results are shown in Table 6, and the equation follows:
R2 = 0.999 and p < 0.01, indicating that the equation is well-fitted and accurately predicts optimal conditions. In conclusion, the optimal inoculation rates of FTJ were predicted to be P. pentosaceus (53.79%), L. casei (13.17%), L. plantarum (19.87%), L. fermentum (13.17%), with a corresponding SOD activity of 525.76 U/g. Based on the optimal inoculation rate described above, the total strain inoculum of the four strains was maintained at 2 × 10⁶ CFU/mL and the TSS was maintained at 13.5°Brix. Fermentation for 22 h at 37°C. In the validation test, SOD activity reached 486.35 U/g.
3.2 Response surface experimental results and analysis of variance
Different fermentation environments have different effects on the results and to achieve the best product, it is necessary to optimize the fermentation conditions. According to the preliminary experiments showed no significant changes in pH and TSS content. Therefore, SOD and LYC were used as dual response values for the optimization of fermentation conditions.
The metabolic activity of LAB is affected by fermentation temperature, thereby affecting the fermentation quality (24). As shown in Figure 1A, the SOD activity is 488.78 U/g at 37°C, then decreased with increasing temperature. LYC also reached a maximum value of 73.13 μg/g at 37°C, after which it gradually decreased. The appropriate growth temperature for LAB is generally around 37°C, so the decrease in both SOD activity and LYC content may be due to over-high temperature. The intolerance of bacteria to heat can lead to a decrease in enzyme metabolism and activity (25). Hence, the optimal fermentation temperature was set at 37°C.
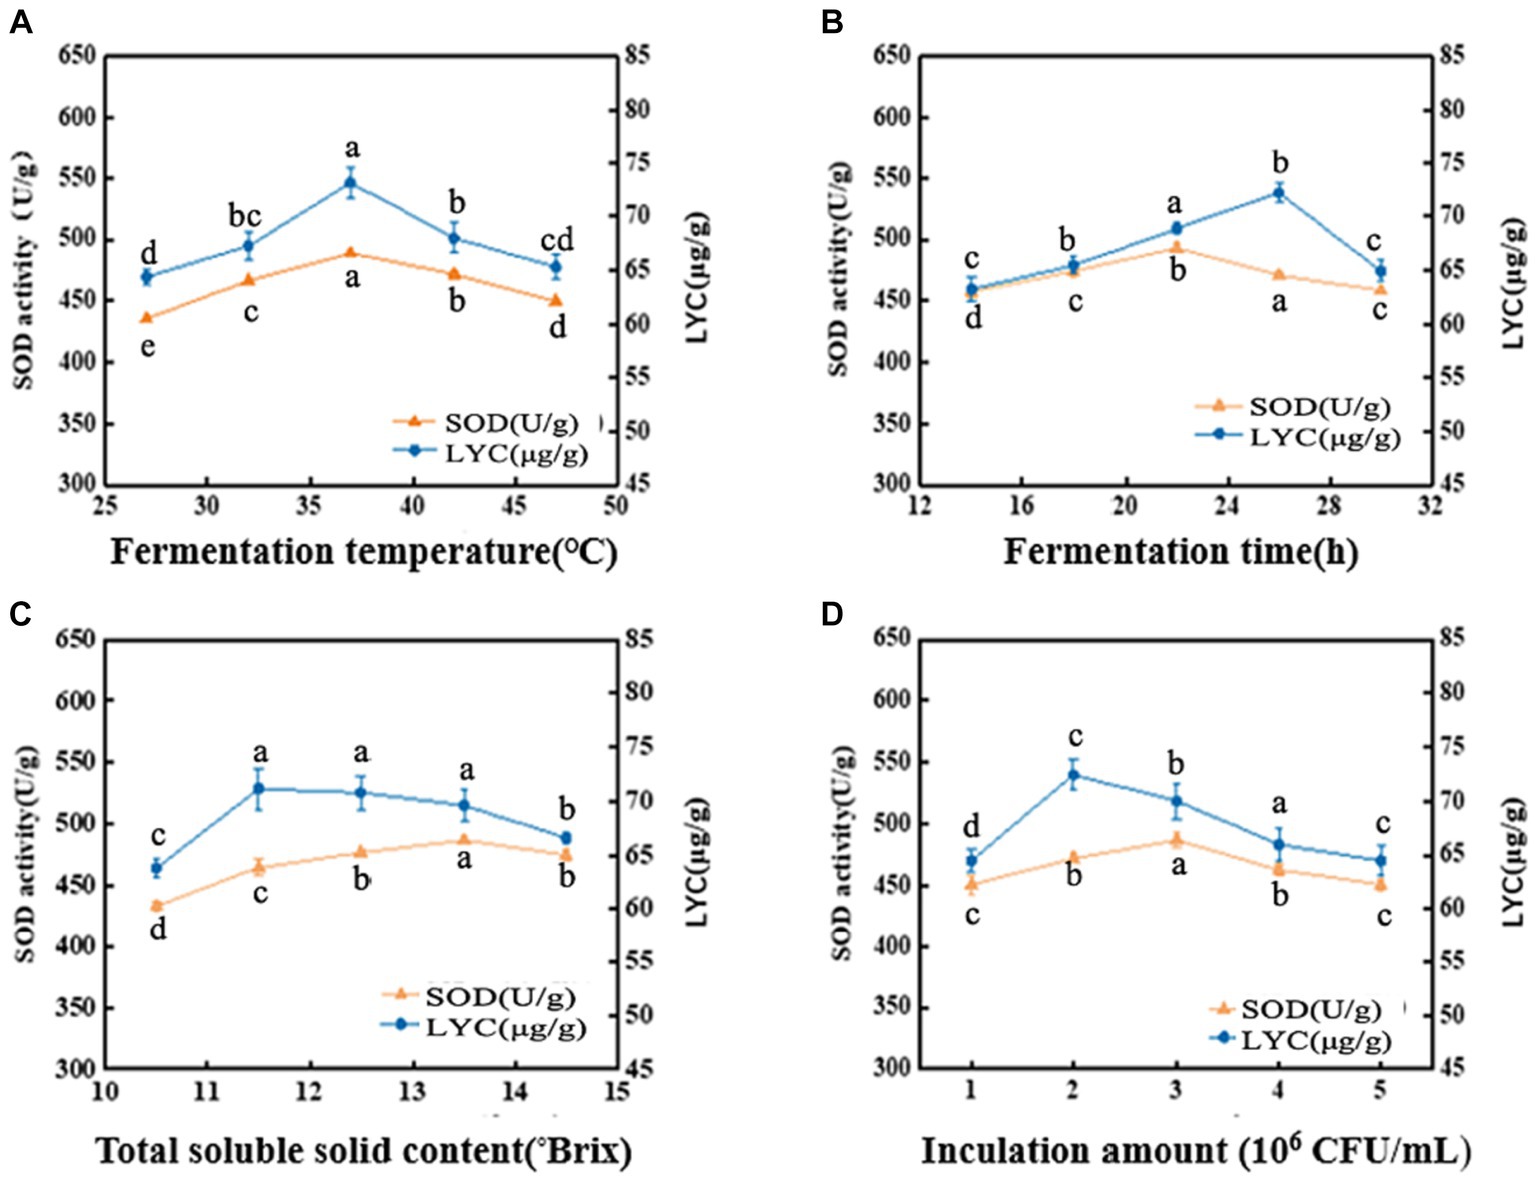
Figure 1. Effects of fermentation temperature (A), fermentation time (B), soluble solid content (°Brix) (C), and inoculation amount (D) on SOD activity and LYC content. Different lowercase letters represent significant differences between values (p < 0.05).
The SOD activity and LYC content were affected by the fermentation time as shown in Figure 1B. When the fermentation time is less than 14 h, the growth and reproduction of LAB were insufficient, metabolites were not accumulated enough, and the SOD activity and LYC content were low. If the time is too long, it will lead to a decrease in SOD activity and LYC content because insufficient nutrients will lead to an increase in the number of dead bacteria and an excessive accumulation of metabolic wastes. SOD activity increased rapidly between 14 h and 22 h and was 493.06 U/g at 22 h, afterwards decreased. The LYC reached a maximum value of 72.20 μg/g at 26 h and then decreased with increasing fermentation time. Therefore, the optimal fermentation time is 22–26 h.
As shown in Figure 1C, the SOD activity was (486.95 U/g) when the TSS content was adjusted to 13.5°Brix, and the LYC reached 71.14 μg/g at a TSS content of 11.5°Brix. From these results, we chose the range of 11.5°Brix-13.5°Brix.
From Figure 1D, it can be observed that When the strain number concentration was 106 CFU/mL, the bacterial population was insufficient and the bacterial metabolic rate was slow. It induced a decrease of SOD activity and LYC. However, the values of the indicators increased with the increase of the inoculum. The LYC reached 72.43 μg/g when the strain number concentration was 2 × 10⁶ CFU/mL. the maximum SOD activity was 486.92 U/g. When the strain number con-centration was 3 × 10⁶ CFU/mL. If the inoculum exceeds 3 × 10⁶ CFU/mL, it may result in excessive fermentation, which can result in destabilization of terpenoids and loss of biological enzyme activity. As a result, the optimal inoculum amount ranges from 2 × 10⁶–3 × 10⁶ CFU/mL.
Experiments showed that four factors had effects on both SOD activity and LYC. The design and results of the Box–Behnken test were shown in Table 3. The regression equations are modeled below:
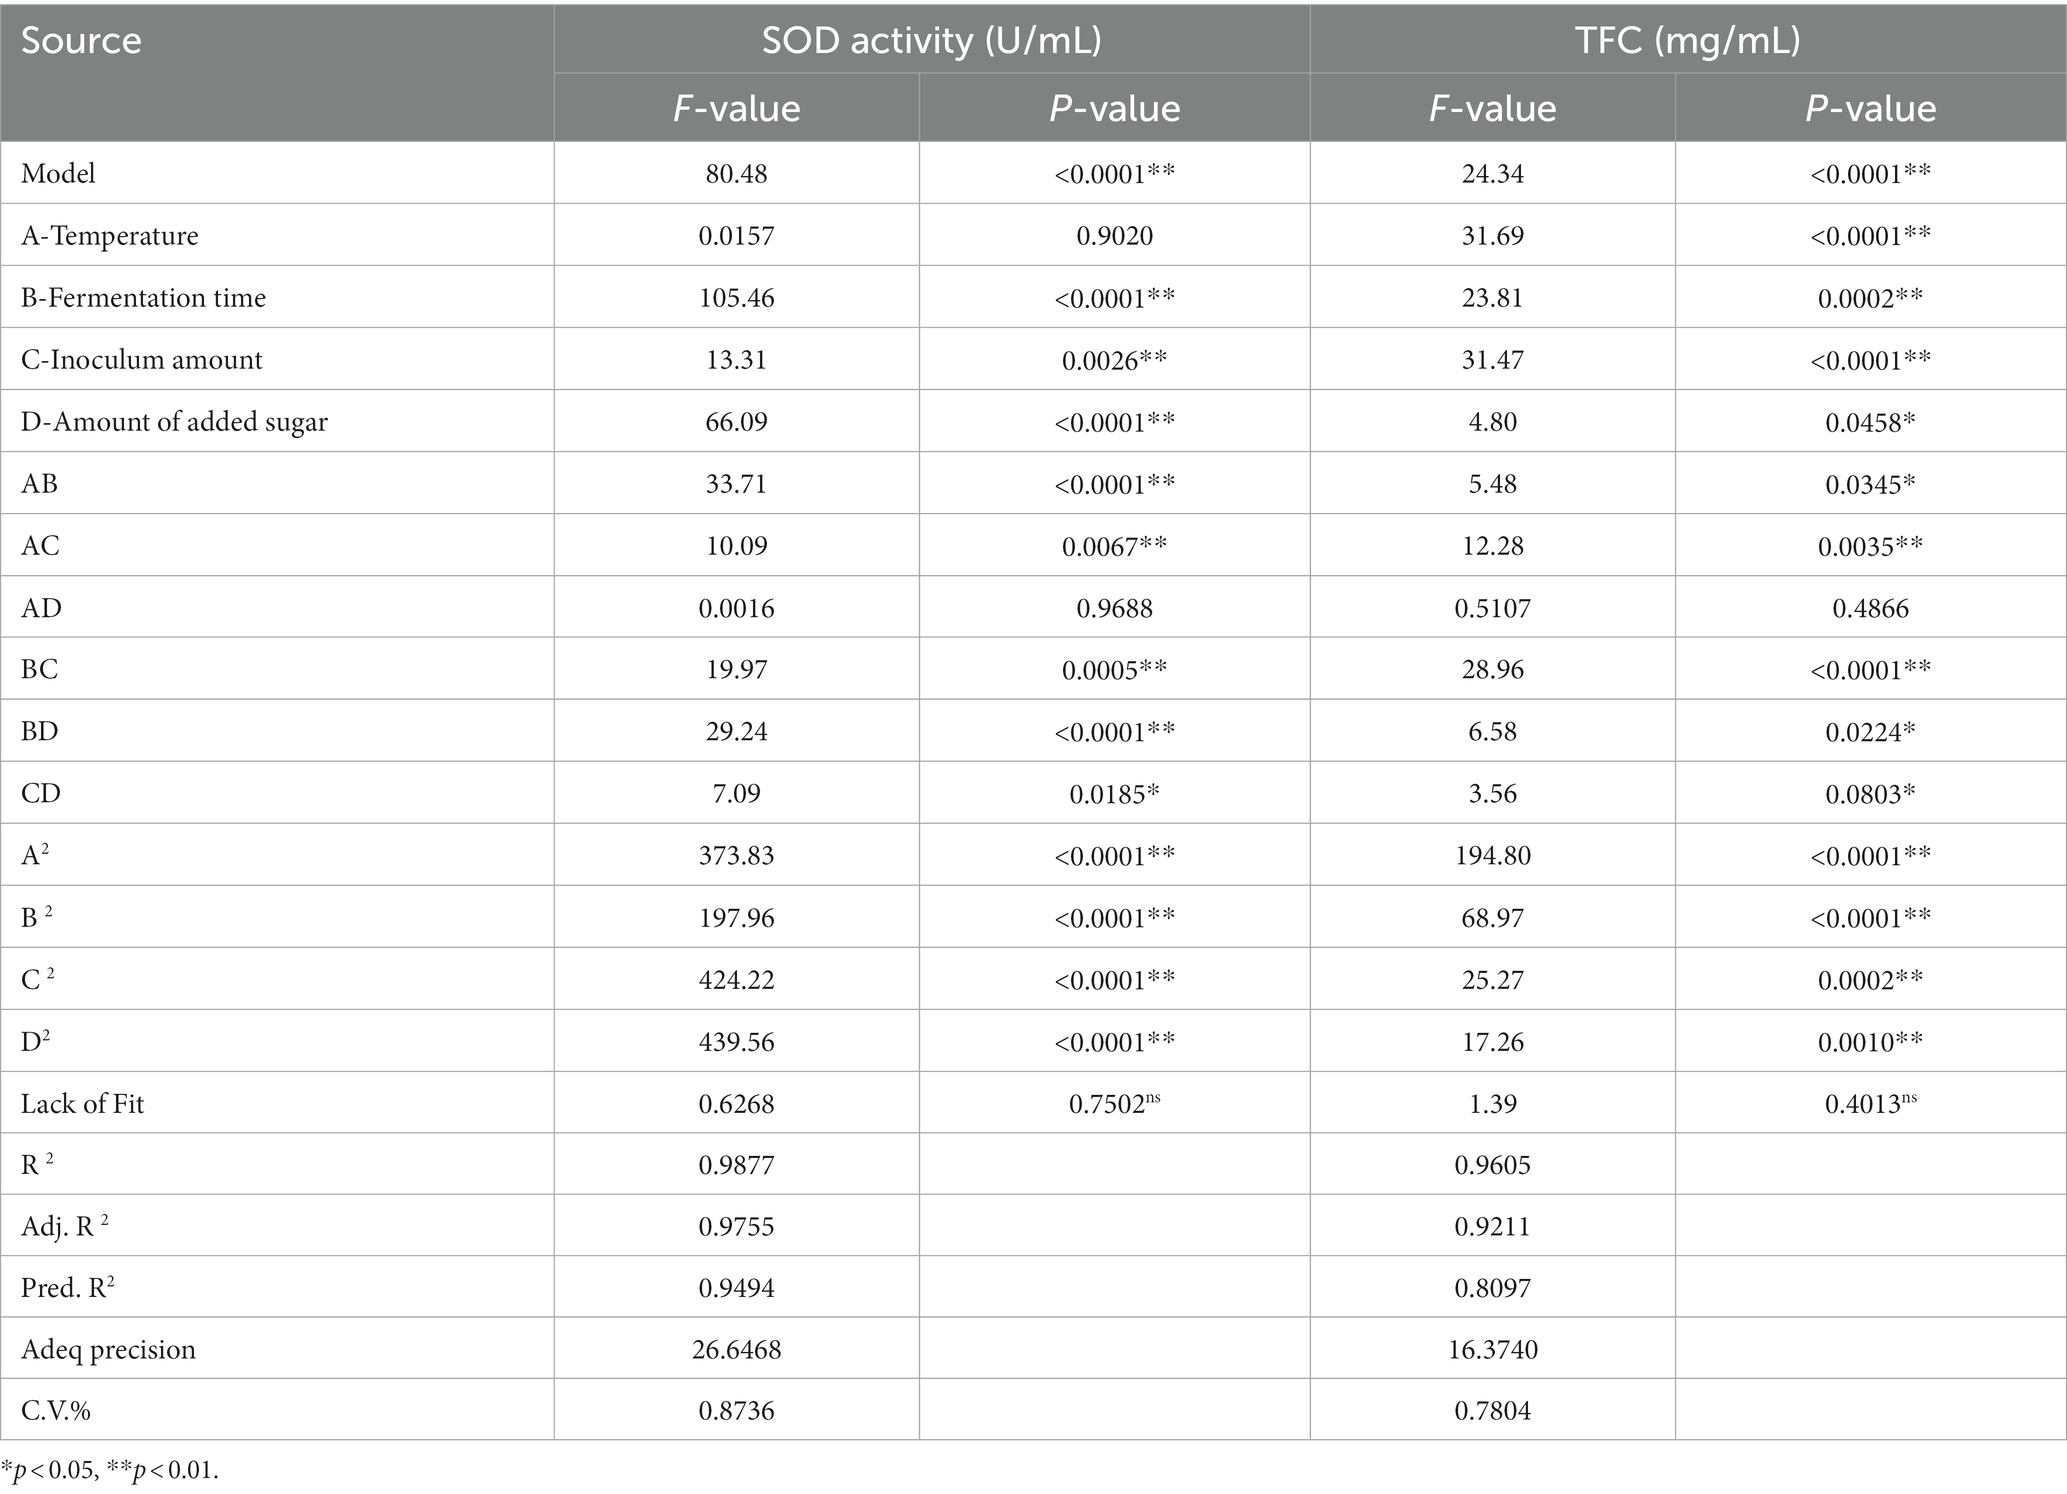
Anova and significance test for SOD activity and LYC. R2, adjusted R2, final results for flow rate flow %, and proper accuracy are shown in Table 7.
The test of significance of the coefficients of the model regression equation for Y1 (Figure 2A) shows that the linear coefficients (B, D, AB, AD, BD, BC, A2, B2, C2, and D2) are highly significant and the rest of the terms are not significant. The test of significance of coefficients of regression equation of the Y2 model (Figure 2B) shows that linear coefficients (A, B, C, AC, BD, A2, B2, C2, and D2) are highly significant and the rest of the terms are not significant (p < 0.01).
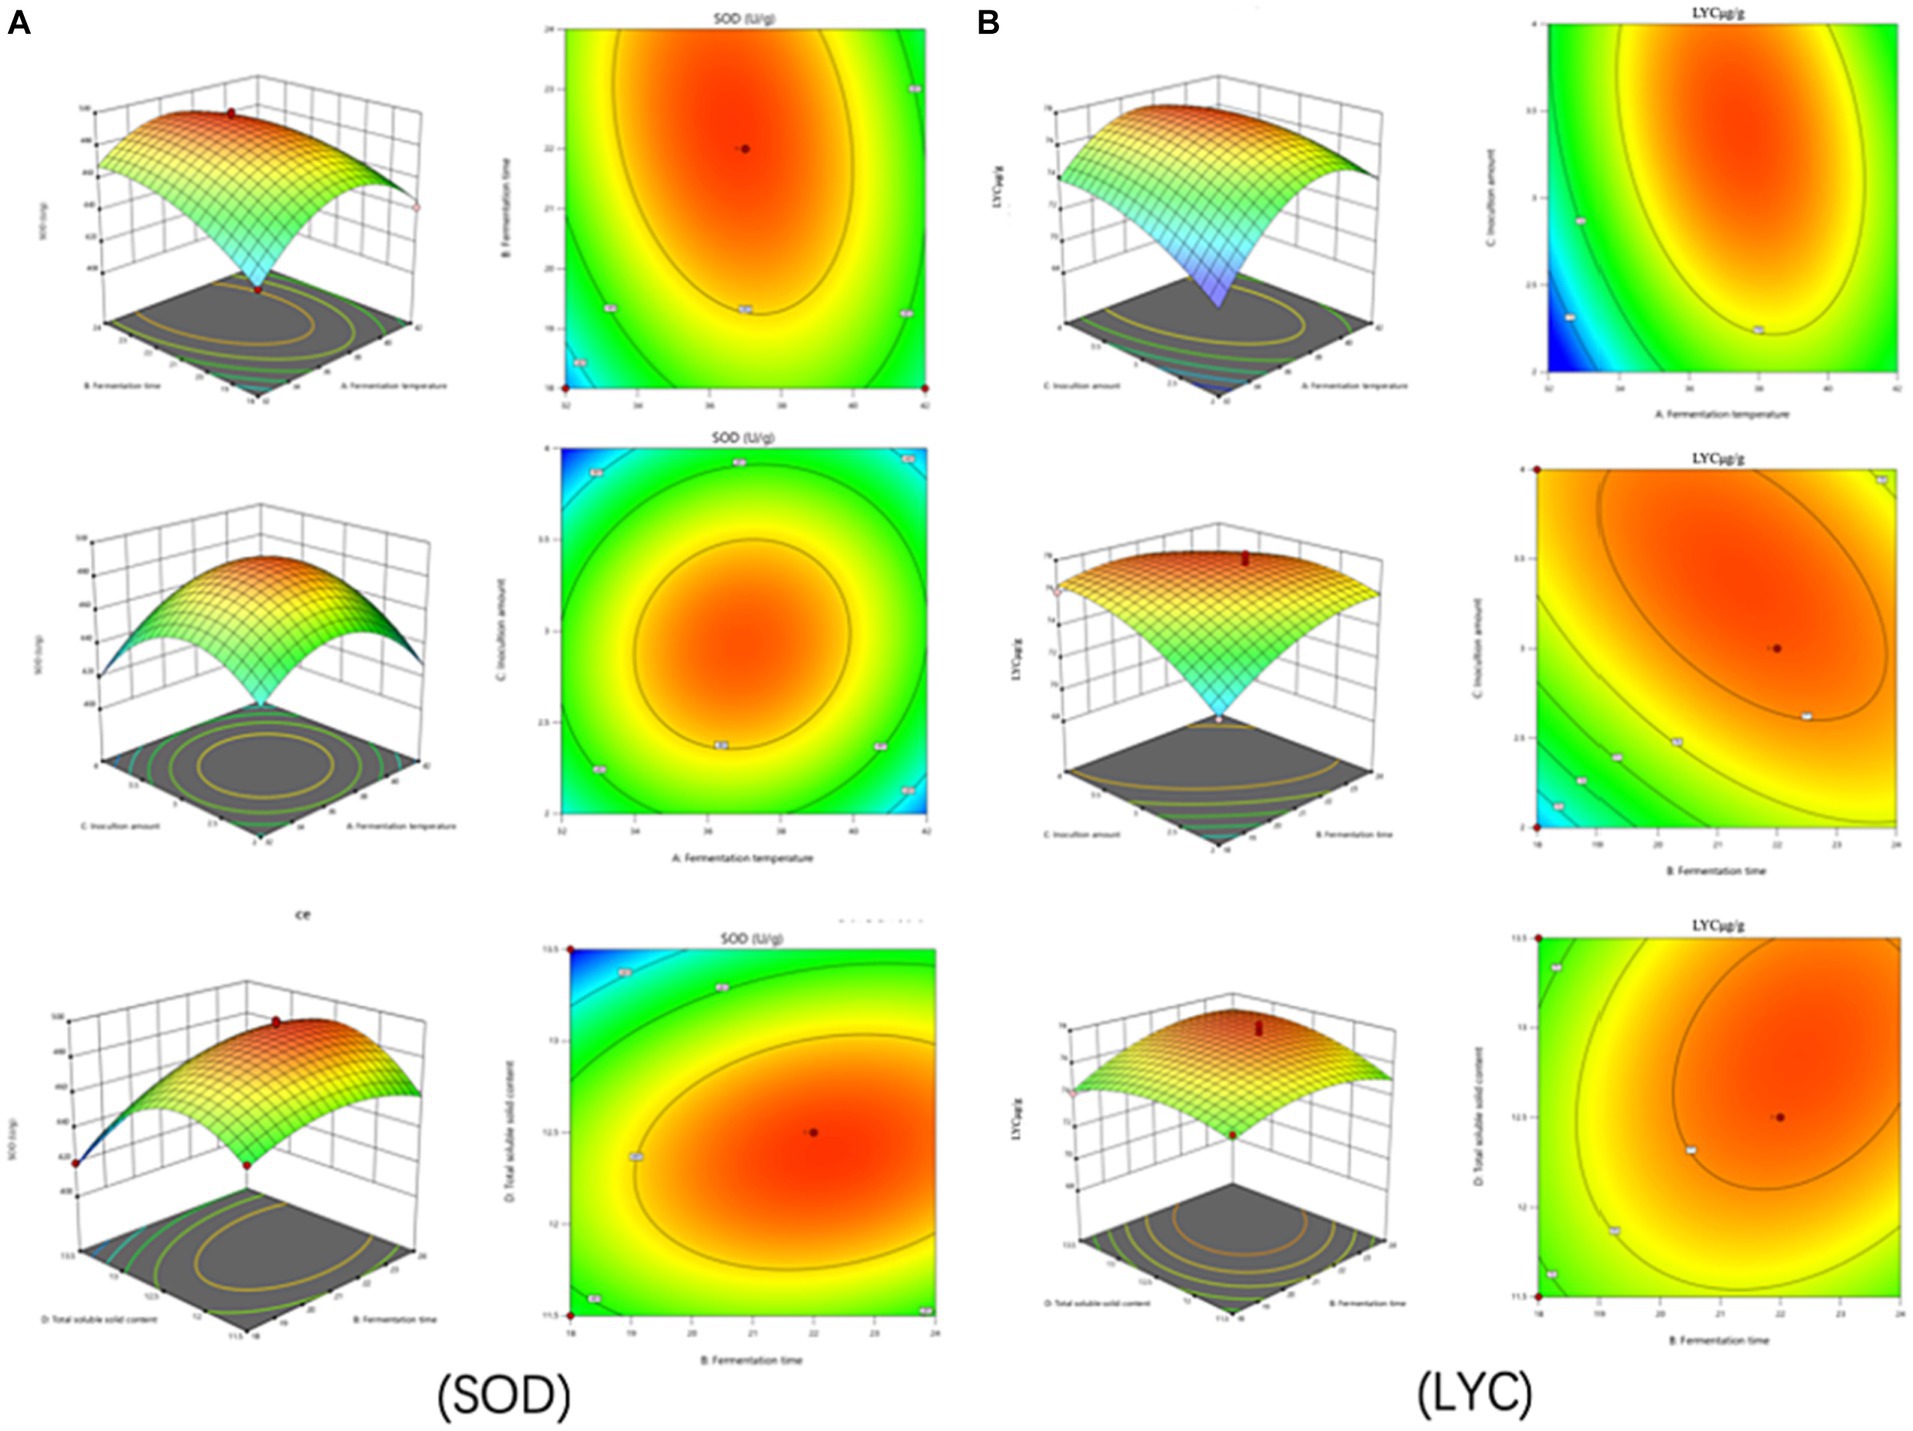
Figure 2. Effects of interaction of various factors on (A) (SOD) activity and (B) (LYC) concentration of FTJ.
As can be seen from Table 7, the correlation coefficient R2 value for SOD activity was 0.9877 and for LYC it was 0.9605, indicating that the model can be used for the analysis and prediction of the fermentation process. By predicting the regression model, the best treatment for FTJ was obtained as follows: fermentation temperature of 37.09°C, LAB inoculum of 2.95 × 10⁶ CFU/mL, fermentation time of 22.20 h, and TSS of 12.45°Brix. In these conditions, the predicted value of FTJ SOD activity was 505.79 U/g, and the predicted value of LYC was 77.33 μg/g.
After comprehensive consideration, the optimal conditions were modified to a fermentation time of 22 h, fermentation temperature of 37°C, LAB inoculum of 3 × 10⁶ CFU/mL, and sugar addition of 12.5°Brix. Under these conditions, we conducted experiments and verified that the SOD activity of the tomato enzyme was 496. 67 U/g and the LYC content was 77.12 μg/g.
3.3 Multivariate statistical analysis
LC–MS technique was used to characterize the metabolites in the fermentation broth to gain insight into the metabolites at different time stages during the fermentation process. A total of 1867 ionic metabolite signatures were generated at five stages, A, B, C, D, and E, during the fermentation process, including 1,020 positive ion patterns and 847 negative ion patterns. The metabolites were further analyzed by applying PCA and OPLS-DA models to the processed metabolite lists, which can effectively reduce the data dimensionality and improve the interpretability and validity of the data. PCA responds to the overall temporal and within-sample variability, reveals the distribution trends among various samples, and identifies possible discrete dispersal points, which can intuitively reflect the similarities or differences among the samples. As shown in Figure 3, fermentation samples at 0 h–10 h, 0 h–16 h, 0 h–20 h, and 0 h–22 h were separated by PCA principal component differentiation. All samples and QCs were within the 95% confidence interval, indicating good stability and reproducibility of the experiment.
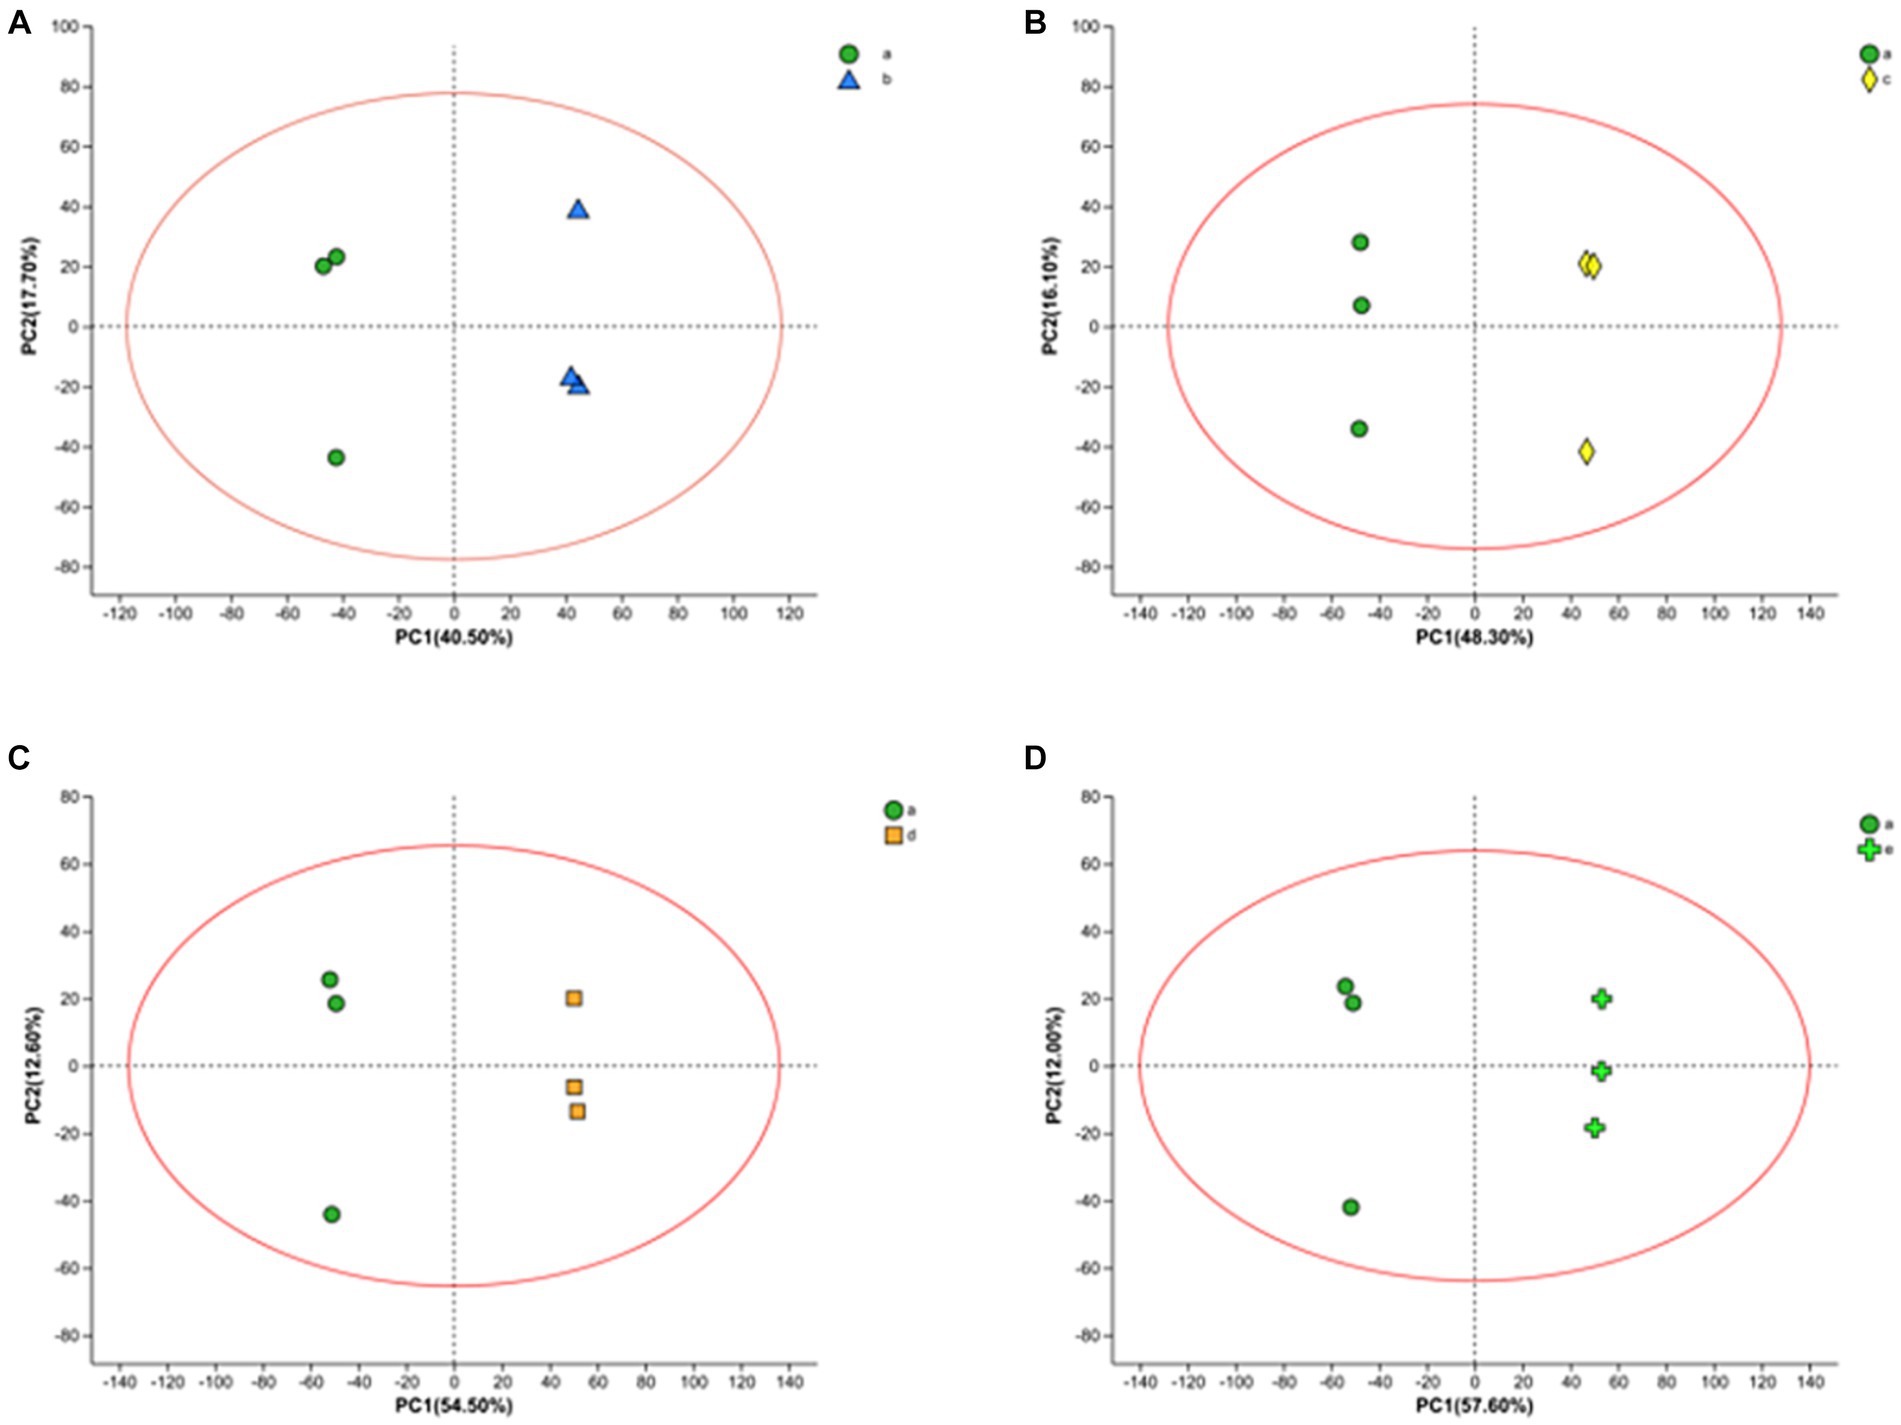
Figure 3. PCA score plots of FTJ during different multi-strain fermentation stages [(A) 0–10 h; (B) 0–16 h; (C) 0–20 h; (D) 0–22 h].
In this work, we also analyzed the metabolite variation using the OPLS-DA model. OPLS-DA is an orthogonal correction that filters out uncorrelated orthogonal signals, ensuring a valid and more reliable model. In the model, there were four groups, and their OPLS-DA score plots (Figure 4) showed excellent model parameters (0 h–10 h: R2Y = 1, Q2 = 0.963; 0 h–16 h: R2Y = 1, Q2 = 0.983; 0 h–20 h: R2Y = 1, Q2 = 0.990; 0 h–22 h, R2Y = 1, Q2 = 0.993). In cross-validation and response alignment, tests showed that no overfitting occurred in the OPLS-DA model (Supplementary Figure S1). Therefore, the OPLS-DA model is valid with high predictive power and can be used to explore metabolic differences at different stages during the fermentation of FTJ.
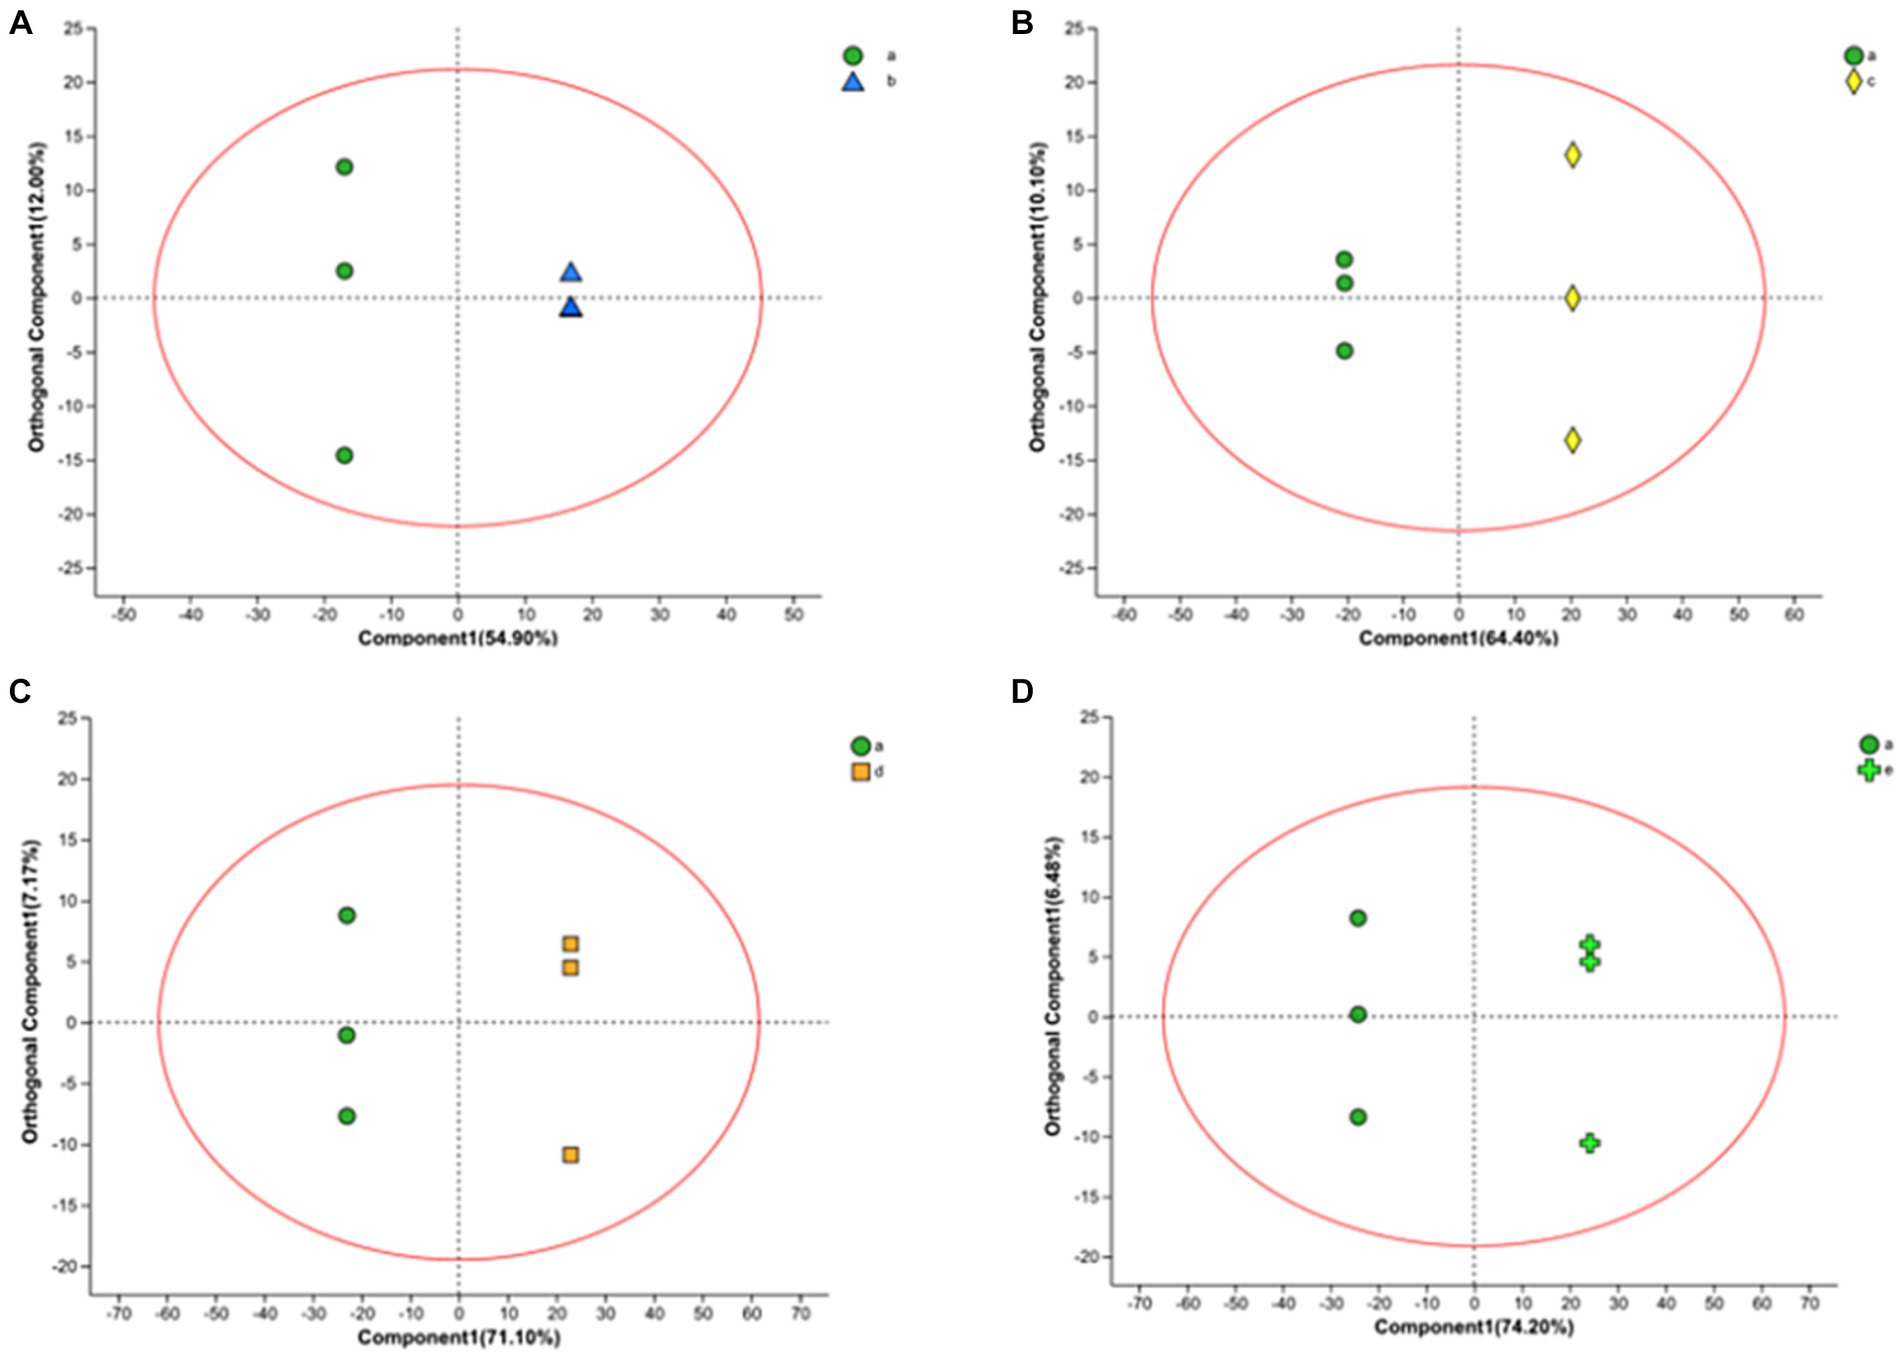
Figure 4. OPLS-DA in positive ion mode yields scatter plot [(A) 0–10 h; (B) 0–16 h; (C) 0–20 h; (D) 0–22 h].
3.4 Screening for differential metabolites
3.4.1 Determination of differential metabolites
The projection of the first principal component (VIP) from the OPLS-DA analysis was utilized to assess the strength and interpretability of the effect of expression patterns between groups. Typically, differential metabolites were identified as VIP > 1. In this study, the metabolites with VIP > 1 and p < 0.05 were selected to screen four groups (0–10 h, 0–16 h, 0–20 h, and 0–22 h) in a positive–negative ion mode. Overall, we identified 168 differential metabolites throughout the fermentation process, 75 differential metabolites during 0–10 h, 111 differential metabolites during 0–16 h, 136 differential metabolites during 0–20 h, and 166 differential metabolites during 0–22 h (Supplementary Table S1). Among these differential metabolites, organic acids, amino acids, and their derivatives, etc. accumulated mainly due to lactobacilli metabolism, whereas there were lipids and lipid-like molecules mainly consumed due to fermentation, suggesting that carbohydrates, certain amino acids, and lipids were the main precursors of the metabolites.
In addition, we categorized and ranked the major differential metabolites (Figure 5) to gain more insight into the changes in differential metabolites during FTJ. The results showed that the major different metabolites during FTJ were peptides, amino acids, and carbohydrates. These metabolites have different metabolic profiles in different fermentation stages. It is noteworthy that the metabolic properties of the primary metabolites showed relative differences at different stages of the fermentation process. The species and relative abundance of the difference metabolites were the primary ways in which they were expressed. We also constructed a hierarchical cluster analysis (HCA) (Figure 6), the findings of which were consistent with the differential metabolites.
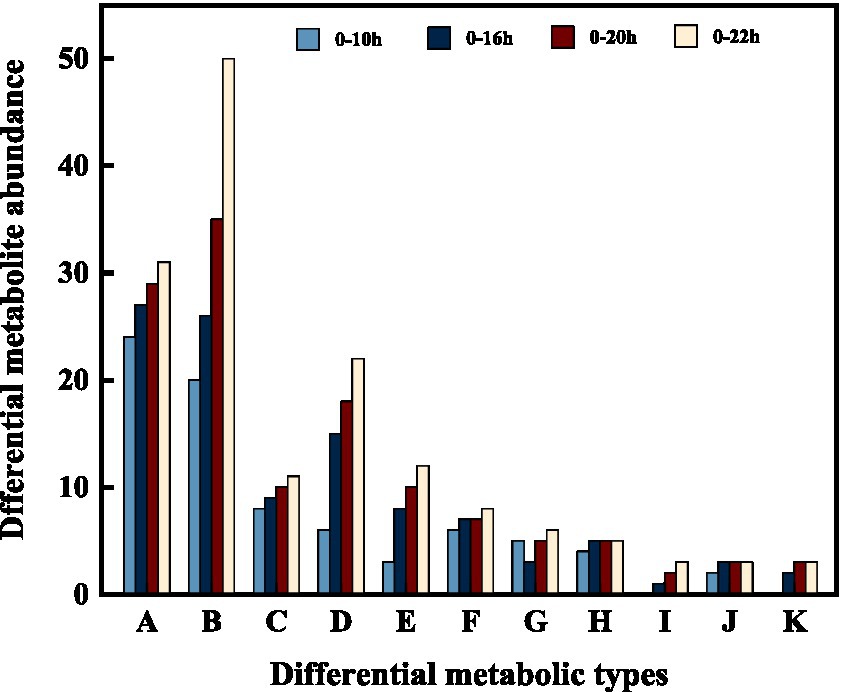
Figure 5. Changes of differential metabolites in FTJ during different multi-strain fermentation stages [A: Peptides; B: amino acid; C: heterocyclic compounds; D: phospholipid; E: carbohydrate; F: organic acid; G: steroid; H: amine; I: terpene; J: sulfur-containing compounds; K: fatty acid].
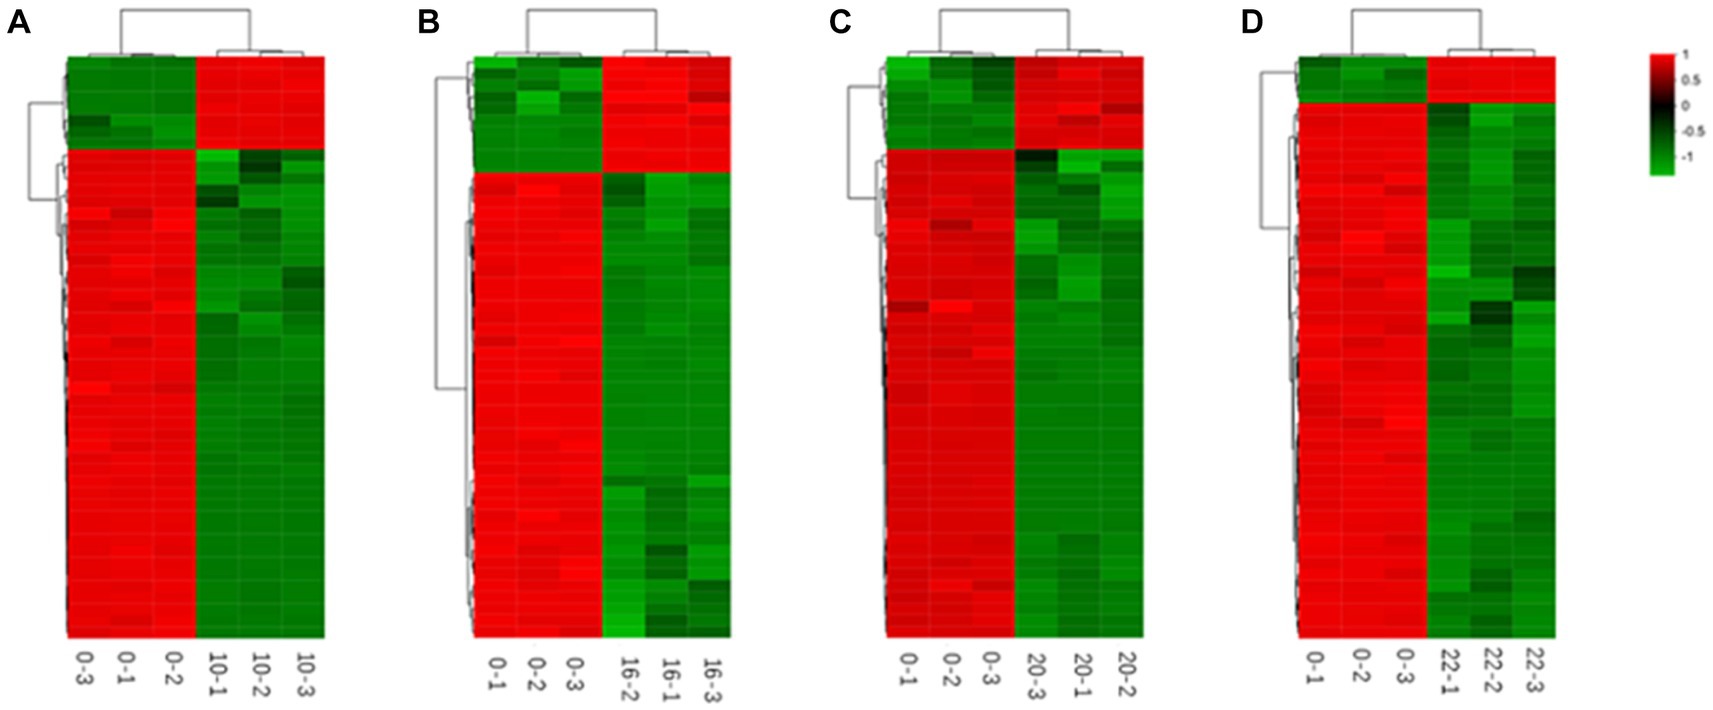
Figure 6. Heat maps of metabolites differing by fermentation times [(A) 0–10 h; (B) 0–16 h; (C) 0–20 h; (D) 0–22 h].
3.4.2 Dynamics of carbohydrates, phospholipids, organic acids, and terpenoids during fermentation
Throughout the fermentation process, the total amount of carbohydrate matter decreased from an initial 1118.6 to 1109.6. Galactitol is commonly used as a low-calorie sweetener and can be a potential component of biobased chemicals. During fermentation, the content of galactitol increased from an initial 5.389 to 6.607 (Figure 7A), which may be related to the hydrolysis of sucrose, and other complex polysaccharides in tomato enzymes (26). The content of cytarabine decreased by 29% (Figure 7B), which may be due to enzymatic deglycosylation. Uridine decreased by 44% (Figure 7C) due to the use of lactobacillus fermentation which requires carbohydrates as an energy source for growth (19).
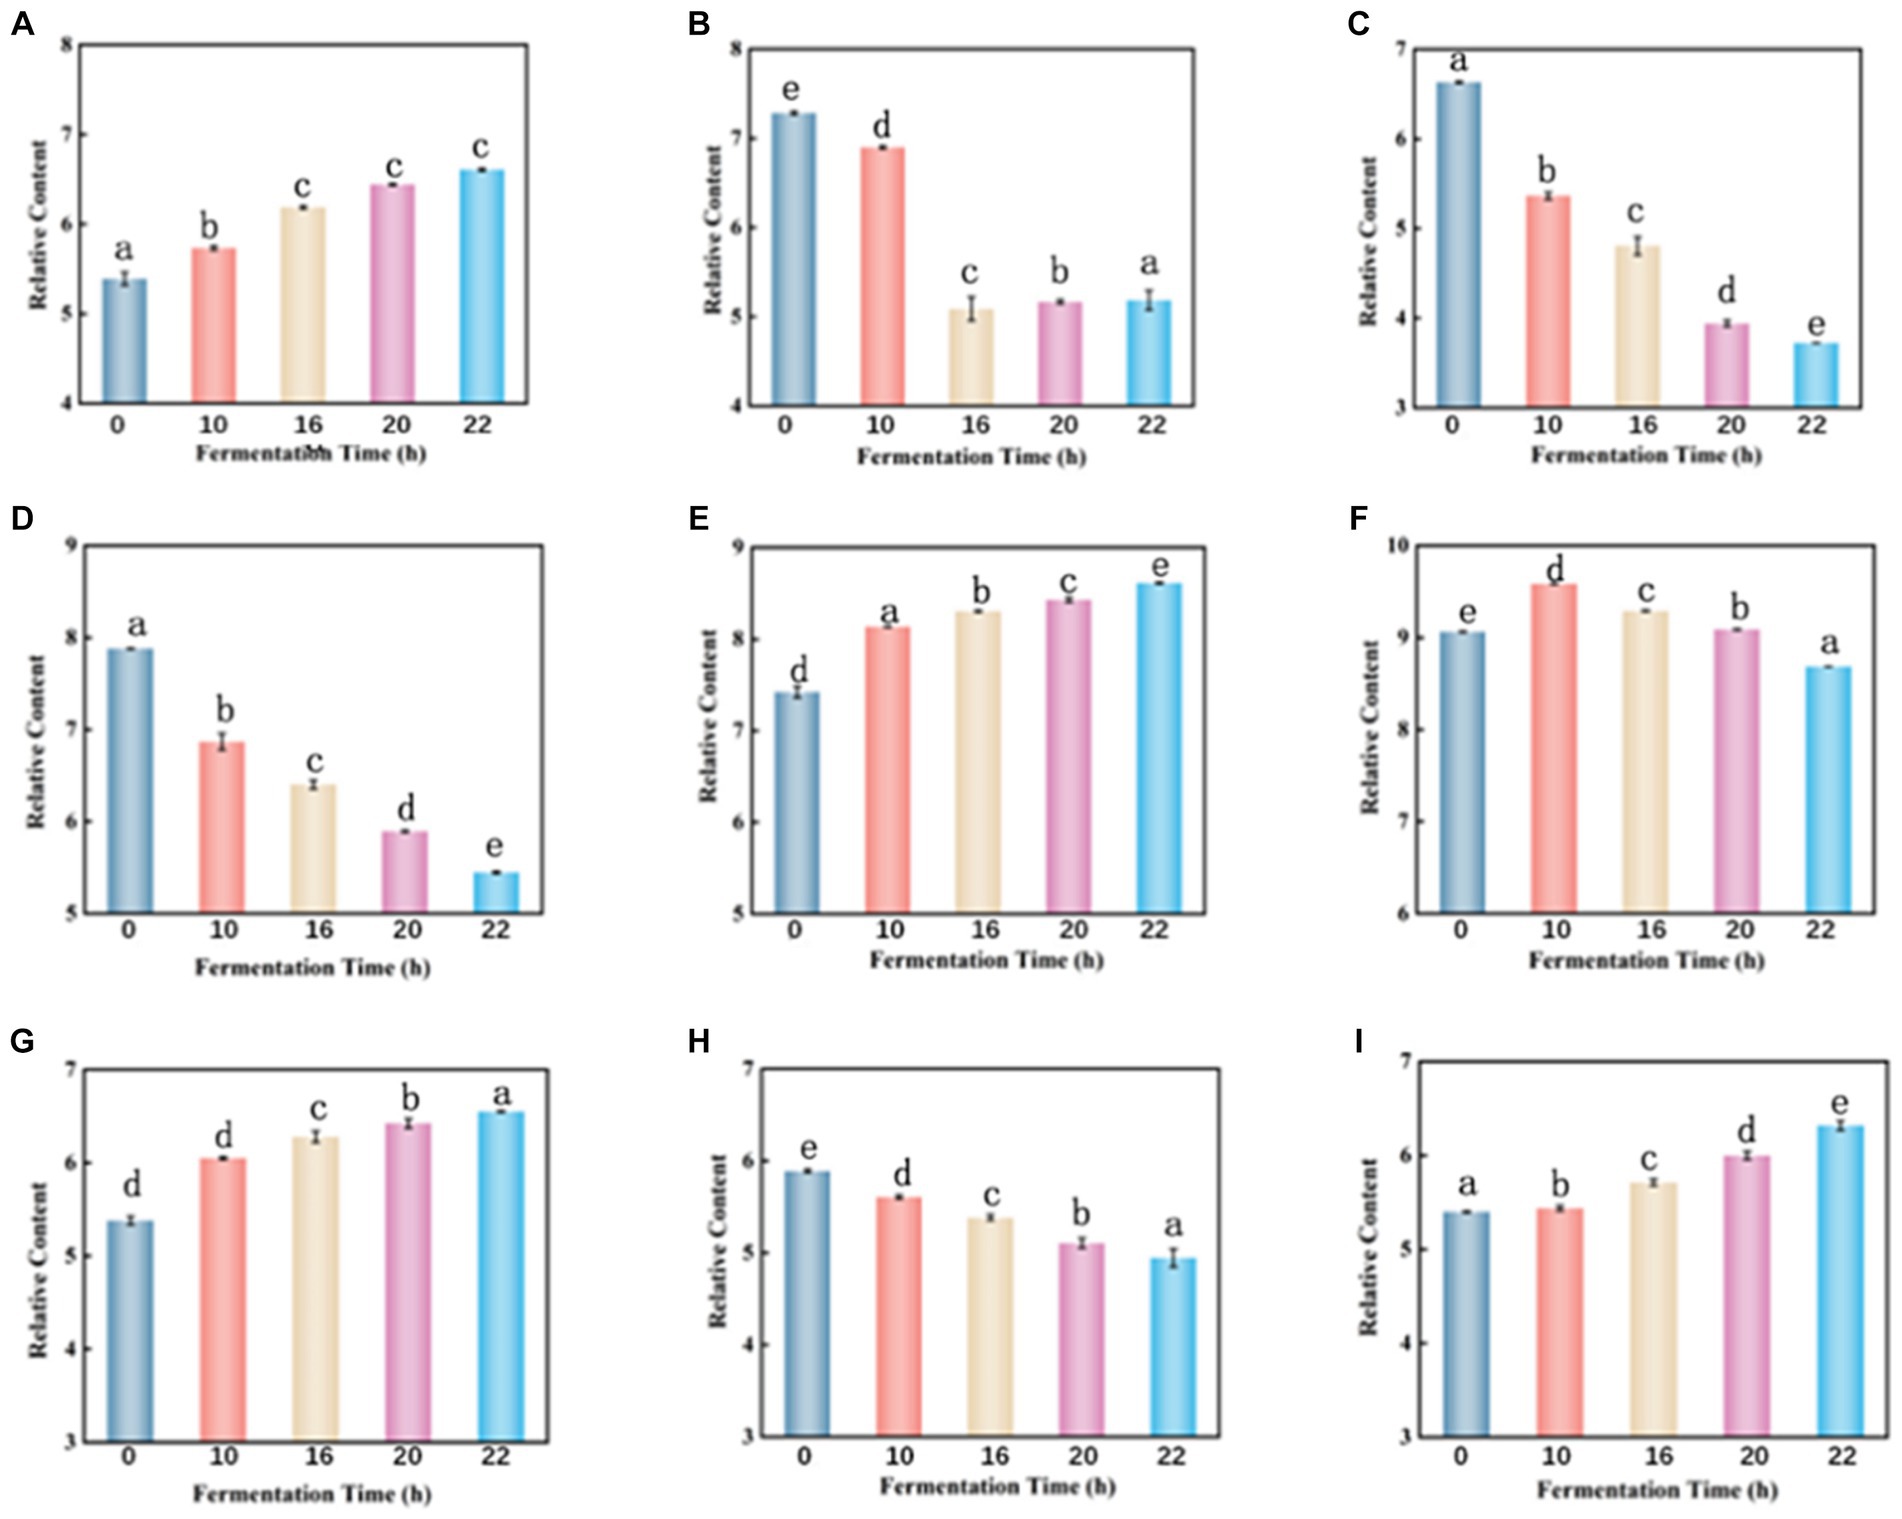
Figure 7. Dynamic changes of key differential metabolites in FTJ during different multi-strain fermentation stages [(A) Galactitol; (B) cytarabine; (C) uridine; (D) malic acid; (E) lactic acid; (F) citric acid; (G) 16-deacetylgeyerline; (H) (+)-Royleanone; (I) artecanin]. Different lowercase letters represent significant differences between values (p < 0.05).
Malic acid is highest in unfermented tomato juice and decreases with longer fermentation time (Figure 7D). LAB can metabolize malic acid using malic acid lactase, which decarboxylates it to lactic acid using NAD+ and Mn2+-dependent malic acid lactase (27–29). However, L. casei can also utilize malic enzymes to break down malate into pyruvate, allowing them to use malate as a carbon source for growth (30). Lactic acid is the primary organic acid produced during LAB fermentation. Its content slightly increases with the duration of fermentation (Figure 7E). Lactic acid is produced by LAB through sugar metabolism, but this is not the only way LAB produces this metabolite. In fact, polyols (e.g., glycerol) or acids (e.g., malic acid) may also be metabolized to produce lactic acid (31). Lactic acid and typically low pH can damage cell walls and membranes, altering membrane potential and active transport (32), leading to energy depletion and cell death. Therefore, the preservation of fermented juices is favored due to the high lactic acid content during fermentation. Citric acid is known to be a key intermediate in the tricarboxylic acid (TCA) cycle (33). Therefore, citric acid increased at the beginning of fermentation but decreased thereafter (Figure 7F). Citric acid can be transformed by citrate lyase in LAB to oxaloacetate and acetic acid, whereas oxaloacetate can be converted to pyruvate, which can then be converted by LAB to the flavoring molecule 3-hydroxybutanone (34).
Terpenoids are a diverse group of plant secondary metabolites consisting of several isoprene units (35). These bioactive compounds confer a wide range of biological activities such as anticancer, antiallergic, antimicrobial, and antioxidant activities (36, 37). When the fermentation process was completed, 99% of the total terpenoid content was retained, with 1.21-fold up-regulation of 16-deacetylgairin and 1.22- go down-regulation of (+)-Royleanone (Figures 7G–I). Artemisinin is a sesquiterpene endoperoxide with potent antimalarial properties (38). Artemisinin was also slightly elevated during fermentation. It indicated that terpenoids were extracted from the berries during the fermentation process (39).
Phospholipids are major structural components of cell membranes and are essential for various cellular processes (40). In previous studies, it was shown that phosphatidylserine (PS) and phosphatidylethanolamine (PE) are high quality phospholipids. Studies have shown that the combined use of PS and PE lipids can be effective in the treatment of some cancers (41). The quantitative results of PS, PE, PC, PG, and PI were shown in Table 8. The total amount of all of them decreased to different degrees after fermentation. PC content decreased from 41.138 to 35.755 and PE content decreased from 56.543 to 46.964. Although the intensity of PS was lower compared to the others, it also decreased after fermentation with PS content decreasing from 11.119 to 9.186 (Table 8). The results showed that most of these species contain unsaturated fatty acyl fractions, including oleic (18:1), linoleic (18:2), and linolenic (18:3) acid chains. Specifically, esterified polyunsaturated 18:2 and 18:3 chains predominated. This result suggests that phospholipids containing 18:2 and 18:3 chain acyl groups underwent degradation in microorganisms during fermentation.
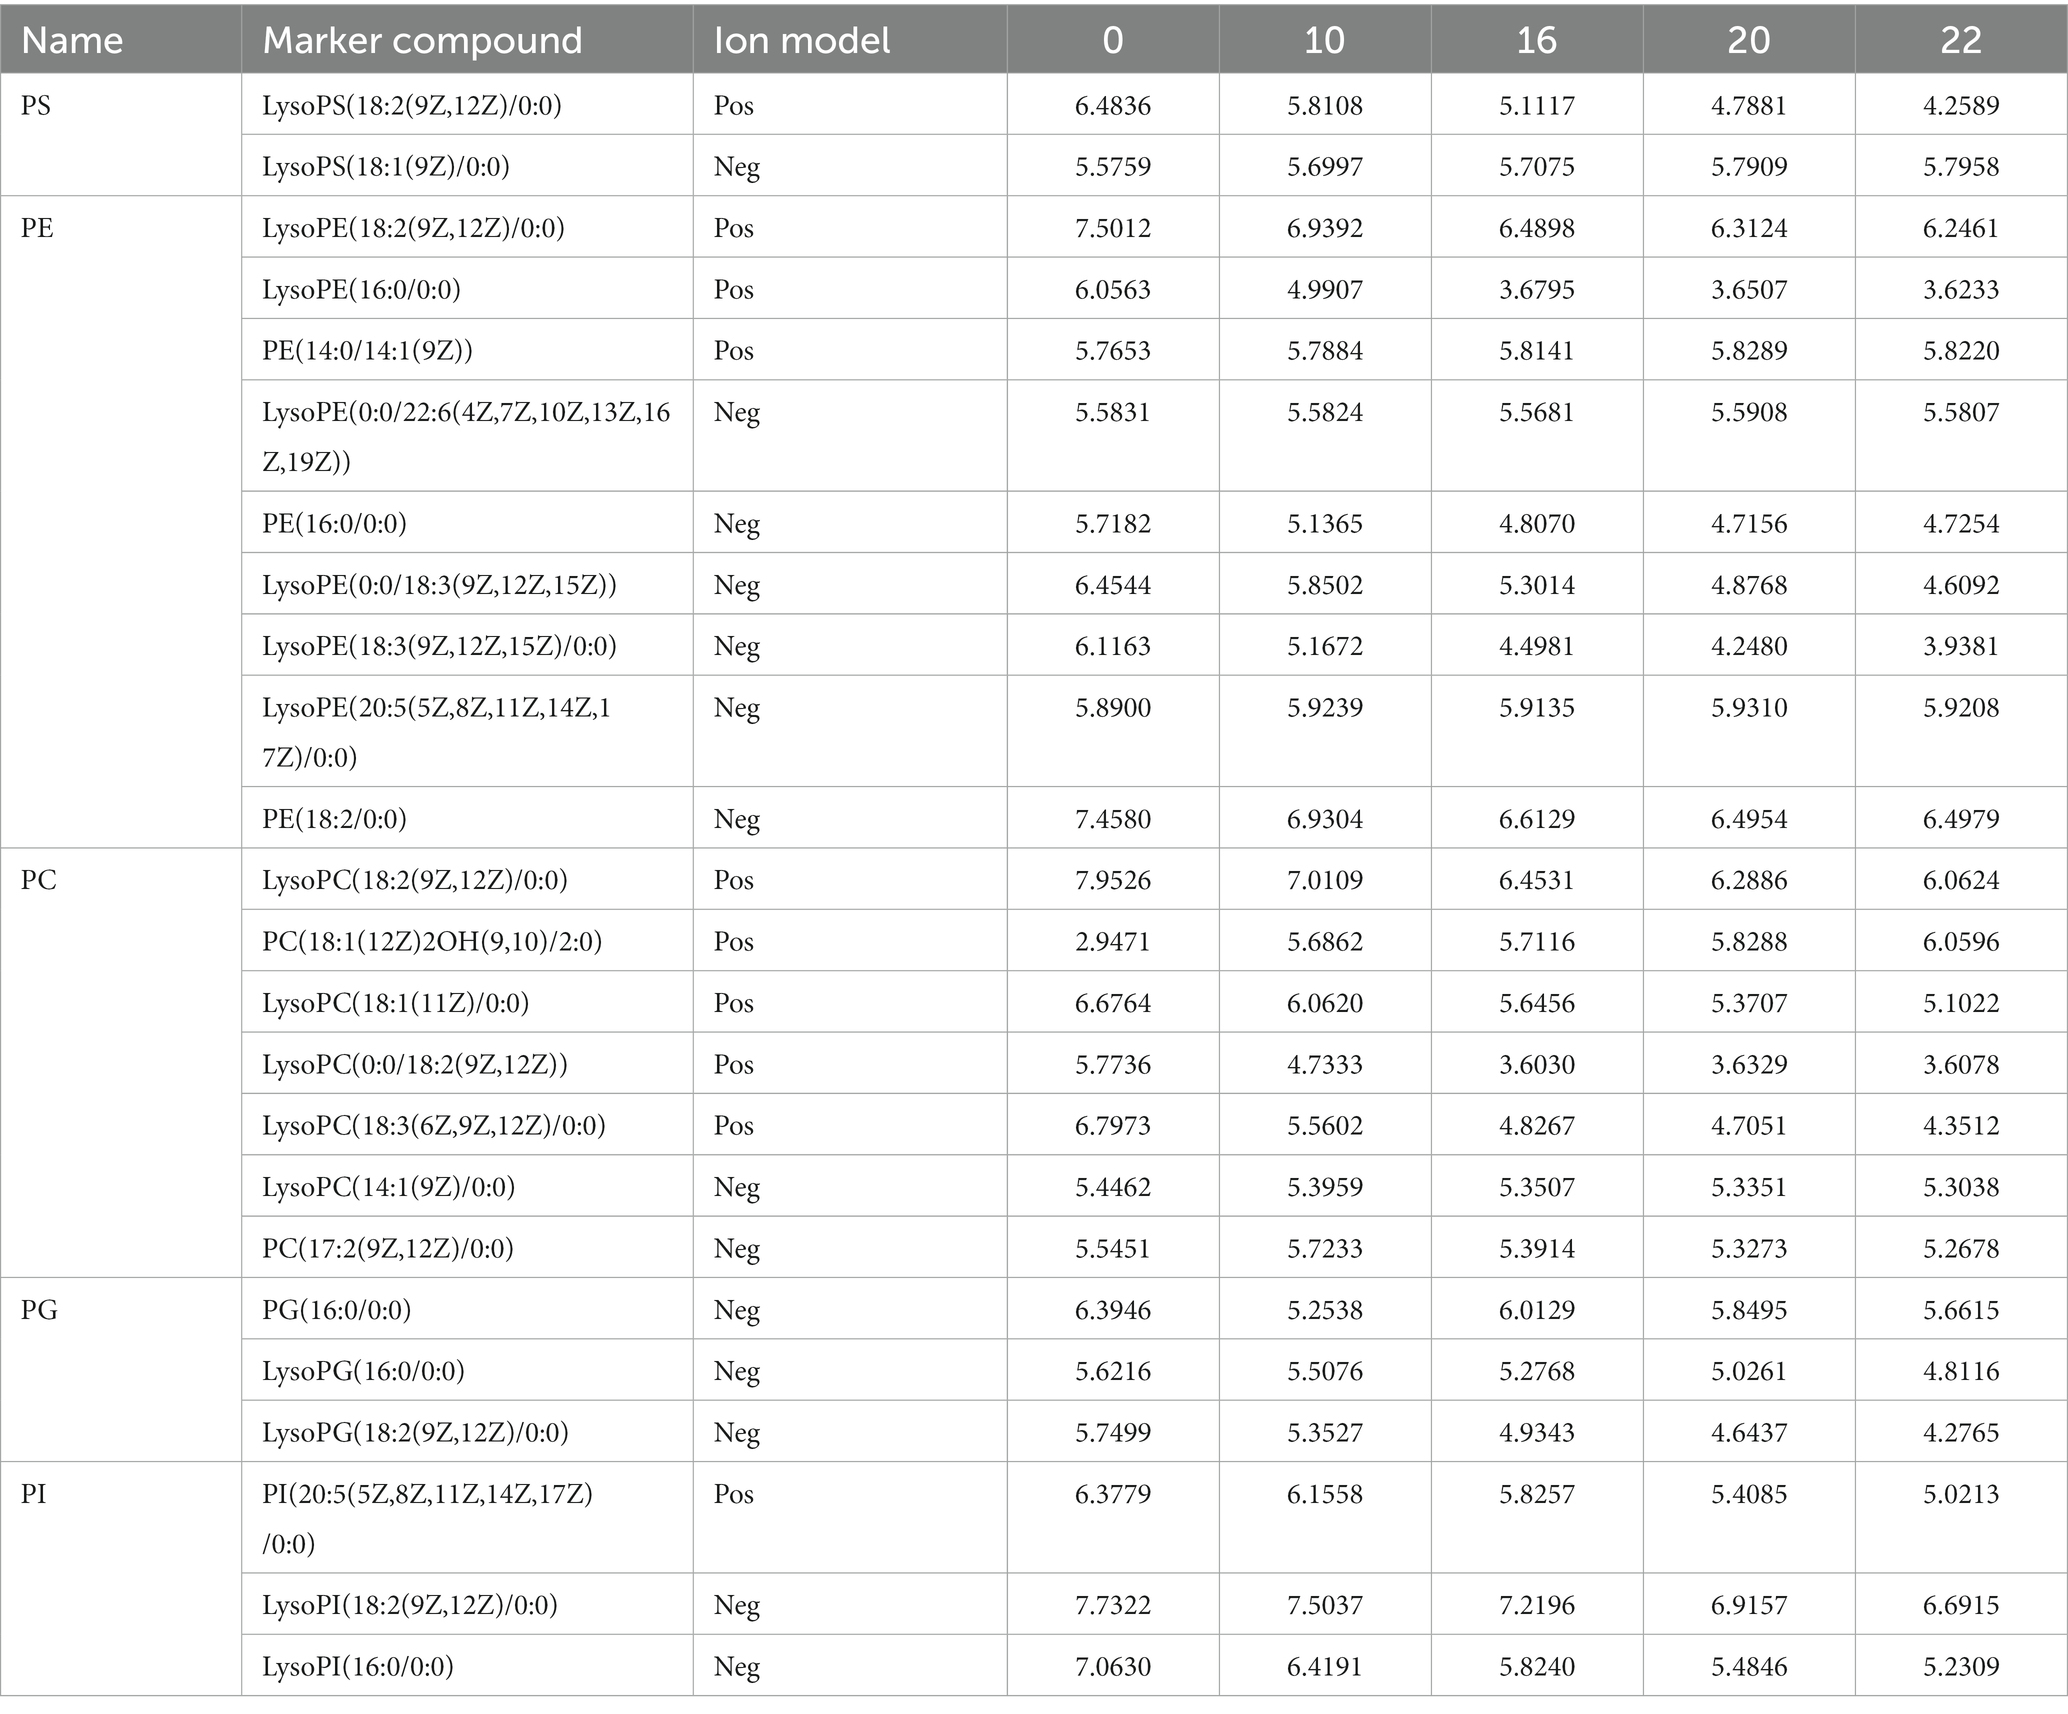
Table 8. Dynamic changes of key phosphatidylinositol in FTJ during different multi-strain fermentation stages.
Lipidomics analysis was conducted according to previous studies (42), and we predicted that the phospholipids in this study may follow a similar degradation pathway. In the presence of hydrolytic enzymes from the microbial community, phospholipids undergo a lipolytic reaction that releases free fatty acids, namely phospholipids PE and PC, and simultaneously generates solubilized phospholipids. These changes could be the primary cause of the decline in phospholipid content. Various fatty acids elongate fatty acids, leading to the production of very long-chain fatty acids with a wide range of chain lengths (42). Fatty acids can be converted to hydroxy fatty acids through a series of microbial fatty acid hydroxylase reactions. Hydroxy fatty acids can be further transformed into hydroxy fatty acid branched-chain fatty acid esters by acylation reactions. Moreover, hydroxy fatty acids may be integrated into sphingolipids such as ceramides (43), thus contributing to sphingolipid accumulation.
4 Conclusion
In this study, the suitability of 10 probiotic strains for tomato juice fermentation was investigated and 4 of the most suitable strains were selected. The FTJ process was optimized using a homogeneous design and RSM. The optimal fermentation conditions for FTJ fermentation were determined as follows: fermentation time of 22 h, TSS content of 13°Brix, fermentation temperature of 37°C, and inoculum concentration of 3 × 10⁶ CFU/mL.
We analyzed key differential metabolites of fermented tomato juice using UHPLC-QE-MS/MS and identified 168 different metabolites: including carbohydrates, phospholipids, organic acids, and terpenes. Changes in carbohydrates such as galactitol, aglycone, and uridine were related to the hydrolysis of sucrose and polysaccharides in the fermented tomato juice and their need for LAB-fermentation as an energy source for growth. The changes in phospholipids (PS, PE, PC, PG, PI) are since most of these species contain unsaturated fatty acyl portions and they can undergo degradation during microbial fermentation. Organic acids (malic, citric, lactic) can be altered because each has a different metabolic pathway. During fermentation, 16-deacetylgairin, (+)-Royleanone, and artemisinin have different degrees of variation with fermentation time due to the terpenoids that can be extracted from the stock solution. Due to the limitations of the specific strains and experimental conditions used in this study, there may be some deficiencies in general applicability, and further studies involving a wider range of strains and fermentation conditions are needed to improve the applicability of the results. All in all, this study provides further insight into the fermentation process of tomato juice and the dynamic changes of metabolites during fermentation and lays the foundation for the study of fruit and vegetable fermentation.
Data availability statement
The original contributions presented in the study are included in the article/Supplementary material, further inquiries can be directed to the corresponding authors.
Author contributions
LZ: Writing – original draft. RM: Writing – review & editing. JH: Writing – review & editing. LW: Writing – review & editing. YM: Writing – review & editing. BL: Writing – review & editing. HZ: Writing – review & editing. KC: Writing – review & editing. AA: Writing – review & editing.
Funding
The author(s) declare financial support was received for the research, authorship, and/or publication of this article. This work was supported by the research on key technologies for the deep processing of Xinjiang’s characteristic by-products, and the sub-theme “Comprehensive Utilization of Tomato Processing By-products” of the Key Research and Development Special Project of the Autonomous Region (Xinjiang Uygur Autonomous Region, China) (2022B02004-3).
Acknowledgments
The authors are also indebted to the reviewers for their constructive comments and suggestions for the improvement of this manuscript.
Conflict of interest
KC was employed by Xinjiang Huize Food Limited Liability Company.
The remaining authors declare that the research was conducted in the absence of any commercial or financial relationships that could be construed as a potential conflict of interest.
Publisher’s note
All claims expressed in this article are solely those of the authors and do not necessarily represent those of their affiliated organizations, or those of the publisher, the editors and the reviewers. Any product that may be evaluated in this article, or claim that may be made by its manufacturer, is not guaranteed or endorsed by the publisher.
Supplementary material
The Supplementary material for this article can be found online at: https://www.frontiersin.org/articles/10.3389/fnut.2024.1344117/full#supplementary-material
Footnotes
1. ^FAO, 2020, https://www.fao.org/faostat/en/-data/QCL, accessed date 25 April 2022.
References
1. Izzo, L, Castaldo, L, Lombardi, S, Gaspari, A, Grosso, M, and Ritieni, A. Bioaccessibility and antioxidant capacity of bioactive compounds from various typologies of canned tomatoes. Front Nutr. (2022) 9:849163. doi: 10.3389/fnut.2022.849163
2. Salehi, B, Sharififi Rad, R, Sharopov, F, Namiesnik, J, Roointan, A, Kamle, M, et al. Beneficial effects and potential risks of tomatoes consumption for human health. An overview. Nutrition. (2019) 62:201–8. doi: 10.1016/j.nut.2019.01.012
3. Szabo, K, Teleky, BE, Ranga, F, Roman, I, Khaoula, H, Boudaya, E, et al. Carotenoid recovery from tomato processing by-products through green chemistry. Molecules. (2022) 27:3771. doi: 10.3390/molecules27123771
4. Lu, Z, Wang, J, Gao, R, Ye, F, and Zhao, G. Sustainable valorisation of tomato pomace: a comprehensive review. Trends Food Sci. (2019) 86:172–87. doi: 10.1016/j.tifs.2019.02.020
5. Kun, Y, Ssonko Lule, U, and Xiao-Lin, D. Lycopene: its properties and relationship to human health. Food Rev Intl. (2006) 22:309–33. doi: 10.1080/87559120600864753
6. Steven, K, and Clinton, M. Lycopene: chemistry, biology, and implications for human health and disease. Nutr Rev. (1998) 56:35–51. doi: 10.1111/j.1753-4887.1998.tb01691.x
7. Rojas, ML, Alvim, ID, and Augusto, PED. Incorporation of microencapsulated hydrophilic and lipophilic nutrients into foods by using ultrasound as a pre-treatment for drying: a prospective study. Ultrason Sonochem. (2019) 54:153–61. doi: 10.1016/j.ultsonch.2019.02.004
8. Patel, A, Shah, N, and Prajapati, JB. Biosynthesis of vitamins and enzymes in fermented foods by lactic acid bacteria and related genera-a promising approach. Croatian J Food Sci Technol. (2013) 5:85–91.
9. Tyagi, A, Shabbir, U, Chelliah, R, Daliri, EBM, Chen, X, and Oh, DH. Limosilactobacillus reuteri fermented Brown rice: a product with enhanced bioactive compounds and antioxidant potential. Antioxidants. (2021) 10:1077. doi: 10.3390/antiox10071077
10. Arques, JL, Rodríguez, E, Langa, S, Landete, JM, and Medina, M. Antimicrobial activity of lactic acid bacteria in dairy products and gut: effect on pathogens. Bio Med Res Int. (2015) 2015:584183:1–9. doi: 10.1155/2015/584183
11. Martinez, RCR, Bedani, R, and Aad, SMI. Scientific evidence for health effects attributed to the consumption of probiotics and prebiotics: an update for current perspectives and future challenges. Br J Nutr. (2015) 114:1993–2015. doi: 10.1017/S0007114515003864
12. Quan, Q, Liu, W, Guo, JJ, Ye, ML, and Zhang, J. Effect of six lactic acid bacteria strains on physicochemical characteristics, antioxidant activities and sensory properties of fermented orange juice. Foods. (2022) 11:1920. doi: 10.3390/foods11131920
13. Qi, J, Huang, H, Wang, J, Liu, N, Chen, XF, and Jiang, T. Insights into the improvement of bioactive phytochemicals, antioxidant activities, and flavor profiles in Chinese wolfberry juice by select lactic acid bacteria. Food Biosci. (2021) 43:101264. doi: 10.1016/j.fbio.2021.101264
14. Liu, YY, Chen, HM, Chen, WX, Zhong, QP, Zhang, GF, and Chen, WJ. Beneficial effects of tomato juice fermented by Lactobacillus plantarum and Lactobacillus casei: Antioxidation, antimicrobial effect, and volatile profiles. Molecules. (2018) 23:2366. doi: 10.3390/molecules23092366
15. Adebo, OA, Oyeyinka, SA, Adebiyi, JA, Feng, X, Wilkin, JD, Kewuyemi, YO, et al. Application of gas chromatography–mass spectrometry (GC-MS)-based metabolomics for the study of fermented cereal and legume foods: a review. Int J Food Sci Technol. (2021) 56:1514–34. doi: 10.1111/ijfs.14794
16. Li, R, Sun, Z, Zhao, Y, Li, L, Yang, X, Cen, J, et al. Application of UHPLC-Q-TOF-MS/MS metabolomics approach to investigate the taste and nutrition changes in tilapia fillets treated with different thermal processing methods. Food Chem. (2021) 356:129737. doi: 10.1016/j.foodchem.2021.129737
17. Shan, LY, Akanksha, T, Chen, XQ, Yan, P-P, Oh, DH, and Hwan, D. Potential anti-obesity effect of fermented adzuki beans and their untargeted metabolomics using UHPLC-QTOF-MS. Food Biosci. (2023) 52:102380. doi: 10.1016/j.fbio.2023.102380
18. Yang, ZZ, and Wang, L. Development of Cistanche deserticola fermented juice and its repair effect on ethanol-induced WRL68 cell damage. Fermentation. (2022) 8:178. doi: 10.3390/fermentation8040178
19. Hashemi, SMB, and Jafarpour, D. Fermentation of bergamot juice with Lactobacillus plantarum strains in pure and mixed fermentations: chemical composition, antioxidant activity, and sensorial properties. LWT. (2020) 131:109803. doi: 10.1016/j.lwt.2020.109803
20. Cai, L, Wang, W, Tong, J, Fang, L, He, X, Xue, Q, et al. Changes of bioactive substances in lactic acid bacteria and yeasts fermented kiwifruit extract during the fermentation. LWT. (2022) 164:113629. doi: 10.1016/j.lwt.2022.113629
21. Ma, XH, Liu, T, Li, CT, and Zhu, JF. Determination of lycopene in lycopene micelles by HPLC method Z/E isomer content. Xinjiang Agric Sci. (2022) 59:2209–16. doi: 10.6048/j.issn.1001-4330.2022.09.015
22. Lu, YY, Mu, KY, McClements, DJ, Liang, XP, Liu, XB, and Fuguo Liu, FG. Fermentation of tomato juice improves in vitro bioaccessibility of lycopene. J Funct Foods. (2020) 71:104020. doi: 10.1016/j.jff.2020.104020
23. Lv, MS, Aihaiti, A, Liu, X, Tuerhong, N, Yang, J, Chen, K, et al. Development of probiotic-fermented black mulberry (Morusnigra L.) juice and its antioxidant activity in C2C12 cells. Fermentation. (2022) 8:697. doi: 10.3390/fermentation8120697
24. Wang, Y, He, L, Xing, Y, Zhou, W, Pian, R, Yang, F, et al. Bacterial diversity and fermentation quality of Moringa oleifera leaves silage prepared with lactic acid bacteria inoculants and stored at different temperatures. Bioresour Technol. (2019) 284:349–58. doi: 10.1016/j.biortech.2019.03.139
25. Zhao, Y, Liu, S, Han, X, Zhou, Z, and Mao, J. Combined effects of fermentation temperature and Saccharomyces cerevisiae strains on free amino acids, flavor substances, and undesirable secondary metabolites in huangjiu fermentation. Food Microbiol. (2022) 108:104091. doi: 10.1016/j.fm.2022.104091
26. Viesser, JA, Pereira, GVDM, Neto, H, Rogez, DPDC, Neto, AG, Azevedo, V, et al. Co-culturing fructophilic lactic acid bacteria and yeast enhanced sugar metabolism and aroma formation during cocoa beans fermentation. Food Microbiol. (2021) 339:109015. doi: 10.1016/j.ijfoodmicro.2020.109015
27. Filannino, P, Cardinali, G, Rizzello, CG, Buchin, S, De Angelis, M, and Gobbetti, M. Metabolic responses of Lactobacillus plantarum strains during fermentation and storage of vegetable and fruit juices. Appl Environ Microbiol. (2014) 80:2206–15. doi: 10.1128/AEM.03885-13
28. Jyoti, BD, Suresha, AK, and Venkatesha, KV. Effect of preculturing condition on growth of Lactobacillus rhamnosus on medium containing glucose and citrate. Microbiol Res. (2004) 159:35–42. doi: 10.1016/j.micres.2004.01.008
29. Landete, JM, Ferrer, S, Monedero, V, and Zúñiga, M. Malic enzyme and malolactic enzyme pathways are functionally linked but independently regulated in Lactobacillus casei BL23. Appl Environ Microbiol. (2013) 79:5509–18. doi: 10.1128/AEM.01177-13
30. Landete, JM, Garcia-Haro, L, and Blasco, A. Requirement of the Lactobacillus casei Mae KR two component system for l-malic acid utilization via a malic enzyme pathway. Appl Environ Microbiol. (2010) 76:84–95. doi: 10.1128/AEM.02145-09
31. Lahtinen, S, Arthur, C, Ouwehand, AC, Salminen, S, and von Wright, A. Lactic acid bacteria: Microbiological and functional aspects. 4th ed. Boca Raton, FL: CRC Press (2012).
32. Michael Davidson, P., Matthew Taylor, T., and Schmidt, Shannon E.; Chemical preservatives and natural antimicrobial compounds. In M. P. Doyle, L. R. Beuchat, and T. J. Montville (Eds.). Food Microbiology: Fundamentals and Frontiers. Wiley: Hoboken, NJ. (1997), 520–556.
33. Gao, P, Xia, W, Li, X, and Liu, S. Use of wine and dairy yeasts as single starter cultures for flavor compound modification in fish sauce fermentation. Front Microbiol. (2019) 10:2300. doi: 10.3389/fmicb.2019.02300
34. Mortera, P, Pudlik, A, Magni, C, Alarcón, S, and Lolkemaa, JS. Ca2+-citrate uptake and metabolism in Lactobacillus casei ATCC 334. Appl Environ Microbiol. (2013) 79:4603–12. doi: 10.1128/AEM.00925-13
35. Hillier, S, and Lathe, R. Terpenes, hormones, and the life: isoprene rule revisited. J Endocrinol. (2019) 242:R9–R22. doi: 10.1530/JOE-19-0084
36. Ge, J, Liu, Z, Zhong, Z, Wang, L, Zhuo, X, Li, J, et al. Natural terpenoids with anti-inflammatory activities: potential leads for anti-inflammatory drug discovery. Bioorg Chem. (2022) 124:105817. doi: 10.1016/j.bioorg.2022.105817
37. Ma, JQ, Zhang, YJ, and Tian, ZK. Anti-oxidant, anti-inflammatory and antifibrosis effects of ganoderic acid a on carbon tetrachloride induced nephrotoxicity by regulating the Trx/Trx R and JAK/ROCK pathway. Chem Biol Interact. (2021) 344:109529. doi: 10.1016/j.cbi.2021.109529
38. Smith, AB, and Chekan, JR. Engineering yeast for industrial-level production of the antimalarial drug artemisinin. Trends Biotechnol. (2023) 41:267–9. doi: 10.1016/j.tibtech.2022.12.007
39. Liu, FT, Li, SJ, Gao, JH, Cheng, K, and Yuan, F. Changes of terpenoids and other volatiles during alcoholic fermentation of blueberry wines made from two southern highbush cultivars. LWT. (2019) 109:233–40. doi: 10.1016/j.lwt.2019.03.100
40. Margutti, MP, Reyna, M, Vilchez, AC, and Villasuso, AL. Lipid profiling shows tissue-specific differences in barley for glycerolipid composition in response to chilling. Environ Exp Bot. (2019) 158:150–60. doi: 10.1016/j.envexpbot.2018.11.023
41. Leite, NB, Aufderhorst-Roberts, A, Palma, MS, Connell, SD, Neto, JR, and Beales, PA. PE and PS lipids synergistically enhance membrane poration by a peptide with anticancer properties. Biophys J. (2015) 109:936–47. doi: 10.1016/j.bpj.2015.07.033
42. Li, J, Yuan, HB, Rong, YT, Qian, MC, Liu, FQ, Hua, JJ, et al. Lipid metabolic characteristics and marker compounds of ripened Pu-erh tea during pile fermentation revealed by LC-MS-based lipidomics. Food Chem. (2023) 404:134665. doi: 10.1016/j.foodchem.2022.134665
Keywords: fermentation, tomato juice, superoxide dismutase, response surface methodology, UHPLC-QE-MS/MS
Citation: Zhao L, Maimaitiyiming R, Hong J, Wang L, Mu Y, Liu B, Zhang H, Chen K and Aihaiti A (2024) Optimization of tomato (Solanum lycopersicum L.) juice fermentation process and analysis of its metabolites during fermentation. Front. Nutr. 11:1344117. doi: 10.3389/fnut.2024.1344117
Edited by:
Zhaojun Wei, Hefei University of Technology, ChinaReviewed by:
Anran Zheng, Ningxia University, ChinaTeleky Bernadette-Emoke, University of Agricultural Sciences and Veterinary Medicine of Cluj-Napoca, Romania
Copyright © 2024 Zhao, Maimaitiyiming, Hong, Wang, Mu, Liu, Zhang, Chen and Aihaiti. This is an open-access article distributed under the terms of the Creative Commons Attribution License (CC BY). The use, distribution or reproduction in other forums is permitted, provided the original author(s) and the copyright owner(s) are credited and that the original publication in this journal is cited, in accordance with accepted academic practice. No use, distribution or reproduction is permitted which does not comply with these terms.
*Correspondence: Aihemaitijiang Aihaiti, MjM4NjkzNTg4NEBxcS5jb20=; Jingyang Hong, aG9uZ2ppbmd5YW5nMjAxN0AxMjYuY29t
†These authors share first authorship
 Lei Zhao
 Ruxianguli Maimaitiyiming1†
 Jingyang Hong
 Liang Wang