 Anupa Thapa
 Tuuli Lahti1,3
 Timo Partonen
94% of researchers rate our articles as excellent or good
Learn more about the work of our research integrity team to safeguard the quality of each article we publish.
Find out more
ORIGINAL RESEARCH article
Front. Nutr., 16 May 2024
Sec. Nutritional Epidemiology
Volume 11 - 2024 | https://doi.org/10.3389/fnut.2024.1319821
Introduction: Sleep and diet are crucial determinants of overall health and wellbeing, with the potential to mutually influence each other. This study examined the association between sleep duration and fruits and vegetables (FV) consumption among Finnish adults.
Methods: The study analyzed data from the National FinHealth 2017 Study involving 5,043 adults aged 18 years and above. Participants reported their habitual sleep duration, and dietary consumption through a validated self-administered questionnaire. Confounders such as demographic, socio-economic factors, and chronotype were considered. A sensitivity analysis, which excluded energy under-reporters, was conducted to validate the findings.
Results: Mean dietary consumption was compared across three sleep duration categories (short, normal, long), revealing that short sleepers consumed 37 g/d fewer FV, and long sleepers consumed 73 g/d fewer FV than normal sleepers. Binary logistic regression analyses consistently demonstrated significant negative association between FV consumption and both short and long sleep duration across all models, even when adjusted for a range of covariates. Linear regression analyses revealed a positive but non-significant association between sleep duration and FV consumption that became significant when excluding energy under-reporters, particularly in model 1.
Discussion: This study suggests a consistent pattern where deviation from normal sleep duration was associated with decreased FV consumption, suggesting the need for considering sleep patterns in dietary intervention. The substantial role of accurate energy reporting in explaining these associations is highlighted. Further research, including longitudinal studies, is needed to better understand the mechanisms underlying these associations.
Sleep and diet are critical determinants of overall health and wellbeing (1). It is recommended that a healthy adult should sleep between 7 to 9 h a night (2, 3). However, the modern landscape, shaped by lifestyle dynamics and environmental triggers such as sedentary habits and dietary choices, has led to a concerning surge in adult sleep deprivation (4, 5). Finland, for instance, has witnessed an upswing in sporadic insomnia symptoms (6) accompanied by reduced sleep duration in adult population (7). This emerging public health concern is amplified by the link between inadequate sleep and adverse health outcomes, including cardiovascular diseases (8), cognitive malfunction (9), and increased all-cause mortality (10).
Recognizing the intricate relationship between health outcomes and dietary choices (11), substantial efforts have been directed toward enhancing people’s food-related knowledge (12–14). However, certain aspects of modern life, such as time constraints, easily accessible fast foods, stress, and inadequate sleep, collectively contribute to unhealthy food choices (15, 16). The World Health Organization (WHO) recommends a daily consumption of at least 400 g of fruits and vegetables, a guideline underpinned by the well-established benefits of substantial FV intake in mitigating the risk of chronic diseases (17–19). The recently updated Nordic Nutrition Recommendations for 2023 advocate an even higher daily consumption of at least 500 to 800 g of vegetables, fruits, and berries, with half of the consumption coming from vegetables (20). Unfortunately, data from many countries, including Finland shows non-compliance (21–24). In Finland, for example, only 14% of men and 22% of women met the current national recommendation of consuming a minimum of 500 g of vegetables, fruits, and berries per day (25, 26).
While the significance of adequate sleep and consumption of FV for overall health is becoming more evident through numerous studies, a notable gap exists in comprehending the potential interplay between these factors within the general population. Existing research has primarily concentrated on specific demographic segments, including pregnant women, adolescents, children, young adults, and the elderly, often with limited sample sizes (27–33). Consequently, a comprehensive understanding of these associations across a broader spectrum of the population remains elusive. To bridge this gap, our study embarked on a nationwide cross-sectional analysis encompassing a larger and more diverse adult cohort.
Chronotype, which reflects an individual’s preference for timing of activities during the day (morning or evening preference), has demonstrated its influence on both sleep patterns and dietary choices in prior research (34–37). However, previous studies investigating the link between sleep duration and FV consumption have often overlooked chronotype as a potential confounder. Including chronotype in the analysis allows us to delve into how an individual’s innate preference for activity timing interacts with their sleep duration and dietary behaviors. This aspect of our study is pivotal as it contributes an additional layer of understanding when examining the association between sleep duration and dietary behaviors.
Our study provides a holistic perspective on the interactions between sleep duration and fruits and vegetable consumption. We aim to specifically explore how sleep duration influence fruits and vegetable consumption and vice-versa. Additionally, we will investigate the role of chronotype as a potential confounder in the associations between sleep duration and fruits and vegetables consumption.
The data for this study were derived from the National FinHealth 2017 Study, which is a population-based cross-sectional health survey. It comprises of a representative sample of individuals aged 18 and older residing in Finland. Participants were selected through stratified random sampling methods based on gender, age, and geographical location. Out of the eligible sample (n = 10,247) who received an invitation letter to a health examination and to complete a self-administered questionnaire by mail, 58.1% participated in the health examination. During this examination, participants were provided with additional questionnaires, including the Food Frequency Questionnaire (FFQ), which could also be completed electronically. Of those who took part in the health examination 86.1% returned the FFQ. Exclusions from the study were made for various reasons: incomplete FFQs (110 cases), duplicate responses (9 cases) and withdrawal of consent (7 cases). To ensure the credibility of the dietary data, FFQs that reported extreme and implausible energy intake values were also excluded (51 FFQs). This was based on daily energy intake thresholds that marked the lowest and highest 0.5% of sex-specific energy intake for monitoring dietary intake in large cohort studies (38, 39). After these exclusions, the total sample size was narrowed to 5,125 participants. A further exclusion was made due to missing information on sleep duration (80 cases), resulting in a final analytical sample of 5,043 adults for this study. The pattern of missing data was evaluated using Little’s MCAR test, which yielded a Chi-Square statistic of 2.167 with one degree of freedom (p = 0.14), suggesting that the missingness was random. As a result, listwise deletion was employed to handle missing data in the analysis.
The study protocol and method of the FinHealth 2017 study is described in detail elsewhere (40, 41). Ethical approval for the FinHealth 2017 Study was obtained from the Coordinating Ethics Committee for the Hospital District of Helsinki and Uusimaa (Reference 37/13/03/00/2016), and all participants provided written informed consent. In addition, for this study a permission was acquired from the institutional review board at the Finnish Institute for Health and Welfare (THL) to further analyze the dataset (Reference FT2019_025). All procedures were performed in accordance with the valid guidelines and regulations as well as the Declaration of Helsinki and its amendments.
This study examined two pivotal variables: sleep duration and total fruit and vegetable consumption (TFVC). Sleep duration was assessed through a self-administered questionnaire. Participants were asked to report their habitual sleep duration with the question, “How many hours do you sleep in 24 h?” They were instructed to provide their response in hours and minutes, reflecting their average sleep pattern. For subsequent analysis, minutes were converted into hours, and the total sleep duration was then computed. The resulting total sleep duration was further classified into three categories: short sleepers (less than 7 h per day), normal sleepers (7–9 h per day, the reference group), and long sleepers (more than 9 h per day).
The primary dietary variable of interest was the consumption of fruits (including citrus fruits, apple, berries, other fresh and canned fruits) and vegetables (including green leafy vegetables, root-vegetables, cabbages, mushrooms, legumes, fruit vegetables, other fresh and canned vegetables). The dietary information was gathered using a validated 134-item self-administered semi-quantitative food frequency questionnaire (FFQ) (42–44). Participants reported their habitual diet over the past 12 months, indicating the average consumption of each food item with a scale of 10 frequency categories ranging from none to six or more times a day (none, less than once a month, 1–3 times a month, once a week, 2–4 times a week, 5–6 times a week, once a day, 2–3 times a day, 4–5 times a day, and 6 or more times a day). The portion sizes were predefined and expressed in common household and natural units (e.g., glass, or slice). The average daily food consumption (g/day) and energy intake were calculated using the FINESSI software of THL and the Finnish National Food Composition Database (FINELI) (39).
The FinHealth 2017 Study included information on background variables including gender, age, education, employment, household income, cohabitation, the number of household members, the number of living children, Body Mass Index (BMI), physical activity level, smoking, alcohol consumption, total energy intake and chronotype. These variables were included in the statistical regression models as control variables, reflecting their established associations with sleep duration in previous literature.
For further analysis, age, education, employment, household income, cohabitation, body-mass index (BMI), physical activity level and chronotypes were grouped into different categories. Participants were categorized by age into younger adults (18–34 years), middle-aged adults (35–64 years), or older adults (65 years or older). BMI was grouped in four categories as follows: BMI < 18.5 (underweight), BMI 18.5–24.9 (normal weight), BMI 25.0–29.9 (overweight), or BMI > 30.0 (obese).
Physical activity levels over the previous 12 months were assessed by four categories: inactive (light activities such as reading and watching television); moderately active (walking, gardening or other activities ≥ 4 h/week); active (running, swimming or other physically demanding activities ≥ 3 h/week); or very active (competition or other heavy sports several times/week). The categories “active” and “very active” were combined for the present study as only a few participants were classified as “very active.”
Chronotype was assessed using self-evaluation questions with four available options: “definitely a morning type,” “rather more a morning than an evening type,” “rather more an evening than a morning type” and “definitely an evening type.” Participant’s response was further categorized into morning type, intermediate type (combining “rather more a morning than an evening type” and “rather more an evening than a morning type,” and evening type during analysis).
Education levels were expressed as basic (elementary/basic/lower secondary education), intermediate (vocational/upper secondary/high school/non-university lower education), or higher (college/university education). Working status was categorized as employed (paid job/self-employed/unpaid employment in a family-owned business, apprenticeship, and paid internship), or outside of work (unemployed/student/unpaid internship/retired/on family leave/stay-at-home mother/father).
Household income was grouped based on annual income before tax reduction as low (lowest through 35,000 €), middle (35,001 to 60,000 €), or high (60,001 € and higher). Participants in married/cohabitated/registered partnership were grouped as living together, whereas those who were single/separated/divorced/widowed were grouped as living alone.
Descriptive statistics were calculated, and FV consumption compared between sleep categories using analyses of covariance, followed by the Bonferroni multiple comparisons post-hoc test with adjustments for age, gender and energy intake were made where relevant.
Linear regression analysis was employed to explore the potential influence of sleep duration on FV consumption, employing three models with increasing levels of covariate adjustment. Model 1 adjusted for basic covariates such as age, gender and total energy intake. Model 2 further adjusted for an expanded set of covariates, including BMI, education, employment, marital status, household income, the number of household members, the number of living children, smoking, and alcohol intake. Model 3 included all the covariates from Model 2, along with chronotype as an additional covariate.
Binary logistic regression analysis was undertaken to explore the potential influence of FV consumption across different sleep categories: short sleep vs. normal sleep, and long sleep vs. normal sleep, adjusting for the same set of covariates used in the linear regression analysis. To estimate the magnitude of differences between normal sleepers and short or long sleepers, effect sizes were calculated using Cohen’s d and the effect-size correlation rYλ.
A sensitivity analysis was conducted by repeating both the linear and logistic regression analyses after excluding participants identified as energy under-reporters. Energy misreporting was assessed by calculating the ratio of reported energy intake to predicted Basal Metabolic Rate (BMR). Participants with an energy intake to BMR ratio (EI:BMR) of 1.14 or less were considered under-reporters and were excluded from this secondary analysis (39).
All statistical analyses were performed using the IBM Statistical Package for Social Sciences (SPSS) Statistics, Version 28 (International Business Machines Corporation, Armonk, NY, United States).
Table 1 depicts the distribution of the study population across different sleep duration categories. Of the 5,043 participants, 21% were short sleepers, 76.1% were normal sleepers, and the remaining 2.9% were long sleepers. The mean sleep duration for short sleepers was 6.0 h (SD = 0.6), for normal sleepers 7.7 h (SD = 0.6), and for long sleepers 10.1 h (SD = 0.7). The majority of the participants identified themselves as intermediate types (61.7%), while 22.4% identified as morning types and 15.9% as evening types. The mean age of the participants was 55 years (SD = 16.0), with 55.9% being female, and 71.2% being in marital, cohabiting, or registered relationships. The education levels showed diversity: 19.2% held basic education, 49.3% intermediate, and 31.5% higher education. Regarding employment, half of the participants were employed, and the other half were not part of the workforce. The participants’ income levels varied, with 36.4% falling within the low-income bracket, 32.0% within middle income, and 312.6% within higher income bracket. Household configurations displayed variety, with 71.6% having 1–2 members, 26.8% having 3–5 members, and 1.7% exceeding 5 members. In terms of children in the household, 22.5% had none, 69.2% had 1–3 children, and 8.3% had more than 3 children. Regarding substance use, 17.1% smoked daily, and 20.9% consumed alcohol at a risk level. Notably, nearly half of the participants were overweight (40.4%) or obese (25.1%). Physical activity levels varied, with 46.9% of participants reporting a moderately active level followed by 29.0% who were active and 24.1% who were inactive.
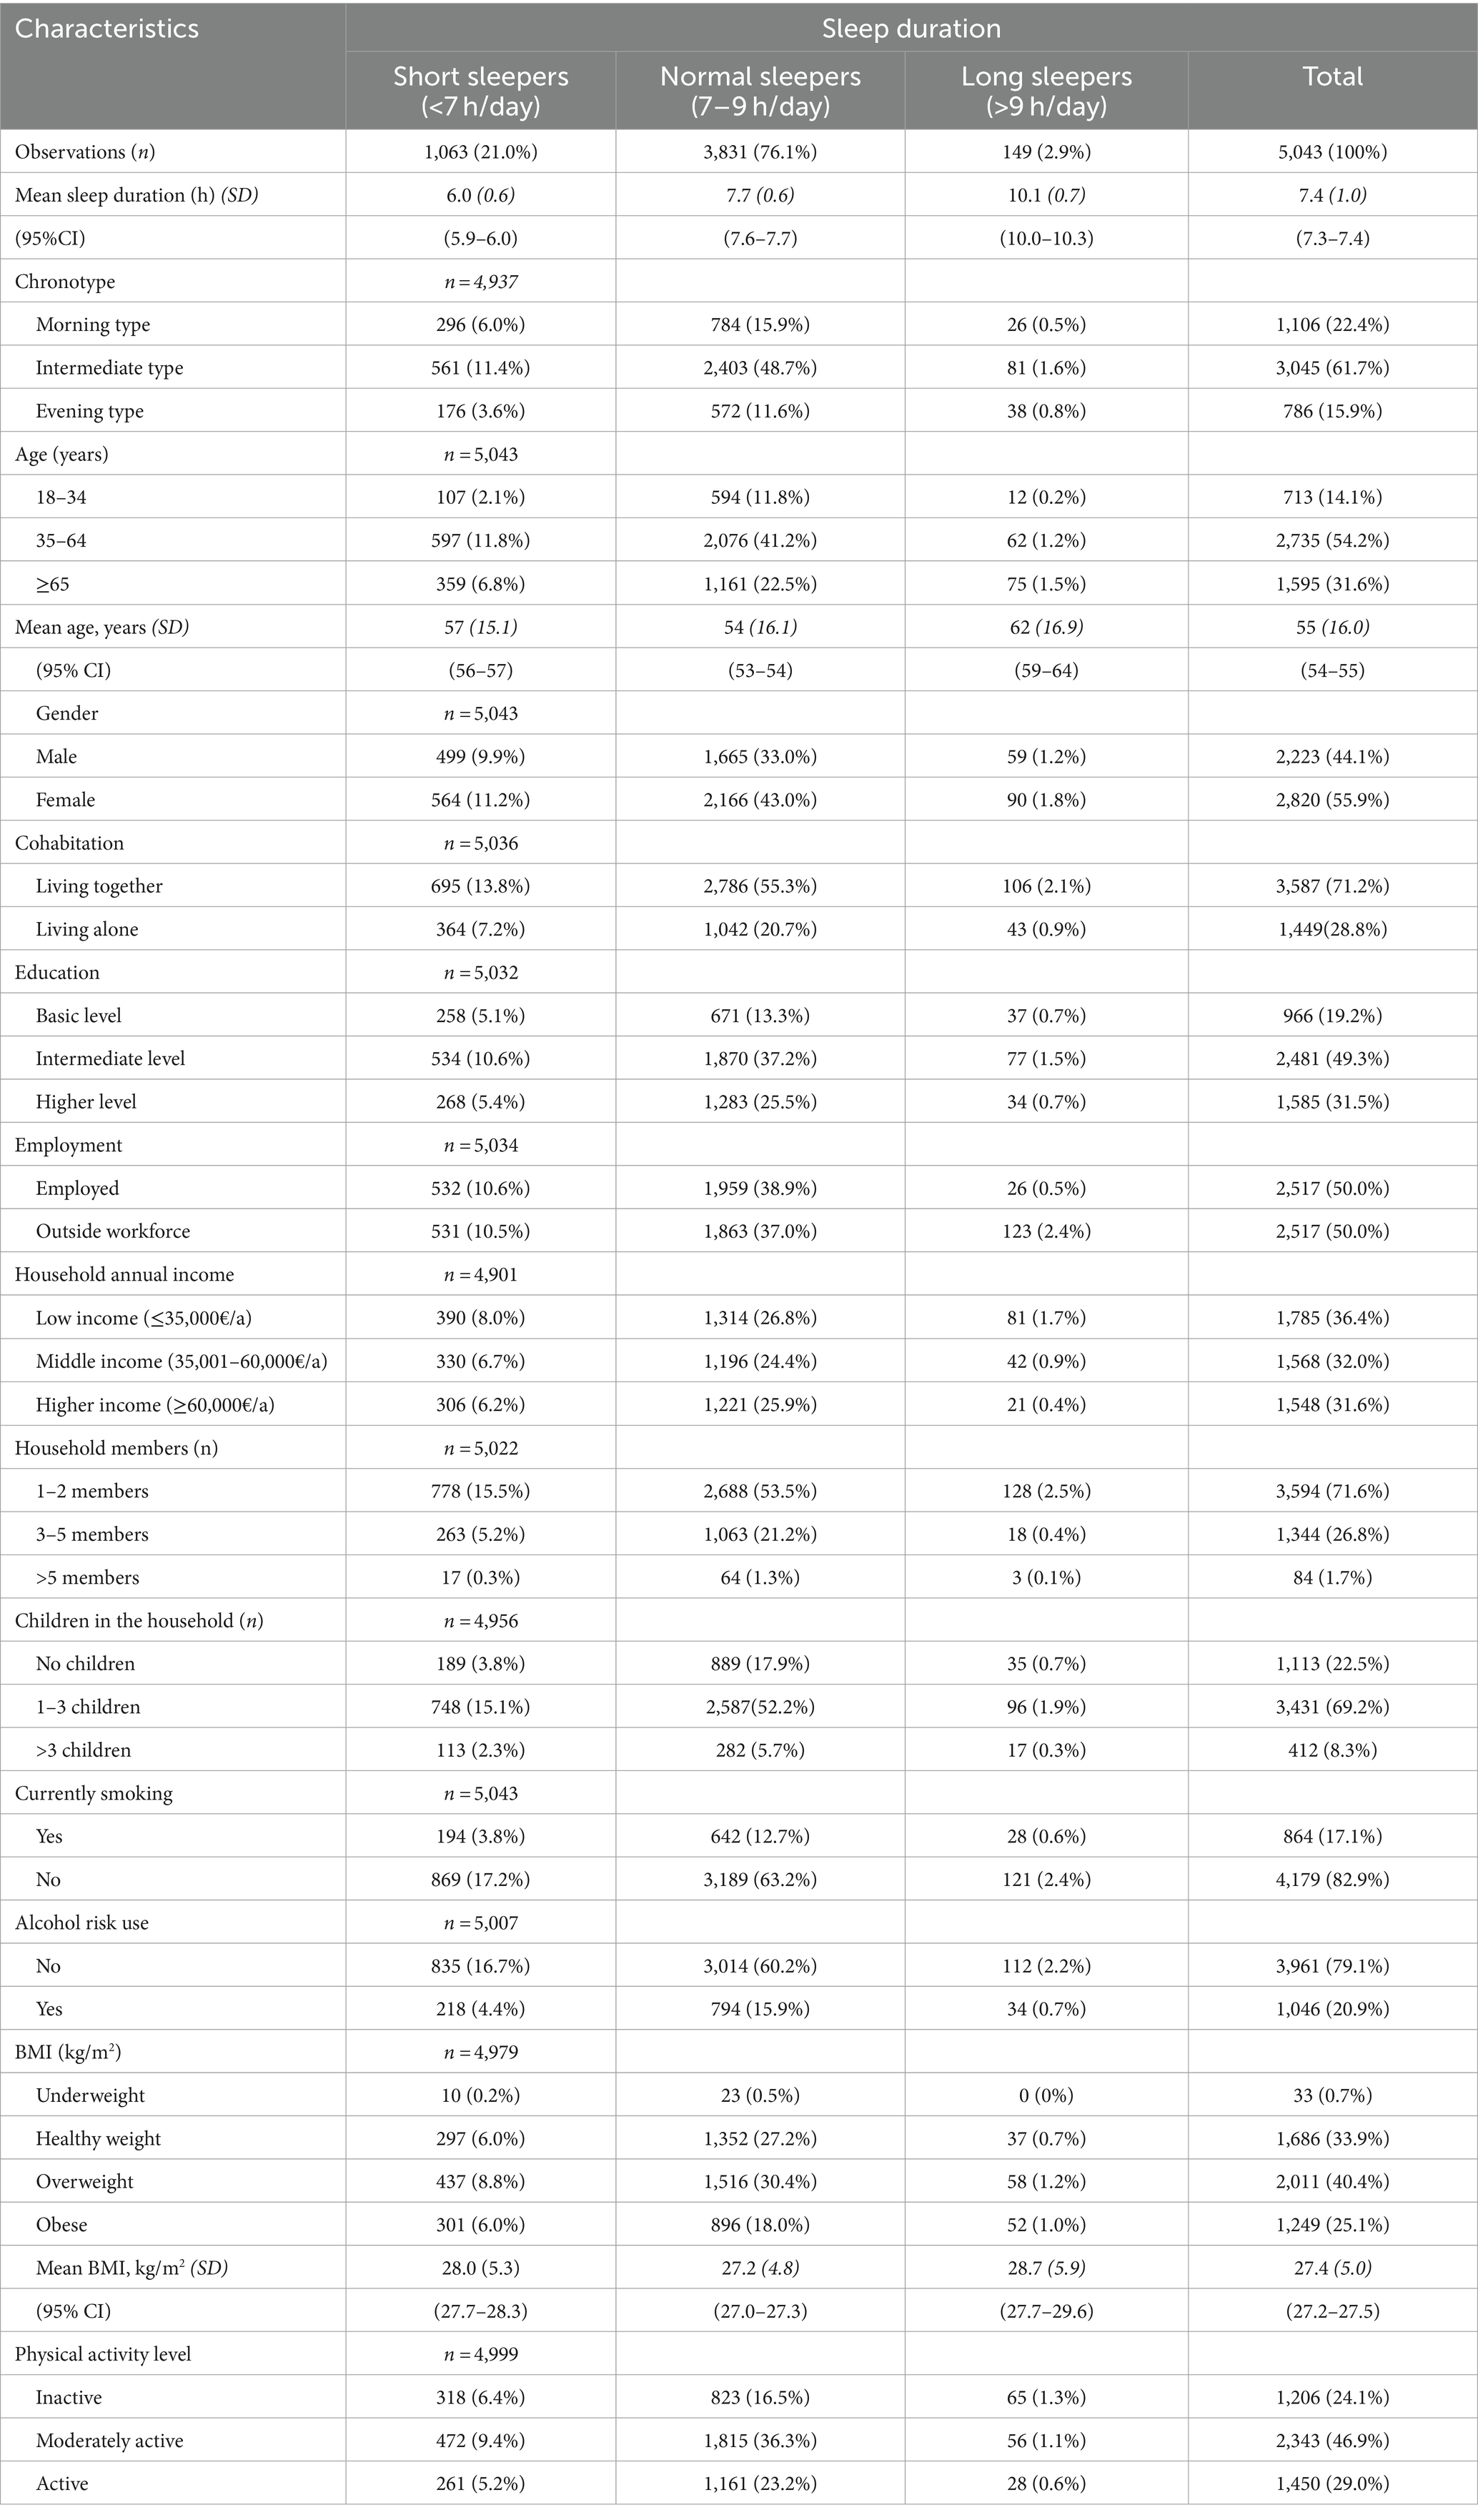
Table 1. Study population by sleep categories.
Table 2 displays the mean differences in the consumption of various FV across different sleep duration categories. It was observed that normal sleepers had higher consumption of FV including all sub-groups when compared to both short and long sleepers. These differences were statistically significant after adjusting for covariates including age, gender, and energy intake with significance maintained at the 0.05 level following Bonferroni correction for multiple comparisons.
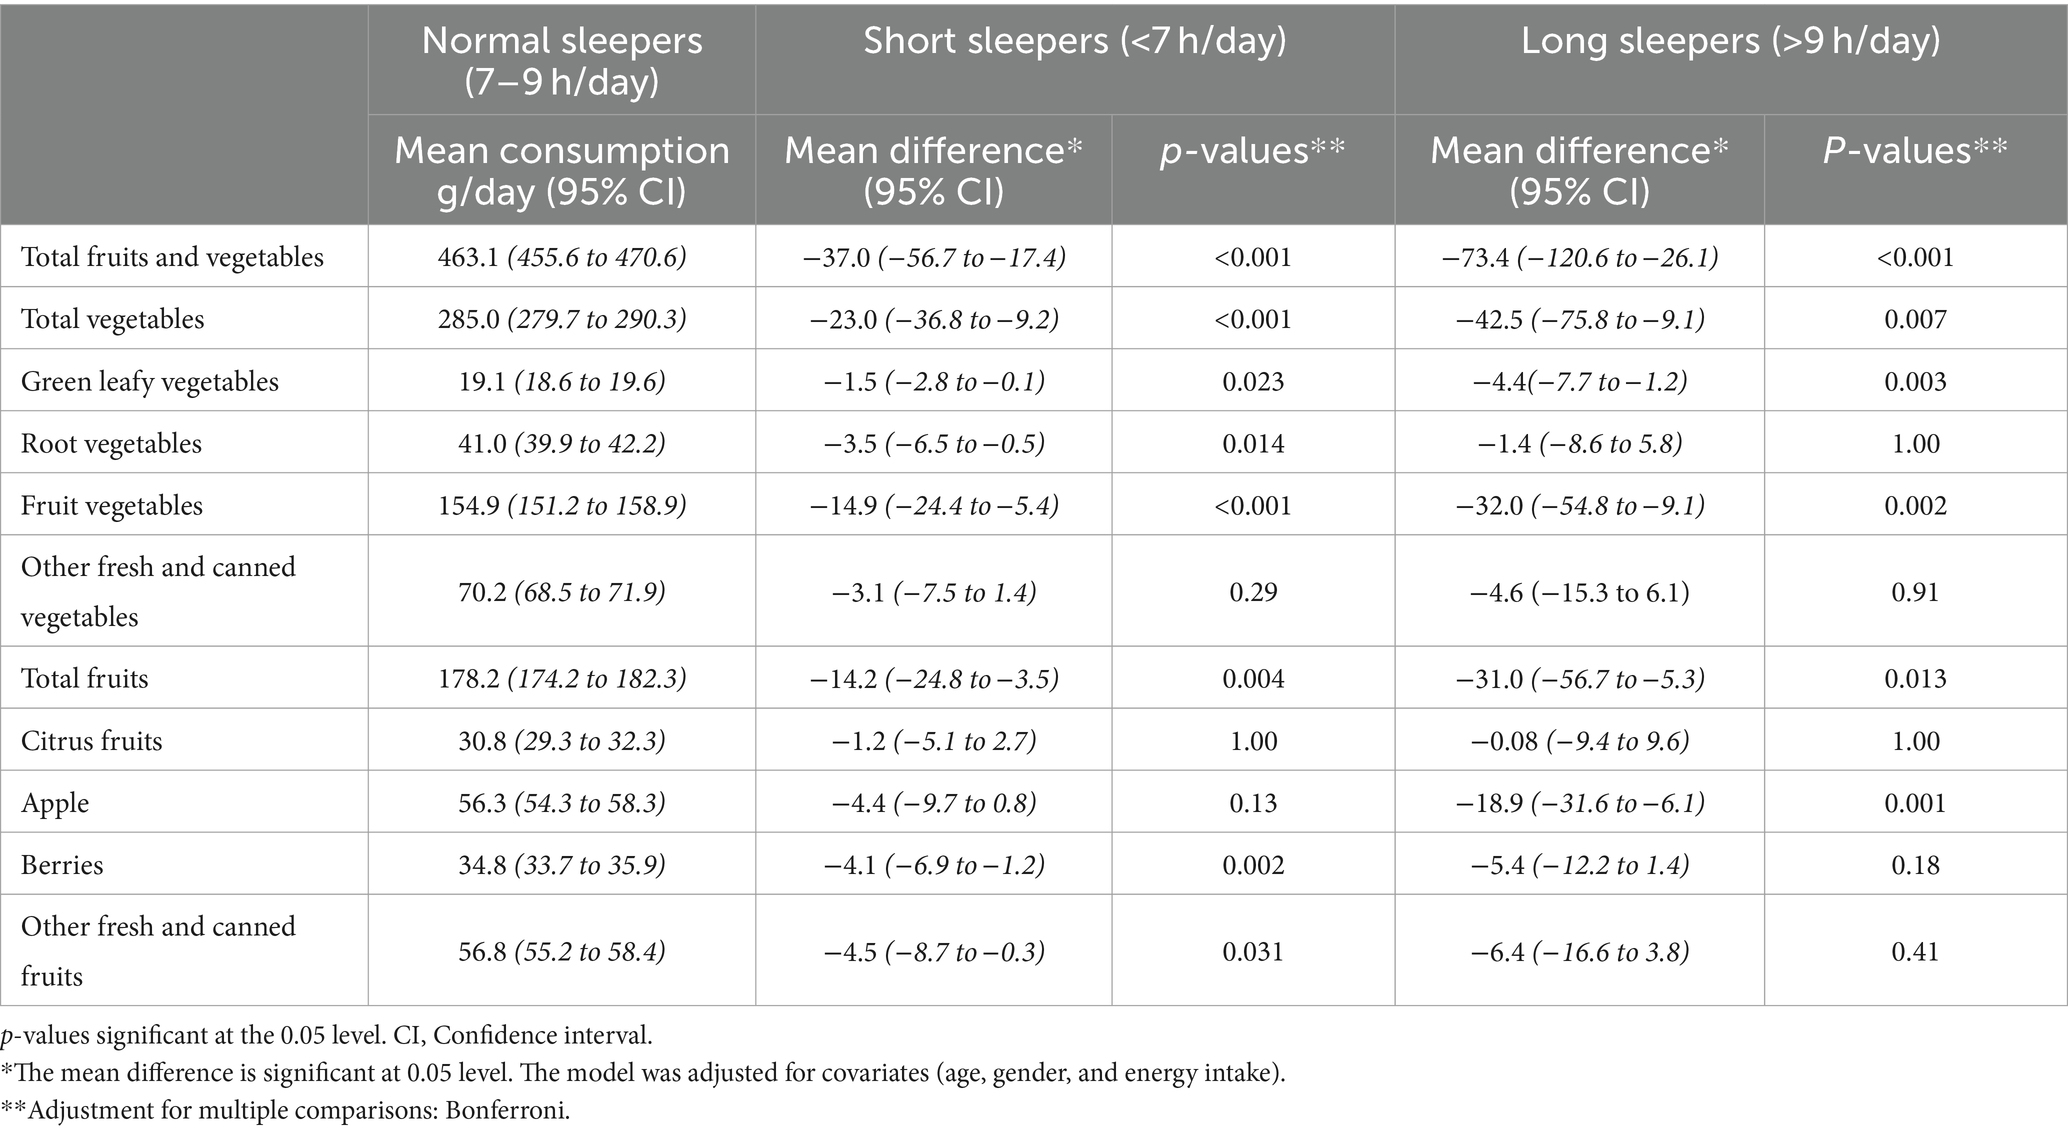
Table 2. Mean difference in consumption of fruits and vegetables across sleep duration categories.
Effect sizes measured by Cohen’s d, were small but notable. For normal vs. short sleepers, Cohen’s d was 0.16 and for normal vs. long sleepers, it was 0.21. Corresponding effect-size correlations were 0.08 and 0.10, respectively, suggesting a small yet positive association between sleep duration and FVs consumption.
In the vegetable sub-group, significant differences were observed in the consumption of green leafy vegetables, root vegetables and fruit vegetables (e.g., tomatoes, cucumbers), between normal and short sleepers. Similarly, for normal vs. long sleepers, significant differences were again noted for green leafy vegetables and fruit vegetables. However, other fresh and canned vegetables such as cabbage, mushroom, onion, peas and beans did not exhibit significant differences.
In the fruit sub-groups, a significant mean difference was observed in the consumption of berries and other fresh and canned fruits between normal and short sleepers. Conversely, for normal vs. long sleepers, the only significant difference was observed in apple consumption.
Table 3 presents the results of linear regression analyses exploring the association between sleep duration and TFVC, along with its sub-groups. Initially, the association between sleep duration and TFVC was observed to be positive across all models, though it did not reach statistical significance. This trend persisted even with the inclusion of additional covariates with slight decrease in the strength of the association in Models 2 and 3, which did not significantly impact the associations.
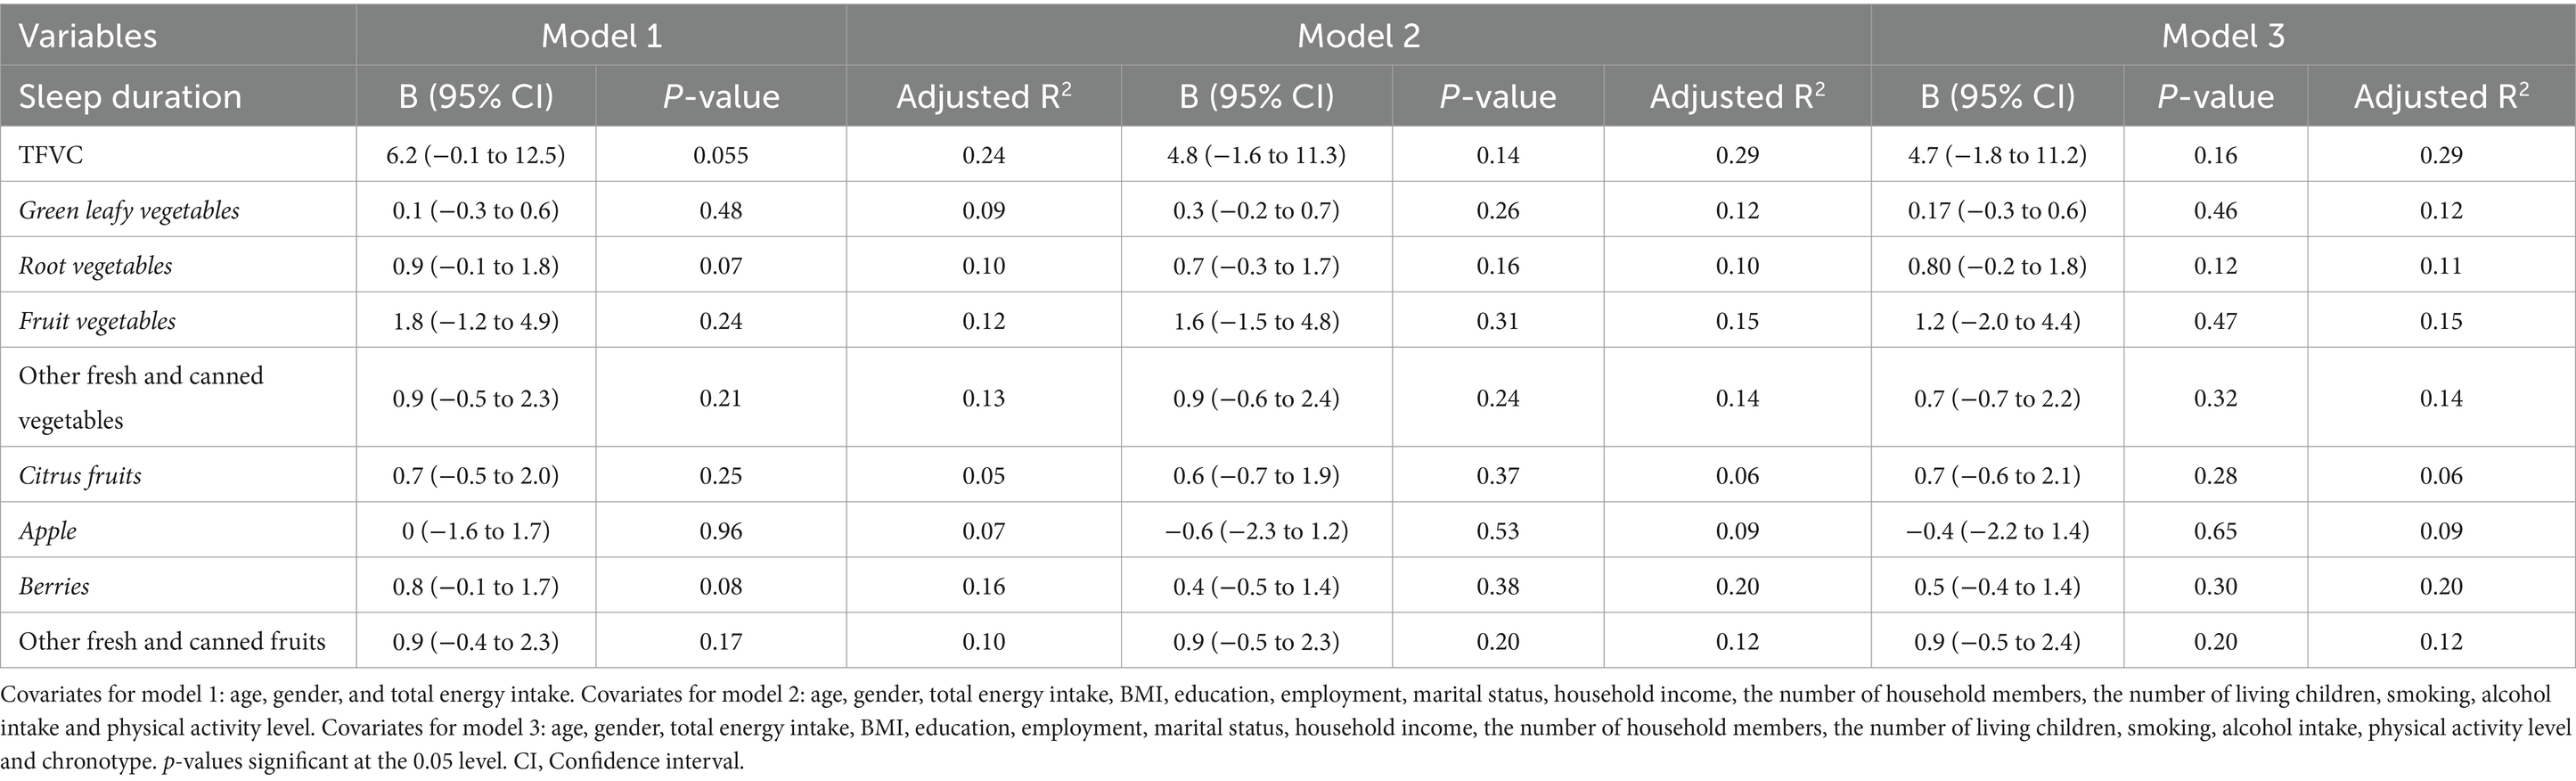
Table 3. Association between sleep duration and FV consumption.
However, when a sensitivity analysis was conducted by excluding energy under reporters (n = 1,926)-the association between sleep duration and TFVC in Model 1 became statistically significant (B = 11.9, 95% CI [2.6, 21.3], p = 0.012), indicating a stronger relationship after removing potential bias from underreporting. Although this significance was nearly reached in Models 2 and 3 (p = 0.06), the proximity to significance suggests that energy underreporting might be attenuating the true magnitude of the observed relationships.
In the subgroup analysis, the pattern was somewhat similar, with certain food groups such as root vegetables and other fresh and canned vegetables showing a significant increase in the strength of association in the sensitivity analysis compared to the full cohort. For instance, root vegetables showed a significant association with sleep duration in Model 1 after excluding underreporters (B = 1.6, p = 0.029). The association for other fresh and canned vegetables also became significant (B = 2.6, p = 0.015 in Model 1) in the sensitivity analysis.
Conversely, no significant associations were observed for green leafy vegetables, fruit vegetables, citrus fruits, apples, berries, and other fresh and canned fruits after excluding energy underreporters, similar to the original analysis.
Table 4 presents the outcomes of binary logistic regression models that examined how the consumption of various fruits and vegetables is associated with the likelihood of short or long sleep durations, using normal sleep as the reference category.
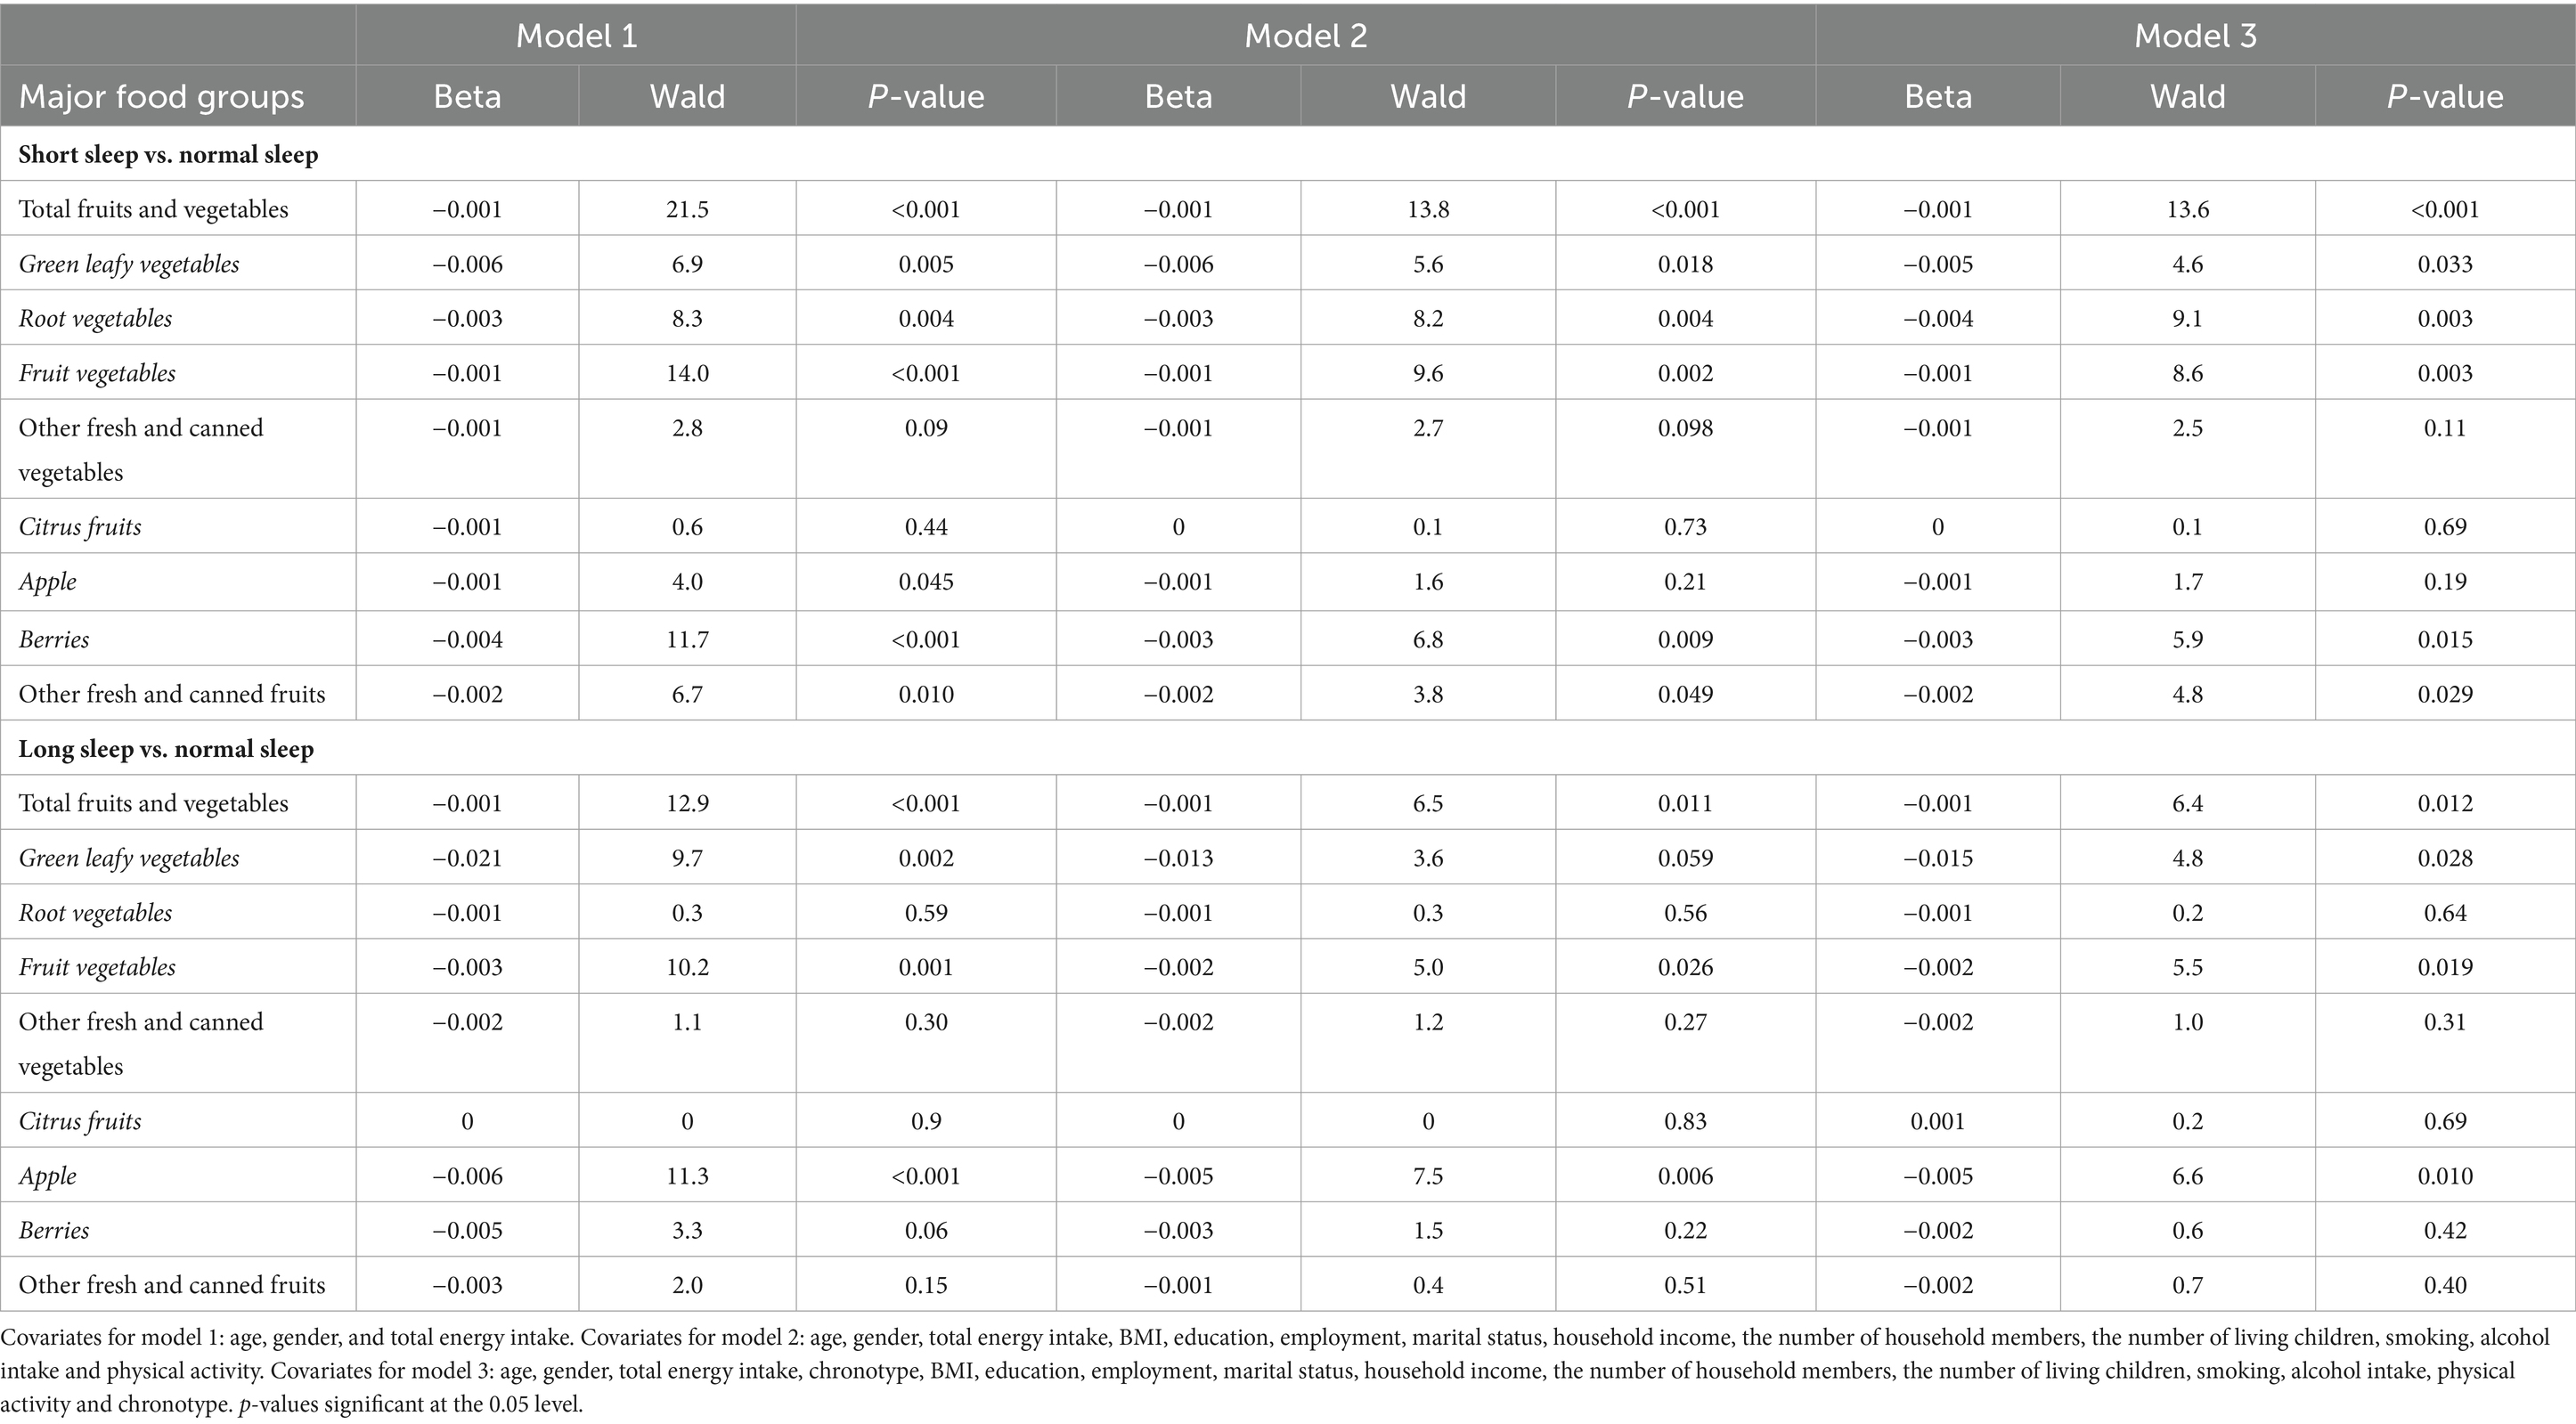
Table 4. Association between FV consumption and sleep duration categories.
For individuals with short sleep duration, a consistent negative association with TFVC was observed across all models. This pattern suggests that short sleepers tend to consume fewer FV compared to those with normal sleep duration (p < 0.001). A similar negative trend was observed for specific sub-groups such as green leafy vegetables, root vegetables, fruit vegetables, and berries, though the strength and significance of association varied across the models. Conversely, no significant associations were found for the consumption of other fresh and canned vegetables and citrus fruits (p > 0.05), except for apple consumption, which showed a negative association with short sleep only in Model 1.
Among long sleepers, similar negative associations were reported with TFVC that were significant in Models 1 and 3. The consumption of green leafy vegetables showed a notable reduction in model 1, and TFVC showed a consistent negative association across all models. However, no significant associations were found for root vegetables, other fresh and canned vegetables, and citrus fruits in any models. The relationship with apple consumption remained significantly negative across all models for long sleepers, while the associations for berries and other fresh and canned fruits did not maintain significance in Models 2 and 3.
Unlike linear regression, in the sensitivity analysis, the logistic regression revealed a persistent negative association between short sleep duration and total fruit and vegetable consumption (Beta = −0.001, p < 0.001 across all models), indicating that the findings were stable even when potentially biased self-reported energy intake was accounted for. Similarly, the negative associations for specific sub-groups such as green leafy vegetables, root vegetables, and fruit vegetables remained significant, with minor variations in Beta coefficients and Wald statistics. For long sleepers, the sensitivity analysis generally showed a slight decrease in the strength of associations, yet the negative trend in total fruit and vegetable consumption remained significant in Models 1 and 3, with similar patterns observed for specific sub-groups. This sensitivity analysis result confirms the validity of our original findings, suggesting that the associations between TFVC and sleep duration are not substantially altered when controlling for energy underreporting. The detailed outcomes of the sensitivity analysis are presented in Supplementary Table 2.
Overall, the results indicate that both short and long sleep durations were associated with a decrease in the consumption of certain fruits and vegetables when compared to normal sleep durations.
This study examined the associations between FV consumption and sleep duration in a population-based cohort of Finnish adults, revealing a significant association between sleep duration and FV consumption. This included various sub-groups such as green leaf, root and fruit vegetables. Our findings are in line with existing literature, which consistently demonstrates reduced FV consumption among individuals with either inadequate or excessive sleep durations (27, 29, 30, 32, 33, 45). A closely related study by Noorwali et al. (31), focused on similar exposure and outcome variables in UK adults aged 19–65. Both studies categorized sleep duration into short, normal, and long sleepers, enabling direct comparisons. However, distinctions in dietary assessment methods exist. Noorwali et al. using a 4-day food diary validated with biomarkers, while our study employed a 12-month FFQ, assessing habitual diet and providing insights into long-term dietary patterns. Despite these methodological differences, both studies consistently reported reduced FV consumption among individuals with inadequate or excessive sleep durations.
One possible explanation for the observed negative association between short and long sleepers and FV consumption, as supported by previous studies, is that individuals with normal sleep durations are more likely to adopt healthy lifestyles. These lifestyles are often characterized by high FV consumption, regular physical activity, and better quality of life (46). Hormonal mechanisms might also play a role. Certain FVs such as cherries, kiwi, tomatoes, and cucumbers contain high levels of melatonin, a hormone vital for regulating circadian rhythms and sleep patterns (47). The significant associations we observed between sleep duration and specific FV sub-groups, such as root, fruit, and green leafy vegetables, further support these notions.
Moreover, fruits and vegetables serve as abundant sources of a variety of micronutrients and non-nutrient bioactive compounds, including vitamins, phytochemicals like (poly) phenolic compounds and carotenoids, vital minerals such as potassium, calcium, and magnesium, and dietary fiber. Their impact on human health is significant, attributed to their medicinal properties such as anti-inflammatory, antimicrobial, antioxidant, anticancer, and their preventive effects against various chronic diseases (48). It is plausible to suggest that the broader spectrum of health-promoting properties inherent in various fruits and vegetables, as outlined by their bioactive components, may have influenced the observed associations between sleep duration and specific FV-subgroups.
In our analysis, we observed that including a comprehensive set of covariates, did not significantly change the observed association between sleep duration and FV consumption. This suggests that the relationship between sleep duration and FV consumption is robust and remains consistent across different models. In our study, we expanded beyond the conventional covariates, such as age, gender, BMI, physical activity level and socioeconomic status, by incorporating chronotype as a covariate in Model 3. This addition did not significantly alter the associations, indicating that these dietary behaviors are associated with sleep duration independently of the chronotype. The inclusion of chronotype as a covariate was informed by emerging research indicating its influence on dietary patterns. Studies have shown that evening chronotypes are often associated with unhealthy dietary behaviors, including a propensity for obesity-related eating habits (34, 49, 50). However, our findings suggest that while chronotype may play a role in general dietary preferences and behaviors, its impact on the specific relationship between sleep duration and FV consumption is minimal. This is evident from the consistency of the association between sleep duration and various types of FV consumption, as indicated by the similar B values and p-values observed across Models 2 and 3 in both linear and logistic regression analyses.
Furthermore, we examined the likelihood of individuals falling into specific sleep duration categories based on their dietary habits, providing insights into the predictive value of sleep patterns for FV consumption. Our finding highlights that sleep duration categories can serve as predictive factors for FV consumption, albeit with relatively small effect sizes. A similar finding was observed in another study, which reported that shorter sleep duration at night was associated with lower FV consumption the following day (33). This reinforces the idea that sleep patterns may have relevance in understanding dietary choices, as well as in formulating dietary interventions. Additional research including longitudinal studies is essential to understand these complex relationship and to ascertain its implications on public health and lifestyle intervention.
A notable strength of our study is the utilization of a large, randomly selected population-based sample, which enhances the statistical power and potential generalizability of our findings. Nonetheless, it is important to acknowledge certain limitations. One key aspect is our approach to managing missing data. We employed listwise deletion based on the assumption, supported by Little’s MCAR test (Chi-Square = 1.400, df = 2, p = 0.497) that the data was missing completely at random (MCAR). However, the potential for non-random missingness cannot be entirely ruled out. While listwise deletion is a valid approach under the MCAR condition, the potential for non-random missingness remains, and if the missing data are not MCAR, it could introduce bias and affect the generalizability of our results.
Furthermore, the reliance on self-reported data for sleep duration and food consumption may introduce recall and reporting biases such as under-or over-reporting. To address this issue, our statistical analyses included adjustments for factors like age, gender, and total energy intake. These adjustments, particularly for energy intake, help to some extent in mitigating biases related to dietary reporting. However, it is important to note that such adjustments cannot fully eliminate the inherent limitations of self-reported dietary data. Additionally, the Finnish Food Frequency Questionnaire (FFQ), though widely validated and ensuring comprehensive coverage, presents inherent limitations. Its length, comprising 134-items, may result in participant fatigue and consequent reporting errors influenced by participant characteristics.
These limitations, combined with the cross-sectional nature of our study, imply that we can identify associations, but causality cannot be inferred.
In summary, this study highlights a significant link between sleep duration and FV consumption among adults. The associations persisted across most FV subgroups, even after conducting sensitivity analysis, suggesting a strong and consistent relationship. While the findings indicate modest effect sizes, they carry substantial statistical and practical implications. Targeted interventions focusing on FV sub-groups with pronounced associations, such as green leafy vegetables and fruit vegetables can lead to impactful behavior change. Additional research, particularly longitudinal studies, is needed to better understand these associations and their public health implications, especially in regions with similar population structures and dietary patterns to Finland.
The data analyzed in this study is subject to the following licenses/restrictions: this study used data from National FinHealth Study conducted by THL Finland. Data can be made available from THL upon reasonable request. Requests to access these datasets should be directed to YWRtaW4uYmlvYmFua0B0aGwuZmk=.
The studies involving humans were approved by THL Ethics Committee ZWV0dGluZW50b2ltaWt1bnRhQHRobC5maQ==. The studies were conducted in accordance with the local legislation and institutional requirements. The participants provided their written informed consent to participate in this study.
AT: Conceptualization, Data curation, Formal analysis, Investigation, Methodology, Software, Visualization, Writing – original draft, Writing – review & editing. TL: Conceptualization, Supervision, Writing – review & editing. MM: Methodology, Validation, Writing – review & editing. TP: Conceptualization, Methodology, Resources, Supervision, Writing – review & editing.
The author(s) declare financial support was received for the research, authorship, and/or publication of this article. Open access publication was funded by Helsinki University Library.
The authors declare that the research was conducted in the absence of any commercial or financial relationships that could be construed as a potential conflict of interest.
All claims expressed in this article are solely those of the authors and do not necessarily represent those of their affiliated organizations, or those of the publisher, the editors and the reviewers. Any product that may be evaluated in this article, or claim that may be made by its manufacturer, is not guaranteed or endorsed by the publisher.
The Supplementary material for this article can be found online at: https://www.frontiersin.org/articles/10.3389/fnut.2024.1319821/full#supplementary-material
1. Colten, HR, and Altevogt, BM. Sleep Disorders and Sleep Deprivation: An Unmet Public Health Problem. Washington (DC): National Academies Press (2006).
2. Watson, NF, Badr, MS, Belenky, G, Bliwise, DL, Buxton, OM, Buysse, D, et al. Recommended amount of sleep for a healthy adult: a joint consensus statement of the American Academy of sleep medicine and Sleep Research Society. Sleep. (2015) 38:843–4. doi: 10.5665/sleep.4716
3. World Health Organization . WHO Technical Meeting on Sleep and Health; (2004). Available at: https://www.euro.who.int/__data/assets/pdf_file/0008/114101/E84683.pdf.
4. Altun, I, Cinar, N, and Dede, C. The contributing factors to poor sleep experiences in according to the university students: a cross-sectional study. J Res Med Sci. (2012) 17:557–61.
5. Shochat, T . Impact of lifestyle and technology developments on sleep. Nat Sci Sleep. (2012) 4:19–31. doi: 10.2147/NSS.S18891
6. Hublin, C, Haasio, L, and Kaprio, J. Changes in self-reported sleep duration with age – a 36-year longitudinal study of Finnish adults. BMC Public Health. (2020) 20:4–11. doi: 10.1186/s12889-020-09376-z
7. Kronholm, E, Partonen, T, Härmä, M, Hublin, C, Lallukka, T, Peltonen, M, et al. Prevalence of insomnia-related symptoms continues to increase in the Finnish working-age population. J Sleep Res. (2016) 25:454–7. doi: 10.1111/jsr.12398
8. Sabanayagam, C, and Shankar, A. Sleep duration and cardiovascular disease: results from the National Health Interview Survey. Sleep. (2010) 33:1037–42. doi: 10.1093/sleep/33.8.1037
9. Ma, Y, Liang, L, Zheng, F, Shi, L, Zhong, B, and Xie, W. Association between sleep duration and cognitive decline. JAMA Netw Open. (2020) 3:e2013573. doi: 10.1001/jamanetworkopen.2020.13573
10. Yin, J, Jin, X, Shan, Z, Li, S, Huang, H, Li, P, et al. Relationship of sleep duration with all-cause mortality and cardiovascular events: a systematic review and dose-response meta-analysis of prospective cohort studies. J Am Heart Assoc. (2017) 6:5947. doi: 10.1161/JAHA.117.005947
11. Meier, T, Gräfe, K, Senn, F, Sur, P, Stangl, GI, Dawczynski, C, et al. Cardiovascular mortality attributable to dietary risk factors in 51 countries in the WHO European region from 1990 to 2016: a systematic analysis of the global burden of disease study. Eur J Epidemiol. (2019) 34:37–55. doi: 10.1007/s10654-018-0473-x
12. Locally Driven Collaborative Project (LDCP) Healthy Eating Team . A call to action for healthy eating: using a food literacy framework for public health program planning, policy, and evaluation. Ontario Dietitians in Public Health. (2018). Available at: https://www.odph.ca/upload/membership/document/2018-11/food-lit-call-to-action-booklet-sept-final.pdf
13. Vidgen, HA, and Gallegos, D. Defining food literacy and its components. Appetite. (2014) 76:50–9. doi: 10.1016/j.appet.2014.01.010
14. West, EG, Lindberg, R, Ball, K, and McNaughton, SA. The role of a food literacy intervention in promoting food security and food literacy—ozharvest’s nest program. Nutrients. (2020) 12:1–24. doi: 10.3390/nu12082197
15. Jabs, J, and Devine, CM. Time scarcity and food choices: an overview. Appetite. (2006) 47:196–204. doi: 10.1016/j.appet.2006.02.014
16. Kern, DM, Auchincloss, AH, Stehr, MF, Roux, AVD, Moore, LV, Kanter, GP, et al. Neighborhood prices of healthier and unhealthier foods and associations with diet quality: evidence from the multi-ethnic study of atherosclerosis. Int J Environ Res Public Health. (2017) 14:1–14. doi: 10.3390/ijerph14111394
17. World Health Organization . Diet, nutrition and the prevention of chronic diseases. Report of a Joint WHO/FAO Expert Consultation. WHO Technical Report Series 916. Geneva: WHO. (2003). Available: https://iris.who.int/bitstream/handle/10665/42665/WHO_TRS_916.pdf
18. He, FJ, Nowson, CA, Lucas, M, and MacGregor, GA. Increased consumption of fruit and vegetables is related to a reduced risk of coronary heart disease: Meta-analysis of cohort studies. J Hum Hypertens. (2007) 21:717–28. doi: 10.1038/sj.jhh.1002212
19. Woodside, JV, Young, IS, and McKinley, MC. Fruits and vegetables: measuring intake and encouraging increased consumption. Proc Nutr Soc. (2013) 72:236–45. doi: 10.1017/S0029665112003059
20. Helsedirektoratet . Nordic nutrition recommendations 2022. (2022). Available at: https://www.helsedirektoratet.no/english/nordic-nutrition-recommendations-2022 (Accessed 04 June 2023)
21. Diethelm, K, Jankovic, N, Moreno, LA, Huybrechts, I, de Henauw, S, de Vriendt, T, et al. Food intake of European adolescents in the light of different food-based dietary guidelines: results of the HELENA (healthy lifestyle in Europe by nutrition in adolescence) study. Public Health Nutr. (2012) 15:386–98. doi: 10.1017/S1368980011001935
22. Kim, SY, Freeland-Graves, JH, and Kim, HJ. Twenty year trends in vegetable consumption by preparation method and eating location for Korean population from 1998 to 2017. Br J Nutr. (2020) 126:747–56. doi: 10.1017/S0007114520004511
23. Lynch, C, Kristjansdottir, AG, te Velde, SJ, Lien, N, Roos, E, Thorsdottir, I, et al. Fruit and vegetable consumption in a sample of 11-year-old children in ten European countries—the PRO GREENS cross-sectional survey. Public Health Nutr. (2013) 17:2436–44. doi: 10.1017/S1368980014001347
24. Yip, CSC, Yip, YC, and Chan, W. Time-trend analysis of fruit and vegetable intake in Hong Kong, 2004–2016. Public Health. (2019) 177:102–11. doi: 10.1016/j.puhe.2019.08.012
25. Valsta, L, Kaartinen, N, Tapanainen, H, Mannisto, S, and Sääksjärvi, K Ravitsemus Suomessa—FinRavinto 2017-tutkimus (nutrition in Finland—the national FinDiet 2017 survey). Finnish Institute for Health and Welfare (THL). Report 12/2018, 239 (2018).
26. Kaartinen, NE, Tapanainen, H, Männistö, S, Reinivuo, H, Virtanen, SM, Jousilahti, P, et al. Aikuisväestönruoankäytön ja ravintoaineiden saannin muutokset vuosina 1997-2017: kansallinenFinRavinto-tutkimus [Changes in food consumption and nutrient intake in Finnishadults 1997-2017: the National FinDiet Survey]. Finnish Med J. (2021) 76:273–280.
27. Börnhorst, C, Wijnhoven, TMA, Kunešová, M, Yngve, A, Rito, AI, Lissner, L, et al. WHO European childhood obesity surveillance initiative: associations between sleep duration, screen time and food consumption frequencies. BMC Public Health. (2015) 15:442. doi: 10.1186/s12889-015-1793-3
28. Francisca, V, Córdova, SB, and Pablo, E. Consequences of short sleep duration on the dietary intake in children: a systematic review and metanalysis. Sleep Med Rev. (2018) 42:68–84. doi: 10.1016/j.smrv.2018.05.006
29. Jansen, EC, Prather, A, and Leung, CW. Associations between sleep duration and dietary quality: results from a nationally-representative survey of US adults. Appetite. (2019) 153:104748. doi: 10.1016/j.appet.2020.104748
30. Jansen, EC, She, R, Rukstalis, M, and Alexander, GL. Changes in fruit and vegetable consumption in relation to changes in sleep characteristics over a 3-month period among young adults. Sleep Health. (2021) 7:345–52. doi: 10.1016/j.sleh.2021.02.005
31. Noorwali, EA, Hardie, LJ, and Cade, JE. Recommended sleep duration is associated with higher consumption of fruits and vegetables; cross-sectional and prospective analyses from the UK Women’s cohort study. Sleep Sci Pract. (2018b) 2:1–14. doi: 10.1186/s41606-018-0032-0
32. Pengpid, S, and Peltzer, K. Fruit and vegetable consumption is protective from short sleep and poor sleep quality among university students from 28 countries. Nat Sci Sleep. (2020) 12:627–33. doi: 10.2147/NSS.S263922
33. Winpenny, EM, Rowthorn, H, Hollidge, S, Westgate, K, Goodyer, IM, Brage, S, et al. Shorter sleep among adolescents is associated with lower fruit and vegetable consumption the following day. Int J Behav Nutr Phys Act. (2023) 20:12. doi: 10.1186/s12966-023-01420-6
34. Teixeira, GP, Guimarães, KC, Soares, AGNS, Marqueze, EC, Moreno, CRC, Mota, MC, et al. Role of chronotype in dietary intake, meal timing, and obesity: a systematic review. Nutr Rev. (2023) 81:75–90. doi: 10.1093/nutrit/nuac044
35. Vitale, JA, Roveda, E, Montaruli, A, Galasso, L, Weydahl, A, Caumo, A, et al. Chronotype influences activity circadian rhythm and sleep: differences in sleep quality between weekdays weekend. Chronobiol Int. (2015) 32:405415:405–15. doi: 10.3109/07420528.2014.986273
36. Mota, MC, Waterhouse, J, De-Souza, DA, Rossato, LT, Silva, CM, Araújo, MBJ, et al. Association between chronotype, food intake and physical activity in medical residents. Chronobiol Int. (2016) 33:730–9. doi: 10.3109/07420528.2016.1167711
37. Roepke, SE, and Duffy, JF. Differential impact of chronotype on weekday and weekend sleep timing and duration. Nat Sci Sleep. (2010) 2010:213–20. doi: 10.2147/NSS.S12572
38. Meltzer, HM, Brantsaeter, AL, Ydersbond, TA, Alexander, J, and Haugen, M. Methodological challenges when monitoring the diet of pregnant women in a large study: experiences from the Norwegian mother and child cohort study (MoBa). Matern Child Nutr. (2008) 4:14–27. doi: 10.1111/j.1740-8709.2007.00104.x
39. Goldberg, GR, Black, AE, Jebb, SA, Cole, TJ, Murgatroyd, PR, Coward, WA, et al. Critical evaluation of energy intake data using fundamental principles of energy physiology: 1. Derivation of cut-off limits to identify under-recording. Eur J Clin Nutr. (1991) 45:569–81.
40. Borodulin, K, and Sääksjärvi, K. FinHealth 2017 study-methods. The Finnish Institute of Health and Welfare (2019). Available at: http://urn.fi/URN:ISBN:978-952-343-449-3
41. Paalanen, L, Männistö, S, Virtanen, MJ, Knekt, P, Räsänen, L, Montonen, J, et al. Validity of a food frequency questionnaire varied by age and body mass index. J Clin Epidemiol. (2006) 59:994–1001. doi: 10.1016/j.jclinepi.2006.01.002
42. Kaartinen, NE, Tapanainen, H, Valsta, LM, Similä, ME, Reinivuo, H, Korhonen, T, et al. Relative validity of a FFQ in measuring carbohydrate fractions, dietary glycaemic index and load: exploring the effects of subject characteristics. Br J Nutr. (2012) 107:1367–75. doi: 10.1017/S0007114511004296
43. Männistö, S, Virtanen, M, Mikkonen, T, and Pietinen, P. Reproducibility and validity of a food frequency questionnaire in a case-control study on breast cancer. J Clin Epidemiol. (1996) 49:401–9. doi: 10.1016/0895-4356(95)00551-X
44. Reinivuo, H, Hirvonen, T, Ovaskainen, ML, Korhonen, T, and Valsta, LM. Dietary survey methodology of FINDIET 2007 with a risk assessment perspective. Public Health Nutr. (2010) 13:915–9. doi: 10.1017/S1368980010001096
45. Noorwali, EA, Cade, JE, Burley, VJ, and Hardie, LJ. The relationship between sleep duration and fruit/vegetable intakes in UK adults: a cross-sectional study from the National Diet and nutrition survey. BMJ Open. (2018a) 8:1–9. doi: 10.1136/bmjopen-2017-020810
46. Meng, X, Li, Y, Li, S, Zhou, Y, Gan, RY, Xu, DP, et al. Dietary sources and bioactivities of melatonin. Nutrients. (2017) 9:1–64. doi: 10.3390/nu9040367
47. Jyväkorpi, SK, Urtamo, A, Kivimäki, M, and Strandberg, TE. Associations of sleep quality, quantity and nutrition in oldest-old men the Helsinki businessmen study (HBS). Eur Geriatr Med. (2021) 12:117–22. doi: 10.1007/s41999-020-00421-z
48. Karasawa, MMG, and Mohan, C. Fruits as prospective reserves of bioactive compounds: a review. Nat Prod Bioprospect. (2018) 8:335–46. doi: 10.1007/s13659-018-0186-6
49. Maukonen, M, Kanerva, N, Partonen, T, Kronholm, E, Tapanainen, H, Kontto, J, et al. Chronotype diffences in timing of energy and macronutrieint intakes: a population-based study in adults. Obes Soc. (2017) 25:608–15. doi: 10.1002/oby.21747
Keywords: fruits and vegetable consumption, sleep duration, chronotype, dietary habits, public health nutrition
Citation: Thapa A, Lahti T, Maukonen M and Partonen T (2024) Consumption of fruits and vegetables and its association with sleep duration among Finnish adult population: a nationwide cross-sectional study. Front. Nutr. 11:1319821. doi: 10.3389/fnut.2024.1319821
Edited by:
Prachi Singh, Pennington Biomedical Research Institute, United StatesReviewed by:
Salma Batool-Anwar, Harvard Medical School, United StatesCopyright © 2024 Thapa, Lahti, Maukonen and Partonen. This is an open-access article distributed under the terms of the Creative Commons Attribution License (CC BY). The use, distribution or reproduction in other forums is permitted, provided the original author(s) and the copyright owner(s) are credited and that the original publication in this journal is cited, in accordance with accepted academic practice. No use, distribution or reproduction is permitted which does not comply with these terms.
*Correspondence: Anupa Thapa, YW51cGEudGhhcGFAaGVsc2lua2kuZmk=
Disclaimer: All claims expressed in this article are solely those of the authors and do not necessarily represent those of their affiliated organizations, or those of the publisher, the editors and the reviewers. Any product that may be evaluated in this article or claim that may be made by its manufacturer is not guaranteed or endorsed by the publisher.
Research integrity at Frontiers
Learn more about the work of our research integrity team to safeguard the quality of each article we publish.