 Abeer M. Aljaadi1*
 Abrar Turki2Arwa Z. Gazzaz3Faisal Saeed Al-Qahtani4Nora A. Althumiri5,6Nasser F. BinDhim5,6
- 1Department of Clinical Nutrition, Faculty of Applied Medical Sciences, Umm Al-Qura University, Mecca, Saudi Arabia
- 2Clinical Nutrition Department, College of Applied Medical Sciences, University of Hafr Al Batin, Hafar Al Batin, Saudi Arabia
- 3Department of Periodontics and Community Dentistry, College of Dentistry, King Saud University, Riyadh, Saudi Arabia
- 4Department of Family and Community Medicine, College of Medicine, King Khalid University, Abha, Saudi Arabia
- 5Sharik Association for Research and Studies, Riyadh, Saudi Arabia
- 6Informed Decision Making, Riyadh, Saudi Arabia
Introduction: The consumption of soft and energy drinks poses a significant risk for non-communicable diseases, such as diabetes and heart disease. Studies in Saudi Arabia have reported elevated consumption of soft/energy drinks, but nation-wide data is not available. Therefore, this study aims to explore the prevalence of soft and energy drinks consumption and its associated factors among a representative sample of Saudi adults.
Methods: The present research is a secondary data analysis of the 2021 Sharik Diet and Health National Survey (SDHNS). Current analysis used data on socio-demographics, anthropometrics, physical activity, and soft and energy drink consumption. The frequency of soft and energy drinks consumption is assessed on a weekly basis.
Results: Of the 5,194 Saudi adults, 3,928 were analyzed. Overall, 67% consumed soft drinks weekly, while 30% consumed energy drinks weekly. In multiple logistic regression, consumption of either soft drinks or energy drinks was associated with males, a younger age, lower income, and lower physical activity. Individuals with overweight or obesity were less likely to consume energy drinks [OR (95%CI): 0.83 (0.71, 0.99) and 0.73 (0.60, 0.90), respectively] than those with healthy weight. However, education level was not associated with either soft or energy drink consumption. These findings highlight the need for targeted interventions designed to reduce soft and energy drinks consumption in Saudi adults.
1 Introduction
Energy drinks, also referred to as power drinks, are liquid refreshments that typically incorporate a variety of ingredients, such as caffeine, sugar, amino acids like taurine, and other energizing substances such as guarana and ginseng (1). These beverages are often promoted because of their apparent advantages, including enhanced energy levels, sharpened mental focus, and improved physical capabilities (2, 3). Nevertheless, they can pose potential health hazards, particularly among youth (4–6).
Conversely, soft drinks are non-intoxicating beverages primarily composed of carbonated water, a sweetening agent, and either natural or synthetic flavorings (7). The sweetener can take various forms, including sugar, high-fructose corn syrup, fruit juice, or artificial sweeteners in the case of diet versions (8–10). Soft drinks can also contain caffeine, colorants, and preservatives, among other constituents. They are a subset of the broader group of sugar-enriched beverages, which have been linked to obesity and other health concerns when ingested in sizable volumes (11, 12).The intake of energy drinks and soft drinks has been progressively associated with adverse health outcomes, including obesity, dental diseases, and type 2 diabetes mellitus (6, 10, 13, 14). Energy drinks have been also associated with arrhythmias, including atrial fibrillation and supraventricular tachycardia, particularly among young consumers due to its high caffeine contents (15–17).
From a behavioristic viewpoint, numerous factors can impact the consumption of energy drinks and soft drinks. These factors encompass taste preferences, the perceived energy surge or mood elevation, influences from marketing and advertising, societal norms, and easy availability (18, 19). The sweet flavor of these beverages, often amplified by their high sugar content, can stimulate the brain’s reward system, promoting habitual consumption (20, 21). Energy drinks are frequently consumed due to their supposed benefits in boosting energy and alertness, appealing to individuals coping with intense work or academic stress, or those aiming to augment physical performance (22). Advertisements and marketing campaigns often depict these beverages as stylish, enjoyable, or vital for peak performance, thereby influencing consumer attitudes and actions. Moreover, the ubiquitous presence and societal acceptance of these drinks in different contexts (like social gatherings, workplaces, and vending machines) can encourage regular consumption (23).
The strategy of increasing taxes on energy drinks and soft drinks is a policy that has been implemented by Saudi Arabia in 2017 to curb overconsumption and alleviate related health implications (24, 25). This tactic is based on the principle that pricing significantly influences consumer habits (26). Preliminary studies indicate that such taxation increased prices and reduced purchasing, but whether this reduced consumption in Saudi Arabia remains unclear (25).
A number of factors contribute to the consumption of soft and energy drinks worldwide. For example, consumption of soft or energy drinks is commonly associated with males, young people, and people of lower socioeconomic status (26, 27). Moreover, individuals with higher BMI or physically inactive people are more likely to consume soft and energy drinks (28). Understanding these factors facilitates targeted interventions to reduce consumption and improve public health. Nonetheless, to date, national prevalence data regarding the consumption of soft and energy drinks among Saudis and their associated factors are lacking. We aim in this study to determine the consumption of soft and energy drinks among Saudi adults and investigate associated factors.
2 Materials and methods
2.1 Study design and sampling
This study is a secondary data analysis of the 2021 Sharik Diet and Health National Survey (SDHNS) (29). The SDHNS, an annual nationwide cross-sectional survey conducted in Saudi Arabia, employs phone interviews (29). For a balanced distribution of participants, the SDHNS uses a proportional quota sampling method, stratified by age, gender, and region across Saudi Arabia’s 13 administrative regions. The SDHNS integrates ZDataCloud®, a data collection tool that minimizes sampling bias without human interaction (30). The dataset used in this research was collected in 2021 encompassing n = 5,194 participants. A detailed methodology of the SDHNS is available in a separate document published by the Sharik Association for Research and Studies (29). Ethical approval was obtained from the ethics committee of Sharik Association for Research and Studies (Approval no.06–2021).
2.2 Measurements
The weekly consumption was measured based on the frequency of the consumption of soft and energy drinks in separate questions. Participants were asked “During the past week, how many times per week have you consumed soft drinks?” and “During the past week, how many times per week have you consumed energy drinks?.” Answers ranged from “none” to “seven times per week.” Participant answers were classified into two groups for the regression analyses: those who drunk any soft drink per week (“none” = 0) and at least once per week (“yes” = 1). Similar classification was used for energy drinks consumption question.
Sociodemographic information, including age, sex, education level, and monthly income, was provided by the SDHNS database. Level of income was measured by asking the participant about the monthly range of their income. The possible answers were: (1) I do not have stable monthly income, (2) less than SR 5000, (3) between SR 5,000 and SR 16,000, (4) more than SR 16,000. Those who answered “I do not have stable income” were excluded, n = 1,239 as we were interested in gradient relationship across income categories. Education was measured by asking the participant about the highest attainable degree.
BMI was calculated from self-reported height and weight. Weight status was classified as underweight (BMI <18.5 kg/m2), healthy (BMI: 18.5–24.9 kg/m2), overweight (25–29.9 kg/m2), and obesity (BMI ≥ 30 kg/ m2) (31). Extreme BMI values were excluded (<15 kg/m2 or ≥ 50 kg/ m2). The participants’ level of physical activity adhered to the World Health Organization’s (WHO) recommendations, which include engaging in moderate-intensity activity for at least 30 or 20 min of high-intensity activity in the past week (32). Subsequently, the activity level was categorized as: (1) none: when the participants did not engage in any type of physical activity, (2) less than recommended level: when the participants engage in some physical activity but did reach the recommended level and (3) follow recommended level: when the participants met the WHO recommendations (32).
2.3 Statistical analyses
Categorical variables are presented as frequencies (n) and percentages (%) across four levels of weekly consumption: never, 1–2 times, 3–4 times, and 5 times or more per week. Bivariate analyses were conducted using a chi- square test of association (proportions) to identify factors associated with weekly consumers versus non-consumers. Logistic regression models were used to identify factors and the magnitude of association with frequency of soft or energy drinks consumption. The outcome was categorized as the consumption of at least one time per week or none. Factors that showed significant association in the bivariate analyses with weekly soft or energy consumption (p < 0.05) were included in the adjusted models.
3 Results
The study sample included n = 5,194 participants. Participants who reported unstable income (n = 1,239, 24%) or extreme BMI values (n = 45, <1%) were excluded. Overall, a total of n = 3,928 were included in the analyses, 57% of which were males, 43% were 30–49 years, 65% had a post-secondary education, and 54% had overweight or obesity (BMI ≥ 25 kg/m2).
3.1 Soft drinks consumption
Soft drinks consumption is shown by participants’ characteristics in Table 1. About 67% reported consuming soft drinks at least once a week, with more males than females reporting weekly consumption (69% vs. 65%, p < 0.01). Consumption of soft drinks also differed by age, monthly income, physical activity level, and weight status. Education level did not differ between consumers and non-consumers.
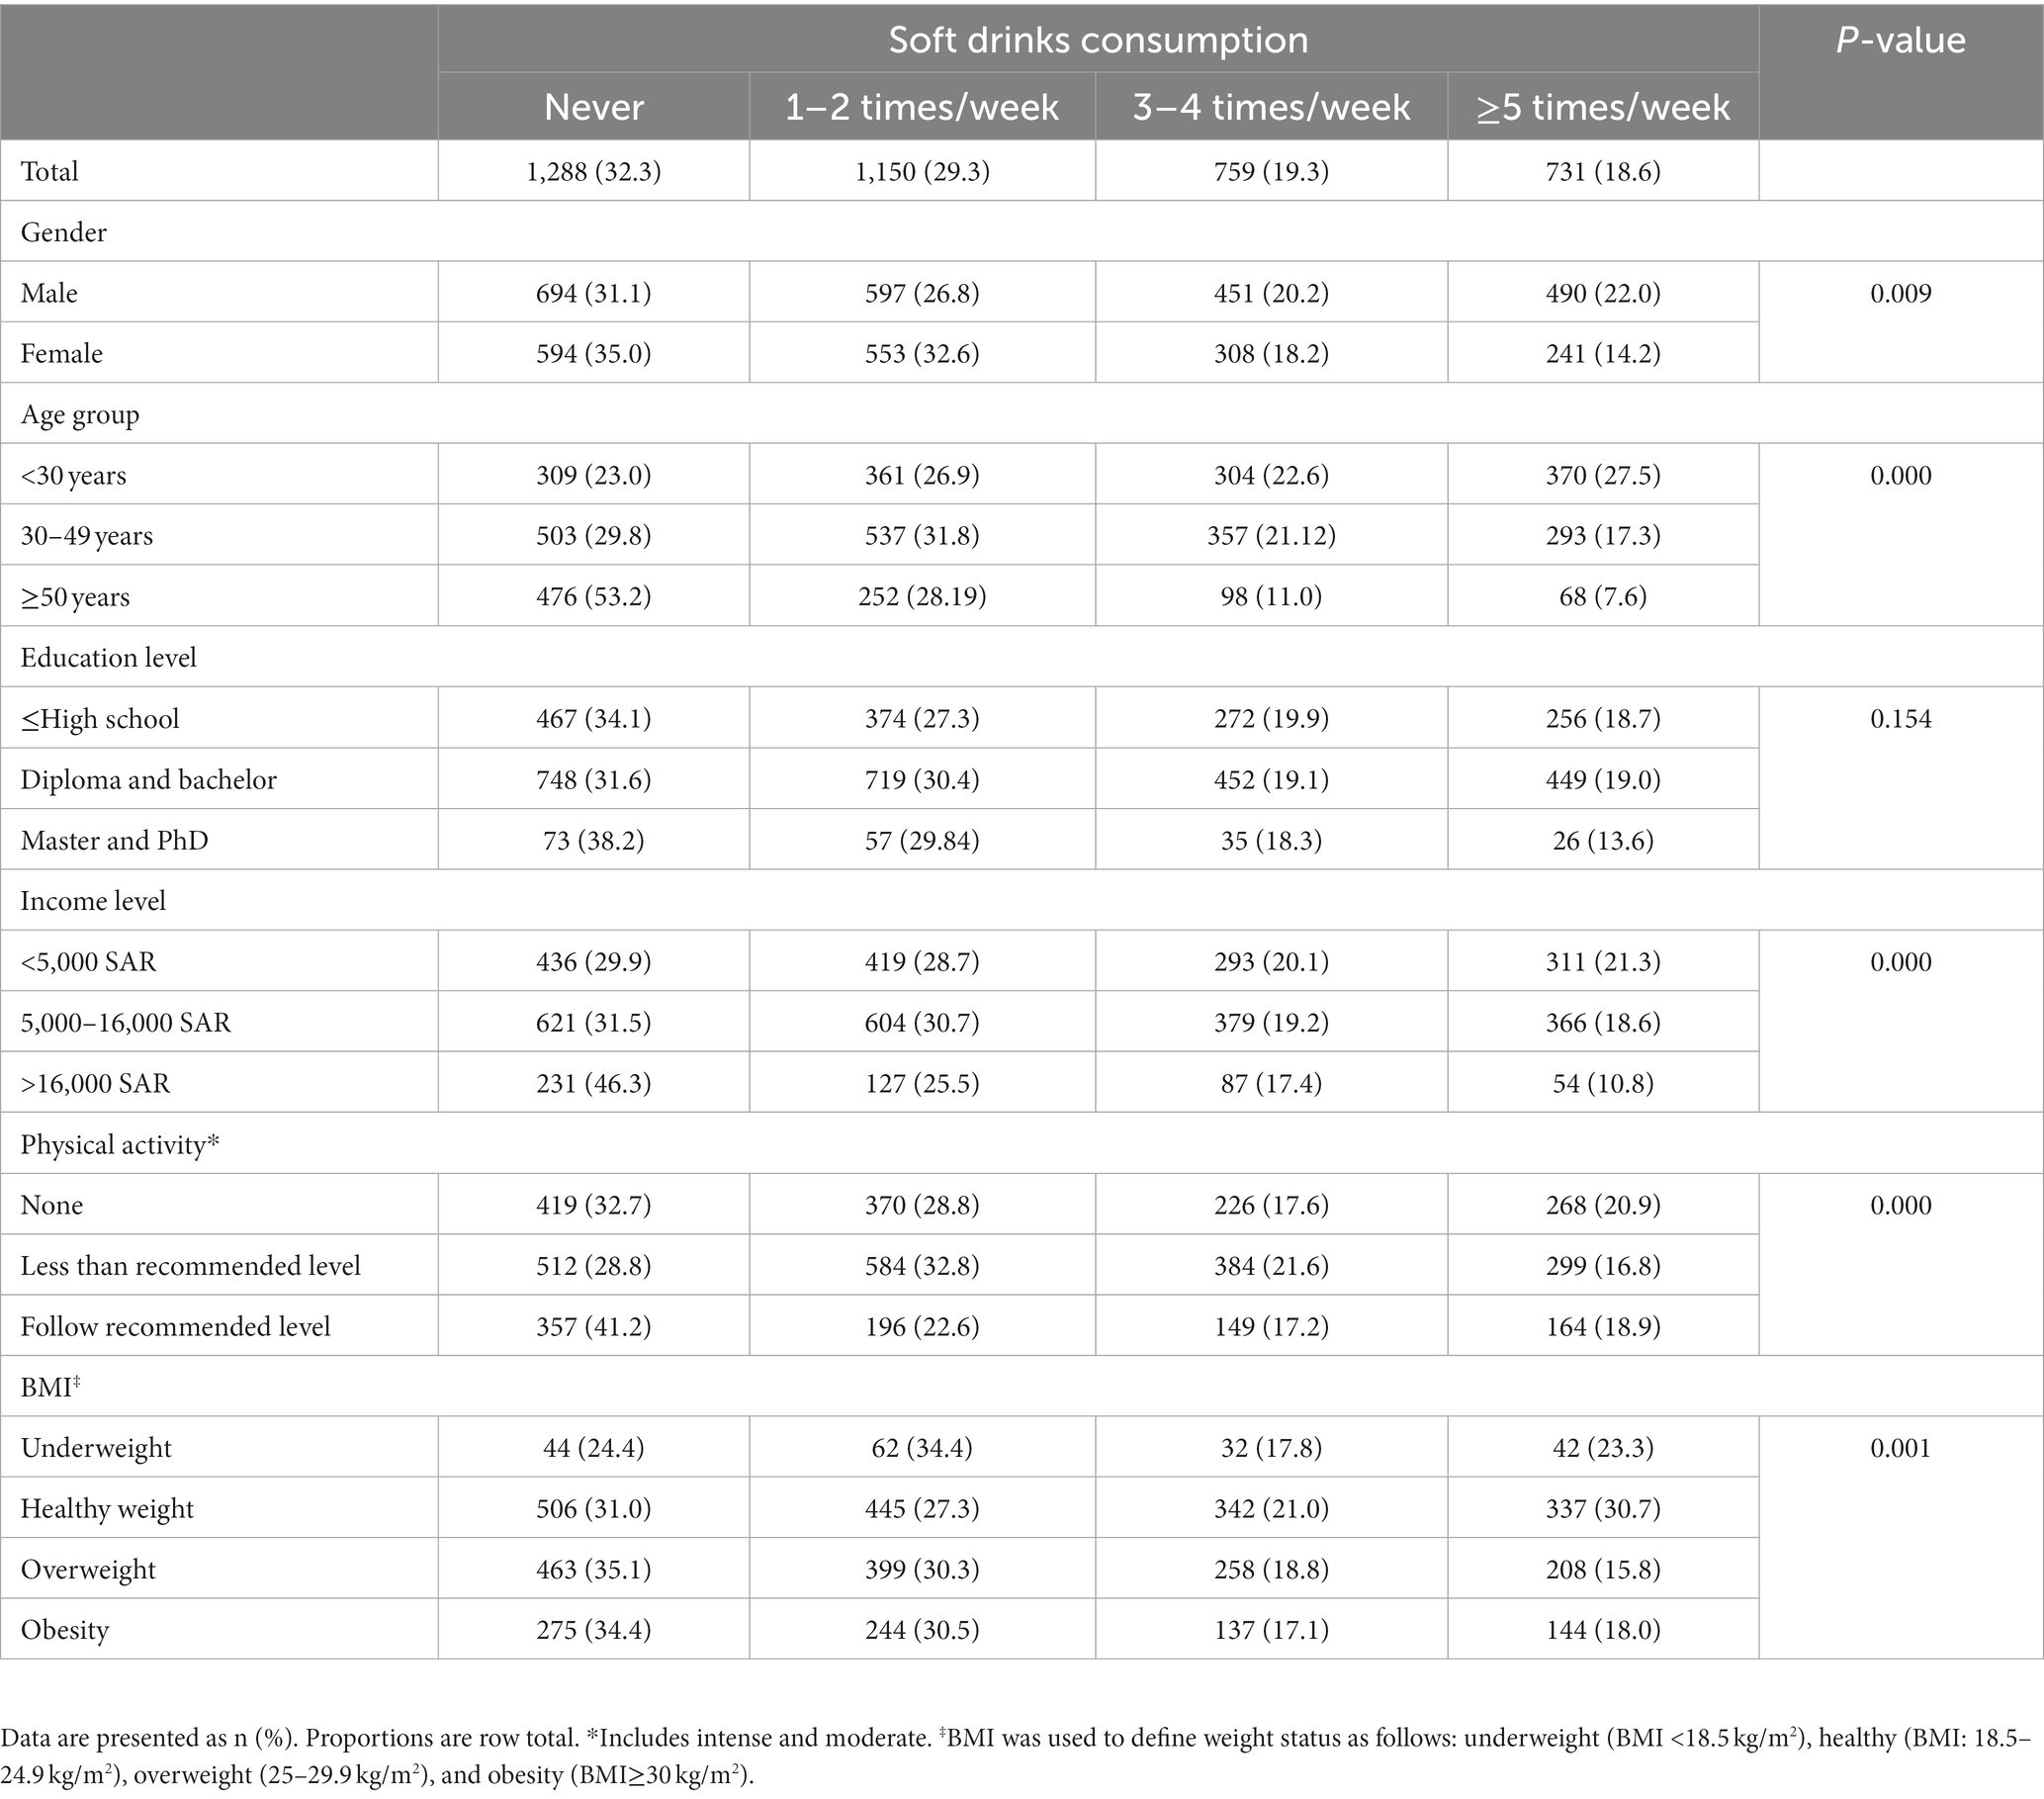
Table 1. Characteristics of study sample by soft drinks consumption.
3.2 Energy drinks consumption
Energy drinks consumption is shown by participants characteristics in Table 2. Nearly, 30% reported consuming energy drinks at least once a week, with more males than females reporting weekly consumption (34% vs. 25%, p < 0.001). Significant differences in consumption of energy drinks were observed by age, monthly income, physical activity level, and weight status. Education level did not differ between consumers and non-consumers.

Table 2. Characteristics of study sample by energy drinks consumption.
3.3 Factors associated with soft and energy drinks consumption
Table 3 presents unadjusted and adjusted logistic regression models of factors associated with weekly soft drinks consumption. Females had lower odds of consuming soft drinks weekly compared to males [crude OR (95%CI) = 0.84 (0.73, 0.96)]. Adults over the age of 50 y and those 30–49 y were less likely to consume soft drinks [crude ORs (95%CI): 0.26 (0.22, 0.31) and 0.70 (0.60, 0.83), respectively] compared to younger adults <29 y. Overweight, but not obesity, was associated with lower odds of soft drinks consumption compared to healthy weight adults [crude OR (95%CI): 0.83 (0.71, 0.97)]. Participants with higher income >16,000 SAR and those following physical activity recommendations had lower odds of consuming soft drinks consumption than reference categories (<5,000 SAR and no physical activity, respectively). Interestingly, those who performed physical activity less than the recommended level had higher odds of consuming soft drinks than those with no physical activity. In the fully adjusted model, gender, age, monthly income, and physical activity remained significantly associated with soft drinks consumption following the same direction of association. Weight status was not associated with soft drinks consumption after adjusting for age, gender, monthly income, and physical activity.
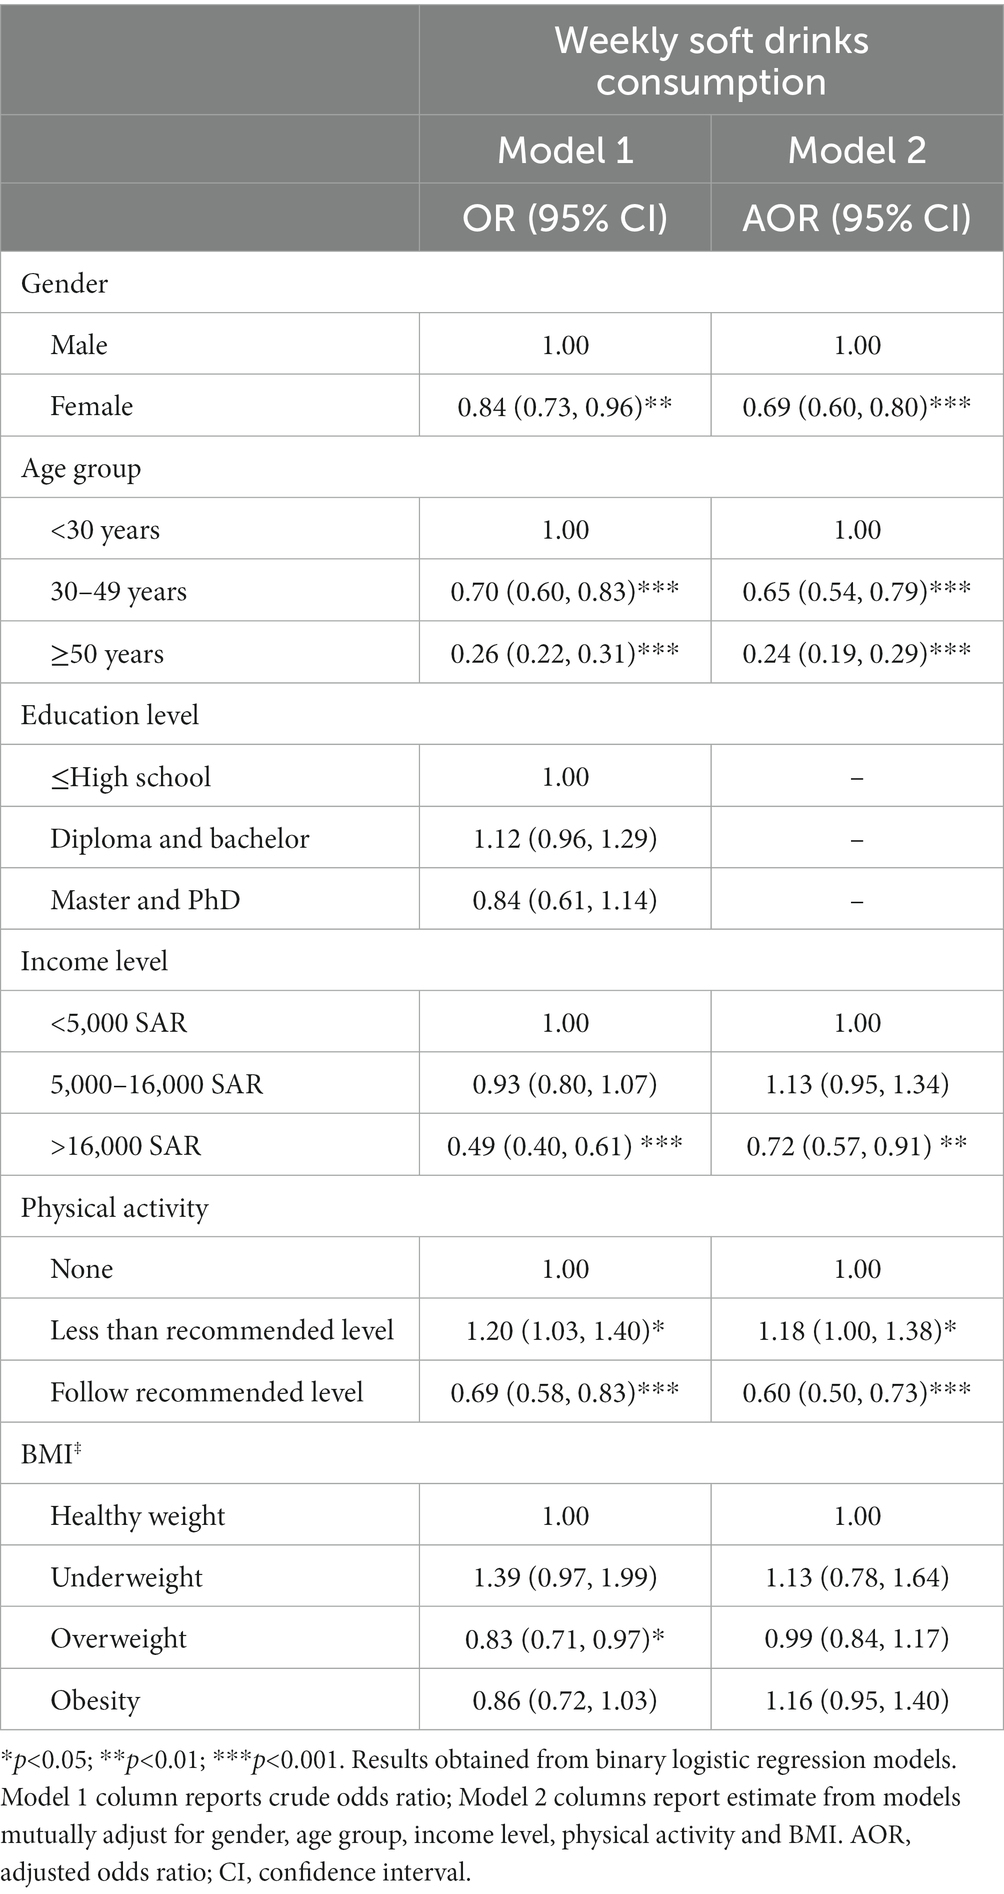
Table 3. Odd ratios of factors associated with soft drink consumption and their 95% confidence intervals (n = 3,928).
Table 4 illustrates logistic regression analyses of unadjusted and adjusted odds ratios of factors associated with weekly energy drinks consumption. Similar to the pattern observed in soft drinks consumption, females had lower odds of consuming energy drinks weekly compared to males [AOR (95%CI): 0.53 (0.46, 0.62)]. Adults over the age of 50 y and 30–49 y were less likely to consume soft drinks compared to younger adults <29 y. Both overweight and obesity were associated with lower odds of energy drinks consumption compared to adults with healthy weight. Higher income >16,000 SAR was associated with lower odds of consuming energy drinks than those who earned <5,000 SAR. Education level was not associated with weekly energy drinks consumption as observed in soft drinks. Following physical activity recommendations was associated with lower odds of consuming energy drinks; however, less than the recommended physical activity was associated with higher odds of consumption than the reference category (no physical activity). In the fully adjusted model, gender, age, monthly income, weight status, and physical activity remained significantly associated with energy drinks consumption following the same direction of association in the bivariate analyses.
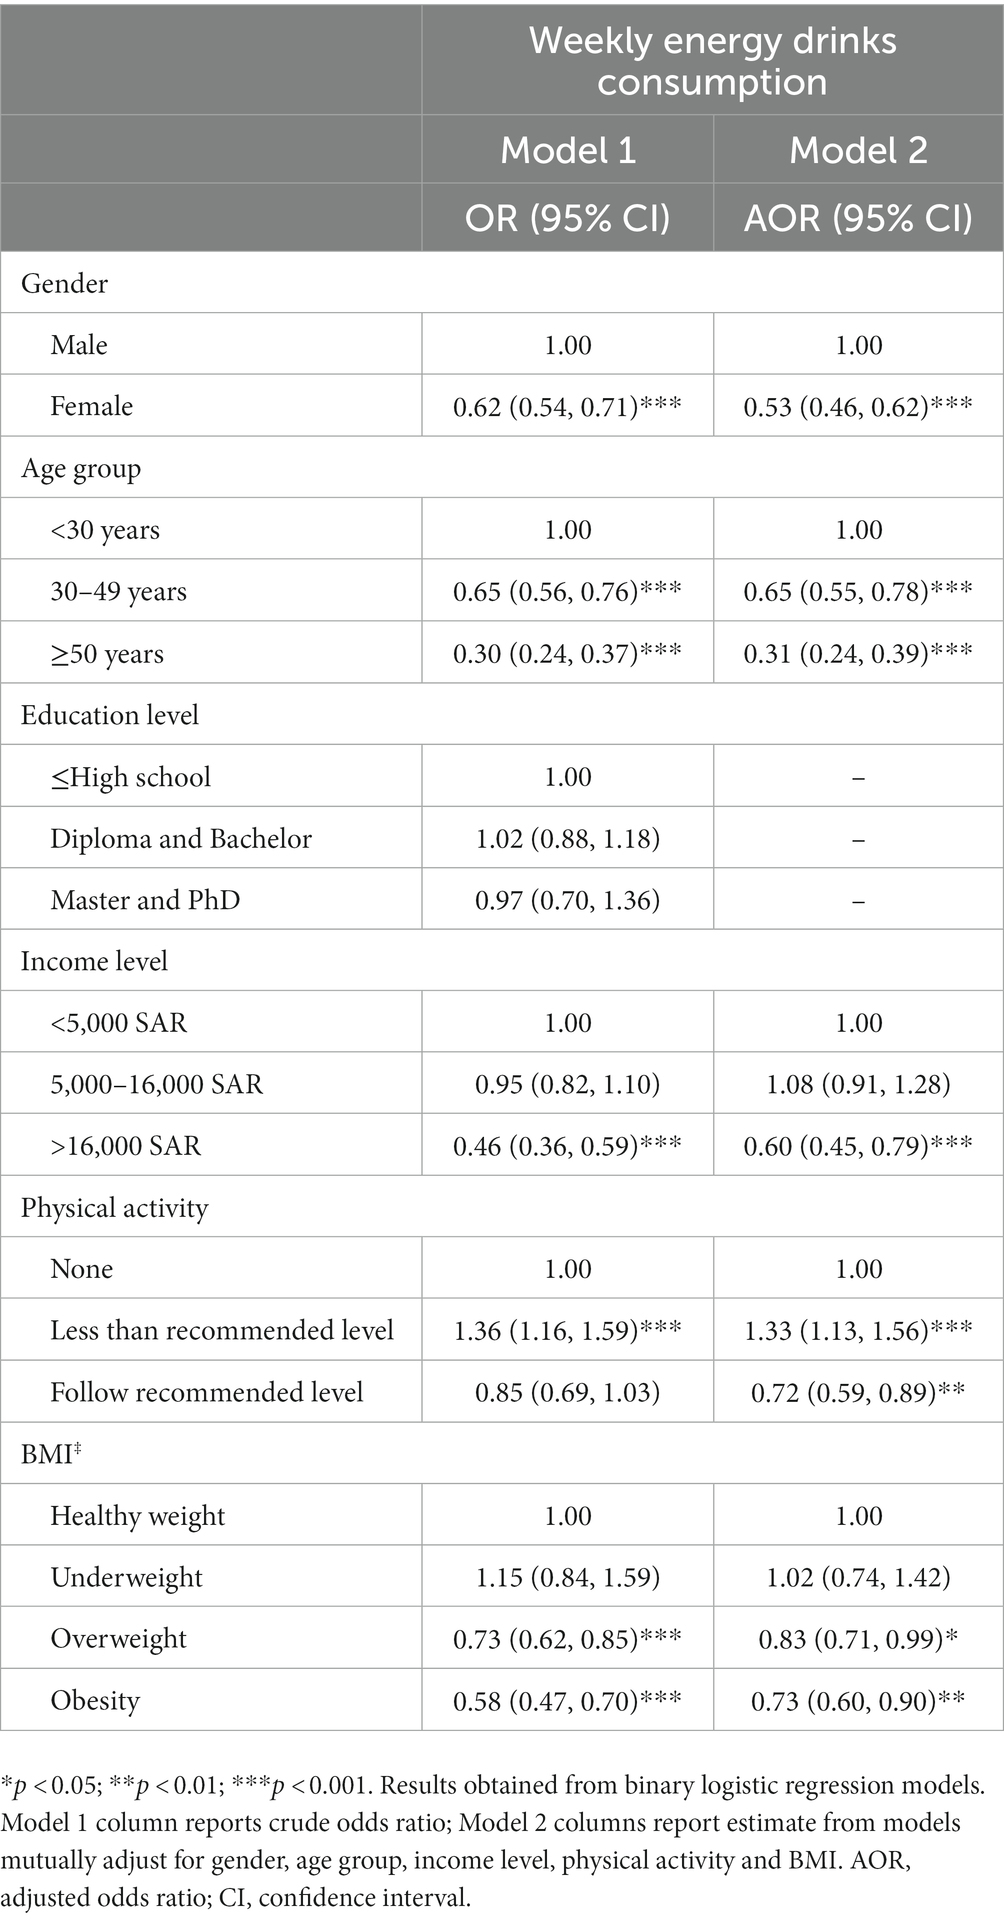
Table 4. Odd ratios of factors associated with energy drink consumption and their 95% confidence intervals (n = 3,928).
4 Discussion
Based on nationally representative data of Saudi adults, weekly consumption of soft drinks was 67% and energy drinks consumption was 30%. Analyses showed that Saudi females were less likely to consume soft and energy drinks compared to males and that adults less than 30 years old had the highest prevalence of consuming both soft and energy drinks. Interestingly, adherence to the WHO’s physical activity recommendations was inversely correlated with the consumption of soft and energy drinks. Similarly, adults with obesity exhibited a lower likelihood of weekly consumption of energy drinks. However, weight status was not associated with soft drinks consumption after adjusting for age, gender, income, and physical activity level.
In this study, the prevalence of soft drinks consumption in Saudi adult population was 67% in any given week. Our findings support the evidence that Saudi Arabia is one of the biggest consumers of soft drinks in the Middle East region (33). Globally, Saudi Arabia ranks fifth in terms of calorie consumption derived from sugar-sweetened beverages (33). The findings of the current study are consistent with findings from a national study showing that ~71% of Saudi adults consume sugar-sweetened beverages, which include soft drinks, at least once a week using data collected in 2013, with 36% of adults consume these beverages on a daily basis (34). Saudi Arabia implemented a 50% tax on sugary drinks, including soft drinks in 2017, which aligns with a broader initiative to combat the escalating rates of obesity and type 2 diabetes mellitus, conditions correlated with the overconsumption of these beverages (24, 35). A 2019 study on 1,194 adults living in Saudi Arabia reported a lower rate of weekly soft drinks consumption (44%); of which, 6% reported consuming soft drinks daily (36). Consumption of soft drinks on a daily basis has been observed in developed nations, such as the UK (20.4%) (37) and the USA (40.0%) (38), with similar prevalence in South Africa (48.3%) (39). This may be due to the preference for fast food and soft drinks consumption in western and European countries. A trend toward a busy lifestyle with less emphasis on finding time to cook may also be emerging (40).
We found that around 30.0% Saudi adults consume energy drinks on a weekly basis, which is in agreement with the most recent study performed among Saudi young adults (29.3%) (41). However, the results of the present study are inconsistent and lower compared with earlier studies executed in Saudi Arabia. A 2017 study that included students from the Prince Sattam bin Abdulaziz University found that 81.3% of students consumed energy drinks, while in another study conducted at the University of Dammam, 45.3% of participants consumed energy drinks (42, 43). Both studies, however, did not report a clear frequency of consumption to facilitate comparison. Compared to Malaysian adults, weekly consumption appears to be higher in our study (30.0% vs. 18.8%) (27). It is suggested that these reduced consumption in recent years is due to the new rules of the Saudi Food and Drug Authority (SFDA) and the General Authority of Zakat and Tax (GAZT) related to energy drinks. In 2017, SFDA published few rules for handling energy drinks; one of these rules includes that manufacturers must write the warning phrases on the package (44). Weekly consumption has been observed in the 16 European countries (16.0%) (45) and Denmark (15.8%) (26). Energy drinks are considered new in the Danish soft drink market, which may be one reason why young adults in Denmark are less likely to consume energy drinks. Additionally, the above drinks tend to be more expensive than other drinks, which may also contribute to this phenomenon (26).
In the current study, gender, age, monthly income, and physical activity were identified as contributing factors to soft and energy drinks consumption. Gender was found to be significantly associated with soft and energy drinks consumption. Females had lower odds for consuming soft and energy drinks weekly [AOR (95%CI): 0.69 (0.60, 0.80) vs. AOR (95%CI): 0.53 (0.46, 0.62), respectively] compared to males. This finding is consistent with findings from several earlier population-based studies in Saudi Arabia (34), USA (38), and Australia (46), which revealed that males were more likely to consume soft and energy drinks than females. A study in Denmark found 25% of men consume energy drinks on a weekly basis, suggesting that the consumption of energy drink is predominantly observed among males (26). Another study in Cambodia found the men are more likely [AOR (95%CI): 1.49 (1.10, 2.00)] to consume soft drinks than women (40) This difference could be attributed to gender-driven roles, identities, and social norms. For example, men may be more likely to be influenced by advertising that targets males. It could be also that females tend to more health-conscious and the desire to be a positive role-model. Previous research in several populations (34, 41, 47, 48) has demonstrated a strong correlation between the age of an individual and their consumption of soft and energy drinks, and the current study’s findings support this. Our result was that young adults <29 y are more likely to consume soft and energy drinks compared to adults over the age of 50 y and those 30–49 y. However, a study on Cambodian adults opposes this finding (40).
Monthly income was significantly associated with soft and energy drinks consumption. Those who earned higher income >16,000 SAR per month were less likely to consume soft and energy drinks compared to those who earned <5,000 SAR per month. This observation is in line with data from Singapore, which indicates that high and middle-income individuals consume fewer soft drinks in comparison to lower-income individuals (48). In addition, a 2022 Saudi study indicated that adults with higher incomes were less likely to consume soft drinks (34). Conversely, a study conducted in Australia found that individuals with a higher annual income tended to consume more soft drinks than those with a lower annual income (39). The reason that higher income participants in this study were less likely to consume soft and energy drinks could be explained by how high income can increase people access to knowledge, material, cultural, and psychosocial resources that can influence their engagement in such behaviors (49). However, our study did not observe any association between education level and energy and soft drinks consumption. Existing evidence indicates that the consumption of energy drinks was more common among individuals with lower educational attainment levels than those with higher educational attainment levels (26). Thus, examining several socioeconomic status indicators, such as income and education, can improve our understanding of how such indicators influence soft and energy drinks consumption, as they usually represent different social processes in health and health behaviors (50).
As expected, adhering to physical activity recommendations was associated with lower odds of consuming soft and energy drinks. This conclusion is in line with the findings of a population-based cross-sectional survey conducted in Spain, which showed that the prevalence of diet soda consumption was highest among inactive adolescents (51). Adolescents may consume diet soda in response to the realization that they are not consuming enough energy (51). In the context of our study in Saudi adults, it might be that participants who are following physical activity recommendations consuming less soft and energy drinks in order to follow healthy food choices and maintain overall health. Regarding weight status, we found that overweight/obesity were associated with lower odds of energy drinks consumption compared to adults with healthy weight. This result is inconsistent with previous evidence, which might reflect differences in population and methodology (52, 53). In three Eastern European cohorts have indicated positive correlation between consumption of sugar-sweetened beverage and BMI (52). A study on 515 Malaysian adults reported no bivariate association between energy drinks consumption and BMI (27). A recent systematic review of 26 observational studies showed that only one study reported no correlation between the intake of sugar-sweetened beverage and weight gain (53). It is possible that participants classified as overweight/obese in our study were avoiding the consumption of energy drinks for better weight control or under-reported consumption, causing social desirability bias and this needs to be further explored.
Advertisements and marketing campaigns frequently portray energy drinks as fashionable, pleasurable, or necessary for optimal performance, affecting consumer behaviors and attitudes (23, 54). A study in Canada indicated a considerable number of energy drink postings on social media in 2020–2021, with several posts have using marketing strategies on Twitter, Facebook and Instagram, that may be appealing to adolescents. Another study in Saudi Arabia found that advertising is the primary source of information regarding energy drinks among 43% of Saudi adolescents (55). However, a recent study on n = 316 students from two Saudi universities reported no associations between social media platforms or watching relevant social media advertisements with sugary drinks consumption after adjusting for age, sex, nationality, marital status, academic year, monthly household income, and BMI; weekly users of Snapchat had lower odd of consuming sugary drinks than daily user 0.33 (0.11–0.98) (56). Further studies are needed to understand the impact of the media on soft and energy drinks consumptions in the Saudi Arabian context.
Finally, the present study measures the consumption of soft and energy drinks by asking the participants about their frequency of intake each week rather than the actual quantity of consumption. Using the frequency of consumption, as an index of actual amount consumption is easier and a relatively reliable tool to judge the amount of consumption which was adopted in many other studies (57–59). Studies have shown correlations between frequency of consumption and quantity of soft drinks consumption (57–59). Frequency of consumption has been associated with adverse health behaviors and higher rates of overweight/obesity among children, adolescents, and adults from several countries (6, 60, 61).
The current study has many strengths, which includes a relatively large sample size representative of Saudi adults from all regions of Saudi Arabia by using multistage quota sampling. This sampling technique was limiting the risk of selection bias and allowing for the recruitment of a balanced study sample in terms of gender and age that representing all the regions of the kingdom. On the other hand, the use of a research participant database might introduce bias, given that participation in the database was voluntary. Data integrity checks, inherent to the QPlatform data collection system, minimize invalid or erroneous data entry. The study was also able to report on soft drinks and energy drinks separately. However, the study has some limitations. The cross-sectional design might affect the causative relationship between the soft and energy drinks consumption and possible associations. The self-reported data is commonly used in nutrition research and public health surveillance, but it is vulnerable to recall bias and social desirability bias, which may result in misreporting particularly among those who are overweight. Furthermore, the soft and energy drinks consumption was measured by frequency rather than actual quantity that ingested by participants on the weekly basis. Data was not available on the sizes or types of soft and energy drinks; some might be consuming non-sugar sweetened drinks that have a different impact compared to sugar-sweetened beverages.
5 Conclusion
Overall, this study on a representative sample of Saudi adults shows that 67% consume soft drinks and 30% consume energy drinks weekly. Males, younger adults, and those with higher incomes are more likely to consume soft drinks weekly than females, older adults, and those with lower incomes. The soft drinks consumption remains high despite the implementation of taxes and alarm action, particularly among young adults and men. Studies are needed on the type and quantity of drinks consumed and in-depth analyses of associated factors; this could inform targeted interventions for any future programs on the prevention and/or management of non-communicable diseases. The findings of this study highlight the need for public health interventions to the consumption of soft drinks and energy drinks in Saudi Arabia. These interventions should be based on a comprehensive understanding of the factors that influence consumption and tailored to the specific needs of the Saudi population.
Data availability statement
The raw data supporting the conclusions of this article will be made available by the authors, without undue reservation.
Ethics statement
The studies involving humans were approved by Ethics Committee of Sharik Association for Research and Studies (Approval no. 06–2021). The studies were conducted in accordance with the local legislation and institutional requirements. The participants provided their written informed consent to participate in this study.
Author contributions
AA: Conceptualization, Investigation, Supervision, Writing – original draft, Writing – review & editing. AT: Investigation, Writing – original draft, Writing – review & editing. AG: Formal analysis, Investigation, Software, Writing – review & editing. FA-Q: Conceptualization, Writing – original draft, Writing – review & editing. NA: Methodology, Resources, Writing – original draft, Writing – review & editing. NB: Data curation, Funding acquisition, Resources, Writing – review & editing.
Funding
The author(s) declare financial support was received for the research, authorship, and/or publication of this article. This research was funded by the Sharik Association for Research and Studies.
Conflict of interest
The authors declare that the research was conducted in the absence of any commercial or financial relationships that could be construed as a potential conflict of interest.
Publisher’s note
All claims expressed in this article are solely those of the authors and do not necessarily represent those of their affiliated organizations, or those of the publisher, the editors and the reviewers. Any product that may be evaluated in this article, or claim that may be made by its manufacturer, is not guaranteed or endorsed by the publisher.
References
1. Costantino, A, Maiese, A, Lazzari, J, Casula, C, Turillazzi, E, Frati, P, et al. The dark side of energy drinks: a comprehensive review of their impact on the human body. Nutrients. (2023) 15:3922. doi: 10.3390/nu15183922
2. Alsunni, AA. Energy drink consumption: beneficial and adverse health effects. Int J Health Sci. (2015) 9:468–74. doi: 10.12816/0031237
3. McLellan, TM, Caldwell, JA, and Lieberman, HR. A review of caffeine’s effects on cognitive, physical and occupational performance. Neurosci Biobehav Rev. (2016) 71:294–312. doi: 10.1016/j.neubiorev.2016.09.001
4. Ruiz, LD, and Scherr, RE. Risk of energy drink consumption to adolescent health. Am J Lifestyle Med. (2019) 13:22–5. doi: 10.1177/1559827618803069
5. Azagba, S, Langille, D, and Asbridge, M. An emerging adolescent health risk: caffeinated energy drink consumption patterns among high school students. Prev Med (Baltim). (2014) 62:54–9. doi: 10.1016/j.ypmed.2014.01.019
6. Hu, H, Song, J, Mac Gregor, GA, and He, FJ. Consumption of soft drinks and overweight and obesity among adolescents in 107 countries and regions. JAMA Netw Open. (2023) 6:e2325158–8. doi: 10.1001/JAMANETWORKOPEN.2023.25158
7. Chaudhary, V. Soft carbonated beverages In: D Mudgil and S Barak, editors. Beverages: processing and technology. Jodhpur: Scientific Publishers (2018). 90–111.
8. Malik, VS, and Hu, FB. Fructose and cardiometabolic health: what the evidence from sugar-sweetened beverages tells us. J Am Coll Cardiol. (2015) 66:1615–24. doi: 10.1016/j.jacc.2015.08.025
9. Cozma, AI, and Sievenpiper, JL. The role of fructose, sucrose and high-fructose corn syrup in diabetes. Eur Endocrinol. (2014) 10:51. doi: 10.17925/EE.2014.10.01.51
10. Heidari-Beni, M, and Kelishadi, R. The role of dietary sugars and sweeteners in metabolic disorders and diabetes In: Sweeteners: pharmacology, biotechnology, and applications. Cham: Springer International Publishing (2018). 225–43.
11. Kregiel, D. Health safety of soft drinks: contents, containers, and microorganisms. Biomed Res Int. (2015) 2015:1–15. doi: 10.1155/2015/128697
12. Vartanian, LR, Schwartz, MB, and Brownell, KD. Effects of soft drink consumption on nutrition and health: a systematic review and meta-analysis. Am J Public Health. (2007) 97:667–75. doi: 10.2105/AJPH.2005.083782
13. Malik, VS, Popkin, BM, Bray, GA, Després, JP, and Hu, FB. Sugar sweetened beverages, obesity, type 2 diabetes and cardiovascular disease risk. Circulation. (2010) 121:1356–64. doi: 10.1161/CIRCULATIONAHA.109.876185
14. Tahmassebi, JF, Duggal, MS, Malik-Kotru, G, and Curzon, MEJ. Soft drinks and dental health: a review of the current literature. J Dent. (2006) 34:2–11. doi: 10.1016/J.JDENT.2004.11.006
15. Mattioli, AV, Pennella, S, Farinetti, A, and Manenti, A. Energy drinks and atrial fibrillation in young adults. Clin Nutr. (2018) 37:1073–4. doi: 10.1016/J.CLNU.2017.05.002
16. Hanif, M, Saleem, S, Naz, S, and Sundas, F. Energy drinks and atrial fibrillation: an unusual case of caution. Cureus. (2020) 12:e10807. doi: 10.7759/CUREUS.10807
17. Lévy, S, and Cappato, R. Cardiovascular adverse events associated with energy drinks in adolescents and young adults. Cardiovasc Drugs Ther. (2022) 36:379–81. doi: 10.1007/S10557-021-07305-9
18. Goodhew, CA, Perry, TL, and Rehrer, NJ. Factors influencing energy drink consumption in participants and viewers of extreme sports. J Nutr Metab. (2020) 2020:1–6. doi: 10.1155/2020/9382521
19. Hammond, D, and Reid, JL. Exposure and perceptions of marketing for caffeinated energy drinks among young Canadians. Public Health Nutr. (2018) 21:535–42. doi: 10.1017/S1368980017002890
20. Berridge, KC. ‘Liking’and ‘wanting’food rewards: brain substrates and roles in eating disorders. Physiol Behav. (2009) 97:537–50. doi: 10.1016/j.physbeh.2009.02.044
21. Iatridi, V, Armitage, RM, Yeomans, MR, and Hayes, JE. Effects of sweet-liking on body composition depend on age and lifestyle: a challenge to the simple sweet-liking—obesity hypothesis. Nutrients. (2020) 12:2702. doi: 10.3390/nu12092702
22. Richards, G, and Smith, AP. A review of energy drinks and mental health, with a focus on stress, anxiety, and depression. J Caffeine Res. (2016) 6:49–63. doi: 10.1089/jcr.2015.0033
23. Abdolmohamad Sagha, M, Seyyedamiri, N, Foroudi, P, and Akbari, M. The one thing you need to change is emotions: the effect of multi-sensory marketing on consumer behavior. Sustainability. (2022) 14:2334. doi: 10.3390/su14042334
24. Alsukait, R, Bleich, S, Wilde, P, Singh, G, and Folta, S. Sugary drink excise tax policy process and implementation: case study from Saudi Arabia. Food Policy. (2020) 90:101789. doi: 10.1016/J.FOODPOL.2019.101789
25. Alsukait, R, Wilde, P, Bleich, S, Singh, G, and Folta, S. Impact of Saudi Arabia’s sugary drink tax on prices and purchases (P10-066-19). Curr Dev Nutr. (2019) 3:nzz034.P10-066-19. doi: 10.1093/cdn/nzz034.P10-066-19
26. Friis, K, Lyng, JI, Lasgaard, M, and Larsen, FB. Energy drink consumption and the relation to socio-demographic factors and health behaviour among young adults in Denmark. A population-based study. Eur J Publ Health. (2014) 24:840–4. doi: 10.1093/eurpub/cku003
27. Mohammed, AH, Blebil, A, Selvaraj, A, Ang, ZJX, Chong, CY, Chu, VRS, et al. Knowledge, consumption pattern, and adverse effects of energy drinks among Asian population: a cross-sectional analysis from Malaysia. J Nutr Metab. (2022) 2022:1–12. doi: 10.1155/2022/3928717
28. Kwak, JH, Jo, G, Chung, HK, and Shin, MJ. Association between sugar-sweetened beverage consumption and incident hypertension in Korean adults: a prospective study. Eur J Nutr. (2018) 58:1009–17. doi: 10.1007/S00394-018-1617-1
29. Sharik Association for Research and Studies The Sharik diet and health National Survey. (2022) Available at: https://sharikhealth.com/attachments/article/89/diet-and-health-survey.pdf
30. ZDataCloud. ZdataCloud. (2023): Available at: http://www.zdatacloud.com
31. World Health Organization. STEPS manual: section 5: collecting step 2 data: physical measurements. WHO (2017). Available at: https://www.who.int/ncds/surveillance/steps/Part3_Section5.pdf (Accessed April 19, 2018).
32. WHO. Physical activity. (2023): Available at: https://www.who.int/news-room/fact-sheets/detail/physical-activity
33. Euromonitor International. Soft drinks in Saudi Arabia | market research report | Euromonitor. Country Report (2015). Available at: https://www.euromonitor.com/soft-drinks-in-saudi-arabia/report (Accessed August 17, 2023).
34. Al-Hanawi, MK, Ahmed, MU, Alshareef, N, Qattan, AMN, and Pulok, MH. Determinants of sugar-sweetened beverage consumption among the Saudi adults: findings from a nationally representative survey. Front Nutr. (2022) 9:744116. doi: 10.3389/fnut.2022.744116
35. Alsukait, R, Wilde, P, Bleich, SN, Singh, G, and Folta, SC. Evaluating Saudi Arabia’s 50% carbonated drink excise tax: changes in prices and volume sales. Econ Hum Biol. (2020) 38:100868. doi: 10.1016/j.ehb.2020.100868
36. Benajiba, N, and Mahboub, SM. Consumption of sugar-sweetened soft drinks among Saudi adults: assessing patterns and identifying influencing factors using principal component analysis. Pak J Nutr. (2019) 18:401–7. doi: 10.3923/pjn.2019.401.407
37. Barrett, P, Imamura, F, Brage, S, Griffin, SJ, Wareham, NJ, and Forouhi, NG. Sociodemographic, lifestyle and behavioural factors associated with consumption of sweetened beverages among adults in Cambridgeshire, UK: the fenland study. Public Health Nutr. (2017) 20:2766–77. doi: 10.1017/S136898001700177X
38. Mendy, VL, Vargas, R, Payton, M, and Cannon-Smith, G. Association between consumption of sugar-sweetened beverages and sociodemographic characteristics among Mississippi adults. Prev Chronic Dis. (2017) 14:E137. doi: 10.5888/pcd14.170268
39. Pengpid, S, and Peltzer, K. Prevalence and socio-behavioral factors associated with sugar-sweetened beverages consumption among 15 years and older persons in South Africa. Diabetes Metab Syndr Obes. (2019) 12:937–45. doi: 10.2147/DMSO.S209147
40. Laohasiriwong, W, Samphors, S, Chamroen, P, Pisey, V, and Dewey, RS. Association between socioeconomic factors and soft drink consumption among adults in Cambodia: a cross-sectional study. F1000Res. (2021) 9:708. doi: 10.12688/f1000research.24890.3
41. Alafif, N, Al-Rashed, A, Altowairqi, K, and Muharraq, A. Prevalence of energy drink consumption and association with dietary habits among governmental university students in Riyadh. Saudi J Biol Sci. (2021) 28:4511–5. doi: 10.1016/j.sjbs.2021.04.050
42. Rahamathulla, MP. Prevalence, side effects and awareness about energy drinks among the female university students in Saudi Arabia. Pak J Med Sci. (2017) 33:347–52. doi: 10.12669/pjms.332.12084
43. Alsunni, AA, and Badar, A. Energy drinks consumption pattern, perceived benefits and associated adverse effects amongst students of University of Dammam, Saudi Arabia. J Ayub Med Coll Abbottabad. (2011) 23:3–9.
44. GSO. Technical Committee No. TC05. Energy drinks. (2023). Available at: https://www.gso.org.sa/en/about-gso/ (Accessed August 17, 2023).
45. Zucconi, S, Volpato, C, Adinolfi, F, Gandini, E, Gentile, E, Loi, A, et al. Gathering consumption data on specific consumer groups of energy drinks. EFSA Supp Public. (2013) 10:394E. doi: 10.2903/sp.efsa.2013.EN-394
46. Pollard, CM, Meng, X, Hendrie, GA, Hendrie, D, Sullivan, D, Pratt, IS, et al. Obesity, socio-demographic and attitudinal factors associated with sugar-sweetened beverage consumption: Australian evidence. Aust N Z J Public Health. (2016) 40:71–7. doi: 10.1111/1753-6405.12482
47. Loh, DA, Moy, FM, Zaharan, NL, Jalaludin, MY, and Mohamed, Z. Sugar-sweetened beverage intake and its associations with cardiometabolic risks among adolescents. Pediatr Obes. (2017) 12:e1–5. doi: 10.1111/ijpo.12108
48. Scully, M, Morley, B, Niven, P, Crawford, D, Pratt, IS, and Wakefield, M. Factors associated with high consumption of soft drinks among Australian secondary-school students. Public Health Nutr. (2017) 20:2340–8. doi: 10.1017/S1368980017000118
49. Pampel, FC, Krueger, PM, and Denney, JT. Socioeconomic disparities in health behaviors. Annu Rev Sociol. (2010) 36:349–70. doi: 10.1146/ANNUREV.SOC.012809.102529
50. Galobardes, B, Shaw, M, Lawlor, DA, Lynch, JW, and Smith, GD. Indicators of socioeconomic position (part 1). J Epidemiol Community Health. (2006) 60:7–12. doi: 10.1136/JECH.2004.023531
51. Bibiloni, M, Özen, A, Pons, A, González-Gross, M, and Tur, J. Physical activity and beverage consumption among adolescents. Nutrients. (2016) 8:389. doi: 10.3390/nu8070389
52. Garduño-Alanís, A, Malyutina, S, Pajak, A, Stepaniak, U, Kubinova, R, Denisova, D, et al. Association between soft drink, fruit juice consumption and obesity in Eastern Europe: cross-sectional and longitudinal analysis of the HAPIEE study. J Hum Nutr Diet. (2020) 33:66–77. doi: 10.1111/JHN.12696
53. Luger, M, Lafontan, M, Bes-Rastrollo, M, Winzer, E, Yumuk, V, and Farpour-Lambert, N. Sugar-sweetened beverages and weight gain in children and adults: a systematic review from 2013 to 2015 and a comparison with previous studies. Obes Facts. (2017) 10:674–93. doi: 10.1159/000484566
54. Bleakley, A, Ellithorpe, ME, Jordan, AB, Hennessy, M, and Stevens, R. A content analysis of sports and energy drink advertising. Appetite. (2022) 174:106010. doi: 10.1016/J.APPET.2022.106010
55. Musaiger, AO, and Zagzoog, N. Knowledge, attitudes and practices toward energy drinks among adolescents in Saudi Arabia. Glob J Health Sci. (2014) 6:42–6. doi: 10.5539/gjhs.v6n2p42
56. Aljefree, NM, and Alhothali, GT. Exposure to food marketing via social media and obesity among university students in Saudi Arabia. Int J Environ Res Public Health. (2022) 19:5851. doi: 10.3390/ijerph19105851
57. Benajiba, N, Bernstein, J, and Aboul-Enein, BH. Attitudes toward sweetened soft drinks and consumption patterns among Saudi women: a cross-sectional study. Eat Behav. (2020) 38:101413. doi: 10.1016/j.eatbeh.2020.101413
58. Benajiba, N, and Eldib, RS. Exploring attitudes related to sweetened soft drinks consumption among adults in Saudi Arabia. Nutr Food Sci. (2018) 48:433–41. doi: 10.1108/NFS-01-2018-0020
59. Mumena, WA, Alamri, AA, Mahrous, AA, Alharbi, BM, Almohaimeed, JS, Hakeem, MI, et al. Knowledge, attitudes, and practices toward added sugar consumption among female undergraduate students in Madinah, Saudi Arabia: a cross-sectional study. Nutrition. (2020) 79-80:110936. doi: 10.1016/J.NUT.2020.110936
60. Ashdown-Franks, G, Vancampfort, D, Firth, J, Smith, L, Sabiston, CM, Stubbs, B, et al. Association of leisure-time sedentary behavior with fast food and carbonated soft drink consumption among 133,555 adolescents aged 12-15 years in 44 low- and middle-income countries. Int J Behav Nutr Phys Act. (2019) 16:1–11. doi: 10.1186/S12966-019-0796-3/FIGURES/3
Keywords: soft drink, energy drink, Saudi Arabia, overweight, adults, consumption, survey, obesity
Citation: Aljaadi AM, Turki A, Gazzaz AZ, Al-Qahtani FS, Althumiri NA and BinDhim NF (2023) Soft and energy drinks consumption and associated factors in Saudi adults: a national cross-sectional study. Front. Nutr. 10:1286633. doi: 10.3389/fnut.2023.1286633
Edited by:
Zumin Shi, Qatar University, QatarReviewed by:
Anna Vittoria Mattioli, University of Modena and Reggio Emilia, ItalyTahra ElObeid, Qatar University, Qatar
Copyright © 2023 Aljaadi, Turki, Gazzaz, Al-Qahtani, Althumiri and BinDhim. This is an open-access article distributed under the terms of the Creative Commons Attribution License (CC BY). The use, distribution or reproduction in other forums is permitted, provided the original author(s) and the copyright owner(s) are credited and that the original publication in this journal is cited, in accordance with accepted academic practice. No use, distribution or reproduction is permitted which does not comply with these terms.
*Correspondence: Abeer M. Aljaadi, YW1qYWFkaUB1cXUuZWR1LnNh