 Xuanfei Zhang
 Jinrui Bai1†
 Haiquan Xu
95% of researchers rate our articles as excellent or good
Learn more about the work of our research integrity team to safeguard the quality of each article we publish.
Find out more
ORIGINAL RESEARCH article
Front. Nutr. , 25 October 2023
Sec. Food Policy and Economics
Volume 10 - 2023 | https://doi.org/10.3389/fnut.2023.1268436
This article is part of the Research Topic Added Sugar Consumption: Economic and Policy Perspectives for Improving Public Health View all 6 articles
Background: Excessive consumption of sugar-sweetened beverages (SSBs) is associated with increased risks of obesity and chronic diseases. To effectively control SSB consumption, several countries including Mexico, France, and the United Kingdom have implemented SSB taxes. However, research on SSB taxes in China is limited.
Objective: To assess the attitudes of Chinese residents toward the SSB tax and their willingness to pay the tax. Methods: Data were collected through a questionnaire survey among 881 respondents. The generalized ordered logit regression model and marginal effect analysis were used to analyze Chinese participants’ attitudes toward SSB tax and their willingness to pay it.
Results: The average monthly expenditure on SSBs was 44.8 ± 45.3 Yuan (RMB) (6.95 ± 7.02$), and 54.6% of residents supported the SSB tax; they were willing to pay, on average, 1.19 times the original price after additional tax. Age, physical exercise, self-rated health status, weight control plan, awareness of SSBs, children’s consumption of SSBs, and proximity to the nearest SSB outlet significantly influenced attitudes toward tax. Notably, SSB awareness had the greatest effect on tax attitudes, with a 17% increase in the probability of supporting SSB tax for every one-level increase in SSB awareness among residents.
Conclusion: Residents in China have attained a certain level of awareness of, support for, and willingness to pay SSB tax. However, promoting knowledge about the health effects of SSBs and conducting further research to evaluate the effect of SSB tax on obesity prevention in China is still essential.
Currently, the consumption of sugar-sweetened beverages is on the rise in various countries (1). In China, the rising beverage consumption led to a significant increase in beverage production, with sugar-sweetened beverages (SSBs) accounting for more than half of the Chinese beverage market (2). However, excessive SSB consumption is associated with increased risks of obesity, type 2 diabetes, cardiovascular disease, and other chronic diseases (3–5). Furthermore, SSB intake is linked to a decrease in calcium and other nutrient intake from milk (6). To address the problem of excessive SSB consumption, several countries including Mexico, France, and the United States have implemented SSB taxes since 2011. In France, a 3.3% decrease in soft drink sales was reported within 4 months of implementing taxes on drinks based on sugar content in 2012 (7). Similarly, in Mexico, a 12% reduction in SSB consumption occurred 1 year after implementing a tax of 1 peso/L on SSBs in 2014 (8). In Berkeley, USA, SSB consumption declined by 9.6% following the introduction of a 1¢/oz. tax on SSBs in 2015 (6). In 2016, the World Health Organization (WHO) recommended a 20% tax rate on SSBs for obesity prevention in member states (9). Although some studies have explored SSB taxation in China (10, 11), most of them have been qualitative and have focused on reviewing or analyzing foreign tax systems (10–15). The empirical research is rare. Only Chong et al. investigated Hong Kong residents’ willingness to pay the SSB tax and revealed week support among the residents, with only 60% of them supporting tax rates of 5–10% (16). The present study assessed the attitudes of Chinese residents toward the SSB tax and their willingness to pay this tax. Moreover, the factors influencing the residents’ attitudes toward the SSB tax were analyzed to provide a theoretical basis for SSB tax policy development in China.
A web-based survey was conducted on the Credamo data research platform, which is a one-stop professional survey and experiment tool online. Before the formal survey, three pilot studies were implemented to revise and refine the questionnaire and determine the required sample size. The three pilot studies were conducted among 60, 34, and 67 participants respectively, totaling 161 participants with 60 Credamo users online and 101 participants in person. The results of the pilot surveys indicated the high reliability and validity of the questionnaire, with Cronbach’s coefficient and a Kaiser–Meyer–Olkin value of 0.807 and 0.819, respectively. By combining the pilot data and using a sample size formula for estimating the overall mean, the sample size was estimated to be 800. The participants were recruited through the Credamo data research platform and the questionnaire was mainly distributed online in 2021, with participants spanning across the provinces of Chinese mainland. The formal questionnaire consisted of 29 questions, and the pilot studies showed that it took about 5 min to complete the questionnaire. The questionnaire comprises three main sections: general characteristics information (such as gender, age, height, weight, education level, income, exercise habits, and self-rated health), expenditure on SSB consumption, and attitudes toward SSB taxes (including beverage awareness, attitudes toward taxation, and willingness to pay taxes). Invalid questionnaires were identified and excluded using specific questions. Ultimately, a total of 1,121 questionnaires were collected online, and after exclusion of invalid questionnaires, 881 valid questionnaires were used for further analysis, resulting in an effective recovery rate of 78.59%.
To assess residents’ attitudes toward SSB consumption and SSB tax, two questions were used, which were rated on a 5-point Likert scale: “Do you think frequent SSB consumption is harmful to health?” and “Do you support additional tax on SSBs?” The residents’ willingness to pay the SSB tax was measured by asking, “How much would you be willing to pay for a bottle of 500-mL beverage with an original price of 3.5 RMB (0.54$) if taxes were included?” Overweight and obesity were defined according to the People’s Republic of China Health Standards-Adult Weight Determination (17). Frequent SSB consumption was defined as consuming SSBs ≥4 times a week (18). The annual per capita household income was categorized into low-income [< 20,000 RMB (3,093$)], middle-low-income [20,000–50,000 RMB (3,093–7,733$)], middle-income [50,000–80,000 RMB (7,733–12,372$)], middle-high-income [80,000–110,000 RMB (12,372.00-17,0112$)], and high-income [> 110,000 RMB (17,0112$)] groups according to the order from low to high. Different regions were classified as eastern, central, and western according to the National Bureau of Statistics (19).
The logit regression model was employed to analyze the factors influencing Chinese residents’ attitudes toward the SSB tax. The residents’ attitude toward the SSB tax (W) was considered an ordered discrete variable, with values ranging from 1 to 5. The generalized ordered logit model was used in this study (20), which allows the relaxation of the parallel line assumption and captures the order information of dependent variables. The greater value of positive model regression coefficients in the model indicate a higher likelihood of residents supporting the SSB tax, and the greater value of the negative coefficients indicate a higher likelihood of residents opposing the SSB tax. The explanatory variables were classified into three types: socioeconomic characteristics, including sex, age, income, education level, residence, student status (be student or not), and whether their major or job was food nutrition-related; health status, including body mass index (BMI), physical exercise frequency, self-assessed health status, and intention or behavior to lose weight in the past year; and SSB consumption, including average monthly SSB consumption expenditure, attitude toward regular consumption of SSBs, frequency of SSB consumption among children and adults in the household, and distance to the nearest SSB outlet. Model fitting was performed using the maximum likelihood ratio test.
The estimation of coefficients in the generalized ordered logit regression model only provides information on the statistical significance and direction of the action of the variables. To gain a specific understanding of the effect of each variable on the dependent variable, the marginal effects must be calculated. The marginal effect represents the effect of a change in the independent variable on the probability of an individual selecting a specific category, with other factors maintained constant (21). The average marginal effects of each explanatory variable were calculated; this value represents the average of the marginal effects across different values of the explanatory variable. Statistical analysis was performed using Stata 15.0.
Among 881 respondents, 345 (39.2%) were men, and the majority of the respondents (56.6%) were from the eastern region. In terms of age distribution, the largest proportions were observed in the 21–25 years (39.3%) and 26–30 years (25.5%) groups. Urban residents accounted for 89% of the participants. Regarding the education level, 85.8% of the respondents had completed university education or higher. In terms of the annual household income, the majority of the study population had an annual household income between 20,000 and 80,000 RMB (3,093–12,372$) per capita (Table 1).
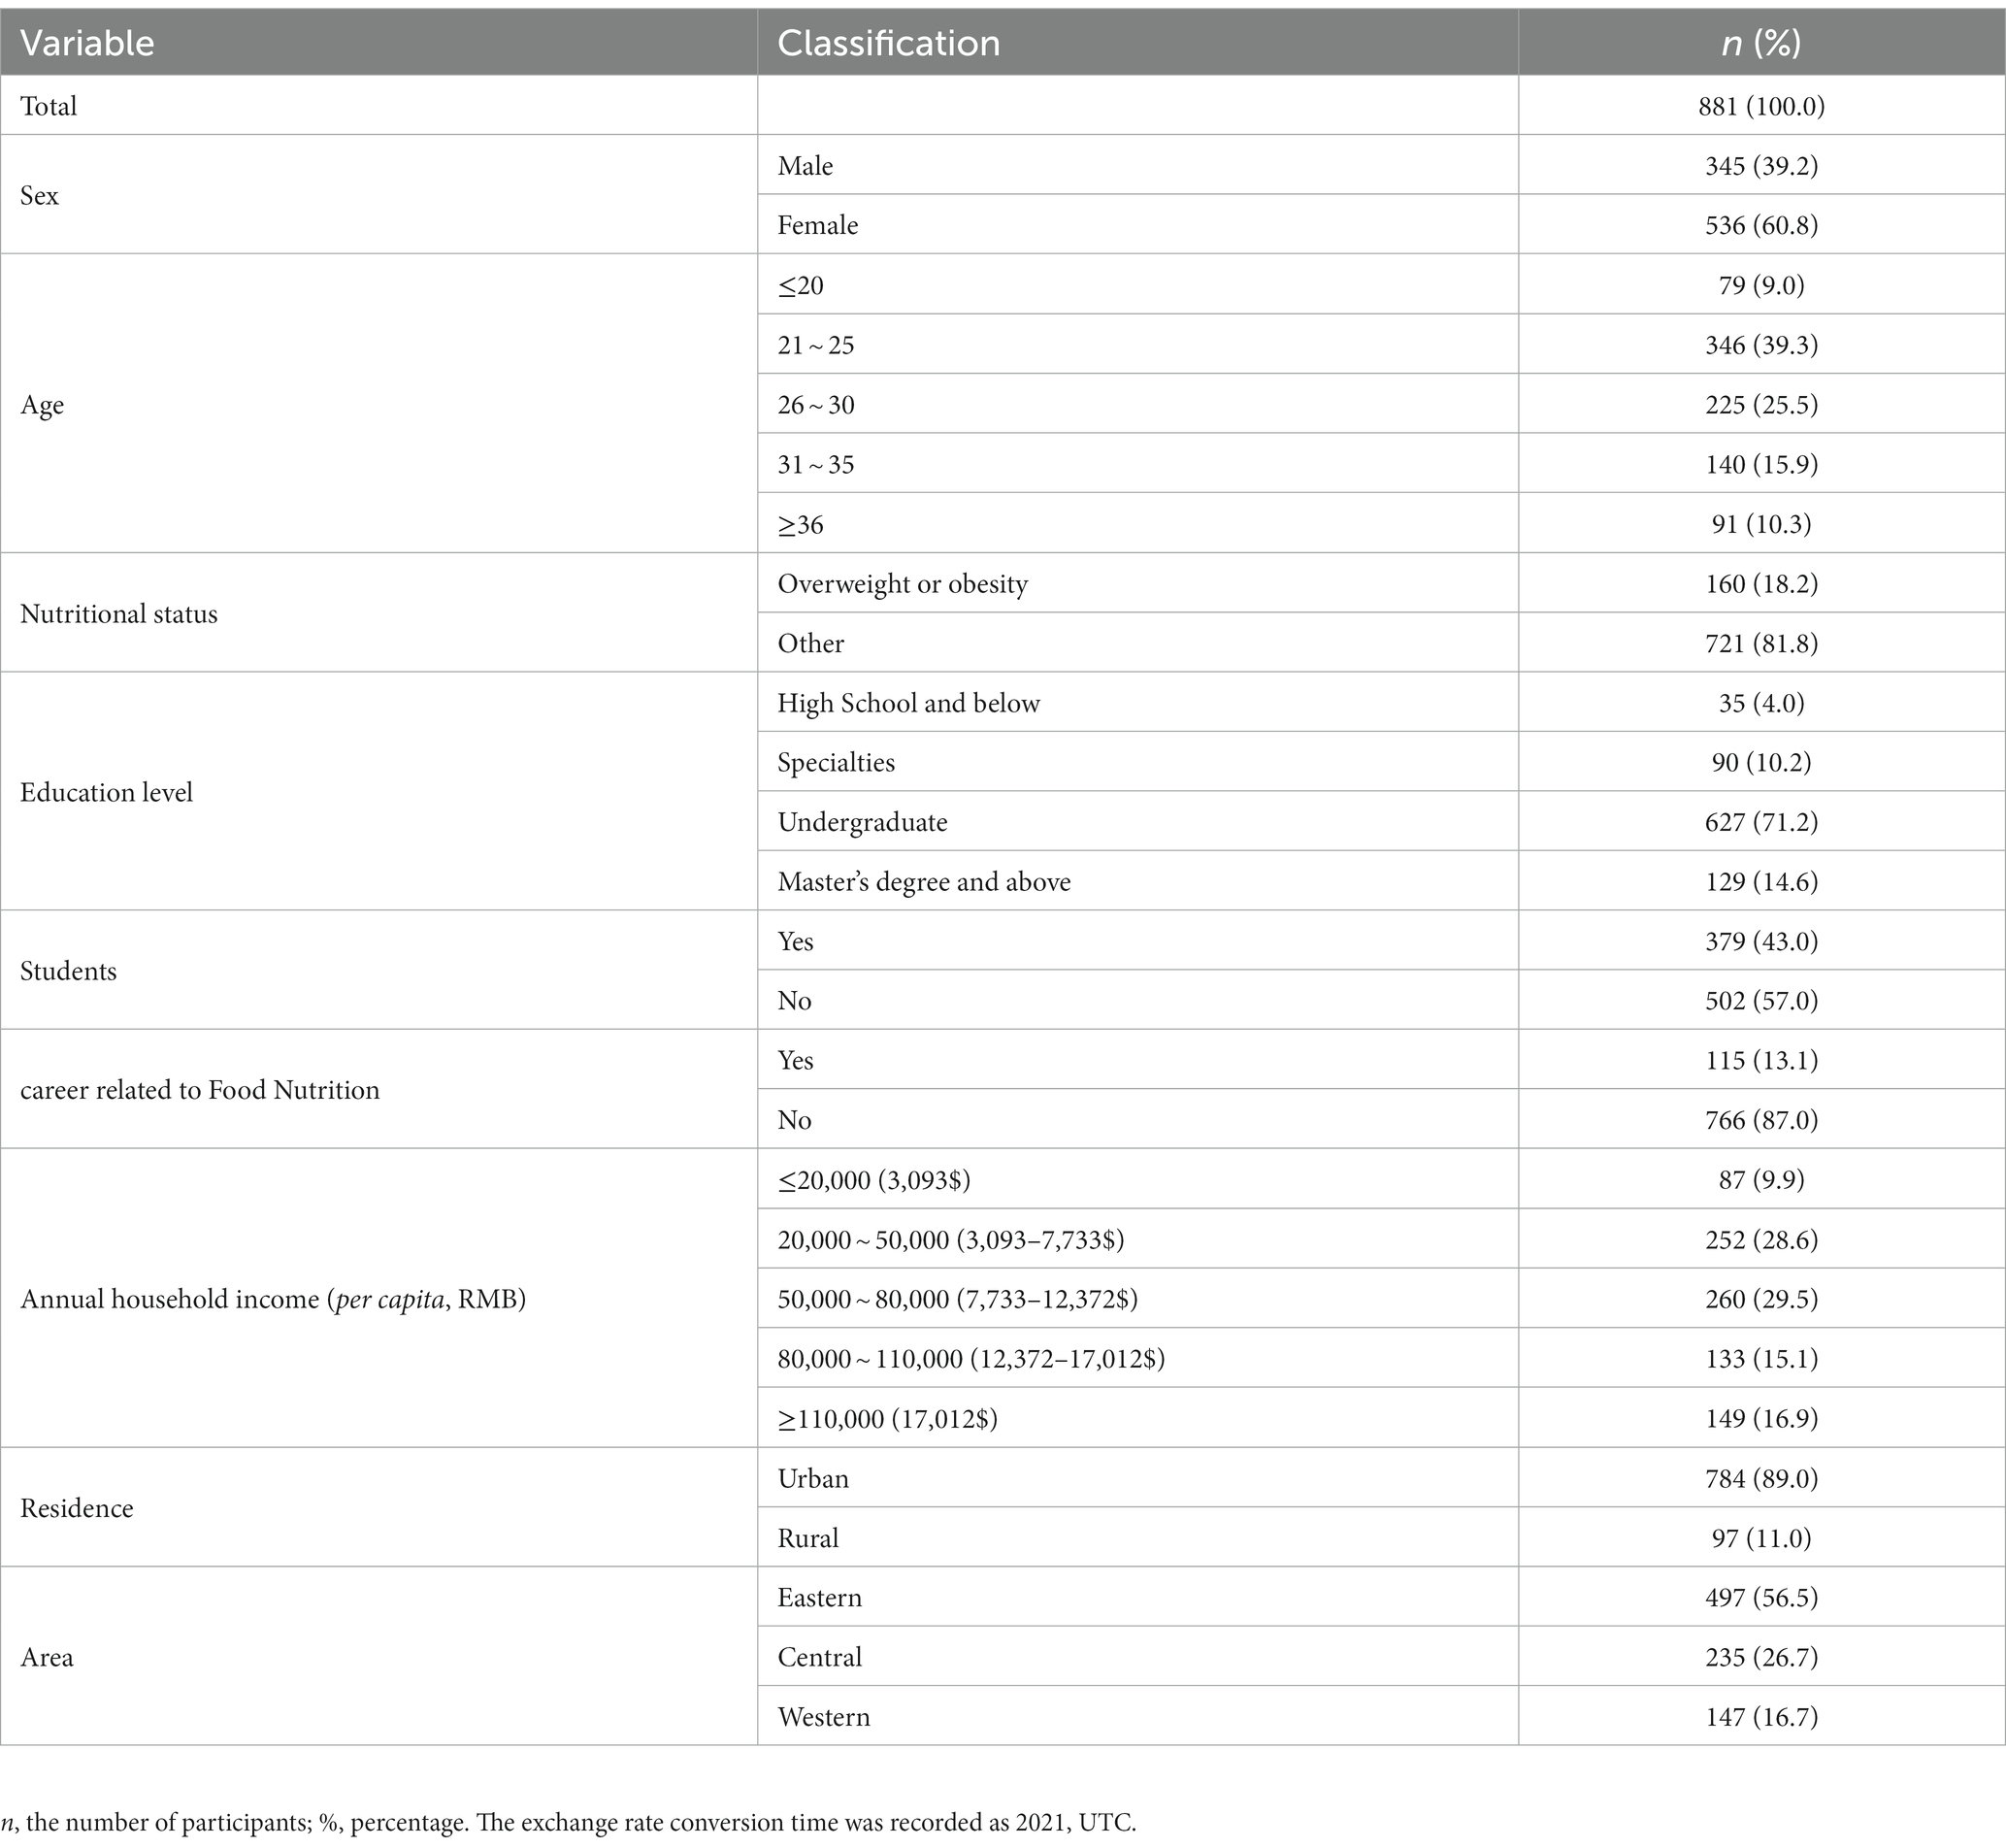
Table 1. Sociodemographic characteristics and nutritional status of Chinese adults evaluated in 2021 (n = 881).
The average monthly expenditure on SSBs was 44.8 ± 45.3 Yuan (RMB) (6.95 ± 7.02$), with a range of 0 (6.8% of participants) to 300 Yuan (0 to 46.39$). Notably, male residents had a significantly higher average expenditure on SSBs compared with female residents, with a difference of 8.98 Yuan (1.39$) (p < 0.01). Furthermore, overweight individuals (or obese individuals) had a higher average expenditure on SSBs [45.75 ± 46.03 Yuan ($7.09 ± 7.12)] than those who were not overweight [40.68 ± 41.65 Yuan (6.30 ± 6.45$)]. Urban residents had a slightly higher expenditure on SSBs than rural residents. Age, education level, and income level were found to play crucial roles in SSB expenditure (Table 2).
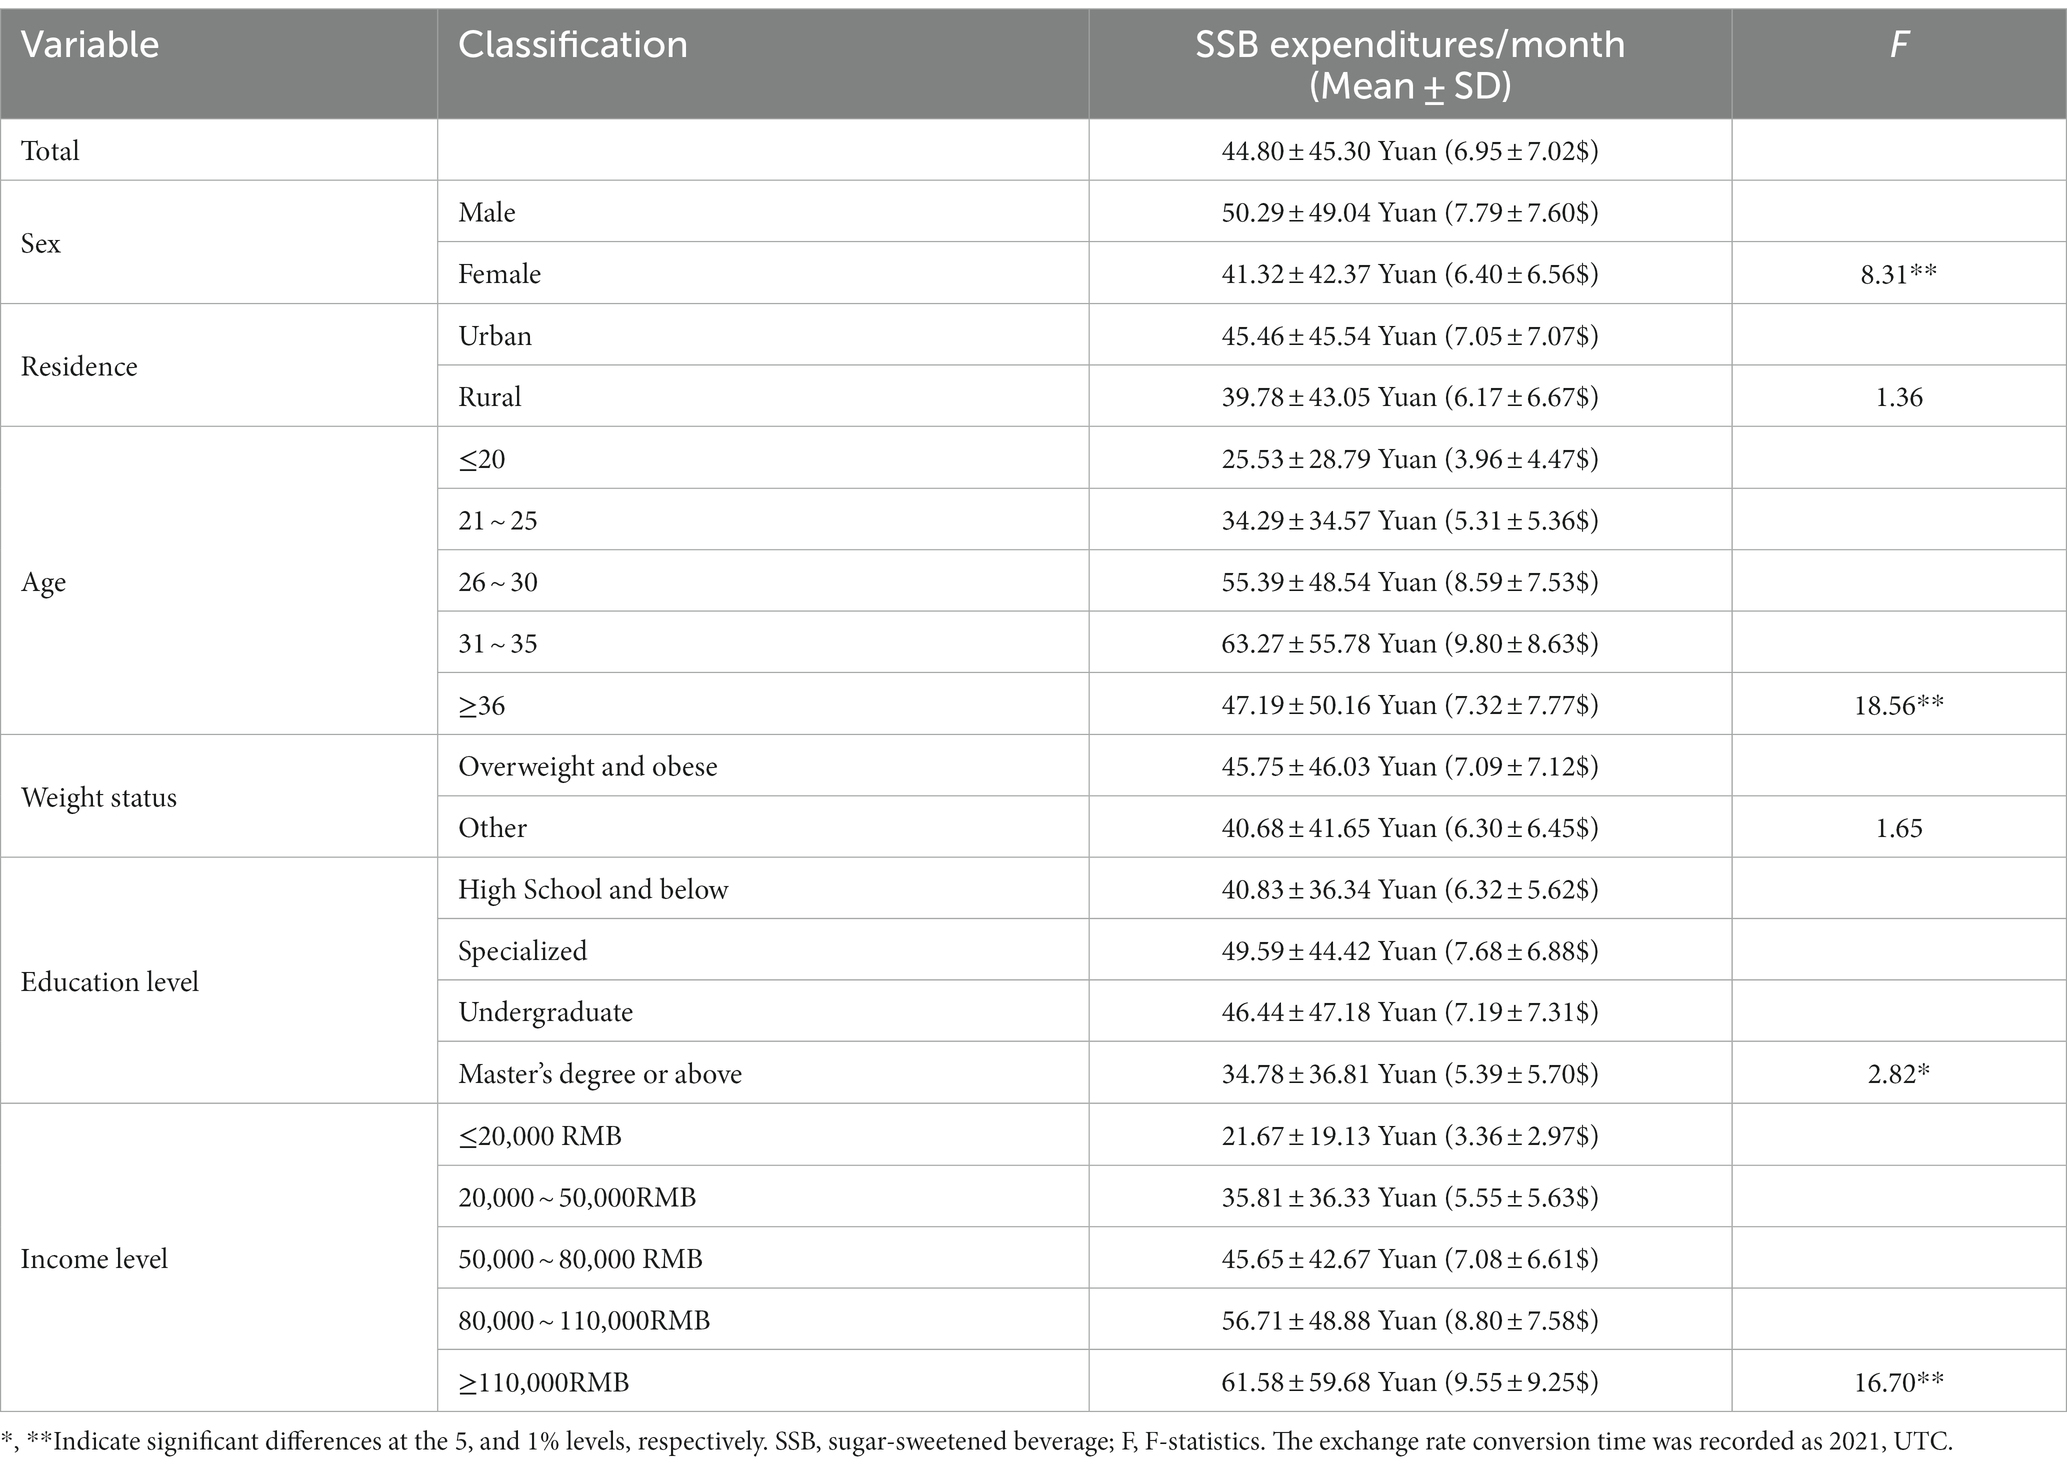
Table 2. Chinese adults’ expenditure on SSB according sociodemographic characteristics and nutritional status, 2021 (n = 881).
Among the residents surveyed, 53.1% believed that the regular consumption of SSBs influenced health, whereas 30.1% believed that it had a high influence. By contrast, only 0.57% believed that SSB consumption had no influence on health. Residents with a higher expenditure on SSBs were more likely to perceive that regular SSB consumption influences health. Significant differences were observed between sex and age groups. A greater proportion of women and older residents believed that regular SSB consumption had a greater impact on health compared with the men and younger counterparts (Table 3).
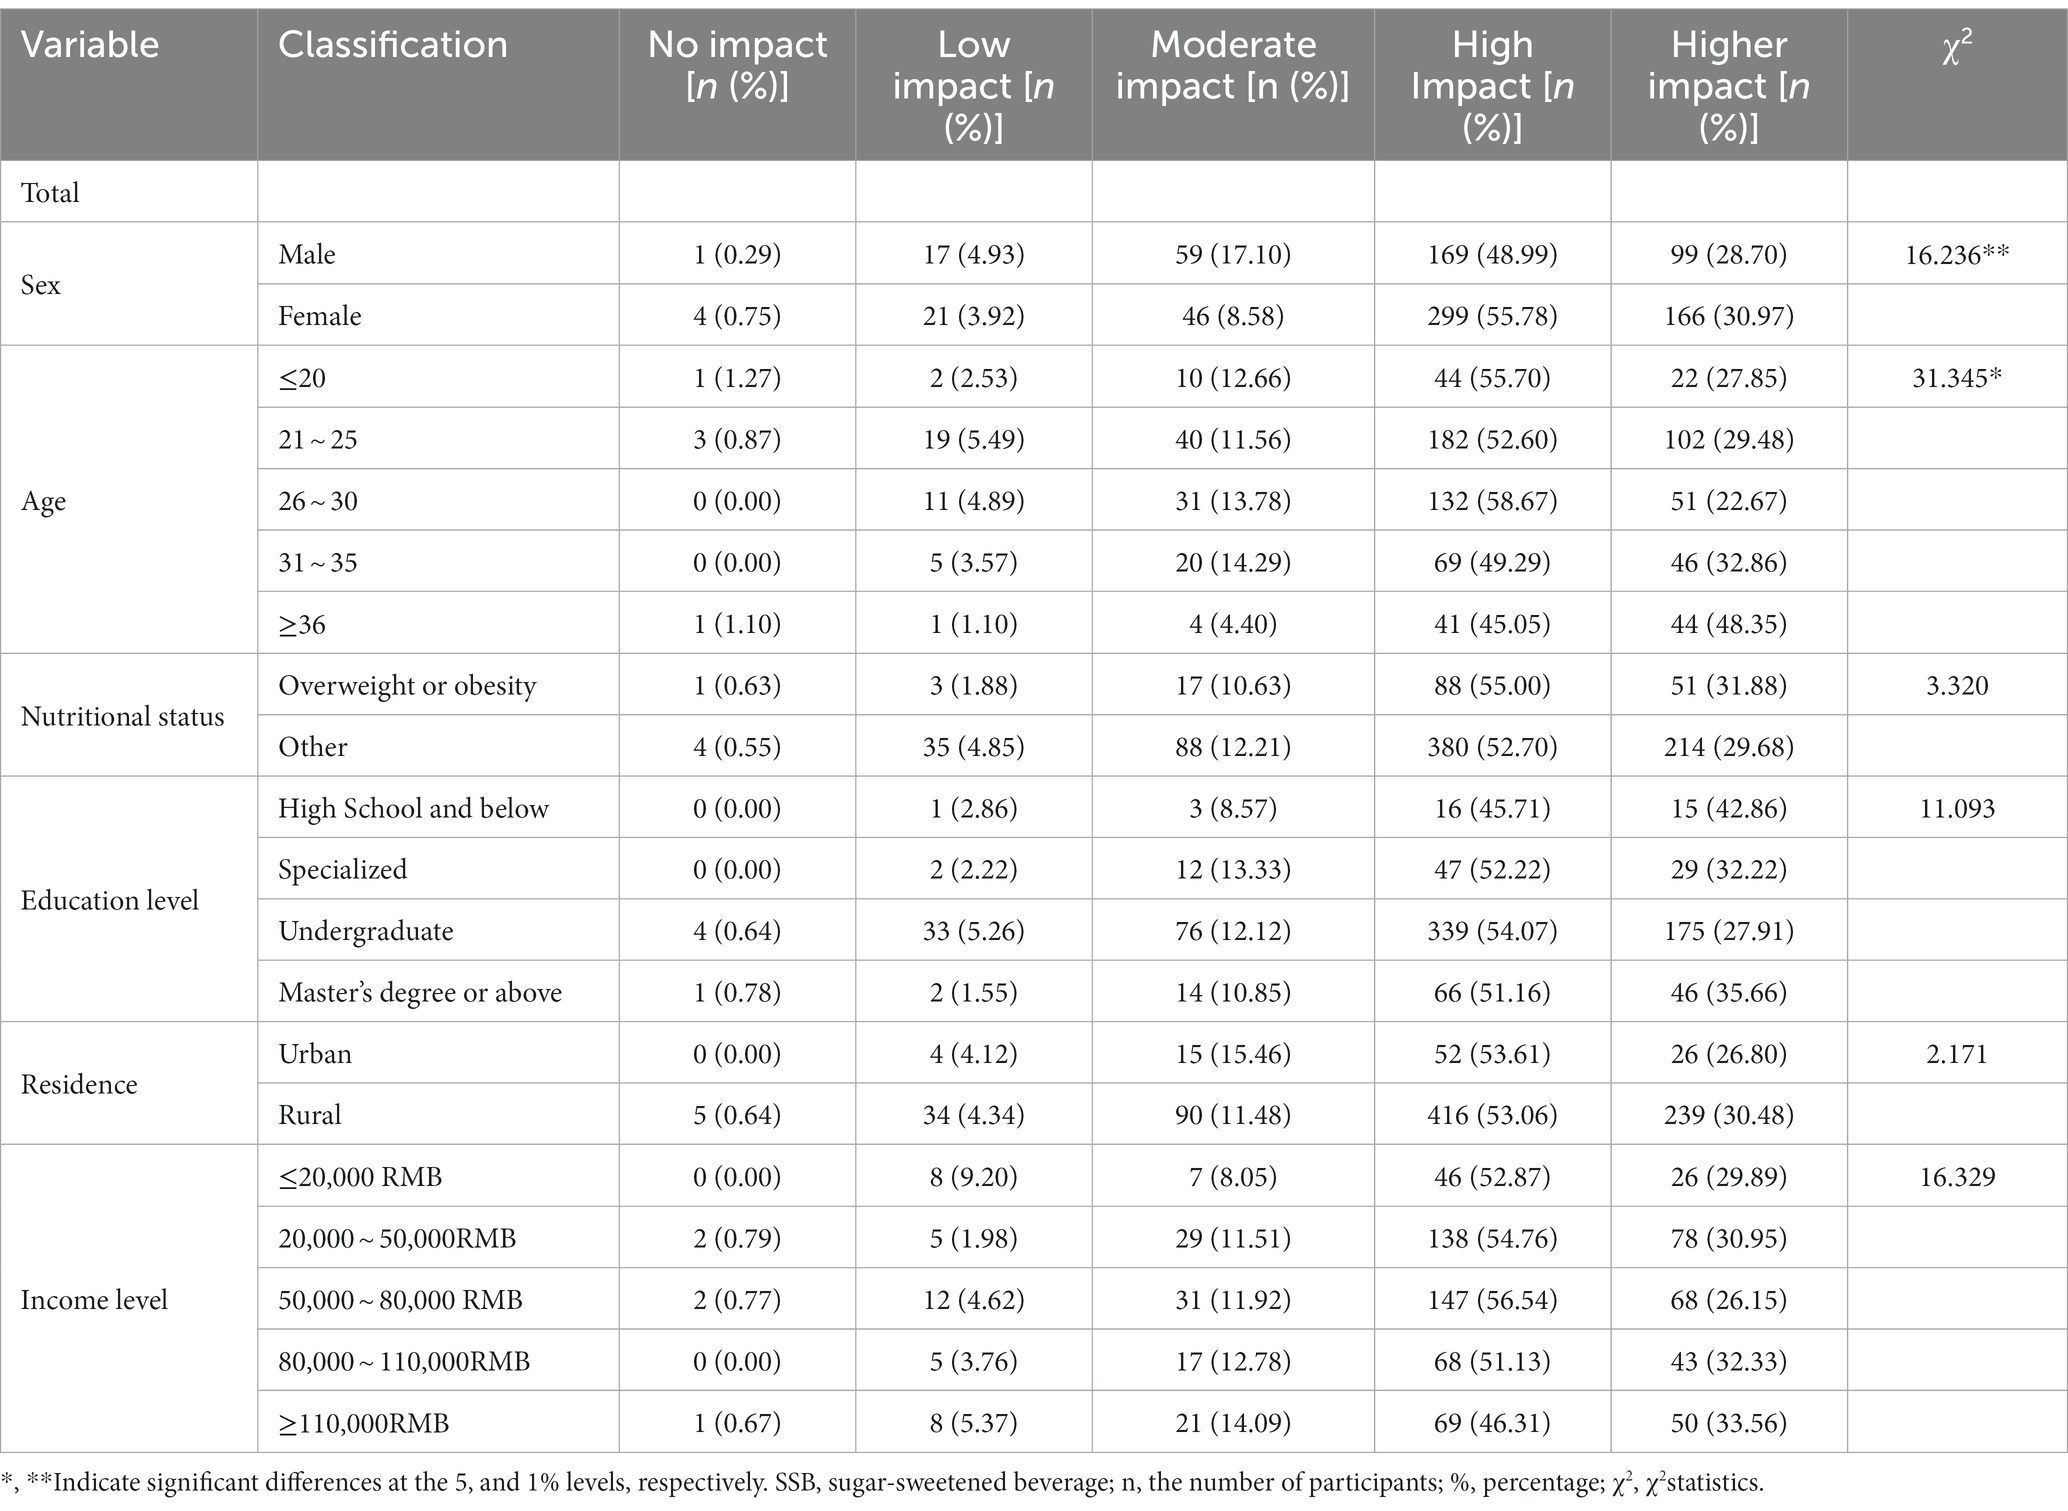
Table 3. Chinese adults’ attitudes toward the effects of regular SSB consumption on health according sociodemographic characteristics and nutritional status, 2021 (n = 881).
This study revealed that 54.6% of the participants supported or strongly supported the implementation of the SSB tax (16.1 and 38.5%, respectively). However, 6.0, 17.7, and 21.7% of the participants strongly disagreed, somewhat disagreed, and held neutral attitudes, respectively, in this regard. Significant differences were observed in the perceptions of the SSB tax among age groups and household income groups, with older residents and those with higher incomes being more supportive of the SSB tax compared with their counterparts (Table 4). Regarding the residents’ attitudes toward the SSB tax, the following groups were more supportive than their counterparts: older residents, residents who exercised more often, those who perceived themselves to be in better health, those with weight control plans, or those living with children who regularly consume SSBs. Furthermore, the respondents who lived further away from retail outlets were more likely to believed that SSBs had a greater impact on health and support the taxation of SSBs (Supplementary Tables S1, S2). Regarding the use of SSB tax revenues, the top three initiatives supported by respondents were child malnutrition (41.2%), child obesity (30.8%), and health education (14.7%).
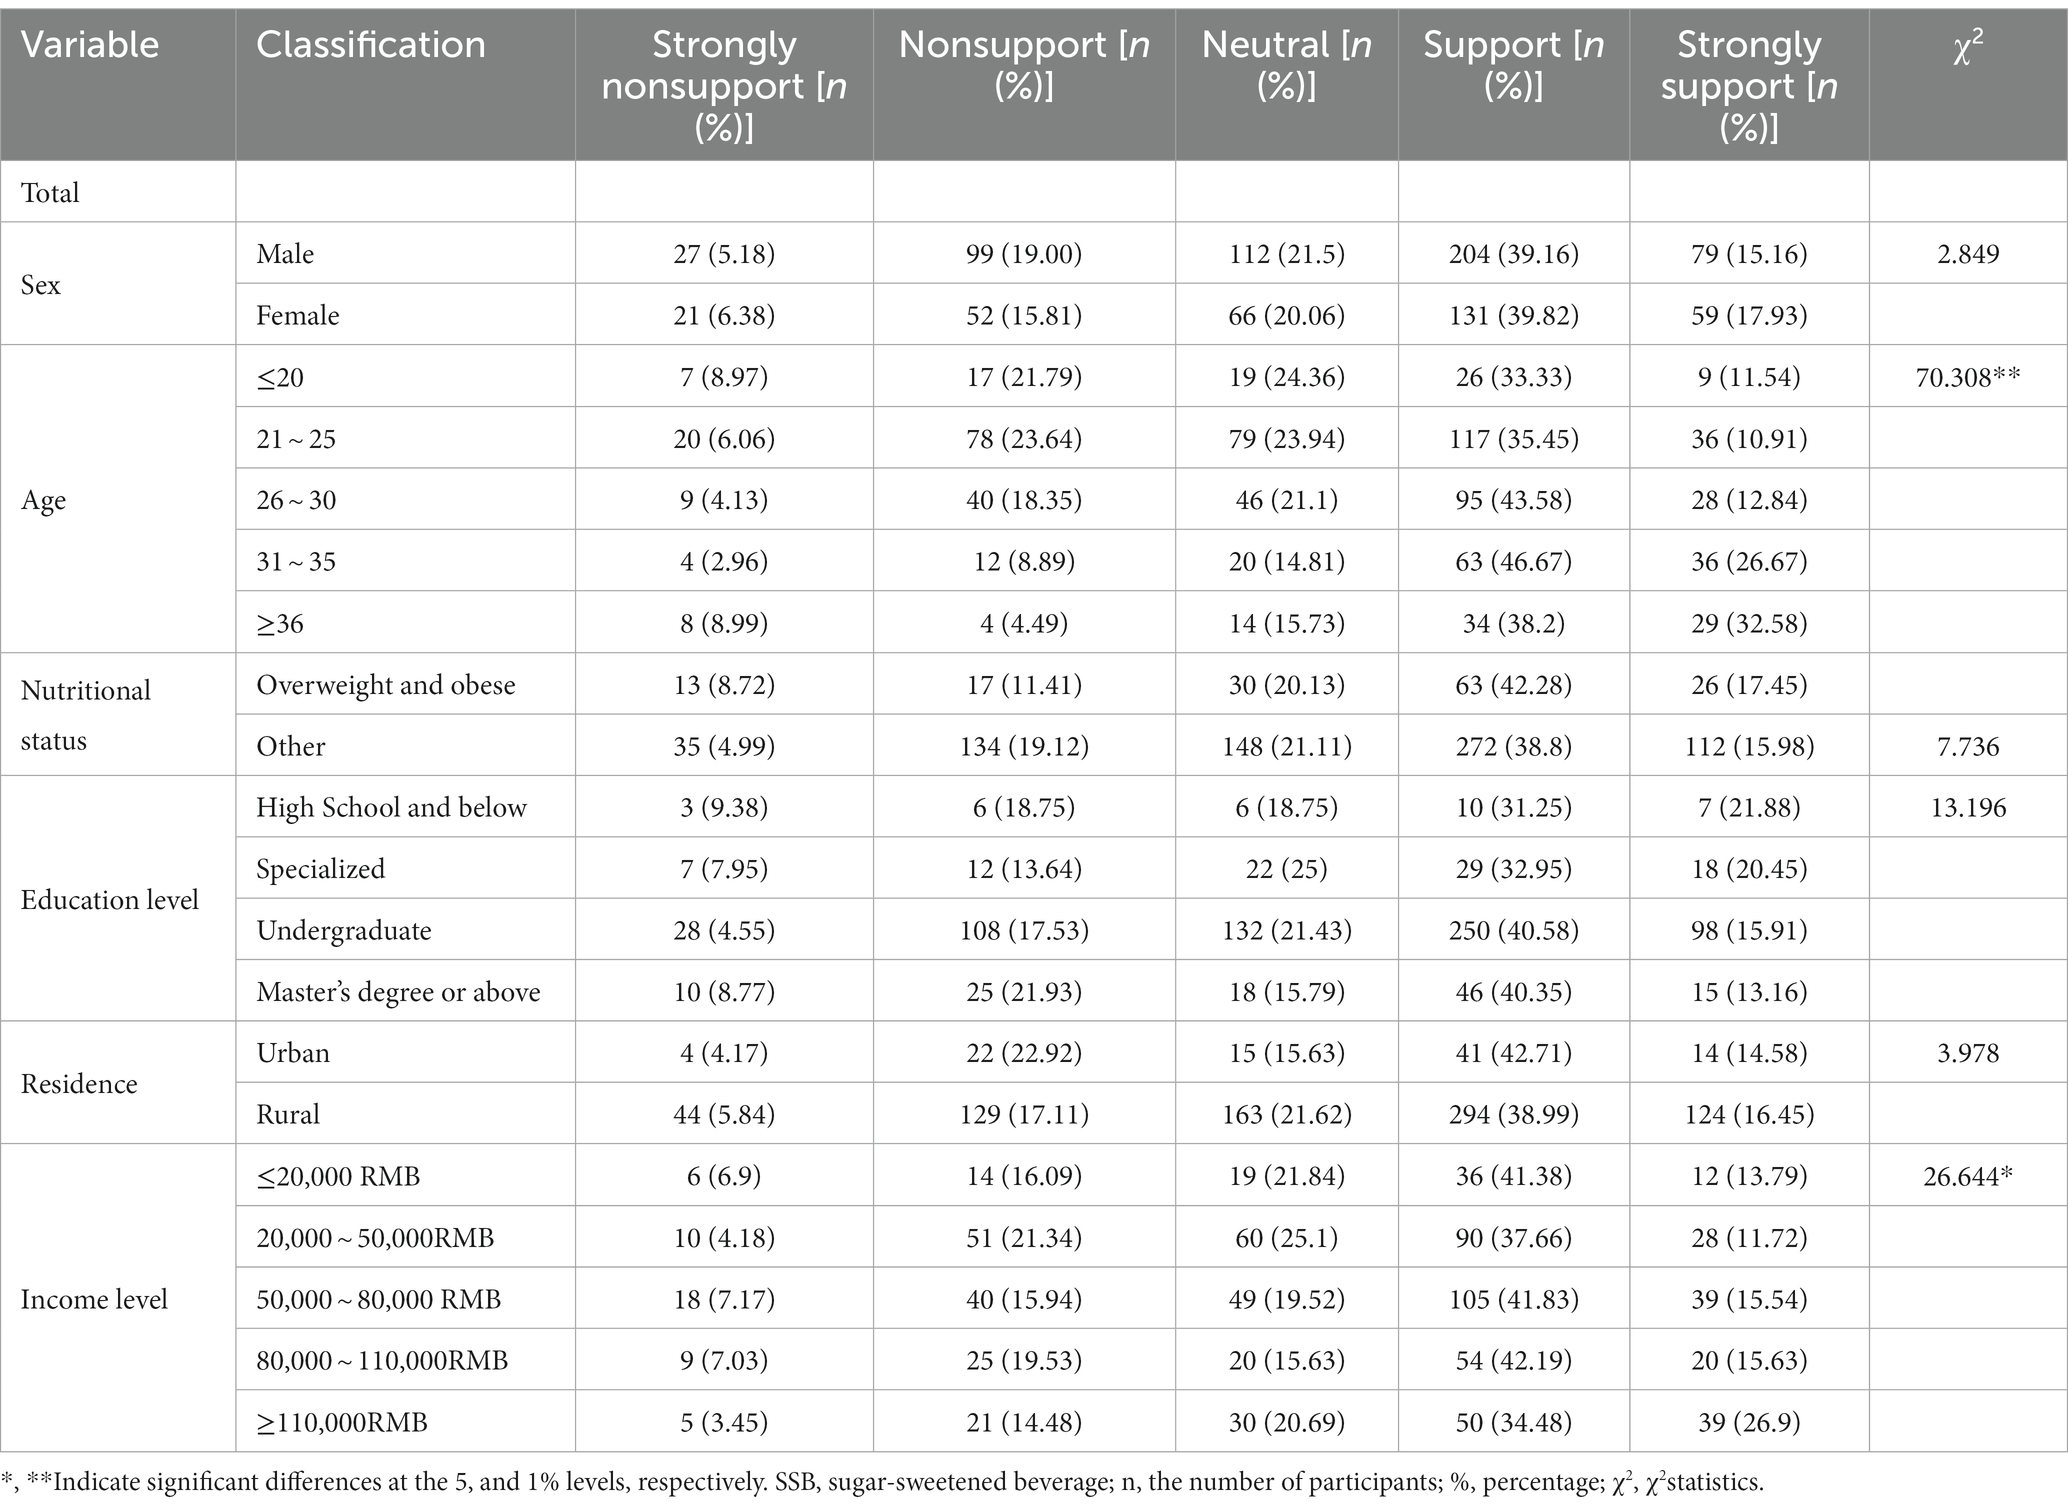
Table 4. Chinese adults’ attitudes toward SSB tax according sociodemographic characteristics and nutritional status, 2021 (n = 881).
Following the hypothetical implementation of a 20% SSB tax, 95.9% of the respondents indicated that their SSB purchase behavior would change. Among the respondents, 47.0% stated that they would significantly reduce their SSB purchases, 23.4% stated that they would reduce their purchases by half, 17.5% stated that they would slightly reduce their purchases, and 4.1% stated that they would completely stop purchasing SSBs. As SSB consumption decreased, the consumption of alternative beverages increased. The alternatives to SSBs that could be selected by the respondents included milk tea drinks, milk and yogurt, 100% fruit and vegetable juices, mineral water, sugar-free or low-sugar beverages, desserts and candies, and fruits, among which the top three choices were milk and yogurt (47.5%), water (17.4%), and sugar-free beverages (13.5%).
The proportions of the respondents who were willing to pay more than 5.0, 4.5, and 4.0 Yuan (0.77, 0.70, and 0.62$) for a 500-mL bottle of beverage with an original price of 3.50 Yuan (0.54$) were 14.51, 20.58, 81.52%, respectively. The respondents were willing to pay 4.16 Yuan (0.64$) on average. If the tax is fully passed on to consumers, the tax rate would be approximately 19% based on the price increase from 3.50 Yuan to 4.16 Yuan. As the tax rate increases, some consumers may reduce their consumption of SSBs. Furthermore, the attitude toward the SSB tax was significantly positively correlated with the maximum willingness to pay the tax (Table 5).
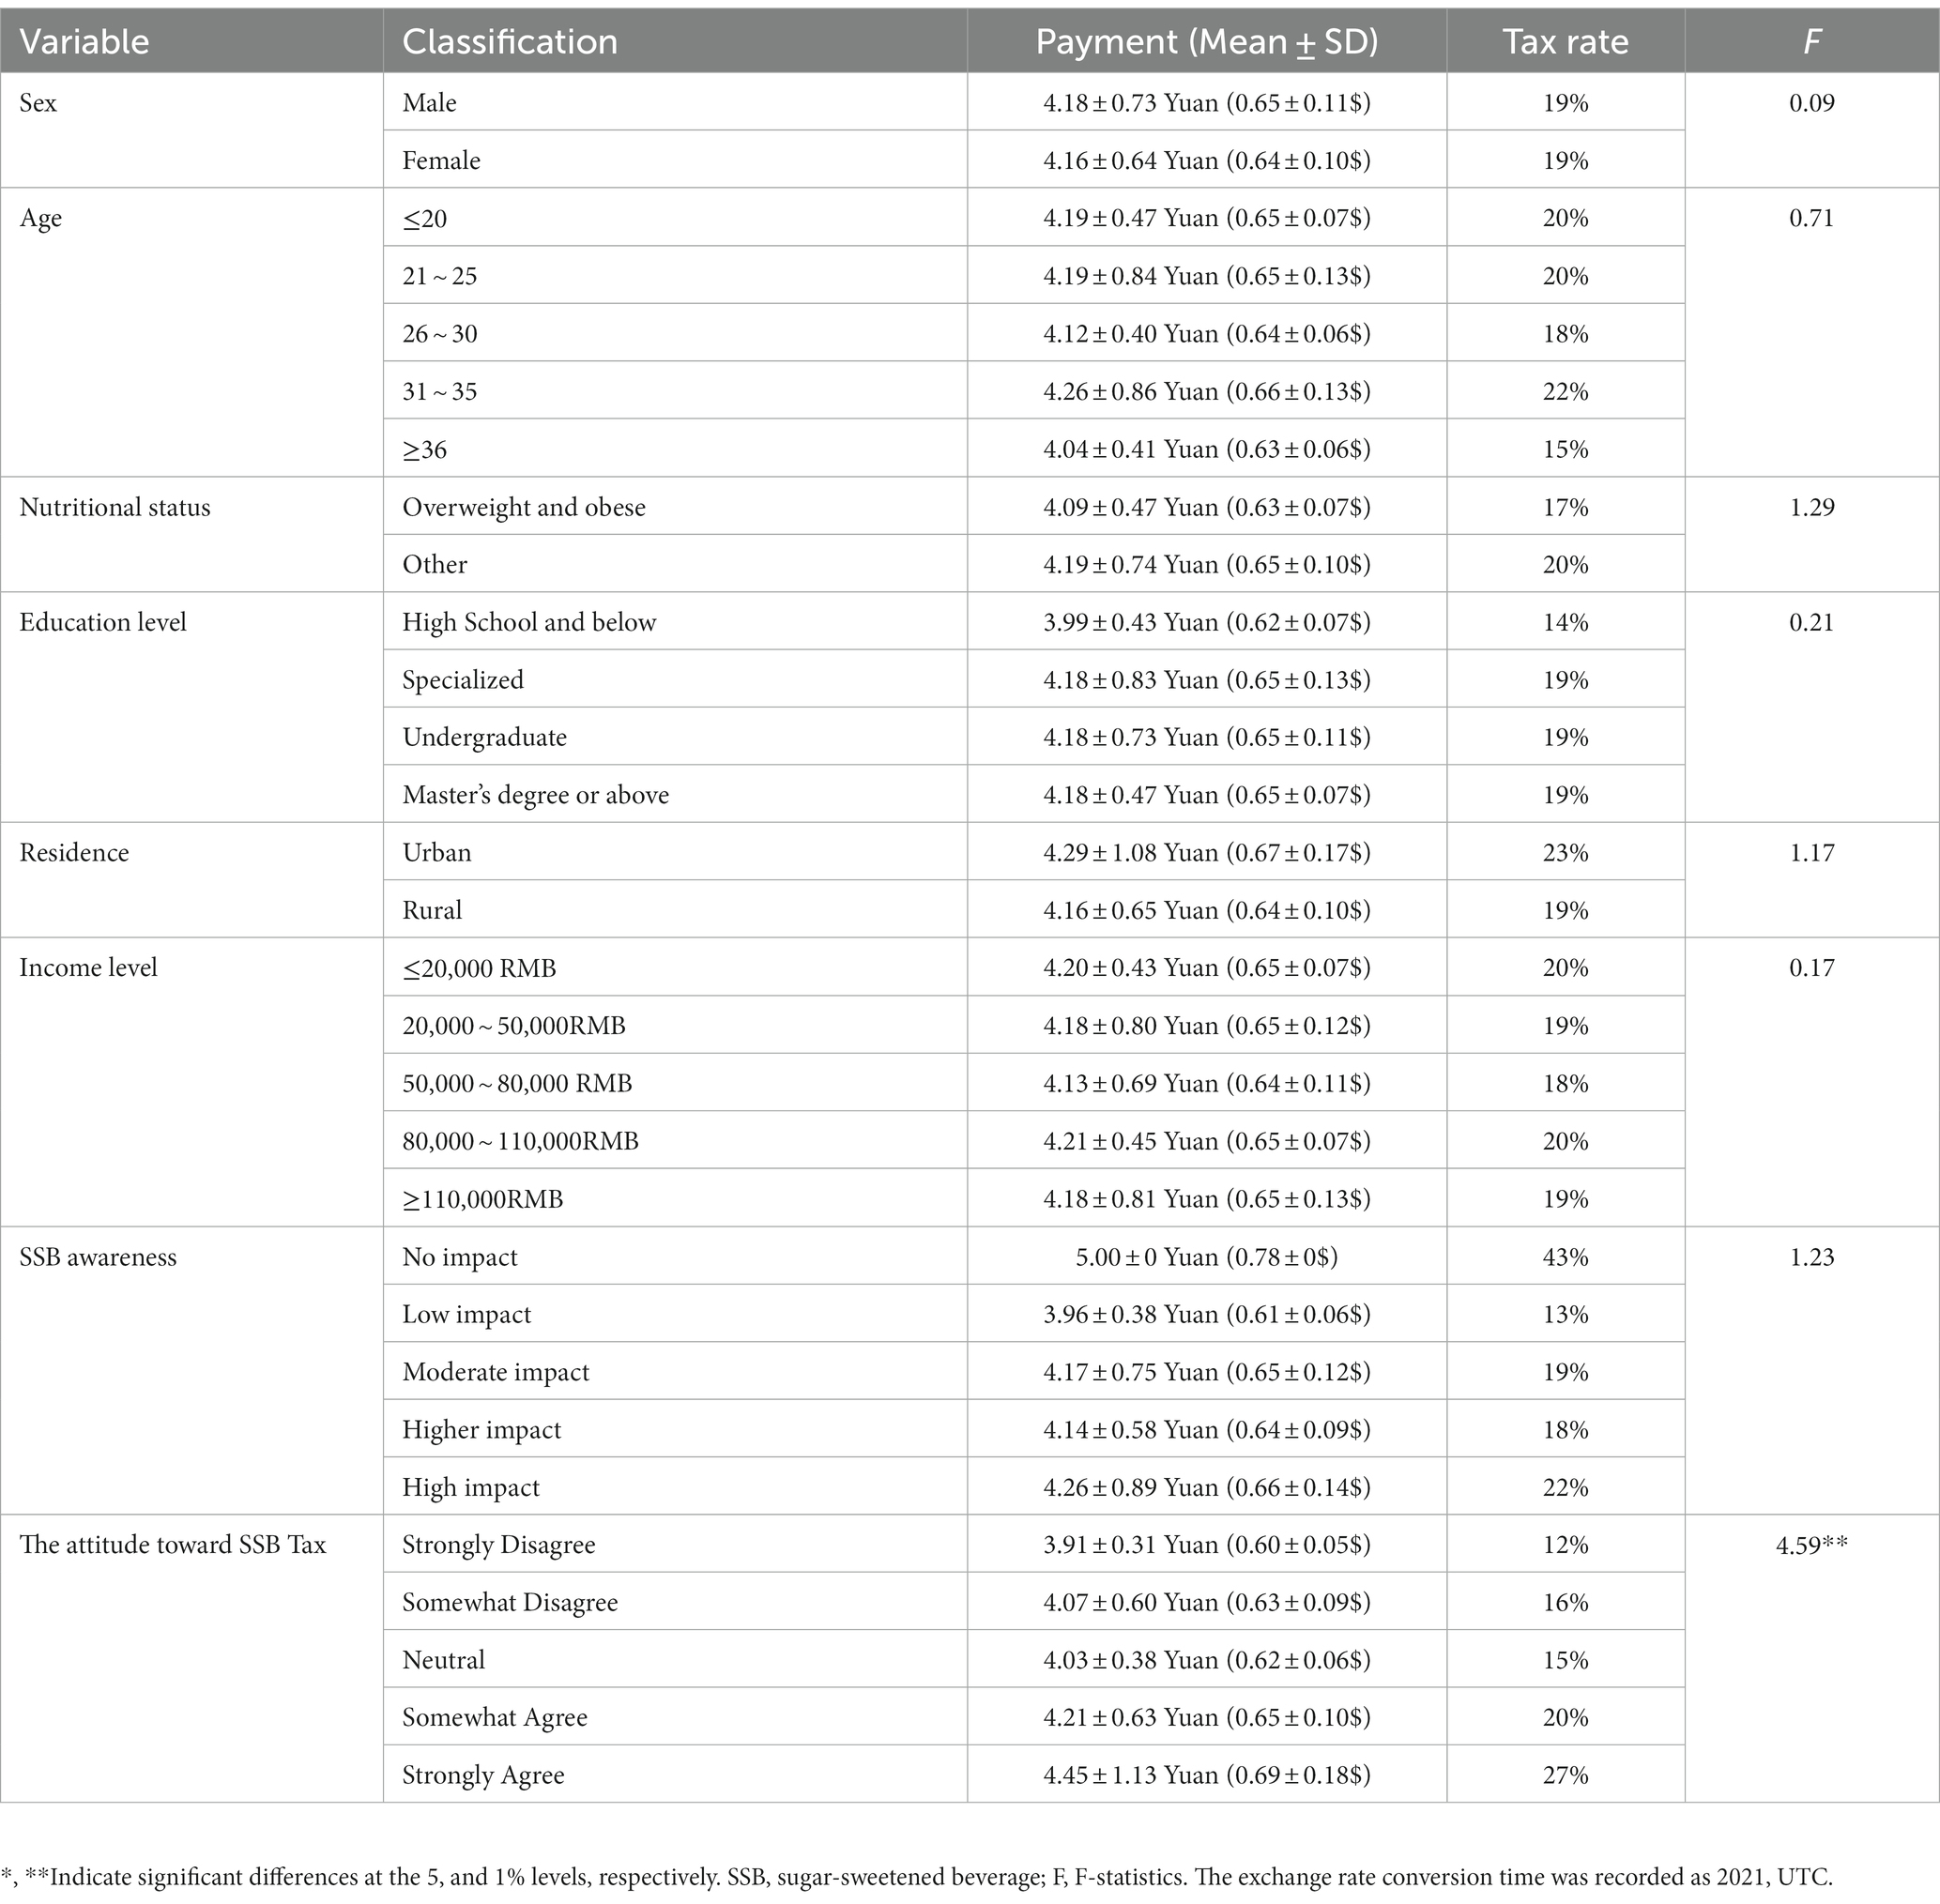
Table 5. Average willingness of Chinese adults with sociodemographic characteristics and nutritional status to pay for SSB, 2021 (n = 881).
The marginal effect analysis revealed that for every one-level increase in SSB awareness (the resident’s perception of the health effects of regular SSB consumption), the probability of somewhat disagreeing and being neutral decreased by 6.5 and 5.9%, respectively, whereas the probability of being supportive of the SSB tax increased by 17%. Frequent SSB consumption by adults in the household increased the probability of more opposition of the tax by 6.6% and reduced the probability of providing more supportive of the tax by 9.7%. An increase of one level in the distance to the nearest SSB outlet resulted in a 4.9% increase in the probability of somewhat agreeing. Moreover, it led to a decrease of 4.2% in the probability of somewhat disagreeing and a decrease of 3.6% in the probability of being neutral. Furthermore, a one-level increase in physical exercise frequency resulted in a 4.9% increase in the probability of somewhat agreeing and a 3.9% increase in the probability of strongly agreeing. For self-assessed health status, an increase of one level led to a 4.9% increase in the probability of strongly agreeing. Regarding age, for every 1-year increase, the probability of somewhat disagreeing decreased by 1%, whereas the probability of somewhat agreeing and strongly agreeing increased by 0.6 and 0.3%, respectively. Lastly, the probability of rural residents being neutral was 11.2% higher than that for urban residents (Table 6).
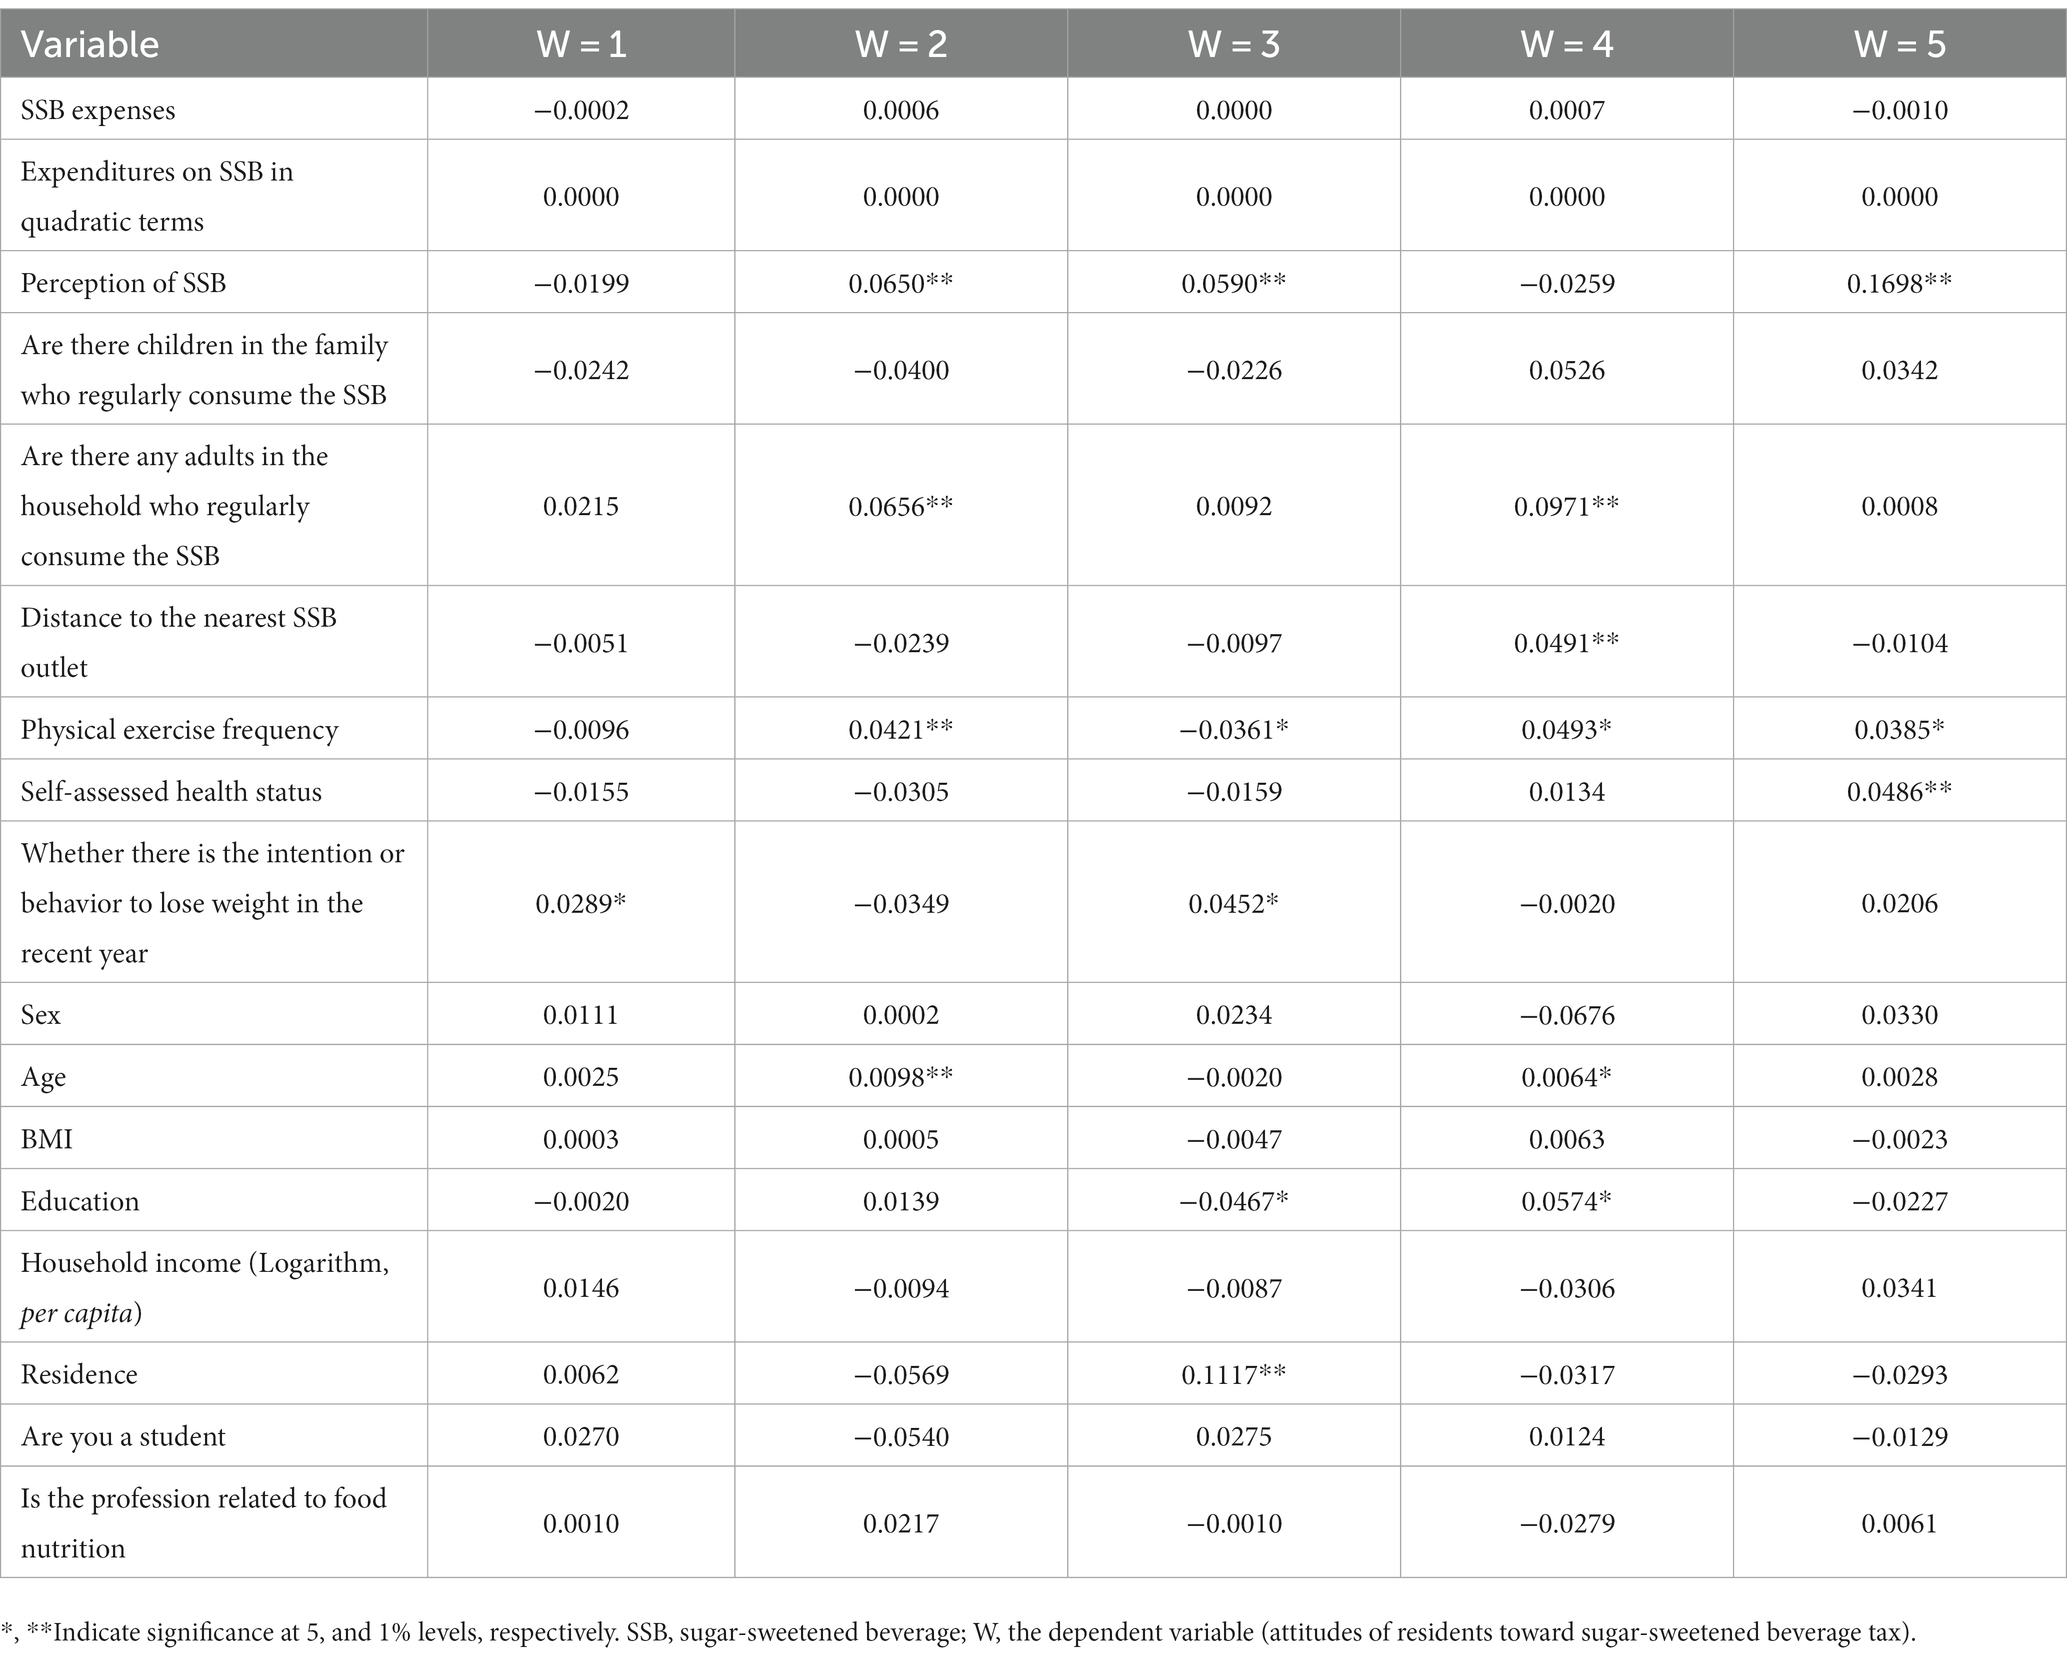
Table 6. Marginal effects of explanatory variables under different thresholds for Chinese adults according sociodemographic characteristics and nutritional status, 2021 (n = 881).
The study results revealed that more than half of the consumers expressed support or strong support for the implementation of SSB taxation. The maximum SSB tax, including additional tax, that they were willing to pay 1.19 times the original price, equivalent to a tax rate of 19%. Moreover, age and income significantly influenced the attitudes toward SSB taxation. Furthermore, older individuals or those with higher income levels demonstrated greater support for the SSB tax compared with their counterparts.
SSB consumption is associated with increased energy intake (5), particularly among children and adolescents. SSB overconsumption has been recognized as a potential contributor to overweight or obesity (5, 8). To reduce SSB consumption, many countries have implemented the SSB tax as a policy intervention. However, in China, the SSB tax has not been implemented thus far (21). This is the first study to examine the attitudes and willingness of Chinese individuals to pay SSB tax.
Previous foreign studies have reported varying levels of support for SSB taxes, ranging from 35 to 50%, with some studies even reporting support levels exceeding over 60%. Additionally, when tax revenues were used for specific purposes such as obesity prevention, community fitness facilities subsidies, or other public health programs, the support proportion increased by 13–26% (22–25). However, a survey conducted among rural Michigan residents in the United States revealed that most individuals expressed resistance, distrust, or indifference to SSB taxes (26). Compared with most foreign studies, the results of this study in China revealed a higher level of support for SSB taxes. This finding indicates that a social cognitive basis already exists for the implementation of SSB taxes in China, and the maximum tax rate acceptable is close to the rate of 20% recommended by the WHO.
The support for the SSB tax is influenced by various factors including age, BMI, and education level (27). The present study revealed that Chinese residents who lived with children who frequently consumed SSBs were more likely to support the tax. However, adults who themselves consumed SSBs frequently were more likely to oppose the tax. The marginal effect analysis also revealed that the probability of being supportive decreased by 9.7% for adults who regularly consumed SSBs. This finding suggests that children play a crucial factor in influencing adults’ attitudes toward SSB taxes. Parents are often more concerned about their children’s health and may be more supportive of tax policies that promote children’s health (28). Conversely, if tax policies negatively affect their consumption behavior, residents are more likely to oppose the tax. Notably, our findings differ from those reported by Michelle et al., who found that participants living with one or more adolescents were less supportive of SSB taxes compared with those without children or adolescents (22). Furthermore, the distance to the nearest SSB outlets had a significant positive effect on support for SSB taxes, as indicated by both the obtained regression coefficients and marginal effect analysis results. This finding suggests that easier access to SSBs increases the probability of the residents opposing the tax. Consequently, reducing the availability of SSBs in the environment, particularly in the building environment, may increase the residents’ support for SSB taxes.
Although the SSB tax has gained more attention as a potential intervention measure to address the increasing trend of obesity, experts have raised concerns regarding its effectiveness for obesity prevention in China at the present time. Additional intervention measures should also be considered for SSB retail control. China’s Healthy Oral Action Plan (2019–2025), issued in 2019, already includes measures to restrict SSB retailing and reduce the supply of SSBs in or around primary and secondary schools as well as kindergartens (29). To further strengthen regulatory efforts, mandatory punitive management measures could be implemented. For example, the Chengdu Education Bureau assesses the hygiene of primary and secondary schools (including kindergartens) by randomly checking the SSBs brought to school by students (30). In addition, vending machines in public places such as subways, shopping malls, children’s playgrounds, and hospitals should supply water and healthy beverages instead of SSBs.
To further address the problem of SSB consumption and promote healthier choices, enhancing nutrition knowledge is essential. Regular SSB overconsumption may lead to various health problems (31). Raising awareness about the negative health impacts of excessive SSB consumption and educating the public about the low nutritional quality and high energy content of SSBs are crucial. These goals can be achieved through various means, including increased public campaigns, particularly targeting primary and middle schools to avoid the habit of frequent SSB consumption among children. Increasing support for SSB taxes requires enhancing residents’ perception of the negative effects of SSBs and creating a public consensus on the need for SSB taxation. Factors such as physical activity level, health status, weight control plans, and perception of SSBs can positively influence attitudes toward SSB taxes. In addition, older individuals tend to prioritize health and are more supportive of SSB taxes; however, a study in Kansas, USA, revealed stronger support from younger age groups (32). In the present study, the marginal effect analysis revealed that a one-level increase in SSB awareness could increase the probability of supporting SSB taxes by 17%. Compared with other factors, increased SSB awareness could greatly promote tax support, which is consistent with the result of a study conducted in South Africa (33). Further research should be conducted on various aspects, including residents’ attitudes, countermeasures by enterprises, tax effects, and tax systems, which would provide a basis for the formulation of relevant policies. However, some specialties should be considered for tax in China, such as the form of tax payment.
This study explores residents’ attitudes and willingness to pay for SSB tax, laying the foundation for research in this field and providing practical evidence for relevant policy development. Nevertheless, this study has also several limitations that should be acknowledged. First, due to limited data availability, this study only obtained cross-sectional data for 2021; thus, changes in SSB consumption behavior over time could not be examined. Because SSBs can be addictive, longitudinal data collected at multiple time points would be more suitable for analyzing consumption patterns, so it’s better to have the longitudinal study for further research. Second, the sample primarily consisted of urban young individuals with higher levels of education, potentially resulting in sample bias and limiting the generalizability of the findings to the entire population. Third, the data collected in this study relied on self-reports and assumptions about the implementation of SSB taxes, rather than actual observations of behavior under fiscal measures. This may introduce social desirability bias.
This study revealed that support for the SSB tax among Chinese residents has reached a certain level, with a willingness to pay a tax rate of 19%. Several factors including age, physical activity, self-rated health status, weight loss plans, and awareness regarding the negative health effects of SSBs were found to influence attitudes toward SSB taxation. Age and income level significantly influenced attitudes toward taxation. Among these factors, the SSB perception had the greatest impact on attitudes toward the SSB tax, with every one-level increase in SSB perception increasing the probability of supporting the SSB tax by 17%. In conclusion, residents in China demonstrated awareness, support, and willingness to pay the SSB tax, indicating a favorable environment for implementing such a tax. However, it is still necessary to continue raising awareness about the health implications of SSB consumption and to conduct further research to assess the potential effects of SSB taxation on obesity prevention in China.
The original contributions presented in the study are included in the article/Supplementary material, further inquiries can be directed to the corresponding author.
Ethical review and approval was not required for the study on human participants in accordance with the local legislation and institutional requirements. Written informed consent from the [patients/participants OR patients/participants legal guardian/next of kin] was not required to participate in this study in accordance with the national legislation and the institutional requirements.
XZ: Conceptualization, Formal analysis, Writing – original draft, Writing – review & editing. JB: Conceptualization, Formal analysis, Writing – original draft, Writing – review & editing. MX: Conceptualization, Formal analysis, Investigation, Methodology, Writing – original draft, Writing – review & editing. JS: Conceptualization, Writing – review & editing. HX: Conceptualization, Investigation, Methodology, Writing – review & editing, Project administration.
The author(s) declare financial support was received for the research, authorship, and/or publication of this article. This research was funded by the Science and Technology Innovation Project of the Chinese Academy of Agricultural Sciences (grant number ASTIP2023), the Basic Research Grant for Nonprofit at the central level of China (grant number 1610422023001). The funders had no role in designing the study; in the collection, analysis, or interpretation of data; in the writing of the manuscript; or in the decision to publish the results.
The authors acknowledge the support of all team members. The authors also thank all the participants for their participation.
The authors declare that the research was conducted in the absence of any commercial or financial relationships that could be construed as a potential conflict of interest.
All claims expressed in this article are solely those of the authors and do not necessarily represent those of their affiliated organizations, or those of the publisher, the editors and the reviewers. Any product that may be evaluated in this article, or claim that may be made by its manufacturer, is not guaranteed or endorsed by the publisher.
The Supplementary material for this article can be found online at: https://www.frontiersin.org/articles/10.3389/fnut.2023.1268436/full#supplementary-material
1. Singh, GM, Micha, R, Khatibzadeh, S, Shi, PL, Lim, S, Andrews, KG, et al. Global, regional, and National Consumption of sugar-sweetened beverages, fruit juices, and Milk: a systematic assessment of beverage intake in 187 countries. PLoS One. (2015) 10:e0124845. doi: 10.1371/journal.pone.0124845
2. Ma, GS. Children's sugar-sweetened beverage consumption report. Beijing: Danone Nutrition Center, Chinese Center for Disease Control and Prevention (2019).
3. Abbasalizad Farhangi, M, Mohammadi Tofigh, A, Jahangiri, L, Nikniaz, Z, and Nikniaz, L. Sugar-sweetened beverages intake and the risk of obesity in children: an updated systematic review and dose-response meta-analysis. Pediatric Obesity. (2022) 17:12914. doi: 10.1111/ijpo.12914
4. JPT, A, EP, A, OSV, A, ATR, A, JAWB, B, and KRS, C. Consumption of sugar-sweetened beverages and obesity in snap-eligible children and adolescents. Prim Care Diabetes. (2020) 14:181–5. doi: 10.1016/j.pcd.2019.07.003
5. Brunkwall, L, Chen, Y, Hindy, G, Rukh, G, Ericson, U, Barroso, I, et al. Sugar-sweetened beverage consumption and genetic predisposition to obesity in 2 Swedish cohorts. Am J Clin Nutr. (2016) 104:809–15. doi: 10.3945/ajcn.115.126052
6. Silver, LD, Ng, SW, Ryan-Ibarra, S, Taillie, LS, Induni, M, Miles, DR, et al. Changes in prices, sales, consumer spending, and beverage consumption one year after a tax on sugar-sweetened beverages in Berkeley, California, us: a before-and-after study. PLoS Med. (2017) 14:e1002283. doi: 10.1371/journal.pmed.1002283
7. Berardi, N, Sevestre, P, Tepaut, M, and Vigneron, A. The impact of a `soda Tax' on prices. Evidence from French micro data. Working papers. (2012). doi: 10.2139/ssrn.2192470
8. Colchero, MA, Popkin, BM, Rivera, JA, and Ng, SW. Beverage purchases from stores in Mexico under the excise tax on sugar sweetened beverages: observational study. BMJ. (2016) 352:6704. doi: 10.1136/bmj.h6704
9. World Health Organization. Fiscal policies for diet and prevention of noncommunicable diseases. Geneva: World Health Organization (2016).
10. Zheng, MQ, Zhang, JF, He, HR, Xu, YF, and Ma, GS. Analysis on tax on sugary beverages in China. Food Nutr China. (2017) 23:38–41. doi: 10.3969/j.issn.1006-9577.2017.05.009
11. Fu, QQ, and Liu, AL. The tax types, tax rates and its impact on sugar-sweetened beverages. Food Nutr China. (2018) 24:9–13.
12. Li, JJ. Consumption tax, nutritional intake and health. Shanghai: Shanghai University of Finance and Economics (2020).
13. Ma, HT, and Wang, FR. There be an excise tax on sugary drinks? Based on the discussion of excise tax function. Collect Essays Finance Econ. (2021) 277:15–24. doi: 10.3969/j.issn.1004-4892.2021.10.002
14. Cai, H, Zhang, JF, Sun, JM, and Ma, GS. The tax on sugar-sweetened beverages in Mexico: a case study. Food Nutr China. (2018) 24:53–5. doi: 10.3969/j.issn.1006-9577.2018.02.012
15. Mi, YQ, Wu, J, and Liang, XF. Enlightenment from the sugar reduction policy at abroad on control and prevention of chronic diseases in China. Chinese Health Serv Manag. (2017) 34:247–8.
16. Chong, KC, and Wang, J. Willingness to pay for sugar-sweetened beverages tax in an affluent setting of Asia: a preliminary finding. Value Health. (2021) 24:S12-S. doi: 10.1016/j.jval.2021.04.064
17. China HaFPCotPsRo. Health industry standard of the People's Republic of China: Adult weight determination. Beijing: China Standard Press (2013).
18. You, LL, Yang, TT, Bai, Y, Chen, Y, Zhang, YM, and Wang, PY. Consumption pattern of liquid dairy products and soft beverages among pupils from nine areas in China. Chin J School Health. (2014) 35:1772–5.
19. China NBoSo. (2019). Wholesale and retail trade, accommodation and catering employment continues to expand – report no. 13 in the fourth National Economic Census Series. Available at: http://www.stats.gov.cn/xxgk/sjfb/zxfb2020/201912/t20191219_1767580.html
20. Wolfe, R, and Gould, W. An approximate likelihood-ratio test for ordinal response models. Stata Technical Bulletin. (1998) 7
21. Williams, R. Generalized ordered logit/partial proportional odds models for ordinal dependent variables. Stata J. (2006) 6:58–82. doi: 10.1177/1536867x0600600104
22. Eykelenboom, M, Van Stralen, MM, Olthof, MR, Renders, CM, Steenhuis, IH, and PEN, C. Public acceptability of a sugar-sweetened beverage tax and its associated factors in the Netherlands. Public Health Nutr. (2021) 24:2354–64. doi: 10.1017/s1368980020001500
23. Richardson, TE, Yanada, BA, Watters, D, Stupart, D, Lamichhane, P, and Bell, C. What young Australians think about a tax on sugar-sweetened beverages. Aust N Z J Public Health. (2019) 43:63–7. doi: 10.1111/1753-6405.12858
24. Julia, C, Mejean, C, Vicari, F, Peneau, S, and Hercberg, S. Public perception and characteristics related to acceptance of the sugar-sweetened beverage taxation launched in France in 2012. Public Health Nutr. (2015) 18:2679–88. doi: 10.1017/s1368980014003231
25. Sánchez-Escalonilla, SF, Fernández-Escobar, C, and Royo-Bordonada, MN. Public support for the imposition of a tax on sugar-sweetened beverages and the determinants of such support in Spain. Int J Environ Res Public Health. (2022) 19:3758. doi: 10.3390/ijerph19073758
26. Bombak, AE, Colotti, TE, Raji, D, and Riediger, ND. Exploring attitudes toward taxation of sugar-sweetened beverages in rural Michigan. J Health Populat Nutr. (2021) 40:36. doi: 10.1186/s41043-021-00259-6
27. Donaldson, EA, Cohen, JE, Rutkow, L, Villanti, AC, Kanarek, NF, and Barry, CL. Public support for a sugar-sweetened beverage tax and pro-tax messages in a mid-Atlantic us state. Public Health Nutr. (2015) 18:2263–73. doi: 10.1017/s1368980014002699
28. Hall, MG, Grummon, AH, Queen, T, Lazard, AJ, Higgins, ICA, Richter, APC, et al. How pictorial warnings change Parents' purchases of sugar-sweetened beverage for their children: mechanisms of impact. Int J Behav Nutr Phys Act. (2023) 20:1469. doi: 10.1186/s12966-023-01469-3
29. General Office of the National Health and Wellness Commission. Health and Health Commission Issued a Healthy Oral Action Program (2019–2025) (2019). Available at: https://www.gov.cn/xinwen/2019-02/16/content_5366239.htm
30. Bureau CE. (2015). Notice of the Chengdu education bureau on the issuance of the assessment criteria for the health work of primary and secondary schools (kindergartens) in Chengdu. Available at: http://edu.chengdu.gov.cn/cdedu/c113047/2015-09/10/content_94ed6adb18844d988b03112e65e4fcac.shtml
31. Shim, JS, Kang, NH, Lee, JS, Kim, KN, Chung, HK, Chung, HR, et al. Socioeconomic burden of sugar-sweetened beverages consumption in Korea. Nutr Res Pract. (2019) 13:134–40. doi: 10.4162/nrp.2019.13.2.134
32. Curry, LE, Rogers, T, Williams, P, Homsi, G, Willett, J, and Schmitt, CL. Public attitudes and support for a sugar-sweetened beverage tax in America's heartland. Health Promot Pract. (2017) 19:418–26. doi: 10.1177/1524839917709759
33. Essman, M, Zimmer, C, Carpentier, FD, Swart, EC, and Taillie, LS. Are intentions to change, policy awareness, or health knowledge related to changes in dietary intake following a sugar-sweetened beverage tax in South Africa? A before-and-after study. Int J Behav Nutr Phys Act. (2022) 19:136. doi: 10.1186/s12966-022-01370-5
Keywords: sugar-sweetened beverages, sugar-sweetened beverage tax, tax attitude, influencing factors, willingness to pay
Citation: Zhang X, Bai J, Xian M, Sun J and Xu H (2023) Attitudes of Chinese residents toward sugar-sweetened beverage tax and their willingness to pay: a cross-sectional survey. Front. Nutr. 10:1268436. doi: 10.3389/fnut.2023.1268436
Edited by:
Gemma Bridge, Independent Researcher, Leeds, United KingdomReviewed by:
Maryam Amini, National Nutrition and Food Technology Research Institute, IranCopyright © 2023 Zhang, Bai, Xian, Sun and Xu. This is an open-access article distributed under the terms of the Creative Commons Attribution License (CC BY). The use, distribution or reproduction in other forums is permitted, provided the original author(s) and the copyright owner(s) are credited and that the original publication in this journal is cited, in accordance with accepted academic practice. No use, distribution or reproduction is permitted which does not comply with these terms.
*Correspondence: Haiquan Xu, eHVoYWlxdWFuQGNhYXMuY24=
†These authors have contributed equally to this work
Disclaimer: All claims expressed in this article are solely those of the authors and do not necessarily represent those of their affiliated organizations, or those of the publisher, the editors and the reviewers. Any product that may be evaluated in this article or claim that may be made by its manufacturer is not guaranteed or endorsed by the publisher.
Research integrity at Frontiers
Learn more about the work of our research integrity team to safeguard the quality of each article we publish.