 Chen Yang1
 Wenjing Huang
 Tianlin Gao
 Feng Zhong
94% of researchers rate our articles as excellent or good
Learn more about the work of our research integrity team to safeguard the quality of each article we publish.
Find out more
ORIGINAL RESEARCH article
Front. Nutr., 19 October 2023
Sec. Nutrition and Sustainable Diets
Volume 10 - 2023 | https://doi.org/10.3389/fnut.2023.1259227
This article is part of the Research TopicNutrition and Sustainable Development Goal 3: Good Health and WellbeingView all 35 articles
Purpose: This study aimed to explore the association between health-related quality of life (HRQOL) and diet quality using three evidence-based dietary indices among older people in rural China.
Methods: This cross-sectional study included 1,258 rural older people (mean age 72.32 years; 55.6% female). HRQOL was assessed using the European Five Dimension Health Scale (EQ-5D), and dietary intake was assessed using a Food Frequency Questionnaire. Three dietary scoring indices, including the Alternate Healthy Eating Index, Dietary Approaches to Stop Hypertension, and Dietary Diversity Score (DDS), were calculated to assess and analyze the relationship between these dietary indices and quality of life.
Results: The EQ-5D score was 0.95 ± 0.10, and the EQ-Visual Analog Scale (VAS) score was 76.76 ± 14.44. All three groups with higher dietary indices had higher quality of life scores. After controlling for covariates in multivariate adjusted binary logistic regression analyzes, participants in the top tertile of DDS had higher quality of life scores than those in the bottom tertile. DDS was consistently associated with EQ-5D (Model 2: OR = 1.567, p = 0.001; Model3: OR = 1.351, p = 0.044) and EQ-VAS (Model 2: OR = 1.830, p < 0.001; Model 3: OR = 1.383, p = 0.047), significantly different from the other groups.
Conclusion: Older people in rural China who adhere to various foods experience a better quality of healthy life.
As the world’s population grows older, aging is becoming a serious social problem. By 2050, the number of people over 60 years worldwide will double from 1.4 billion in 2015 to 2.1 billion (1). According to the latest census results in China, 18.70 and 13.50% of the total population are aged ≥60 years old and ≥ 65 years old, respectively. The township population accounts for 36.11% of the total population (2). Due to urbanization, most young people start to work and live in the cities, while the older people remain in the rural areas (3). As a result, the quality of life of the elderly living in rural areas has attracted attention (4, 5). Older people in rural China generally have inadequate nutritional intake (6), which is extremely detrimental to their nutritional health (7). The risk of malnutrition among Chinese elders is 12.6% (8). Several cross-sectional and cohort studies have shown negative associations between healthy and adequate nutritional status and chronic disease risk (9–11). Additionally, nutrition is closely related to the health-related quality of life (HRQOL) of rural older people.
HRQOL is a multidimensional indicator of overall health. It can be defined as a composite confounding criterion of social relationships, personal emotions, independence, etc., significantly related to the quality of life consequences of an individual’s health status. Many scales can be used to evaluate the quality of a healthy life, such as the Brief Health Questionnaire, the World Health Organization (WHO) Quality of Life Scale (WHOQOL), and the Quality of Well-Being Scale (QWB) (12). Quality of life assessment tools for older adults include the 36-item Brief Health Status Inventory (SF-36), the European Five Dimension Health Scale (EQ-5D), and the WHOQOL. The EQ-5D has feasibility properties in the elderly population (13). The Chinese version of the EQ-5D scale has been widely used in China and has good reliability and validity (14). Therefore, we chose the EQ-5D to assess the quality of life of older people in China.
Adequate nutrition is an essential component of healthy aging (15). It is well known that the nutritional status of older people is critical to health. However, with increasing age and declining physical functions, older people may develop a loss of appetite and decreased ability to chew (16). This can lead to weight loss and malnutrition. Moreover, the income level of older people affects their nutritional status: research has shown that financial hardship is associated with nutritional problems (17). Most older people in rural China have low economic incomes, limiting their ability to afford a high-quality diet or maintain good nutrition. It is, thus, of significant interest to evaluate the dietary quality of older Chinese people in rural areas.
Diet Quality Index (DQI) is a common index to evaluate diet quality, such as the Mediterranean (MED) (18), the Alternate Healthy Eating Index (AHEI) (19), the Dietary Approaches to Stop Hypertension (DASH) (20), and the Dietary Diversity Score (DDS) (21). Existing studies have mostly analyzed the correlation between one DQI or different DQIs and different diseases (22–25). A large study investigated the association of diet quality, assessed by the AHEI, MEDAS, and DDS score, with health status (all-cause mortality, cardiovascular disease mortality or morbidity, cancer mortality or morbidity, type 2 diabetes, and neurodegenerative disease risk) (26). However, there are few studies on the relationship between quality of life and DQI in older people, especially in rural Chinese older people (27). In this study, three dietary index scores were selected to assess the quality of life of older people in rural China.
This cross-sectional study included 1,258 people (≧65 years) living in rural China. All participants in the study were volunteers who signed informed consent forms.
As shown in Figure 1, 1,280 older people were invited to this study (94.4% participation rate), and 22 participants were excluded because they could not complete all questionnaires. Therefore, data from 1,258 older people (mean age 72.32 ± 6.00 years; 55.6% female) were analyzed.
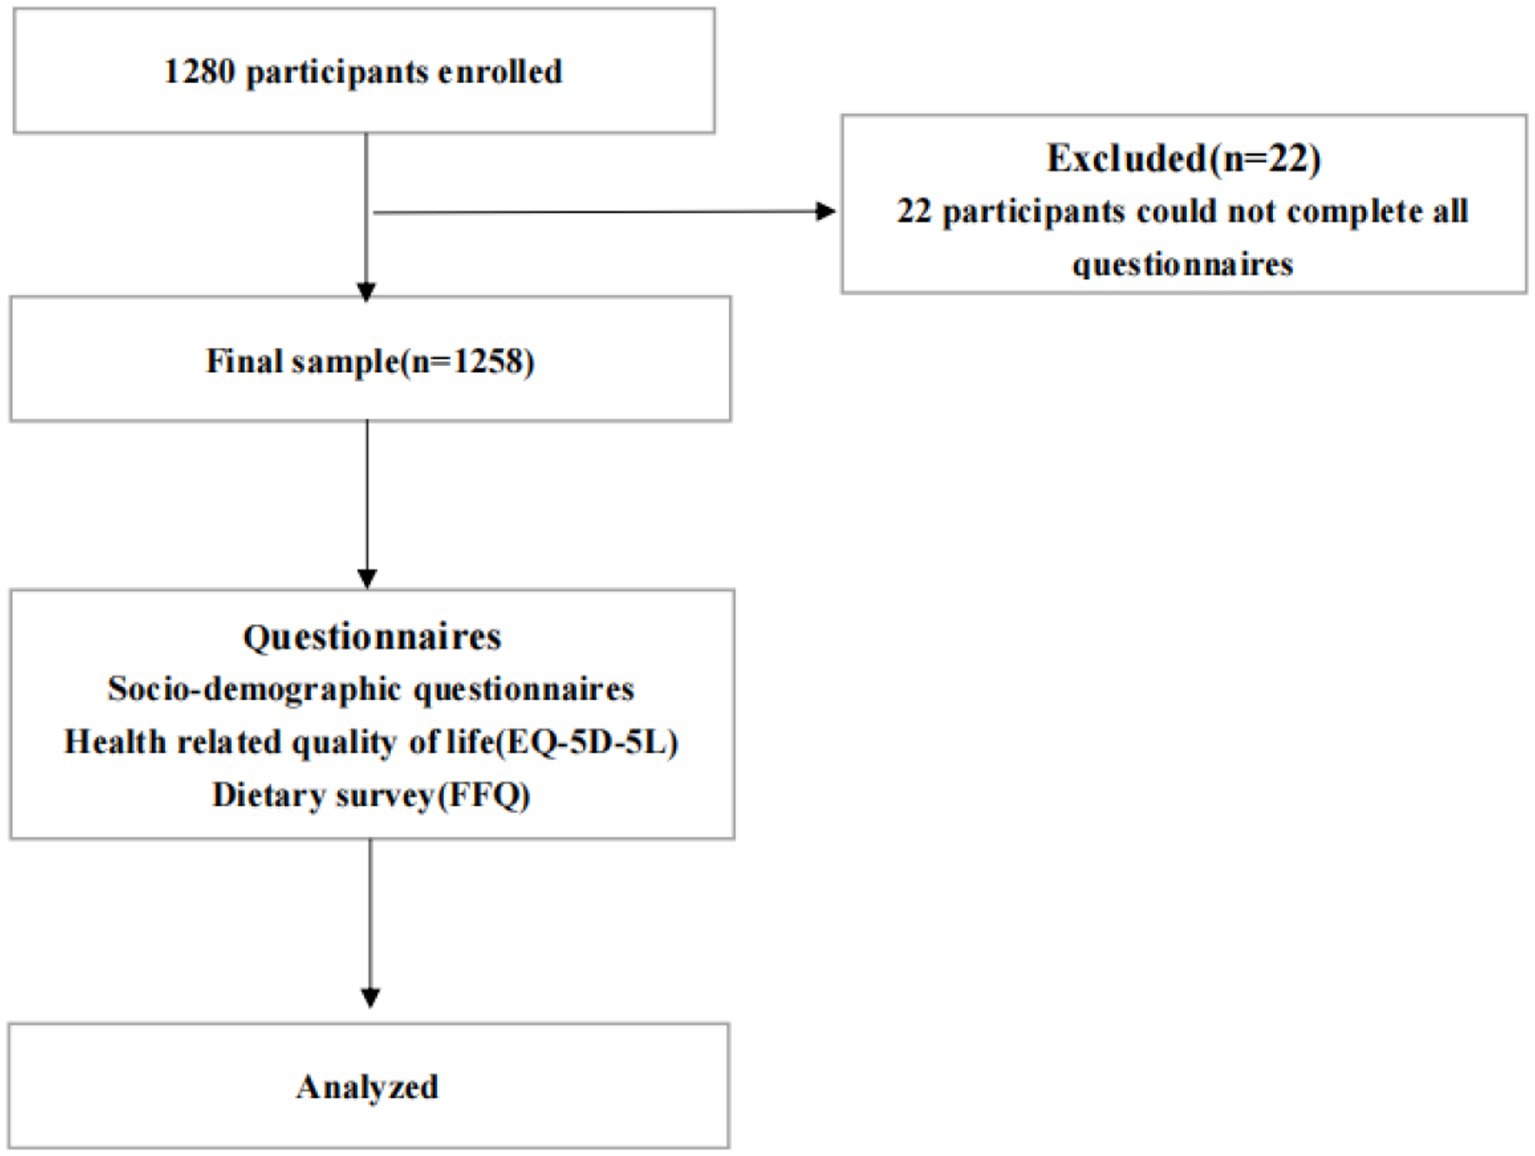
Figure 1. Flow chart for the course of study.
The Food Frequency Questionnaire (FFQ, containing 97 food items), which has been used in studies of Chinese residents with good results and high reliability, was used to measure the dietary intake of respondents in the past 3 months (28, 29). Based on the latest version of the Chinese food composition table, we constructed different nutritional variables such as whole grains, vegetables, fruits, red meat, sugary drinks, alcohol, trans fatty acids, omega fatty acids (EPA + DHA), and sodium.
Using the dietary intake data derived from the FFQ, we selected the following DQIs: AHEI, DASH, and DDS. The three dietary index scores were derived based on the protocols of Stephanie (9), Teresa (30), and Jin (31), respectively.
The AHEI score consisted of 11 items. We assigned a maximum score of 10 to each item if the recommended intake was achieved and a minimum score of 0 for minimum intake. The total score ranged from 0 to 110, depending on the level of intake.
The DASH score was based on the intake level of all people, regardless of the total intake in the entire population. Each food category was divided into quintiles and there were eight food groups in total. For foods beneficial to health, such as fruits, vegetables, nuts, and legumes, we assigned a categorical score: quintile 1 and quintile 5 were scored 1 and 5, respectively. However, for sugary drinks and red meat, the scale was reversed, and quintile 1 was assigned a score of 5. The total DASH score ranged from 8 to 40 points.
The DDS score was developed by Kant et al. (32). We combined the Chinese Dietary Guidelines and the dietary recommendations of the Chinese Nutrition Association to change the DDS score to a more suitable scale for China (31). Foods were divided into nine categories. The food groups consumed by the study subjects in a week were investigated. One point was assigned to each food group consumed, regardless of the number of times and the amount of intake, and the same food group was not repeatedly scored. The total possible score was nine.
The EuroQol Five-Dimensional Scale (EQ-5D) consists of two parts: the Five-Dimensional Health Description System and the Visual Analog Scale (EQ-VAS) (33, 34). The five-dimensional health description system includes five dimensions: mobility, self-care, usual activities, pain/discomfort, and anxiety/depression. Each dimension corresponds to five levels, describing 3,125 health states (35). The EQ-VAS is a visual scale from 0 (worst health self-rated status) to 100 (best health self-rated status) and is an individual’s assessment of their health status on the day of measurement. This study used the utility value score system developed by Luo et al. (36) to evaluate the health utility index of the Chinese population. The dimensions and degrees were multiplied together, and the results were summed to give a health utility value for each individual. The EQ-5D health utility score ranges from −0.391 to 1: the higher the score, the better the health status.
Based on the distribution of each dietary index score and number of participants, we divided participants into three groups: T1, T2, and T3. However, due to the concentration of DASH and DDS scores, we grouped the concentrated values as one category to complete the grouping—many participants in the DASH and DDS groups had the same score value and could not be separated into the two groups, resulting in differences in the number of participants in each group. Chi-square tests were used to compare categorical variables between quartiles of dietary pattern scores. For continuous variables, we first tested the normality assumption using the Shapiro–Wilk test. Non-normally distributed variables were normalized using a logarithmic transformation. One-way analysis of variance was then used to compare continuous variables between dietary pattern scores. HRQOL was categorized into a high and a low group according to its distribution and analyzed using binary logistic regression. The multivariate adjustment model employed binary logistic regression: Model 1 did not adjust for any factors; Model 2 adjusted for gender, age, and body mass index; Model 3 additionally adjusted for smoking, alcohol consumption, chronic illness, cognitive status, residence, income, and education (each factor that had an impact on the quality of life of older people was selected based on a one-way analysis of the Supplementary Table).
All data analyzes were performed using the Statistical Package for Social Sciences software (version 25), and all significance levels were two-sided p-values <0.050. Categorical data were expressed as percentages. Continuous variables were expressed as arithmetic means and log-transformed variables at 95%.
A total of 1,258 participants were included in this study; 55.6% (n = 699) of the participants were female, with a mean age of 72.32 ± 6.00 years. T3 in the DASH group had the lowest percentage of smokers (23.7%) and the lowest percentage of hypertensive patients (33.7%) and T3 group of DDS had the lowest proportion of malnutrition (16.4%) and the lowest proportion of MCI (14.8%).Three-quarters (75.4%) of the participants were married, and 1,056 (83.9%) lived with their families. Participants in the highest group (T3) of each diet index score were more likely to be educated, married, live with their families, be highly active, have a higher income, and have good nutritional and cognitive status (Table 1).
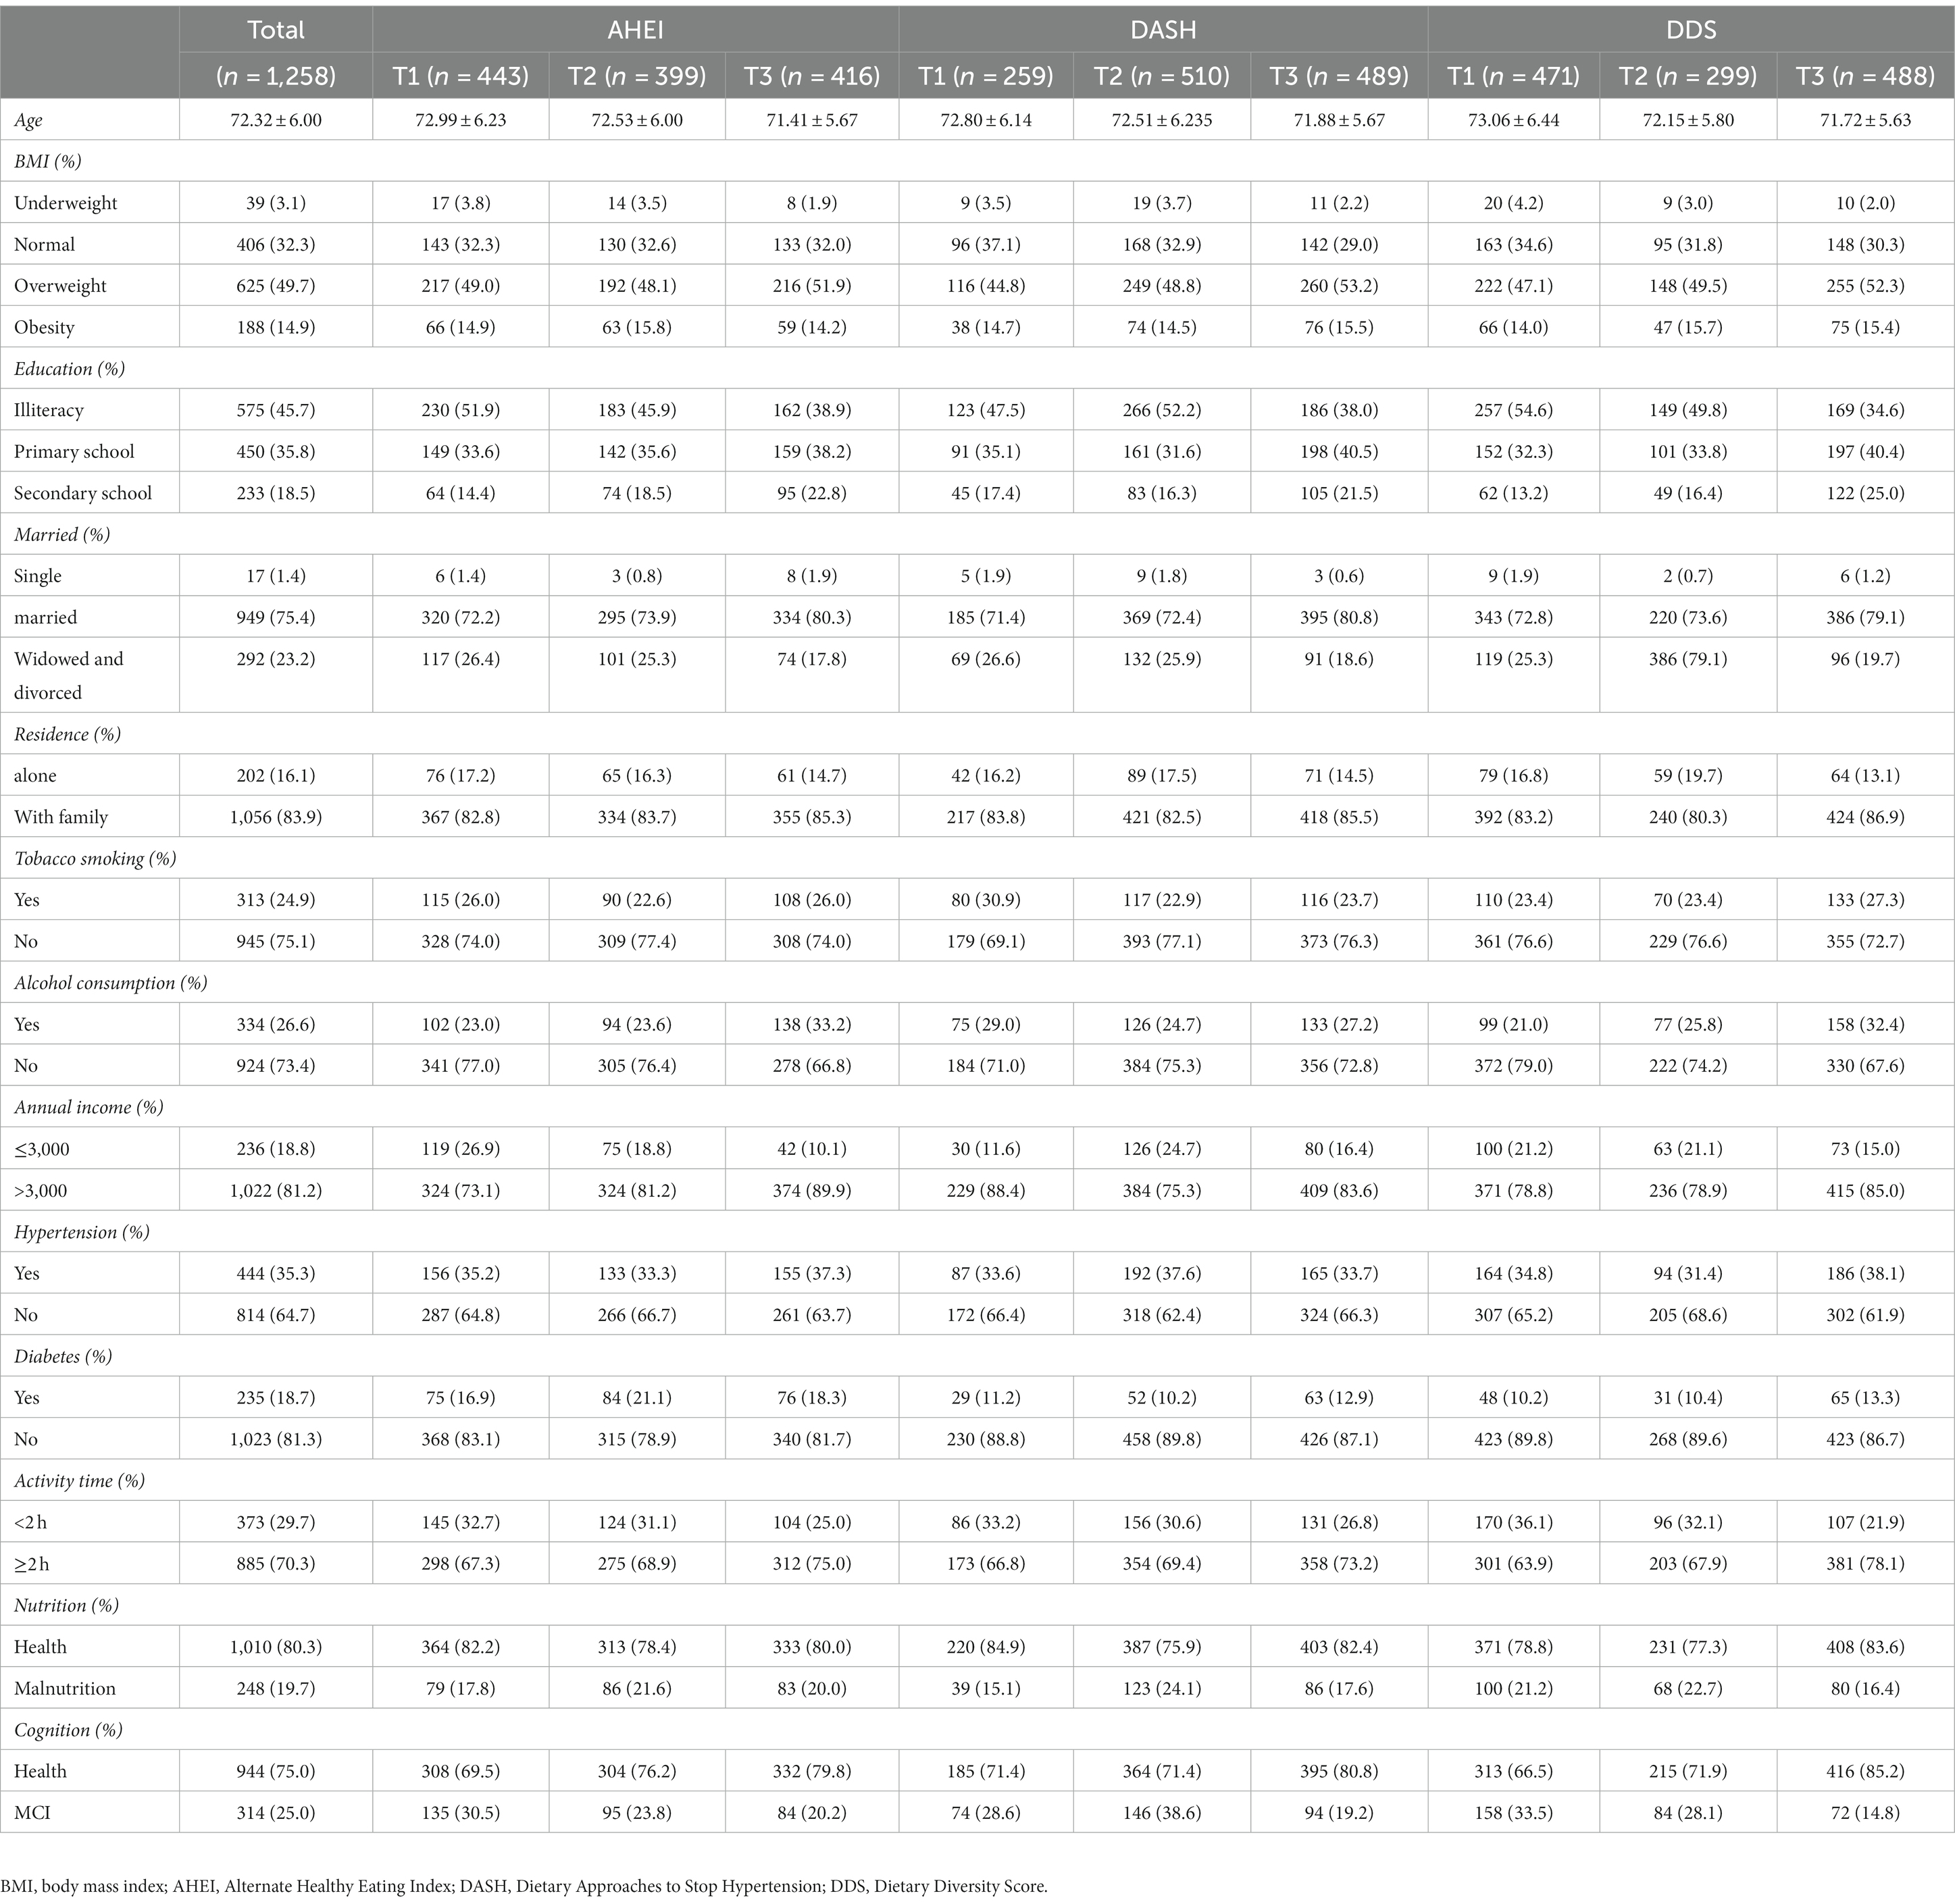
Table 1. Characteristics of study participants.
The EQ-5D and EQ-VAS scores were 0.95 ± 0.10 and 76.76 ± 14.44, respectively (Table 2). Across the three different dietary index scores, the T3 group had the highest EQ-5D and EQ-VAS scores (Table 2). The EQ-5D score in T3 of AHEI was 0.96 ± 0.08, DASH was 0.95 ± 0.09, and DDS was 0.96 ± 0.08; the EQ-VAS score for AHEI was 78.88 ± 15.11, DASH was 78.59 ± 14.55, and DDS was 80.06 ± 13.10. The number of people with health problems was lowest in the highest scoring group (T3) on the dimensions assessing quality of life. There were differences in self-care (p = 0.005) and anxious/depression (p = 0.012) scores by levels of AHEI. By contrast, only self-care scores (p = 0.009) varied by levels of DASH. Meanwhile, scores in all dimensions (mobility: p = 0.001, self-care: p < 0.001, pain/discomfort: p = 0.002, anxious/depression: p = 0.035) differed by levels of DDS.
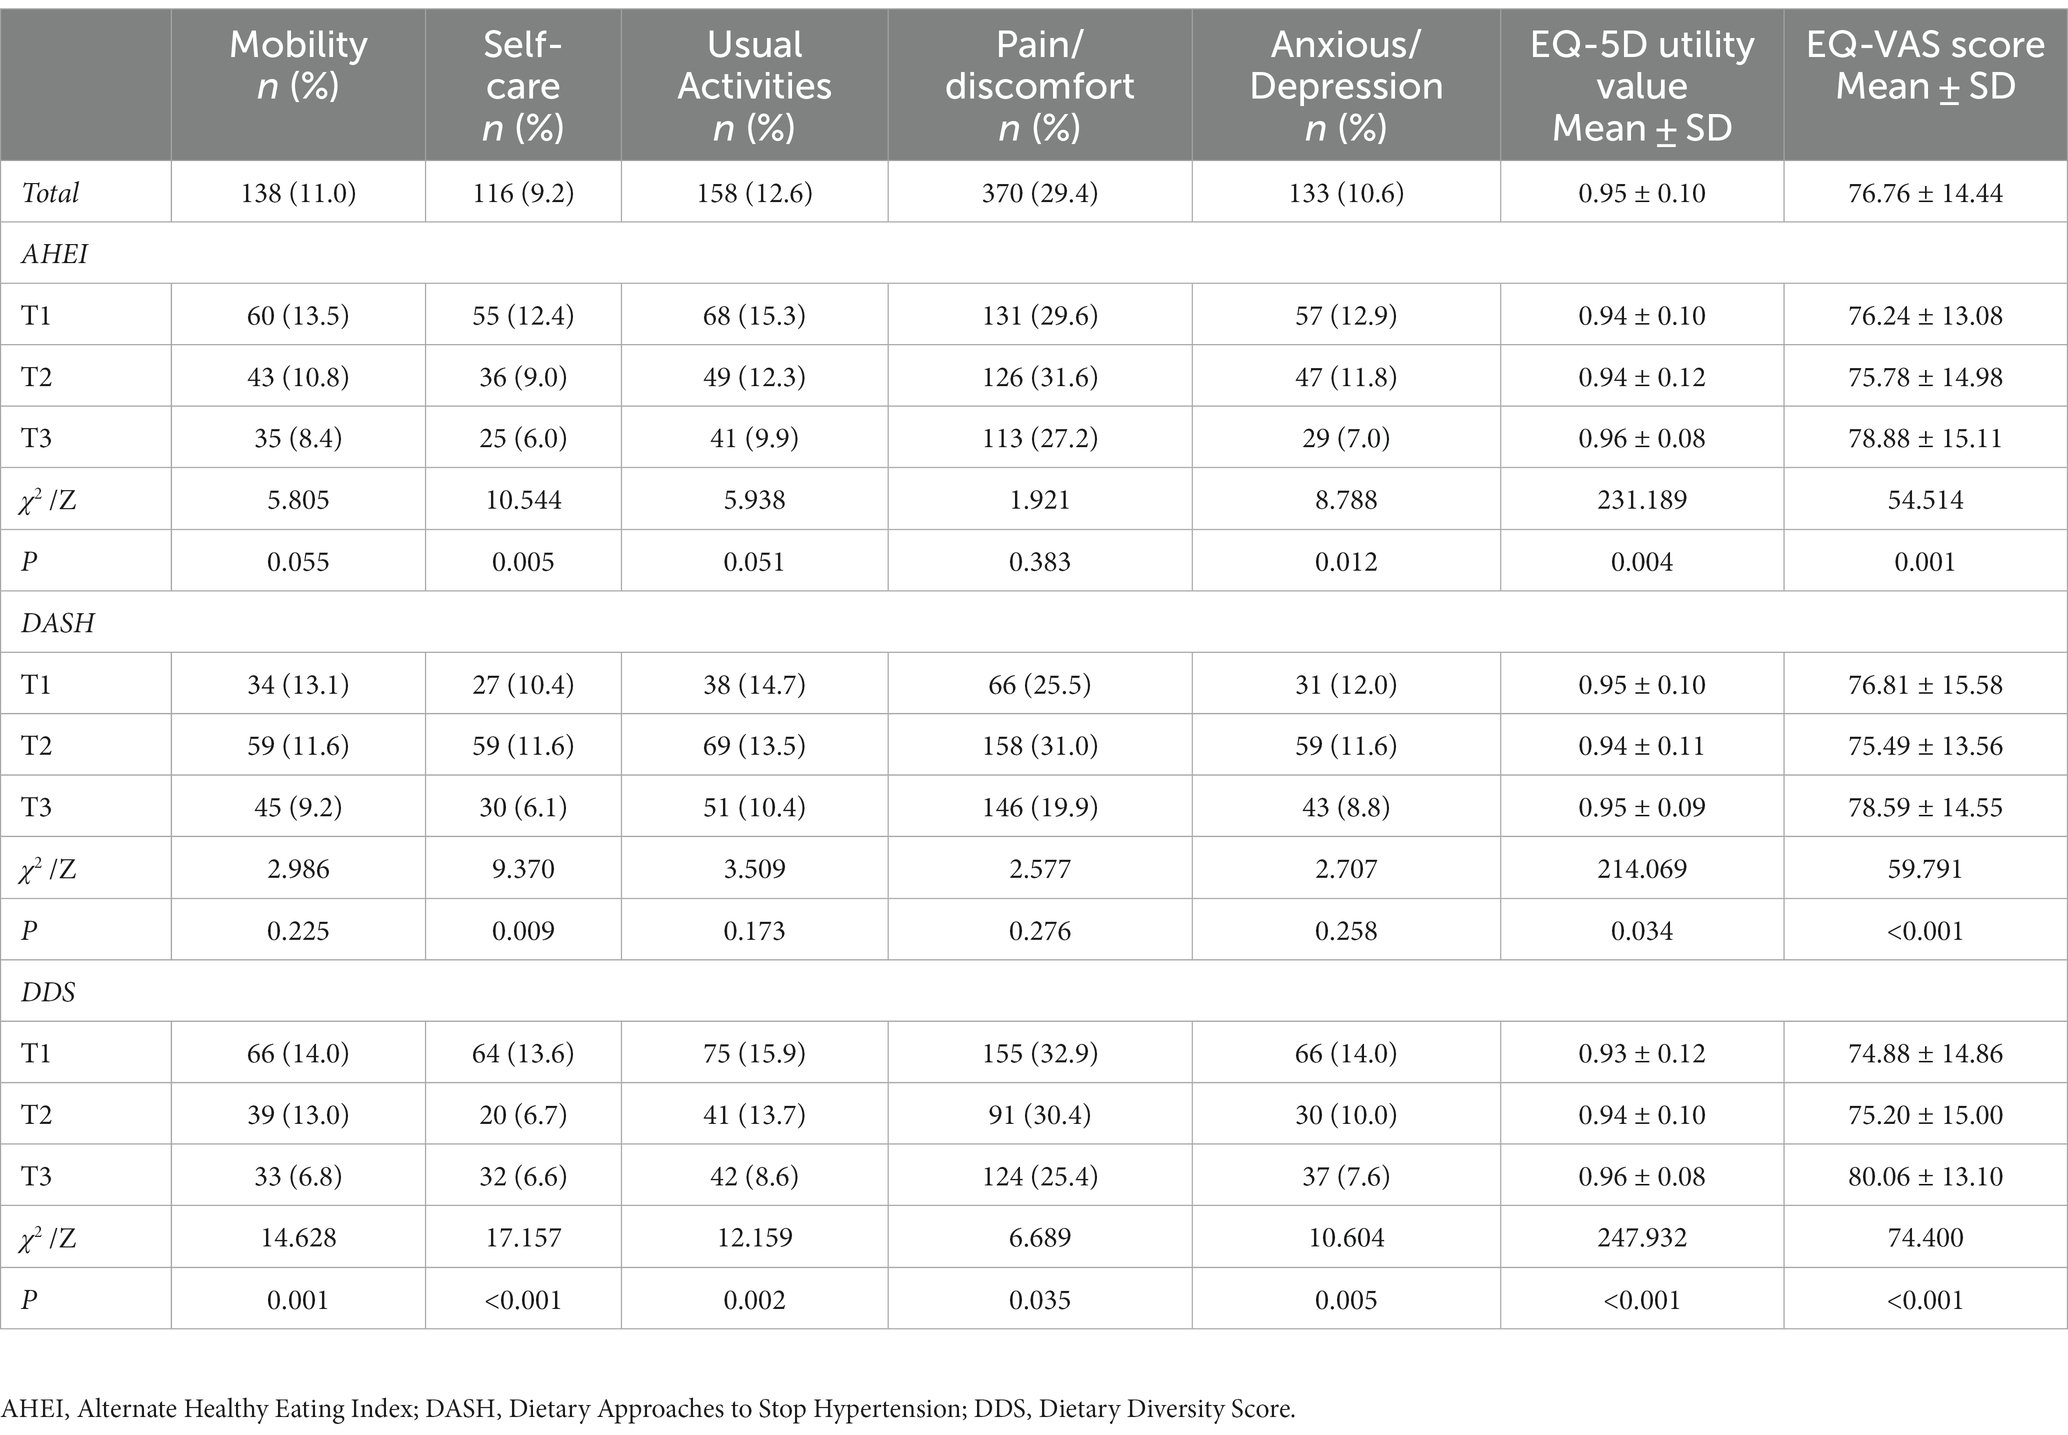
Table 2. Univariate analysis of three dietary index scores and HRQOL.
Controlling for covariates in multivariate adjusted binary logistic regression analyzes, participants in the top tertile of DDS had higher quality of life scores than those in the bottom tertile (Tables 3, 4). The higher the DDS score, the greater the chance that the EQ-5D (Model 2: OR = 1.567, p = 0.001; Model 3: OR = 1.351, p = 0.044) will be in a high classification, which is similar to the trend for the EQ-VAS (Model 2: OR = 1.830, p < 0.001; Model3: OR = 1.383, p = 0.047). The EQ-VAS (Model 2: OR = 0.694, p = 0.041; Model 3: OR = 0.636, p = 0.016) was negatively associated with quality of life in the T2 score group of DASH. No significant association was found between higher AHEI scores and HRQOL after adjusting for covariates (p > 0.05).
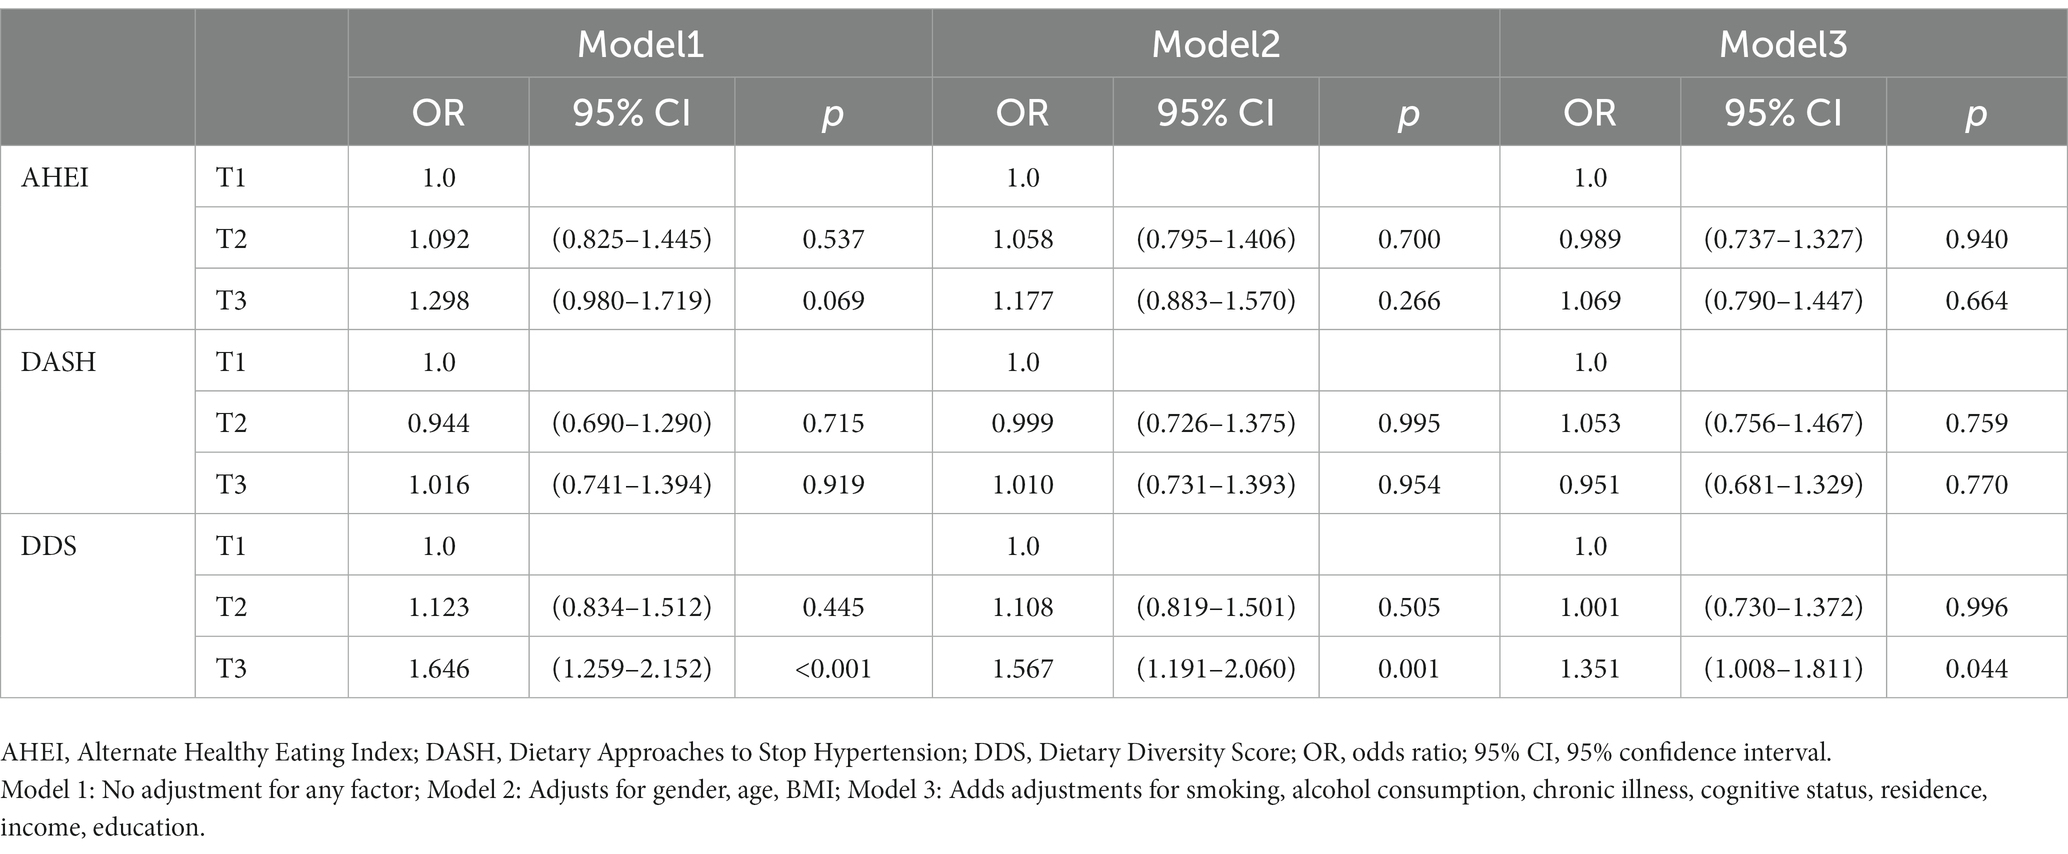
Table 3. Estimated parameters of the EQ-5D multifactor analysis and mixed model.
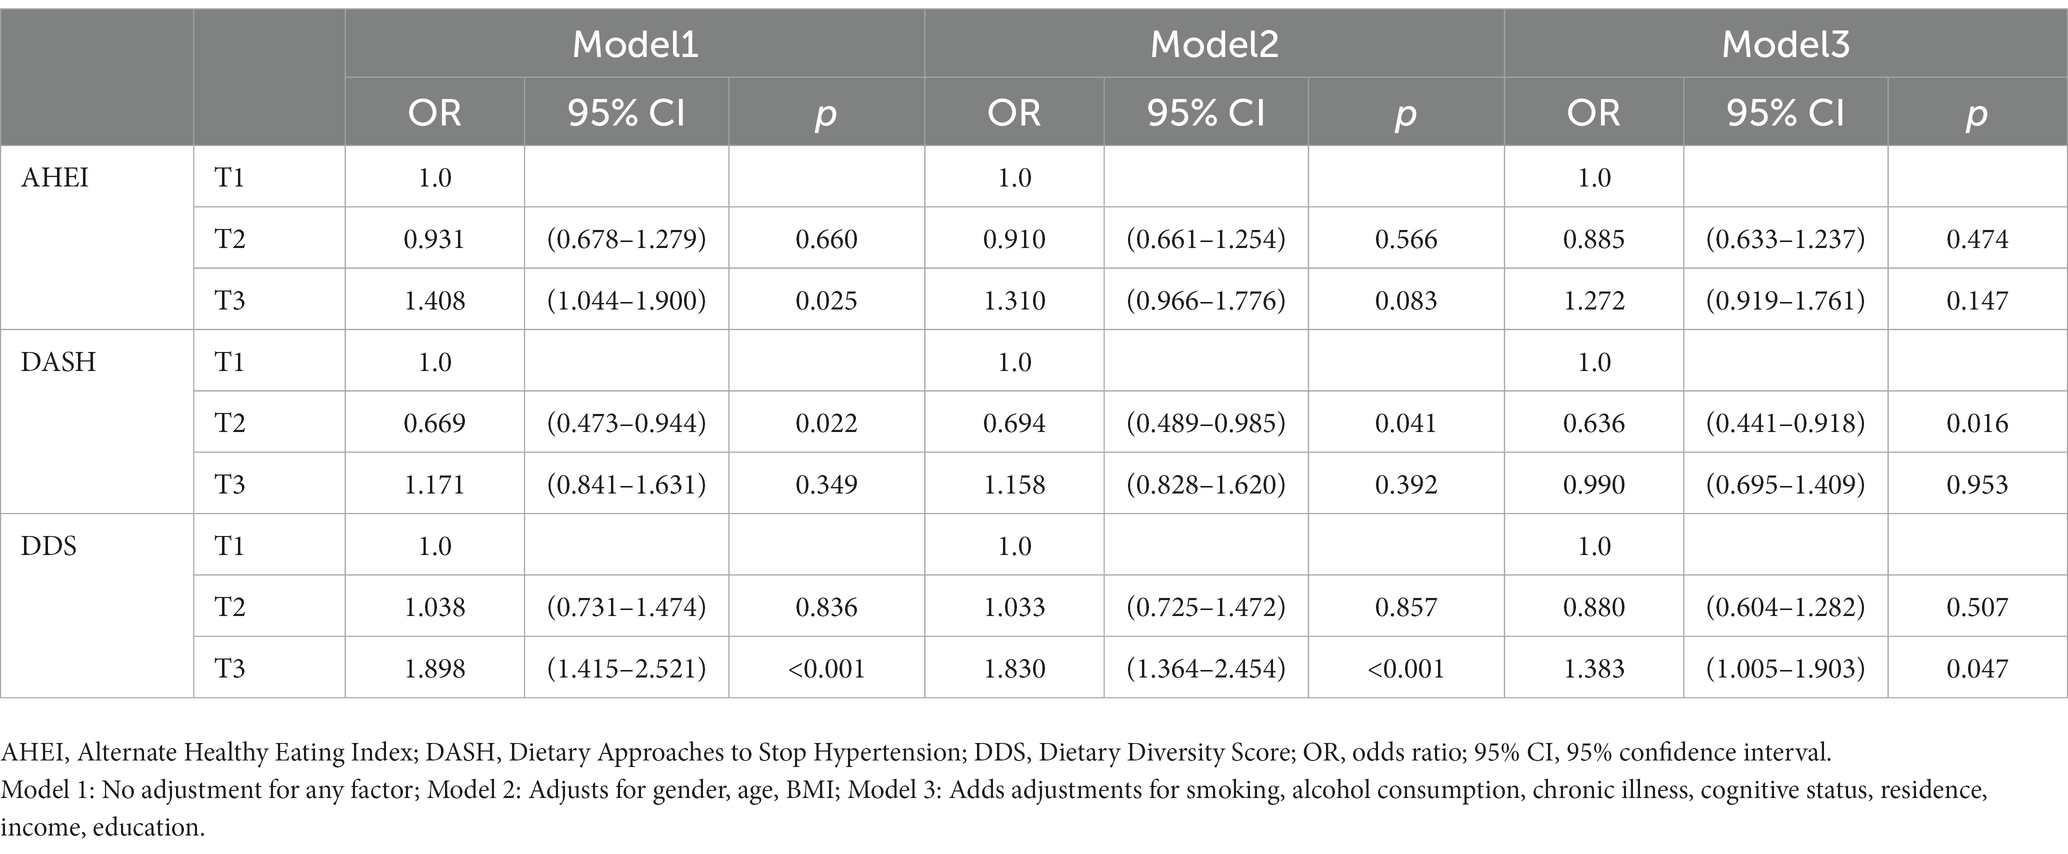
Table 4. Estimated parameters of the EQ-VAS multifactor analysis and mixed model.
This study applied the European Five-Dimensional Health Scale (EQ-5D) to investigate the quality of life in a sample of older people in rural Chinese. We found that most of the older people in rural areas were farmers, and due to the low economic level and degenerative changes in old age, they were prone to various health problems. Finding ways to improve their quality of life is a difficult but urgent issue.
The EQ-5D health utility score was 0.95, similar to the Chinese population standard of EQ-5D-5L (0.946) (37). By contrast, the EQ-5D health utility score was higher than the score (0.94) found by Yang et al. (33). Additionally, the score in the study was higher than that of students in the United Kingdom (UK) (0.90 ± 0.167) (38) and Canada (0.89 ± 0.14) (39), and the score in older people in Vietnam (0.80 ± 0.20) (40). These findings suggest that older people in rural China have a higher quality of life. In a survey of older people in five cities in China, the EQ-5D health utility score was close to 1, and the local older people had better quality of life. The EQ-VAS score was based on the self-perception and health evaluation of the study participants on the day of assessment. The EQ-VAS score in this study was 76.97, which was lower than that of students in the United Kingdom (38) and Canada (39) and higher than that of older people in Vietnam (40). One possible reason is that, due to cultural traditions, Chinese people were more reluctant to report health problems than Western populations and lacked confidence in their health status (41, 42).
As we predicted, older adults who adhered to all three dietary index scores at univariate analysis had higher HRQOL scores. In particular, the group with the highest dietary pattern score had the highest HRQOL. Older adults typically experience a decline in physical and mental abilities, including mobility and digestion, putting them at higher risk for malnutrition (43, 44). This indicates that compliance with dietary patterns leads to higher quality of life.
The AHEI did not show any correlation with HRQOL after multifactor adjustment, so we speculated that the AHEI may not be suitable for the dietary patterns and habits of older people in rural China.
The DASH dietary index score was associated with the EQ-VAS after multifactorial analysis. The T2 group showed a negative correlation with HRQOL (OR < 1): according to our analysis of the scores, the groups with greater differences were in the fruit category and red meat. Participants in the T2 group consumed more red meat, which may have been associated with lower EQ-VAS scores. More importantly, because of the concentration of scores, only one population was scored in the T2 group, which was representative. This needs to be explored in further studies. This might be related to the specific dietary structure of older people in rural China, which only suggests that the DASH and AHEI dietary patterns were not suitable for the dietary patterns of older people living in rural China and does not indicate a lack of association between such diets and quality of life.
DDS is a simple and efficient way to assess diet quality as an indicator of nutritional and health status (35). DDS was used to assess nutritional adequacy and overall diet quality and was considered a key indicator of high diet quality in different populations (25, 45). The higher the DDS dietary pattern score, the higher the HRQOL score of older adults, which is consistent with the results of previous studies (46, 47). Previous studies have suggested that higher DDS scores in Chinese adults may be associated with higher protein intake (48), which may improve the risk of malnutrition in older adults. After multifactorial analysis, we found that adherence to DDS dietary index scores after adjusting for other confounders had a better effect on HRQOL older adults in rural China. The DDS dietary index score performed well in EQ-5D and EQ-VAS scores in the high-scoring subgroup. This indicates that adherence to the DDS dietary pattern improves the quality of life and life experience of older people in rural China. This was similar to the findings of Poorrezaeian (49), which illustrated that DDS is a protective factor against depression in older adults, with each unit increase in DDS associated with a 39% reduction in the risk of major depression. Mina Poorrezaeian (50) also found that anxiety scores were significantly lower in people with high dietary diversity than in those with low dietary diversity, and the two were negatively correlated. This further suggests that DDS may be a protective factor for older people’s mental quality of life and that adherence to DDS can enhance older people’s self-rated quality of life (EQ-VAS).
Meanwhile, vegetables and fruits are the main sources of antioxidants, and the intake of diverse foods may increase antioxidant capacity (48). Moreover, diverse food intake may promote healthier gut flora (51). Studies have demonstrated a positive correlation between dietary diversity and healthy gut microbial stability, which may all contribute to the fact that a diverse diet may improve the quality of life in older adults. Dietary fiber, phenolic compounds, and carotenoids, which are abundant in vegetables and fruits, also reduce the level of inflammation in the body (52). Increased inflammation is thought to be a potential mechanism for the development of mental illness (53). This suggests that adherence to DDS not only increases HRQOL scores in older adults but may also increase satisfaction with life through the modulation of mental health in older adults.
The energy and nutrient intake among older Chinese adults is inadequate, and most older people are at high risk of nutritional deficiencies, especially those living in rural areas with lower levels of education and low household income (54). During our survey, we learned that most older people in rural areas still work on the farm and eat the food they grow daily. The diets of rural Chinese older adults have a single food intake and a carbohydrate-based diet with an insufficient intake of fruits and vegetables. Therefore, a DDS dietary index score that increases food diversity will increase the intake of different nutrients for rural older people. Additionally, consuming different types of food is associated with greater psychological comfort to older people due to problems such as swallowing and will give them a sense of good appetite and a strong body.
We hope future researchers will focus more on older people in rural areas, where their intake of a single food type and poor education predispose them to neglect. Owing to urbanization and the declining physical condition of older adults, it is crucial that they receive more attention and support from society for a healthier and thriving old age.
This study was cross-sectional. Consequently, more specific reasons and results cannot be derived. Due to the older age and the lower educational levels, older adults in rural areas may express their physical condition poorly using questionnaires. More objective indicators should, therefore, be used for analysis. To better represent the national level of older people, samples should be taken from multiple regions and analyzed. Additionally, the diet of older people is best investigated in four different seasons to reflect their dietary status better. Although we have adjusted for multiple confounding factors, we could not adjust for all possible confounding factors.
This study adds to the evidence that adherence to the DDS dietary pattern is associated with a higher quality of life. The diets of older people in rural China are mainly carbohydrate-based, with a single type of food intake and a low intake of fruit, vegetables, and milk. We found a positive association between DDS and quality of life. Therefore, we recommend that older people should consume a variety of foods daily. With a balanced intake of various nutrients, increasing the intake of more food groups, especially fruits and vegetables, is likely to improve the quality of life of older people in rural areas.
Finally, society and the government should pay more attention to the health status and quality of life of older people. Not only dietary issues but also psychological and social issues can affect the quality of life of older people in their later years, which all require the attention of society.
The original contributions presented in the study are included in the article/Supplementary material, further inquiries can be directed to the corresponding author.
CY: Data curation, Formal analysis, Investigation, Software, Writing – original draft, Writing – review & editing. PL: Investigation, Writing – original draft. WH: Writing – review & editing. YZ: Data curation, Investigation, Writing – original draft. CL: Writing – review & editing. TG: Data curation, Formal analysis, Writing – review & editing. FZ: Data curation, Formal analysis, Funding acquisition, Investigation, Project administration, Resources, Supervision, Writing – review & editing.
The author(s) declare financial support was received for the research, authorship, and/or publication of this article. This study was funded by the Feihe Foundation (CNS-Feihe2020A36).
We thank the participants of the study and hope that this study will be useful in improving the quality of life of older people.
The authors declare that the research was conducted in the absence of any commercial or financial relationships that could be construed as a potential conflict of interest.
All claims expressed in this article are solely those of the authors and do not necessarily represent those of their affiliated organizations, or those of the publisher, the editors and the reviewers. Any product that may be evaluated in this article, or claim that may be made by its manufacturer, is not guaranteed or endorsed by the publisher.
The Supplementary material for this article can be found online at: https://www.frontiersin.org/articles/10.3389/fnut.2023.1259227/full#supplementary-material
1. Akbaraly, TN, Brunner, EJ, Ferrie, JE, Marmot, MG, Kivimaki, M, and Singh-Manoux, A. Dietary pattern and depressive symptoms in middle age. Br J Psychiatry. (2009) 195:408–13. doi: 10.1192/bjp.bp.108.058925
2. Normile, D. China's population still growing, census shows-but barely. Science. (2021) 372:669. doi: 10.1126/science.372.6543.669
3. Gao, M, Li, Y, Zhang, S, Gu, L, Zhang, J, Li, Z, et al. Does an empty Nest affect Elders' health? Empirical evidence from China. Int J Environ Res Public Health. (2017) 14:463. doi: 10.3390/ijerph14050463
4. Firdaus, MAM, Mohd Yunus, R, Hairi, NN, Choo, WY, Hairi, F, Suddin, LS, et al. Elder abuse and hospitalization in rural Malaysia. PLoS One. (2022) 17:e0270163. doi: 10.1371/journal.pone.0270163
5. Zhang, L-P, Du, Y-G, Dou, H-Y, and Liu, J. The prevalence of elder abuse and neglect in rural areas: a systematic review and Meta-analysis. Eur Geriatr Med. (2022) 13:585–96. doi: 10.1007/s41999-022-00628-2
6. Zhang, W, Li, Y, Wang, TD, Meng, HX, Min, GW, Fang, YL, et al. Nutritional status of the elderly in rural North China: a cross-sectional study. J Nutr Health Aging. (2014) 18:730–6. doi: 10.1007/s12603-014-0537-x
7. Leij-Halfwerk, S, Verwijs, MH, van Houdt, S, Borkent, JW, Guaitoli, PR, Pelgrim, T, et al. Prevalence of protein-energy malnutrition risk in European older adults in community, residential and hospital settings, according to 22 malnutrition screening tools validated for use in adults ≥65 years: a systematic review and Meta-analysis. Maturitas. (2019) 126:80–9. doi: 10.1016/j.maturitas.2019.05.006
8. Wei, J-M, Li, S, Claytor, L, Partridge, J, and Goates, S. Prevalence and predictors of malnutrition in elderly Chinese adults: results from the China health and retirement longitudinal study. Public Health Nutr. (2018) 21:3129–34. doi: 10.1017/S1368980018002227
9. Chiuve, SE, Fung, TT, Rimm, EB, Hu, FB, McCullough, ML, Wang, M, et al. Alternative dietary indices both strongly predict risk of chronic disease. J Nutr. (2012) 142:1009–18. doi: 10.3945/jn.111.157222
10. Naja, F, Nasreddine, L, Itani, L, Adra, N, Sibai, AM, and Hwalla, N. Association between dietary patterns and the risk of metabolic syndrome among Lebanese adults. Eur J Nutr. (2013) 52:97–105. doi: 10.1007/s00394-011-0291-3
11. Kiefte-de Jong, JC, Mathers, JC, and Franco, OH. Nutrition and healthy ageing: the key ingredients. Proc Nutr Soc. (2014) 73:249–59. doi: 10.1017/S0029665113003881
12. Coons, SJ, Rao, S, Keininger, DL, and Hays, RD. A comparative review of generic quality-of-life instruments. PharmacoEconomics. (2000) 17:13–35. doi: 10.2165/00019053-200017010-00002
13. Marten, O, Brand, L, and Greiner, W. Feasibility of the Eq-5d in the elderly population: a systematic review of the literature. Qual Life Res. (2022) 31:1621–37. doi: 10.1007/s11136-021-03007-9
14. Luo, N, Li, M, Liu, GG, Lloyd, A, de Charro, F, and Herdman, M. Developing the Chinese version of the new 5-level Eq-5d descriptive system: the response scaling approach. Qual Life Res. (2013) 22:885–90. doi: 10.1007/s11136-012-0200-0
15. Rantanen, T, Harris, T, Leveille, SG, Visser, M, Foley, D, Masaki, K, et al. Muscle strength and body mass index as long-term predictors of mortality in initially healthy men. J Gerontol A Biol Sci Med Sci. (2000) 55:M168–73. doi: 10.1093/gerona/55.3.m168
16. Feldblum, I, German, L, Castel, H, Harman-Boehm, I, Bilenko, N, Eisinger, M, et al. Characteristics of undernourished older medical patients and the identification of predictors for undernutrition status. Nutr J. (2007) 6:37. doi: 10.1186/1475-2891-6-37
17. Jung, SE, Kim, S, Bishop, A, and Hermann, J. Poor nutritional status among low-income older adults: examining the interconnection between self-care capacity, food insecurity, and depression. J Acad Nutr Diet. (2019) 119:1687–94. doi: 10.1016/j.jand.2018.04.009
18. Zaragoza-Martí, A, Ferrer-Cascales, R, Hurtado-Sánchez, JA, Laguna-Pérez, A, and Cabañero-Martínez, MJ. Relationship between adherence to the Mediterranean diet and health-related quality of life and life satisfaction among older adults. J Nutr Health Aging. (2018) 22:89–96. doi: 10.1007/s12603-017-0923-2
19. Pelser, C, Arem, H, Pfeiffer, RM, Elena, JW, Alfano, CM, Hollenbeck, AR, et al. Prediagnostic lifestyle factors and survival after Colon and Rectal Cancer diagnosis in the National Institutes of Health (Nih)-Aarp diet and health study. Cancer. (2014) 120:1540–7. doi: 10.1002/cncr.28573
20. Boggs, DA, Ban, Y, Palmer, JR, and Rosenberg, L. Higher diet quality is inversely associated with mortality in African-American women. J Nutr. (2015) 145:547–54. doi: 10.3945/jn.114.195735
21. Zhou, J, Wang, H, and Zou, Z. Inverse association between dietary diversity score calculated from the diet quality questionnaire and psychological stress in Chinese adults: a prospective study from China health and nutrition survey. Nutrients. (2022) 14:3297. doi: 10.3390/nu14163297
22. Fung, TT, McCullough, M, van Dam, RM, and Hu, FB. A prospective study of overall diet quality and risk of type 2 diabetes in women. Diabetes Care. (2007) 30:1753–7. doi: 10.2337/dc06-2581
23. Akbaraly, TN, Ferrie, JE, Berr, C, Brunner, EJ, Head, J, Marmot, MG, et al. Alternative healthy eating index and mortality over 18 Y of follow-up: results from the Whitehall ii cohort. Am J Clin Nutr. (2011) 94:247–53. doi: 10.3945/ajcn.111.013128
24. Filippou, CD, Tsioufis, CP, Thomopoulos, CG, Mihas, CC, Dimitriadis, KS, Sotiropoulou, LI, et al. Dietary approaches to stop hypertension (Dash) diet and blood pressure reduction in adults with and without hypertension: a systematic review and Meta-analysis of randomized controlled trials. Adv Nutr. (2020) 11:1150–60. doi: 10.1093/advances/nmaa041
25. Vandevijvere, S, De Vriese, S, Huybrechts, I, Moreau, M, and Van Oyen, H. Overall and within-food group diversity are associated with dietary quality in Belgium. Public Health Nutr. (2010) 13:1965–73. doi: 10.1017/S1368980010001606
26. Ojeda-Rodríguez, A, Zazpe, I, Alonso-Pedrero, L, Zalba, G, Guillen-Grima, F, Martinez-Gonzalez, MA, et al. Association between diet quality indexes and the risk of short telomeres in an elderly population of the Sun project. Clin Nutr. (2020) 39:2487–94. doi: 10.1016/j.clnu.2019.11.003
27. Liao, M, Luo, N, Rand, K, and Yang, Z. Urban/rural differences in preferences for Eq-5d-5l health states: a study of a multi-ethnic region in China. Qual Life Res. (2023). doi: 10.1007/s11136-023-03394-1
28. Xue, Y, Yang, K, Wang, B, Liu, C, Mao, Z, Yu, S, et al. Reproducibility and validity of an Ffq in the Henan rural cohort study. Public Health Nutr. (2020) 23:34–40. doi: 10.1017/S1368980019002416
29. Cui, Q, Xia, Y, Liu, Y, Sun, Y, Ye, K, Li, W, et al. Validity and reproducibility of a Ffq for assessing dietary intake among residents of Northeast China: northeast cohort study of China. Br J Nutr. (2022). doi: 10.1017/S0007114522002318
30. Fung, TT, Chiuve, SE, McCullough, ML, Rexrode, KM, Logroscino, G, and Hu, FB. Adherence to a Dash-style diet and risk of coronary heart disease and stroke in women. Arch Intern Med. (2008) 168:713–20. doi: 10.1001/archinte.168.7.713
31. Zhao, W, Yu, K, Tan, S, Zheng, Y, Zhao, A, Wang, P, et al. Dietary diversity scores: an Indicator of micronutrient inadequacy instead of obesity for Chinese children. BMC Public Health. (2017) 17:440. doi: 10.1186/s12889-017-4381-x
32. Kant, AK, Schatzkin, A, Harris, TB, Ziegler, RG, and Block, G. Dietary diversity and subsequent mortality in the first National Health and nutrition examination survey epidemiologic follow-up study. Am J Clin Nutr. (1993) 57:434–40. doi: 10.1093/ajcn/57.3.434
33. Yang, Z, Busschbach, J, Liu, G, and Luo, N. Eq-5d-5l norms for the urban Chinese population in China. Health Qual Life Outcomes. (2018) 16:210. doi: 10.1186/s12955-018-1036-2
34. Rabin, R, and de Charro, F. Eq-5d: a measure of health status from the Euroqol group. Ann Med. (2001) 33:337–43. doi: 10.3109/07853890109002087
35. Tan, JH, Abdin, E, Shahwan, S, Zhang, Y, Sambasivam, R, Vaingankar, JA, et al. Happiness and cognitive impairment among older adults: investigating the mediational roles of disability, depression, social contact frequency, and loneliness. Int J Environ Res Public Health. (2019) 16:4954. doi: 10.3390/ijerph16244954
36. Luo, N, Liu, G, Li, M, Guan, H, Jin, X, and Rand-Hendriksen, K. Estimating an Eq-5d-5l value set for China. Value Health. (2017) 20:662–9. doi: 10.1016/j.jval.2016.11.016
37. Xie, S, Wu, J, and Xie, F. Population norms for sf-6dv2 and Eq-5d-5l in China. Appl Health Econ Health Policy. (2022) 20:573–85. doi: 10.1007/s40258-022-00715-2
38. Boyle, SE, Jones, GL, and Walters, SJ. Physical activity, quality of life, weight status and diet in adolescents. Qual Life Res. (2010) 19:943–54. doi: 10.1007/s11136-010-9659-8
39. Kirk, SFL, Kuhle, S, McIsaac, J-LD, Williams, PL, Rossiter, M, Ohinmaa, A, et al. Food security status among grade 5 students in Nova Scotia, Canada and its association with health outcomes. Public Health Nutr. (2015) 18:2943–51. doi: 10.1017/S1368980014001414
40. Nguyen, HTT, Moir, MP, Nguyen, TX, Vu, AP, Luong, LH, Nguyen, TN, et al. Health-related quality of life in elderly diabetic outpatients in Vietnam. Patient Prefer Adherence. (2018) 12:1347–54. doi: 10.2147/PPA.S162892
41. Cnossen, MC, Polinder, S, Vos, PE, Lingsma, HF, Steyerberg, EW, Sun, Y, et al. Comparing health-related quality of life of Dutch and Chinese patients with traumatic brain injury: do cultural differences play a role? Health Qual Life Outcomes. (2017) 15:72. doi: 10.1186/s12955-017-0641-9
42. Wang, D, Xie, S, Wu, J, and Sun, B. The trend in quality of life of Chinese population: analysis based on population health surveys from 2008 to 2020. BMC Public Health. (2023) 23:167. doi: 10.1186/s12889-023-15075-2
43. Fávaro-Moreira, NC, Krausch-Hofmann, S, Matthys, C, Vereecken, C, Vanhauwaert, E, Declercq, A, et al. Risk factors for malnutrition in older adults: a systematic review of the literature based on longitudinal data. Adv Nutr. (2016) 7:507–22. doi: 10.3945/an.115.011254
44. Donini, LM, Scardella, P, Piombo, L, Neri, B, Asprino, R, Proietti, AR, et al. Malnutrition in elderly: social and economic determinants. J Nutr Health Aging. (2013) 17:9–15. doi: 10.1007/s12603-012-0374-8
45. Oldewage-Theron, WH, and Kruger, R. Food variety and dietary diversity as indicators of the dietary adequacy and health status of an elderly population in Sharpeville, South Africa. J Nutr Elder. (2008) 27:101–33. doi: 10.1080/01639360802060140
46. Yokoyama, Y, Nishi, M, Murayama, H, Amano, H, Taniguchi, Y, Nofuji, Y, et al. Association of Dietary Variety with body composition and physical function in community-dwelling elderly Japanese. J Nutr Health Aging. (2016) 20:691–6. doi: 10.1007/s12603-015-0632-7
47. Zhang, J, and Zhao, A. Dietary diversity and healthy aging: a prospective study. Nutrients. (2021) 13:1787. doi: 10.3390/nu13061787
48. Zhang, J, Zhao, A, Wu, W, Yang, C, Ren, Z, Wang, M, et al. Dietary diversity is associated with memory status in Chinese adults: a prospective study. Front Aging Neurosci. (2020) 12:580760. doi: 10.3389/fnagi.2020.580760
49. Poorrezaeian, M, Siassi, F, Milajerdi, A, Qorbani, M, Karimi, J, Sohrabi-Kabi, R, et al. Depression is related to dietary diversity score in women: a cross-sectional study from a developing country. Ann General Psychiatry. (2017) 16:39. doi: 10.1186/s12991-017-0162-2
50. Poorrezaeian, M, Siassi, F, Qorbani, M, Karimi, J, Koohdani, F, Asayesh, H, et al. Association of Dietary Diversity Score with anxiety in women. Psychiatry Res. (2015) 230:622–7. doi: 10.1016/j.psychres.2015.10.016
51. Heiman, ML, and Greenway, FL. A healthy gastrointestinal microbiome is dependent on dietary diversity. Mol Metab. (2016) 5:317–20. doi: 10.1016/j.molmet.2016.02.005
52. Lapuente, M, Estruch, R, Shahbaz, M, and Casas, R. Relation of fruits and vegetables with major Cardiometabolic risk factors, markers of oxidation, and inflammation. Nutrients. (2019) 11:2381. doi: 10.3390/nu11102381
53. Leonard, BE. Inflammation and depression: a causal or coincidental link to the pathophysiology? Acta Neuropsychiatr. (2018) 30:1–16. doi: 10.1017/neu.2016.69
Keywords: elderly, rural, dietary, quality of life, HRQOL
Citation: Yang C, Liu P, Huang W, Zhou Y, Liu C, Gao T and Zhong F (2023) Relationship between three dietary indices and health-related quality of life among rural elderly in China: a cross-sectional study. Front. Nutr. 10:1259227. doi: 10.3389/fnut.2023.1259227
Edited by:
Elezebeth Mathews, Central University of Kerala, IndiaCopyright © 2023 Yang, Liu, Huang, Zhou, Liu, Gao and Zhong. This is an open-access article distributed under the terms of the Creative Commons Attribution License (CC BY). The use, distribution or reproduction in other forums is permitted, provided the original author(s) and the copyright owner(s) are credited and that the original publication in this journal is cited, in accordance with accepted academic practice. No use, distribution or reproduction is permitted which does not comply with these terms.
*Correspondence: Feng Zhong, emhmZW5nQHFkdS5lZHUuY24=
Disclaimer: All claims expressed in this article are solely those of the authors and do not necessarily represent those of their affiliated organizations, or those of the publisher, the editors and the reviewers. Any product that may be evaluated in this article or claim that may be made by its manufacturer is not guaranteed or endorsed by the publisher.
Research integrity at Frontiers
Learn more about the work of our research integrity team to safeguard the quality of each article we publish.