 Xueshan Jin1†
 Jiajun Liu2†Qiuyu Cao1Jiehua Lin1Guangfu Wu1Longhui Liu1Shan Jiang1Xin Zhou1Zhiqiang Li1Aicheng Yang1*
- 1Nephropathy Center, The Affiliated Jiangmen TCM Hospital of Jinan University, Jiangmen, China
- 2First Clinical Medical College, Guangzhou University of Chinese Medicine, Guangzhou, China
Background: Current guidelines for obesity prevention and control focus on body mass index (BMI) and rarely address central obesity. Few studies have been conducted on the association between normal-weight central obesity and the risk of diabetes mellitus (DM).
Methods: 26,825 participants from the National Health and Nutrition Examination Survey (NHANES) were included in our study. A weighted multivariate logistic regression model was used to analyze the relationship between different obesity patterns and the risk of DM.
Results: Our results suggest that normal-weight central obesity is associated with an increased risk of DM (OR: 2.37, 95% CI: 1.75–3.23) compared with normal-weight participants without central obesity. When stratified by sex, men with normal-weight central obesity, obesity and central obesity were found to have a similar risk of DM (OR: 3.83, 95% CI: 2.10–5.97; OR: 4.20, 95% CI: 3.48–5.08, respectively) and a higher risk than all other types of obesity, including men who were overweight with no central obesity (OR: 1.21, 95% CI: 0.96–1.51) and obese with no central obesity (OR: 0.53, 95% CI: 0.30–0.91).
Conclusion: Our results highlight the need for more attention in people with central obesity, even if they have a normal BMI.
1. Introduction
Over the past half century, overweight and obesity have increased globally, with the prevalence of obesity increasing from 3.2 to 10.8% in men and from 6.4 to 14.9% in women (1). Excess fat can increase the incidence of metabolic diseases, however, for a given amount of fat, the risk of metabolic diseases varies greatly among different populations. For example, the risk of cardiometabolic disease was unexpectedly increased in people with metabolically unhealthy normal weight (2–4), compared to people with metabolically healthy normal weight, and only modestly increased in people with metabolically healthy obesity (2, 4–7). The characteristic fat distribution of metabolically unhealthy normal weight people is high visceral fat content, while metabolically healthy obese people are low visceral fat content (8, 9). Abdominal obesity can reflect the content of visceral fat and is one of the important phenotypes of unhealthy metabolism (10, 11).
Diabetes mellitus (DM) is one of the major diseases of global concern, affecting 422 million people and directly causing 1.5 million deaths each year (12, 13). With the acceleration of aging, the public health budget expenditure caused by DM increases year by year. Therefore, early identification of DM is of great significance in the field of public health and clinical medicine. Many indicators have been developed to predict the occurrence of DM. Anthropometric parameters have been widely reported in recent years because they are easy to measure, non-invasive, and inexpensive (14–16). BMI (defined as general obesity) and waist circumference (defined as central obesity) are important indicators for measuring obesity, and their increase is associated with a higher risk of DM (17). However, a recent study has shown that obesity as defined by BMI is inversely associated with the occurrence of DM in men (18). Another study reported similar results that insulin resistance (an early manifestation of DM) was associated with abdominal obesity, but not general obesity (19). Although BMI is a standard measure in the clinical assessment of obesity, it does not distinguish body shape or the accumulation of fatty tissue (20). Even in people with a normal BMI (18.5–24.9 kg/m2), central obese individuals may be at increased risk for DM due to excessive distribution of abdominal fat (18). People with normal weight central obesity have received little clinical attention. Guidelines from the American Obesity Society recommend routine monitoring of waist circumference (WC) to assess central obesity in overweight people, but do not recommend WC measurements with a normal BMI, as there is limited evidence that individuals with a normal BMI increase the risk associated with obesity (21). In addition, patients with normal-weight central obesity are often overlooked in developing risk reduction strategies. Due to the increasing incidence of central obesity over the years, individuals with normal-weight central obesity are common in the population, so assessing the health risks of these individuals is clinically important.
The aim of this study was to evaluate the association between different combinations of BMI and WC and the risk of DM, and to obtain quantitative data on the risk of normal-weight central obesity by using normal-weight without central obesity as a reference. Our hypothesis was that normal-weight central obesity increases the risk of developing DM compared to normal-weight without central obesity.
2. Methods
2.1. Study population
The study design of the National Health and Nutrition Examination Survey (NHANES) has been reported in detail in previous literature (22, 23). In short, NHANES is a cross-sectional survey conducted regularly by the Centers for Disease Control and Prevention (CDC) and the National Center for Health Statistics (NCHS), aimed at assessing the nutritional and health status of children and adults across the US. The study is conducted every 2 years and uses complex multi-stage sampling to ensure that the survey population is representative. The study design of the NHANES was approved by the review board of the NCHS, and all subjects provided informed consent at enrollment.
The study included participants from NHANES over five periods from 2009 to 2018. The criteria for inclusion are: (1) Age ≥ 18 years; (2) BMI ≥ 18.5 kg/m2; (3) Participants had available BMI and WC data; (4) The participants’ diabetes status was clear (yes or no). Finally, a total of 26,825 participants were included in the study.
2.2. Anthropometric measures
BMI is defined as weight divided by height squared, and its value is calculated in kg/m2. The weight and height were measured by trained NHANES personnel. The weight was measured using a portable electronic scale with an accuracy of 100 g and the height was measured using a tape measure with an accuracy of 0.1 cm. WC was measured in a standing position. The operator first palpated and located the bilateral iliac crest, placed the tape measure horizontally on the iliac crest, and gently attached it to the skin surface without compressing the skin. When the participant is in the minimum breathing stage, the data recorded by the tape measure is WC. Measurements of BMI and WC were recorded to the nearest 0.1 unit. BMI was divided into 3 categories: (1) normal weight (BMI: 18.5–24.9), overweight (BMI: 25–29.9), and obese (BMI ≥ 30.0) (24). The WC of central obesity was defined as ≥102 cm in males and ≥88 cm in females (25).
2.3. Ascertainment of diabetes mellitus
According to the latest guidelines from the American Diabetes Association (26), diabetes is considered to be present when: (1) Self-reported diabetes mellitus; (2) Receiving oral hypoglycemic medication or insulin therapy; (3) Fasting blood glucose level ≥ 126 mg/mL; (4) Oral glucose tolerance test 2-h blood glucose ≥200 mg/mL; (5) Glycosylated hemoglobin level ≥ 6.5%.
2.4. Other covariate assessments
Covariates include demographic characteristics (age, sex, race/ethnicity, education, marital status, and annual household income), smoking history, drinking history, hypertension status, and hyperlipidemia status. Smoking history included current smokers, never-smokers, and former smokers. Drinking history included never/mild drinkers, moderate drinkers, and heavy drinkers. Participants were considered to have hyperlipidemia if: Self-reported hyperlipidemia, taking lipid-lowering medications, total cholesterol ≥ 200 mg/mL, triglycerides ≥ 150 mg/mL, LDL ≥ 130 mg/mL, or HDL ≤ 40 mg/mL in male and ≤ 50 mg/mL in female (27). Participants were considered to have high blood pressure if: Self-reported hypertension, taking blood pressure lowering medications, systolic blood pressure ≥ 140 mmHg, or diastolic blood pressure ≥ 90 mmHg (28).
2.5. Statistical analysis
The overall goal of the study was to assess the effects of different categories of BMI and central obesity on the risk of DM. Therefore, a weighted logistic regression analysis was performed on 26,825 participants to obtain quantitative data on the risk of DM for different types of obesity. Since NHANES is a study with a complex stratified sampling design, corresponding weights were used for statistical analysis. For categorical data, weighted percentage (%) was used, whereas for continuous variables, weighted mean and 95% confidence interval (CI) were used. To investigate the relationship between different patterns of obesity and DM risk, we created a multivariate logistic regression model and adjusted for potential confounders, which included age, sex, race/ethnicity, etc.
We assessed whether these relationships varied by age (<50 vs. ≥50), race (nonwhite vs. white), education (under college vs. college or above), smoking status (never vs. ever), alcohol status (mild or never vs. heavy or moderate), hypertension status (yes vs. no), and hyperlipidemia status (yes vs. no). The association between BMI and WC is different in men and women (there may be statistical difference in combination) (29). Therefore, we also stratified the analysis by gender and adjusted for confounding factors. In addition, we plotted the receiver operator curve (ROC) and calculated the area under the curve (AUC) to assess the ability of WC and BMI to predict DM.
All statistics were performed using Stata, version 15.1 (Stata Corp. LP, Texas, United States). All tests were bilateral, and p < 0.05 was statistically significant.
3. Results
The average age of the 26,825 participants included in the study was 47 years old, and 690 (2.6%) of them were normal-weight central obese. Of the 26,825 participants, 7,740 (28.9%) had normal BMI, 8,786 (32.8%) were overweight and 10,299 (38.4%) were obese. According to the World Health Organization’s criteria for defining central obesity, 15,251 (56.9%) participants had central obesity. In contrast, when BMI was used as a measure of overweight or obesity, the detection rate of overweight and obesity was 71.1%, higher than the prevalence of central obesity (56.9%). Correlation analysis showed that WC was significantly correlated with BMI (correlation coefficient: 0.37, p < 0.001). Most of the participants were non-Hispanic white (65.1%), with education above high school (85.1%). The prevalence of hypertension and hyperlipidemia was 37.2 and 70.5%, respectively. In general, central obesity was associated with an increased prevalence of hypertension and hyperlipidemia compared with non-central obesity across the BMI categories. Baseline characteristics of participants in different combinations of BMI and WC can be obtained in Table 1.
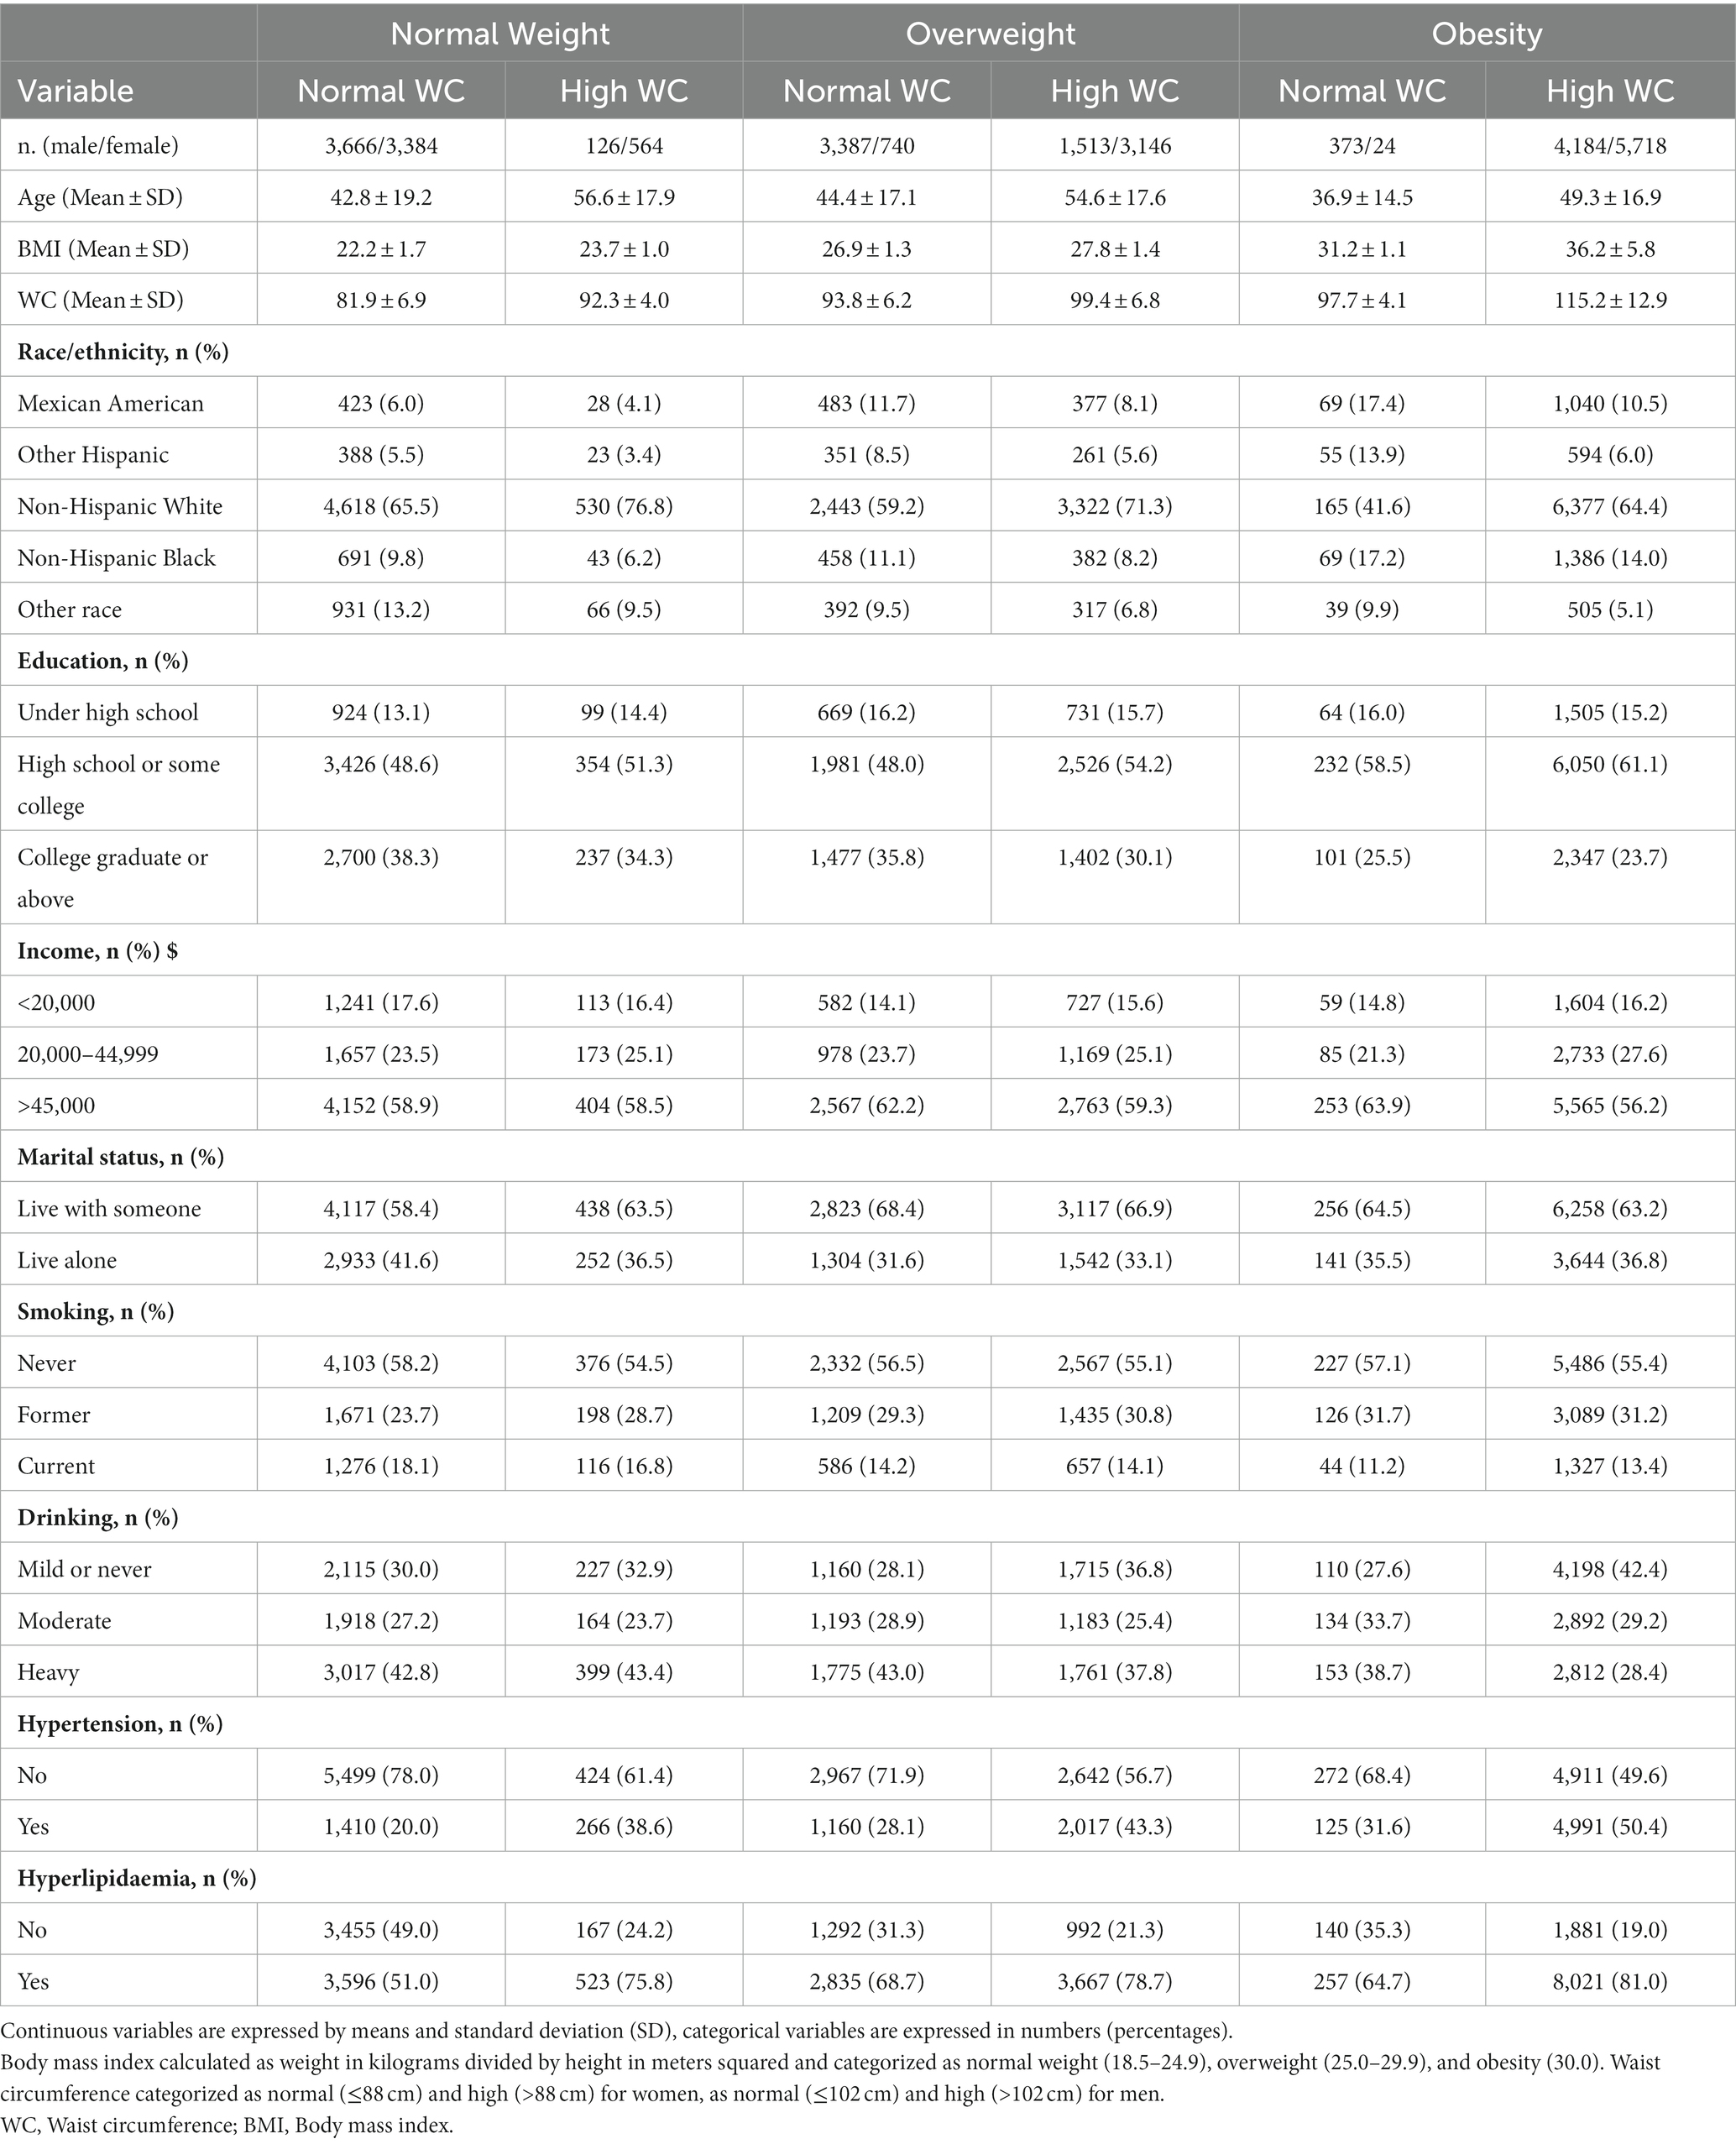
Table 1. Baseline characteristics of the study population (n = 26,825) according to different combinations of BMI and WC.
Table 2 shows the association between different combinations of BMI and WC and the risk of DM. Participants with central obesity in each BMI category had a higher risk of DM than participants with normal-weight central obesity, while participants with no central obesity in the overweight or obese category had a slightly higher or lower risk of DM (OR: 1.62, 95% CI: 1.33–1.98; OR: 0.81, 95% CI: 0.48–1.34, respectively). Similar results were observed after adjusting for confounding factors such as demographics, smoking and alcohol consumption. When stratified by gender, it was found that men with normal-weight central obesity and obesity and central obesity had a similar risk of DM (OR: 3.83, 95% CI: 2.10–5.97; OR: 4.20, 95% CI: 3.48–5.08, respectively), and the risk was higher than that of men with any combination of BMI and WC, including men with overweight and no central obesity (OR: 3.39, 95% CI: 2.68–4.28) and men with obesity and no central obesity (OR: 0.53, 95% CI: 0.30–0.91). Compared with normal-weight non central obesity, obese non central obesity men (n = 373) have a decreased risk of diabetes (OR: 0.53, 95% CI: 0.30–0.91), while obese non central obesity women (n = 24) have an increased risk of diabetes (OR: 2.39, 95% CI: 0.47–12.11).
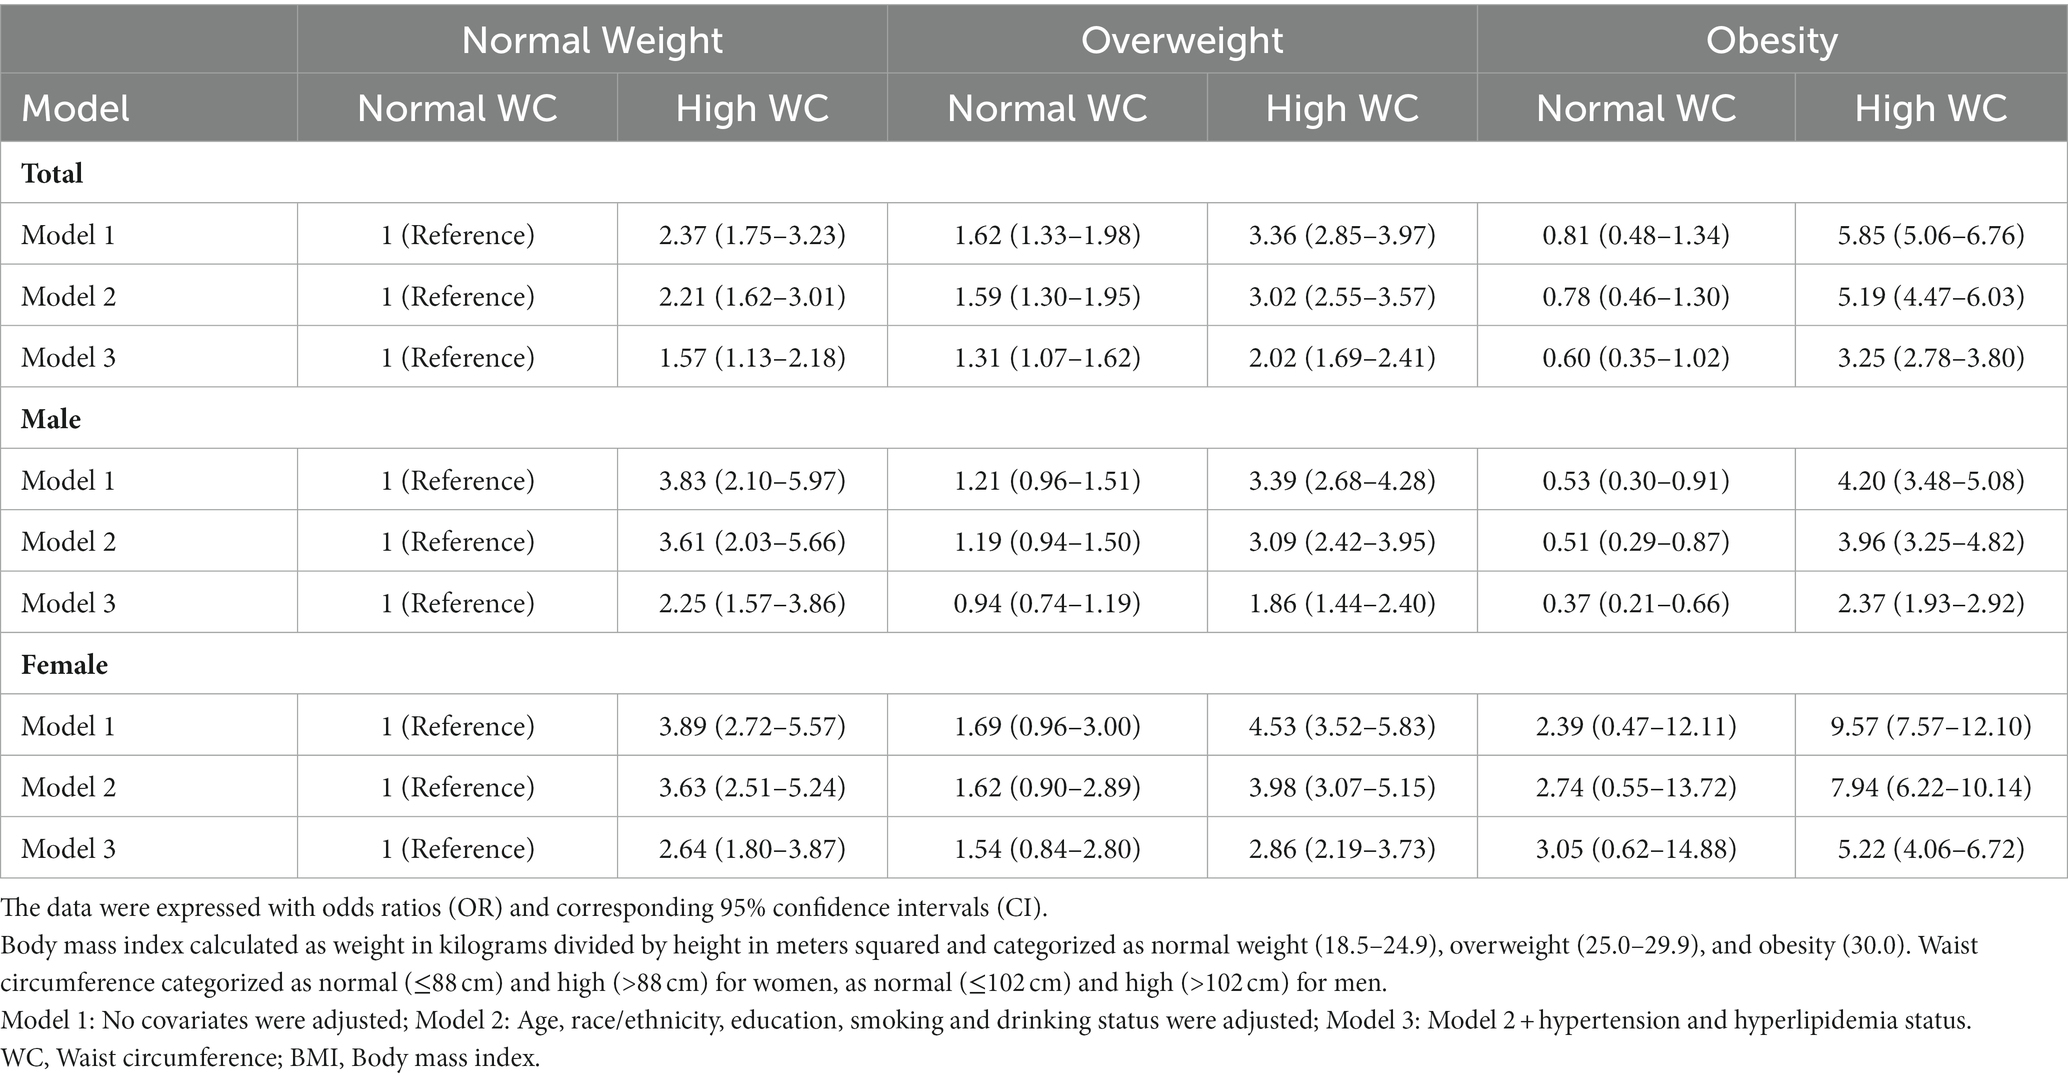
Table 2. Association of different combinations of BMI and WC status with diabetes mellitus among 26,825 participants.
Table 3 shows the results of different combinations of BMI and WC and the risk of DM after stratification by age, race/ethnicity, education level, smoking status, etc. Participants with different levels of education had similar risks of developing DM. Participants with a history of hyperlipidemia, hypertension, and older participants (age ≥ 50) may be at decreased risk of developing DM. Participants with heavy and moderate alcohol consumption had a higher risk of DM than those with mild or no alcohol consumption. In addition, ROC was plotted to assess the ability of BMI and WC to predict DM (Figure 1). The results showed that, compared with BMI, WC had a larger AUC; (AUC: 0.651, 95% CI: 0.643–0.660; AUC: 0.701, 95% CI: 0.693–0.709, respectively), which may be a better predictor of DM. When stratified by gender, WC showed a larger AUC for both male and female participants (Table 4).
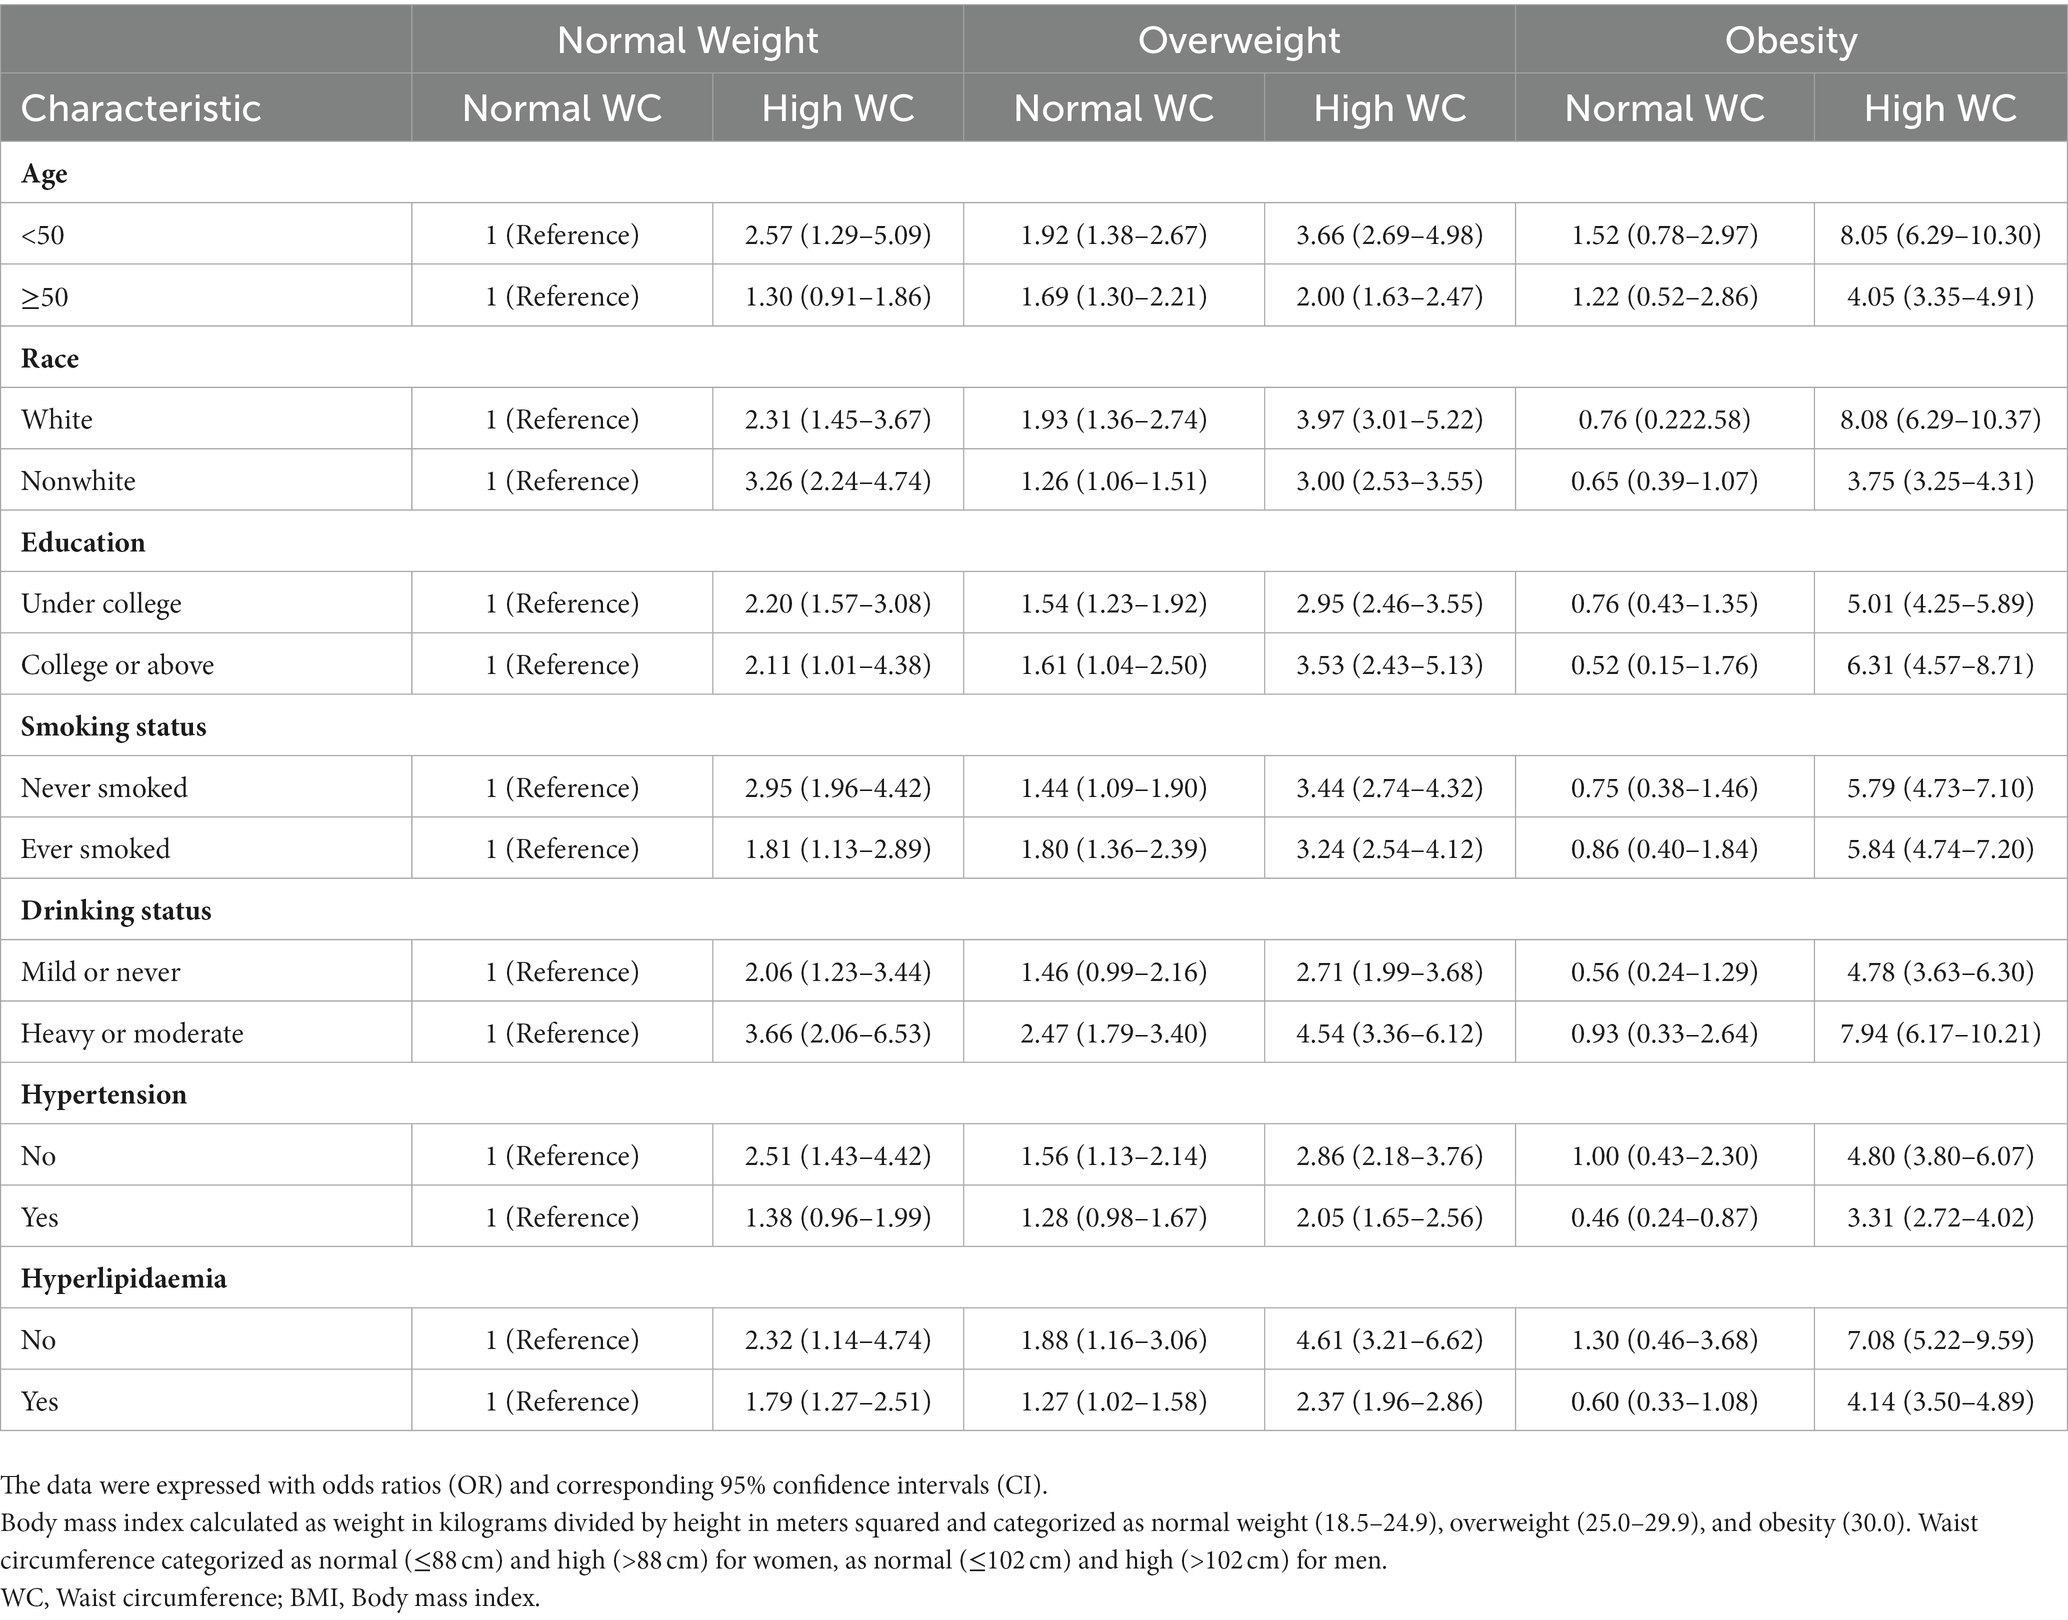
Table 3. Stratified analyses for the association of BMI and WC status with diabetes mellitus.
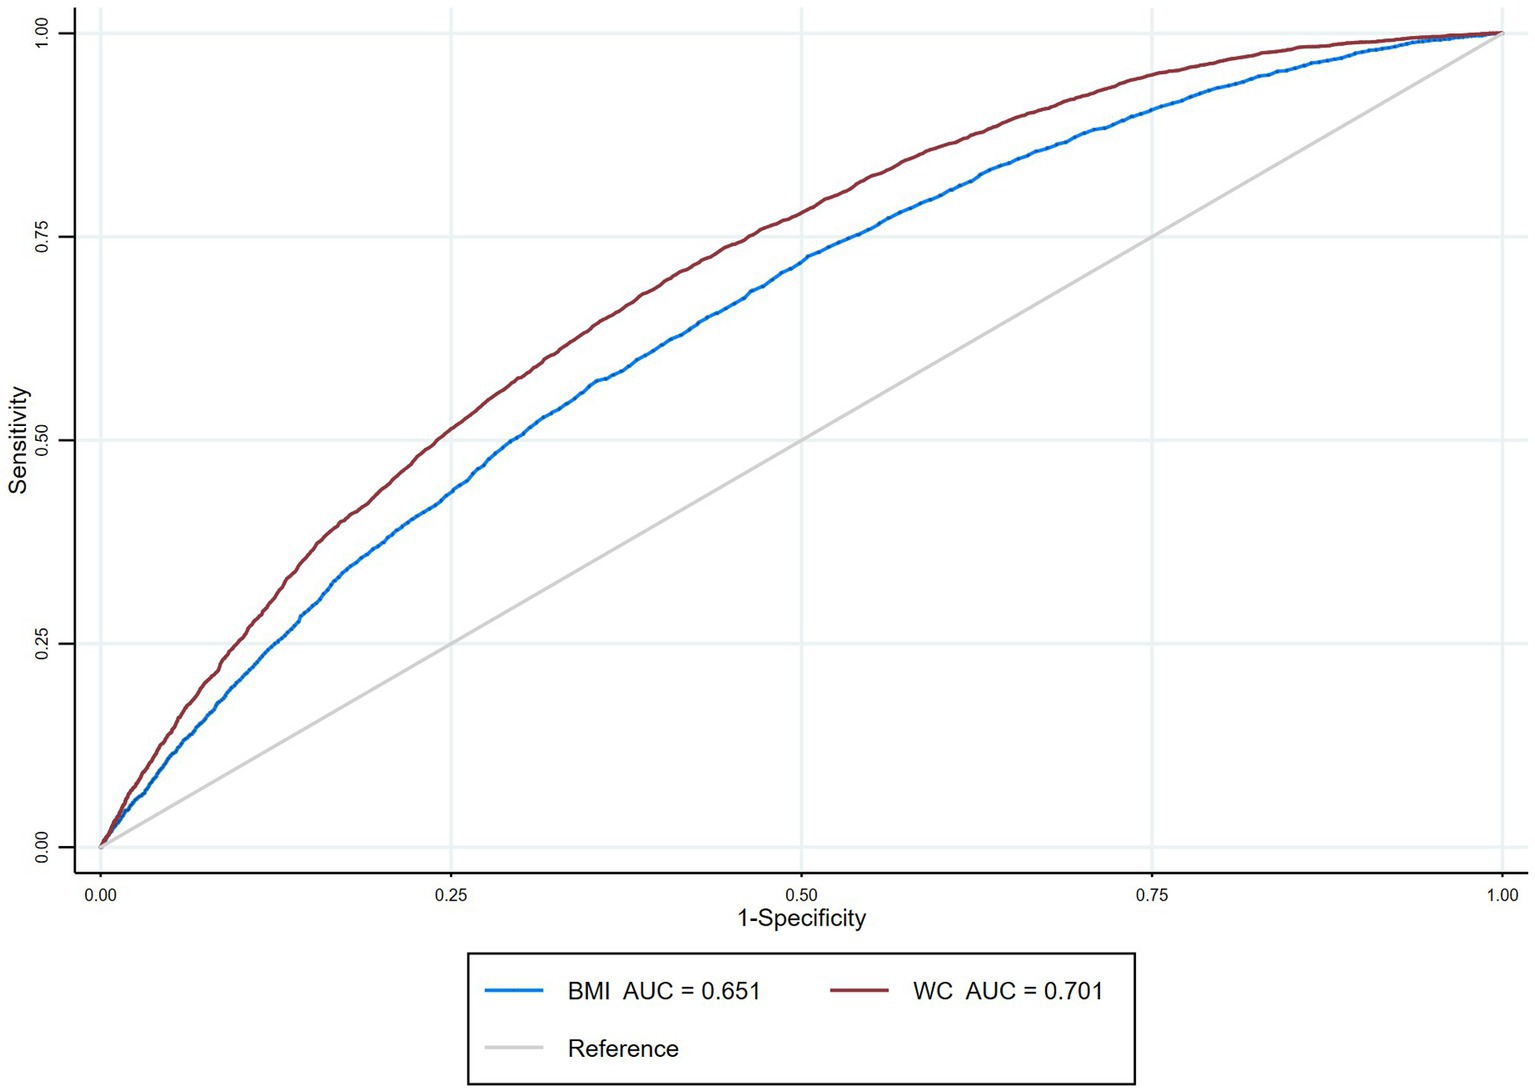
Figure 1. Receiver operating characteristic curves for BMI and waist circumference (WC) predicting diabetes.
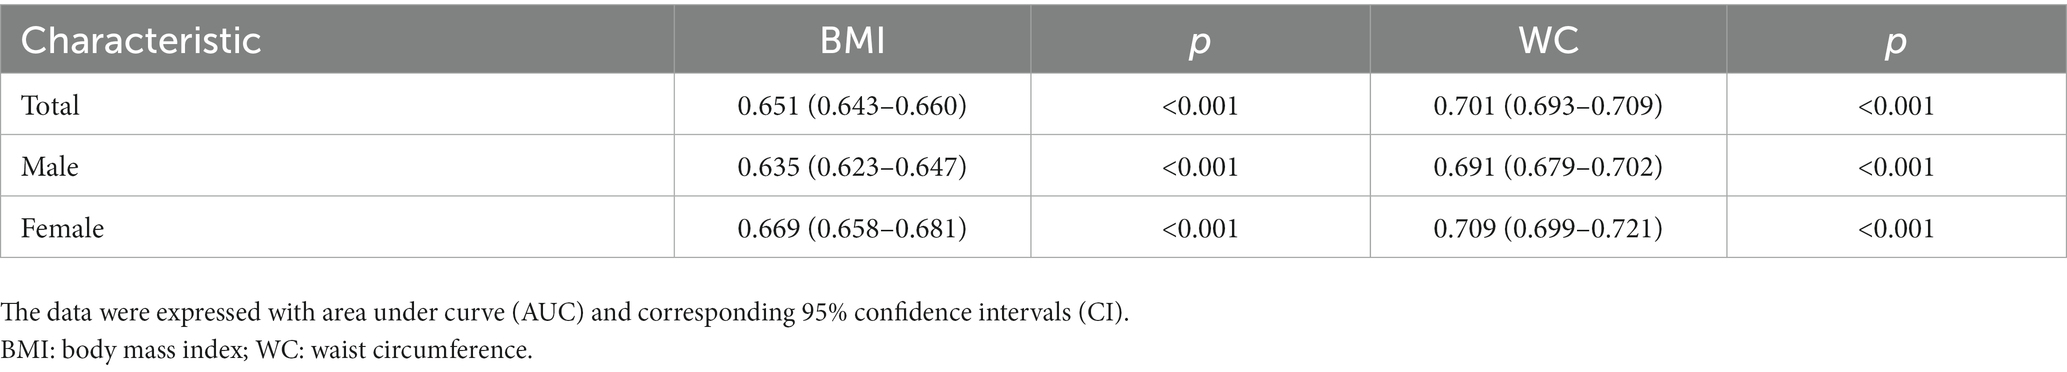
Table 4. The area under curve of BMI and WC in the prediction of DM.
4. Discussion
The results of this large cross-sectional study, which included 26,825 participants from 2009 to 2018, showed that participants with normal-weight central obesity were at an increased risk of developing DM. When stratified by gender, it was found that men with normal-weight central obesity and obesity and central obesity had a similar risk of DM, and the risk was higher than that of men with any combination of BMI and WC, including men with overweight and no central obesity and men with obesity and no central obesity. In addition, the results of the receiver’s operator curve suggest that WC may be a better predictor of DM than BMI.
Some previous literature has reported the association between WC and BMI and the risk of DM, but few studies have investigated the risk of DM in normal-weight central obesity. A cohort study of 3,001 previously diabetic-free participants reported that both WC and BMI were related to an increased risk of type 2 diabetes (T2D) after a median follow-up of 4.7 years, and that BMI was more effective than WC in predicting the occurrence of T2D (30). This is consistent with the conclusions of another observational study involving 9,962 elderly people, which showed that among five different anthropometric parameters such as BMI and WC, BMI was the strongest predictor of the occurrence of DM (31). Another study showed that WC and WHtR were stronger predictors of DM than BMI (32). However, the BMI and WC classifications of these studies were based on baseline conditions and did not take into account changes in body size during follow-up. Studies have shown that with age, the distribution of body fat can change correspondingly, mainly manifested as the accumulation of abdominal fat and the reduction of subcutaneous fat, and these changes can be independent of weight gain (33). Thus, these studies may have a misclassification bias associated with changes in body weight and waist circumference during follow-up, which may affect the stability of the results. In situations where the weight status is mostly defined by BMI, few studies have focused on the population of normal-weight central obesity. Recent literatures have suggested that normal-weight central obesity may have an increased risk of disease, but the outcome measures were defined as cancer and cardiovascular death events (29, 34). Our results are similar to those of a recent cross-sectional study in Japan, which showed an increased risk of DM among 117,163 participants with normal-weight central obesity (19). However, the study did not conduct a stratified analysis of gender. Published evidence shows that the pattern of relationship between WC and BMI is significantly different in males and females (29).
The following reasons may explain why participants with normal-weight central obesity have an increased risk of DM. Firstly, the accumulation of visceral adipose tissue may be an explanation. The accumulation of visceral adipose tissue may have implications for the development of obesity-related diseases, such as diabetes, cardiovascular disease, and some cancers (35–38). And visceral fat accumulation often manifests as abdominal obesity, which is the most common feature of metabolic disease (35). Our linear regression results show that WC and BMI have a weak correlation (correlation coefficient: 0.37), which may prove that WC and BMI provide different information. In general, WC is a measure of abdominal fat accumulation, while BMI is a measure of fat content (20). Second, patients with normal-weight central obesity may have less muscle mass, which is associated with improved metabolic status (20). Previous studies have shown that decreased muscle tissue content may be associated with adverse health outcomes (39–41). Thirdly, gluteo-femoral adipose tissue has a protective effect on metabolism, which can be transmitted through beneficial adipokines such as leptin and adiponectin (42). In individuals with normal-weight central obesity, excess accumulation of abdominal fat may lead to loss of protective gluteo-femoral adipose tissue, which may increase the risk of DM. Conversely, overweight or obese patients may have more gluteal-femoral adipose tissue, which may partly explain why obese participants without central obesity may have a lower incidence of DM. Fourthly, the concept of hepatokines was recently proposed (43). Hepatokines are proteins secreted by the liver that regulate glucose and lipid metabolism (44). The accumulation of fat in the liver affects metabolism by regulating the secretion of specific hepatokines. A Mendelian randomization showed that increased liver fat content was associated with a higher risk of type 2 diabetes (45).
Our conclusions have important public health and clinical value. First, in the current guidelines, BMI is still the standard index to measure obesity clinically, and individuals with normal BMI are classified as normal in practice regardless of their WC. In the recent joint guidelines for obesity management from the American College of Cardiology, the American Heart Association, and the Obesity Society, waist measurement is recommended for individuals who are overweight or class I obesity to assess the risk of obesity-related comorbidities, and not for individuals with a normal BMI because there is insufficient evidence that such individuals increase the risk of obesity (46). The guidelines may convey to clinicians and the general public that individuals with a normal BMI do not have any risk associated with obesity. Whereas individuals with central obesity, even with a normal BMI, are at an increased risk of developing DM. Second, assessing the distribution of adipose tissue usually requires specialized medical equipment, such as magnetic resonance imaging (MRI), and computed tomography (CT). Compared with these equipment, anthropometric parameters such as BMI, WC and WHtR are convenient and easy to obtain, which can greatly improve patient engagement. Our results suggest that WC is a stronger predictor of diabetes than BMI. Therefore, when developing strategies to reduce diabetes risk, such as early exercise and diet modification and timely medical intervention, more attention may be paid to changes in WC. In people with normal-weight central obesity, regular exercise, even with little or no weight loss, can bring about a variety of beneficial changes, such as improved glucose homeostasis and insulin sensitivity (11, 47). In addition, in people with normal-weight central obesity, caloric restriction shows good promise in reducing waist circumference and improving metabolism (48).
4.1. Strengths and limitations
To the best of our knowledge, this is the first cross-sectional study to comprehensively assess the association between different types of obesity and the risk of DM. We used nationally representative standardized data from the NHANES database, which increased the stability of our results. In addition, WC is a simple and reliable measure of visceral fat accumulation, which increases the general applicability of our results. However, our study has the following limitations: First, due to the cross-sectional design of this study, a causal link between obesity and DM cannot be inferred. Second, some of the participants’ diabetes diagnoses were based on self-reporting, which may lead to recall bias. Third, the sample size of obese women with no central obesity is small, which may affect the stability of our results to some extent. In general, a larger BMI is often associated with a larger WC, so obesity without central obesity is not common in the population. The number of obese women with no central obesity included in the analysis was only 24, so the results have a relatively wide 95% CI and must be interpreted with caution. In future studies, more attention can be paid to the obese without central obesity population to investigate their risk of developing metabolic diseases.
5. Conclusion
The results of our cross-sectional study showed that participants with central obesity of normal weight had a higher risk of developing DM. When stratified by sex, men with normal-weight central obesity, obesity and central obesity were found to have a similar risk of DM and an increased risk than men with any combination of BMI and WC, including men who were overweight with no central obesity and obese with no central obesity. Our results highlight that BMI alone cannot distinguish the distribution of adipose tissue, and that even in people with normal BMI, the risk of DM may be increased due to excessive accumulation of abdominal fat. The exact mechanism between different types of obesity and a higher risk of DM needs to be clarified with larger sample sizes and more well-designed prospective studies.
Data availability statement
The original contributions presented in the study are included in the article/supplementary material, further inquiries can be directed to the corresponding author.
Ethics statement
Research involving human participants were approved by the National Center for Health Statistics (NCHS) Research Ethics Review Board. The participants provided written informed consent to participate in this study.
Author contributions
XSJ designed the study, analyzed the feasibility of the study, and wrote the manuscript of the paper. QYC, JHL, GFW, and LHL extracted the data. SJ, XZ, and ZQL collated and merged the data. JJL conducted the statistical analysis, drew figures and tables. ACY reviewed the manuscript, provided critical scientific input, and checked the whole process of the study. All authors contributed to the article and approved the submitted version.
Acknowledgments
All the authors acknowledged that the study was conducted without any business or financial relationship.
Conflict of interest
The authors declare that the research was conducted in the absence of any commercial or financial relationships that could be construed as a potential conflict of interest.
Publisher’s note
All claims expressed in this article are solely those of the authors and do not necessarily represent those of their affiliated organizations, or those of the publisher, the editors and the reviewers. Any product that may be evaluated in this article, or claim that may be made by its manufacturer, is not guaranteed or endorsed by the publisher.
References
1. Trends in adult body-mass index in 200 countries from. To 2014: a pooled analysis of 1698 population-based measurement studies with 19·2 million participants. Lancet. (1975) 387:1377–96. doi: 10.1016/S0140-6736(16)30054-X
2. Fan, J, Song, Y, Chen, Y, Hui, R, and Zhang, W. Combined effect of obesity and cardio-metabolic abnormality on the risk of cardiovascular disease: a meta-analysis of prospective cohort studies. Int J Cardiol. (2013) 168:4761–8. doi: 10.1016/j.ijcard.2013.07.230
3. Putra, ICS, Kamarullah, W, Prameswari, HS, Pramudyo, M, Iqbal, M, Achmad, C, et al. Metabolically unhealthy phenotype in normal weight population and risk of mortality and major adverse cardiac events: a meta-analysis of 41 prospective cohort studies. Diabetes Metab Syndr. (2022) 16:102635. doi: 10.1016/j.dsx.2022.102635
4. Eckel, N, Meidtner, K, Kalle-Uhlmann, T, Stefan, N, and Schulze, MB. Metabolically healthy obesity and cardiovascular events: a systematic review and meta-analysis. Eur J Prev Cardiol. (2016) 23:956–66. doi: 10.1177/2047487315623884
5. Opio, J, Croker, E, Odongo, GS, Attia, J, Wynne, K, and McEvoy, M. Metabolically healthy overweight/obesity are associated with increased risk of cardiovascular disease in adults, even in the absence of metabolic risk factors: a systematic review and meta-analysis of prospective cohort studies. Obes Rev. (2020) 21:e13127. doi: 10.1111/obr.13127
6. Yeh, T-L, Chen, H-H, Tsai, S-Y, Lin, C-Y, Liu, S-J, and Chien, K-L. The relationship between metabolically healthy obesity and the risk of cardiovascular disease: a systematic review and Meta-analysis. J Clin Med. (2019) 8:1228. doi: 10.3390/jcm8081228
7. Zheng, R, Zhou, D, and Zhu, Y. The long-term prognosis of cardiovascular disease and all-cause mortality for metabolically healthy obesity: a systematic review and meta-analysis. J Epidemiol Community Health. (2016) 70:1024–31. doi: 10.1136/jech-2015-206948
8. Stefan, N, and Schulze, MB. Metabolic health and cardiometabolic risk clusters: implications for prediction, prevention, and treatment. Lancet Diabetes Endocrinol. (2023) 11:426–40. doi: 10.1016/S2213-8587(23)00086-4
9. Stefan, N. Causes, consequences, and treatment of metabolically unhealthy fat distribution. Lancet Diabetes Endocrinol. (2020) 8:616–27. doi: 10.1016/S2213-8587(20)30110-8
10. Stefan, N, Schick, F, and Häring, H-U. Causes, characteristics, and consequences of metabolically unhealthy Normal weight in humans. Cell Metab. (2017) 26:292–300. doi: 10.1016/j.cmet.2017.07.008
11. Magkos, F. Metabolically healthy obesity: what's in a name? Am J Clin Nutr. (2019) 110:533–9. doi: 10.1093/ajcn/nqz133
12. Ma, RCW. Epidemiology of diabetes and diabetic complications in China. Diabetologia. (2018) 61:1249–60. doi: 10.1007/s00125-018-4557-7
13. Nanditha, A, Ma, RCW, Ramachandran, A, Snehalatha, C, Chan, JCN, Chia, KS, et al. Diabetes in Asia and the Pacific: implications for the global epidemic. Diabetes Care. (2016) 39:472–85. doi: 10.2337/dc15-1536
14. Bermúdez, V, Salazar, J, Rojas, J, Calvo, M, Rojas, M, Chávez-Castillo, M, et al. Diabetes and impaired fasting glucose prediction using anthropometric indices in Adults from Maracaibo City. Venezuela J Commun Health. (2016) 41:1223–33. doi: 10.1007/s10900-016-0209-3
15. He, S, Zheng, Y, and Chen, X. Assessing a new hip index as a risk predictor for diabetes mellitus. J Diabetes Investig. (2018) 9:799–805. doi: 10.1111/jdi.12756
16. Petermann-Rocha, F, Ulloa, N, Martínez-Sanguinetti, MA, Leiva, AM, Martorell, M, Villagrán, M, et al. Is waist-to-height ratio a better predictor of hypertension and type 2 diabetes than body mass index and waist circumference in the Chilean population? Nutrition. (2020) 79-80:110932. doi: 10.1016/j.nut.2020.110932
17. Chung, T-L, Liu, Y-H, Wu, P-Y, Huang, J-C, and Chen, S-C. Sex difference in the associations among obesity-related indices with incidence of diabetes mellitus in a large Taiwanese population follow-up study. Front Public Health. (2023) 11:1094471. doi: 10.3389/fpubh.2023.1094471
18. Shirasawa, T, Ochiai, H, Yoshimoto, T, Nagahama, S, Kobayashi, M, Ohtsu, I, et al. Associations between normal weight central obesity and cardiovascular disease risk factors in Japanese middle-aged adults: a cross-sectional study. J Health Popul Nutr. (2019) 38:46. doi: 10.1186/s41043-019-0201-5
19. Goh, VHH, and Hart, WG. Excess fat in the abdomen but not general obesity is associated with poorer metabolic and cardiovascular health in premenopausal and postmenopausal Asian women. Maturitas. (2018) 107:33–8. doi: 10.1016/j.maturitas.2017.10.002
20. Sun, Y, Liu, B, Snetselaar, LG, Wallace, RB, Caan, BJ, Rohan, TE, et al. Association of Normal-Weight Central Obesity with all-Cause and Cause-Specific Mortality among Postmenopausal Women. JAMA Netw Open. (2019) 2:e197337. doi: 10.1001/jamanetworkopen.2019.7337
21. Jensen, MD, Ryan, DH, Apovian, CM, Ard, JD, Comuzzie, AG, Donato, KA, et al. 2013 AHA/ACC/TOS guideline for the management of overweight and obesity in adults: a report of the American College of Cardiology/American Heart Association task force on practice guidelines and the Obesity Society. Circulation. (2014) 129:S102–38. doi: 10.1161/01.cir.0000437739.71477.ee
22. Yokose, C, McCormick, N, Lu, N, Tanikella, S, Lin, K, Joshi, AD, et al. Trends in prevalence of gout among US Asian adults, 2011-2018. JAMA Netw Open. (2023) 6:e239501. doi: 10.1001/jamanetworkopen.2023.9501
23. Liu, Y, Geng, T, Wan, Z, Lu, Q, Zhang, X, Qiu, Z, et al. Associations of serum folate and vitamin B12 levels with cardiovascular disease mortality among patients with type 2 diabetes. JAMA Netw Open. (2022) 5:e2146124. doi: 10.1001/jamanetworkopen.2021.46124
24. Grundy, SM, Cleeman, JI, Daniels, SR, Donato, KA, Eckel, RH, Franklin, BA, et al. Diagnosis and management of the metabolic syndrome: an American Heart Association/National Heart, Lung, and Blood Institute scientific statement. Circulation. (2005) 112:2735–52. doi: 10.1161/CIRCULATIONAHA.105.169404
25. Moura, LDANE, Pagotto, V, Camargo Pereira, C, de Oliveira, C, and Silveira, EA. Does abdominal obesity increase all-cause, cardiovascular disease, and Cancer mortality risks in older adults? A 10-year follow-up analysis. Nutrients. (2022) 14:4315. doi: 10.3390/nu14204315
26. 2. Classification and Diagnosis of Diabetes. Standards of medical Care in Diabetes-2021. Diabetes Care. (2021) 44:S15–33. doi: 10.2337/dc21-S002
27. National Cholesterol Education Program (NCEP) Expert Panel on Detection, Evaluation, and Treatment of High Blood Cholesterol in Adults (Adult Treatment Panel III). Third report of the National Cholesterol Education Program (NCEP) expert panel on detection, evaluation, and treatment of high blood cholesterol in adults (adult treatment panel III) final report. Circulation. (2002) 106:3143–421. doi: 10.1161/circ.106.25.3143
28. Unger, T, Borghi, C, Charchar, F, Khan, NA, Poulter, NR, Prabhakaran, D, et al. 2020 International Society of Hypertension Global Hypertension Practice Guidelines. Hypertension. (2020) 75:1334–57. doi: 10.1161/HYPERTENSIONAHA.120.15026
29. Sahakyan, KR, Somers, VK, Rodriguez-Escudero, JP, Hodge, DO, Carter, RE, Sochor, O, et al. Normal-weight central obesity: implications for Total and cardiovascular mortality. Ann Intern Med. (2015) 163:827–35. doi: 10.7326/M14-2525
30. Li, S, Wang, Y, Ying, Y, Gong, Q, Lou, G, Liu, Y, et al. Independent and joint associations of BMI and waist circumference with the onset of type 2 diabetes mellitus in Chinese adults: prospective data linkage study. JMIR Public Health Surveill. (2023) 9:e39459. doi: 10.2196/42469
31. Yang, J, Wang, F, Wang, J, Han, X, Hu, H, Yu, C, et al. Using different anthropometric indices to assess prediction ability of type 2 diabetes in elderly population: a 5 year prospective study. BMC Geriatr. (2018) 18:218. doi: 10.1186/s12877-018-0912-2
32. Jia, Z, Zhou, Y, Liu, X, Wang, Y, Zhao, X, Wang, Y, et al. Comparison of different anthropometric measures as predictors of diabetes incidence in a Chinese population. Diabetes Res Clin Pract. (2011) 92:265–71. doi: 10.1016/j.diabres.2011.01.021
33. Kuk, JL, Saunders, TJ, Davidson, LE, and Ross, R. Age-related changes in total and regional fat distribution. Ageing Res Rev. (2009) 8:339–48. doi: 10.1016/j.arr.2009.06.001
34. Hamer, M, O'Donovan, G, Stensel, D, and Stamatakis, E. Normal-weight central obesity and risk for mortality. Ann Intern Med. (2017) 166:917–8. doi: 10.7326/L17-0022
35. Zhang, X, Ha, S, Lau, HC-H, and Yu, J. Excess body weight: novel insights into its roles in obesity comorbidities. Semin Cancer Biol. (2023) 92:16–27. doi: 10.1016/j.semcancer.2023.03.008
36. Després, JP. Intra-abdominal obesity: an untreated risk factor for type 2 diabetes and cardiovascular disease. J Endocrinol Investig. (2006) 29:77–82.
37. Arcidiacono, B, Iiritano, S, Nocera, A, Possidente, K, Nevolo, MT, Ventura, V, et al. Insulin resistance and cancer risk: an overview of the pathogenetic mechanisms. Exp Diabetes Res. (2012) 2012:789174. doi: 10.1155/2012/789174
38. Katsuki, A, Sumida, Y, Urakawa, H, Gabazza, EC, Murashima, S, Maruyama, N, et al. Increased visceral fat and serum levels of triglyceride are associated with insulin resistance in Japanese metabolically obese, normal weight subjects with normal glucose tolerance. Diabetes Care. (2003) 26:2341–4. doi: 10.2337/diacare.26.8.2341
39. Li, R, Xia, J, Zhang, XI, Gathirua-Mwangi, WG, Guo, J, Li, Y, et al. Associations of muscle mass and strength with all-cause mortality among US older adults. Med Sci Sports Exerc. (2018) 50:458–67. doi: 10.1249/MSS.0000000000001448
40. Lee, Y-H, Kim, KJ, Yoo, ME, Kim, G, Yoon, H-J, Jo, K, et al. Association of non-alcoholic steatohepatitis with subclinical myocardial dysfunction in non-cirrhotic patients. J Hepatol. (2018) 68:764–72. doi: 10.1016/j.jhep.2017.11.023
41. Srikanthan, P, and Karlamangla, AS. Muscle mass index as a predictor of longevity in older adults. Am J Med. (2014) 127:547–53. doi: 10.1016/j.amjmed.2014.02.007
42. Manolopoulos, KN, Karpe, F, and Frayn, KN. Gluteofemoral body fat as a determinant of metabolic health. Int J Obes. (2010) 34:949–59. doi: 10.1038/ijo.2009.286
43. Stefan, N, Kantartzis, K, and Häring, H-U. Causes and metabolic consequences of fatty liver. Endocr Rev. (2008) 29:939–60. doi: 10.1210/er.2008-0009
44. Stefan, N, Schick, F, Birkenfeld, AL, Häring, H-U, and White, MF. The role of hepatokines in NAFLD. Cell Metab. (2023) 35:236–52. doi: 10.1016/j.cmet.2023.01.006
45. Martin, S, Sorokin, EP, Thomas, EL, Sattar, N, Cule, M, Bell, JD, et al. Estimating the effect of liver and pancreas volume and fat content on risk of diabetes: a Mendelian randomization study. Diabetes Care. (2022) 45:460–8. doi: 10.2337/dc21-1262
46. Jensen, MD, Ryan, DH, Apovian, CM, Ard, JD, Comuzzie, AG, Donato, KA, et al. 2013 AHA/ACC/TOS guideline for the management of overweight and obesity in adults: a report of the American College of Cardiology/American Heart Association task force on practice guidelines and the Obesity Society. J Am Coll Cardiol. (2014) 63:2985–3023. doi: 10.1016/j.jacc.2013.11.004
47. Lin, X, Zhang, X, Guo, J, Roberts, CK, McKenzie, S, Wu, W-C, et al. Effects of exercise training on cardiorespiratory fitness and biomarkers of Cardiometabolic health: a systematic review and Meta-analysis of randomized controlled trials. J Am Heart Assoc. (2015) 4:e002014. doi: 10.1161/JAHA.115.002014
Keywords: normal-weight central obesity, body mass index, waist circumference, diabetes mellitus, National Health and Nutrition Examination Survey
Citation: Jin X, Liu J, Cao Q, Lin J, Wu G, Liu L, Jiang S, Zhou X, Li Z and Yang A (2023) Normal-weight central obesity: implications for diabetes mellitus. Front. Nutr. 10:1239493. doi: 10.3389/fnut.2023.1239493
Edited by:
Faidon Magkos, University of Copenhagen, DenmarkReviewed by:
Norbert Stefan, University of Tübingen, GermanyJose De Jesus Garduno Garcia, Universidad Autónoma del Estado de México, Mexico
Copyright © 2023 Jin, Liu, Cao, Lin, Wu, Liu, Jiang, Zhou, Li and Yang. This is an open-access article distributed under the terms of the Creative Commons Attribution License (CC BY). The use, distribution or reproduction in other forums is permitted, provided the original author(s) and the copyright owner(s) are credited and that the original publication in this journal is cited, in accordance with accepted academic practice. No use, distribution or reproduction is permitted which does not comply with these terms.
*Correspondence: Aicheng Yang, ZWFzeW11MjAwOEAxNjMuY29t
†These authors have contributed equally to this work