- 1Graduate School, Beijing University of Chinese Medicine, Beijing, China
- 2Department of Oncology, China-Japan Friendship Hospital, Beijing, China
- 3Department of Oncology, Beijing Hospital of Traditional Chinese Medicine, Capital Medical University, Beijing, China
- 4Capital Medical University, Beijing, China
- 5Department of Oncology, Beijing of Chinese Medicine Second Affiliated Dong Fang Hospital, Beijing, China
Purpose: Central obesity may contribute to breast cancer (BC); however, there is no dose–response relationship. This meta-analysis examined the effects of central obesity on BC and their potential dose–response relationship.
Methods: In the present study, PubMed, Medline, Embase, and Web of Science were searched on 1 August 2022 for published articles. We included the prospective cohort and case–control studies that reported the relationship between central obesity and BC. Summary effect size estimates were expressed as risk ratios (RRs) or odds ratios (ORs) with 95% confidence intervals (95% CI) and were evaluated using random-effect models. The inconsistency index (I2) was used to quantify the heterogeneity magnitude derived from the random-effects Mantel–Haenszel model.
Results: This meta-analysis included 57 studies (26 case–control and 31 prospective cohort) as of August 2022. Case–control studies indicated that waist circumference (WC) (adjusted OR = 1.18; 95% CI: 1.00–1.38; P = 0.051) and waist-to-hip ratio (WHR) (adjusted OR = 1.28; 95% CI: 1.07–1.53; P = 0.008) were significantly positively related to BC. Subgroup analysis showed that central obesity measured by WC increased the premenopausal (adjusted OR = 1.15; 95% CI: 0.99–1.34; P = 0.063) and postmenopausal (adjusted OR = 1.18; 95% CI: 1.03–1.36; P = 0.018) BC risk and the same relationship appeared in WHR between premenopausal (adjusted OR = 1.38; 95% CI: 1.19–1.59; P < 0.001) and postmenopausal (adjusted OR = 1.41; 95% CI: 1.22–1.64; P < 0.001). The same relationship was observed in hormone receptor-positive (HR+) (adjusted ORWC = 1.26; 95% CI: 1.02–1.57; P = 0.035, adjusted ORWHR = 1.41; 95% CI: 1.00–1.98; P = 0.051) and hormone receptor-negative (HR–) (adjusted ORWC = 1.44; 95% CI: 1.13–1.83; P = 0.003, adjusted ORWHR = 1.42; 95% CI: 0.95–2.13; P = 0.087) BCs. Prospective cohort studies indicated that high WC (adjusted RR = 1.12; 95% CI: 1.08–1.16; P < 0.001) and WHR (adjusted RR = 1.05; 95% CI: 1.018–1.09; P = 0.017) may increase BC risk. Subgroup analysis demonstrated a significant correlation during premenopausal (adjusted RR = 1.08; 95% CI: 1.02–1.14; P = 0.007) and postmenopausal (adjusted RR = 1.14; 95% CI: 1.10–1.19; P < 0.001) between BC and central obesity measured by WC, and WHR was significantly positively related to BC both premenopausal (adjusted RRpre = 1.04; 95% CI: 0.98–1.11; P = 0.169) and postmenopausal (adjusted RRpost = 1.04; 95% CI: 1.02–1.07; P = 0.002). Regarding molecular subtype, central obesity was significantly associated with HR+ (adjusted ORWC = 1.13; 95% CI: 1.07–1.19; P < 0.001, adjusted ORWHR = 1.03; 95% CI: 0.98–1.07; P = 0.244) and HR– BCs (adjusted ORWC =1.11; 95% CI: 0.99–1.24; P = 0.086, adjusted ORWHR =1.01; 95% CI: 0.91–1.13; P = 0.808). Our dose–response analysis revealed a J-shaped trend in the relationship between central obesity and BC (measured by WC and WHR) in case–control studies and an inverted J-shaped trend between BMI (during premenopausal) and BC in the prospective cohort.
Conclusion: Central obesity is a risk factor for premenopausal and postmenopausal BC, and WC and WHR may predict it. Regarding the BC subtype, central obesity is proven to be a risk of ER+ and ER- BCs. The dose–response analysis revealed that when BMI (during premenopausal) exceeded 23.40 kg/m2, the risk of BC began to decrease, and WC higher than 83.80 cm or WHR exceeded 0.78 could efficiently increase the BC risk.
Systematic review registration: https://www.crd.york.ac.uk/PROSPERO/, identifier: CRD42022365788.
Introduction
Breast cancer (BC) has surpassed lung cancer as the most commonly diagnosed cancer, with an estimated 2.3 million new cases accounting for ~11.7% of all cancers (1). BC has become a global public health concern accompanied by a large financial burden on healthcare systems (2). Given this disease burden, identifying potentially modifiable factors associated with BC development is of public health significance.
Studies have linked high BC risk to age, age of menarche and menopause, childbearing, nursing, family history, genetic risk, mammographic density, previous benign breast disease, radiation, obesity, oral contraceptives, hormonal replacement treatment, and diabetes mellitus (3, 4). Despite being beneficial in premenopausal women, high BMI may raise breast cancer risk in postmenopausal women (3). Obesity has become a global epidemic in recent decades. It can cause many ailments (5). It is widely accepted that central obesity is a serious risk factor for illnesses related to obesity, and the accumulation of visceral fat promotes the release of pro-oxidants, pro-inflammatory, and reactive oxygen species (ROS) (6).
The research found that the World Cancer Research Fund diagnosed women with a waist circumference (WC) > 85 cm or a waist–hip ratio (WHR) > 0.85 as central obesity (7). Central obesity increases BC risk (8). A 2003 systematic review found that WC and WHR increased postmenopausal BC but not premenopausal BC in cohort studies with the most adjusted data (without weight or BMI adjustment). The BMI adjustment of the limited cohort abolished this relationship but introduced premenopausal BC (9). Evidence from a 2016 dose–response meta-analysis of prospective studies reported that central obesity was measured by WC but not by WHR. Moreover, WC was related to premenopausal (RRper 10-cm increase = 1.09, 95% CI: 1.02–1.16, I2 = 0%) and postmenopausal BC (RRper 10-cm increase = 1.05, 95% CI: 1.02–1.08, I2 = 6.3%) when considering body mass index (BMI) adjusted RRs (10). However, a recent update study indicated that higher WC was not associated with premenopausal BC, while postmenopausal BC risk was significantly positively related to all adiposity measures evaluated (11). These studies are contradictory and lack the analysis of measurement metrics for BC analysis subtype studies.
Despite decades of studies, the association between central obesity and BC risk is contentious due to menstrual cycles, and the comprehensive meta-analysis and dose–response relationship is uncertain. This meta-analysis aimed to detect the relationship between central obesity and BC risk and to conduct a dose–response analysis to explore the linear relationship between them.
Method
Protocol and registration
Our study rigorously followed Preferred Reporting Items for Systematic Review and Meta-Analysis (PRISMA) guidelines. PRISMA checklist is shown in Supplementary Table 1. The study has been registered on the PROSPERO for systematic reviews (registration number CRD42022365788).
Search strategy
In the current study, PubMed, Medline, Embase, and Web of Science were searched with medical terms to identify the potential eligible articles that reported the association of central obesity and the risk of BC until August 2022. Supplementary Table 2 displays the full details of our search strategy.
Inclusion/exclusion criteria
Studies that met the following criteria simultaneously were included: (1) population: BC-diagnosed women; (2) exposure: body mass index (BMI), hip circumference (HC), waist circumference (WC), and waist–hip ratio (WHR) were the exposure of interest; (3) outcome: the study outcome was BC; (4) estimate effect: relative risks (RR)s or odd ratios (OR)s and 95% confidence intervals (CIs) of the association between obesity and BC were reported; (5) study design: prospective cohort or case–control studies, including retrospective and nested case–control cohorts; (6) only articles in the English language were chosen.
The exclusion criteria of the meta-analysis were as follows: (1) publications without original data, such as reviews, editorials, and comments; (2) used specific body fat content as the exposure, such as abdominal or leg fat mass; (3) unpublished articles. (4) To avoid the influence of different races on the categorization of central obesity, studies on race-specific studies were excluded.
The most complete one was included when multiple publications from the same study were available.
Study selection
Endnote version 20 was used for literature management to file the search records of the articles. The study was selected by two authors (MY and HC) following three steps: First, they screened all retrieved article titles and included them if at least one reviewer found them eligible. It was included in the abstract review stage if there was any doubt. Second, two independent reviewers reassessed abstract eligibility using inclusion and exclusion criteria. Finally, two independent reviewers assessed the full text using standardized eligibility criteria and included the final eligible articles. If the reviewers disagreed with any of the three processes, a third independent reviewer (X. Q.) from our group made a decision following a discussion.
Data extraction
Two investigators (HC and MQ) independently extracted data for the qualified studies, which included the following items: first author, publication year, country of study, sample size, study type, population age, number of cases, follow-up years, estimated effects for all categories, menstrual status, measurement index, and type and status of hormone receptors. When studies reported multiple RRs or ORs, we used the effect size that maximally adjusted for potentially confounding variables. Any disagreement was resolved by consensus.
The main outcome of our research was the impact of central obesity on the BC risk. The secondary outcome was the association of central obesity with the risk of developing BC in different BC subtypes [e.g., estrogen receptor-positive (ER+) BC and estrogen receptor-negative (ER–) BC]. All relevant data from eligible articles were adjusted for relevant confounders.
Quality evaluation
The Newcastle–Ottawa Scale (NOS) tool (12) was used to assess the bias risk in selected studies, evaluated by two reviewers (HC and MQ) independently. The NOS tool contains eight items, which can be categorized into three dimensions for prospective cohort or case–control studies: selection (four items, one star each), comparability (one item, up to two stars), and outcome (three items, one star each). Research with scores of “0–3”, “4–6,” and “7–9” was regarded as “low,” “medium,” and “high” quality, respectively (13). Any disputes arising from the quality evaluation will be handed over to a third reviewer (MY) for adjudication.
Data synthesis and statistical analysis
STATA software version 14.1 for Windows (StataCorp, College Station, TX, USA) was used to assess the data management and analysis. A two-tailed p-value < 0.05 was considered statistically significant. Our meta-analysis reported effect sizes as risk ratios (RRs) with 95% confidence intervals (CIs) in cohort studies and odds ratios (ORs) with 95% CIs in case–control studies. We transformed studies that reported effect estimates as hazard ratios (HRs) to risk ratios (RRs) using Zhang's technique (14). The random-effects model (DerSimonian and Laird method) was employed to generate summary RRs and 95% CIs.
Greenland and Longnecker's generalized least-squares trend (GLST) estimation approach was used to estimate study-specific slopes across the measurement index in linear dose–response analyses using STATA version 14.1. The restricted cubic splines of exposure distributions with three knots (25th, 50th, and 75th percentiles) were used to test non-linearity between central obesity and BC.
Statistical heterogeneity across the included studies was assessed using the Q statistic (15), and inconsistency was quantified by the I2 statistic (16). Sensitivity analyses were conducted by omitting one study each time to assess the impact of individual studies on combined ORs or RRs (17) (Supplementary Figures 1, 2). Potential publication bias was evaluated with Begg's (18) and Egger's tests (19). We used Duval and Tweedie's trim-and-fill methods to detect the effect of possible missing studies on the overall effect (20).
Since WC and HC were not measured by unified units in various included studies, heterogeneous units were converted to centimeters (cm) for analysis. If data were available, we performed subgroup analyses to study whether central obesity and BC risk differed by study design, geographical location, follow-up years, menopause status, BC subtype, and measurement index.
Results
Eligible studies
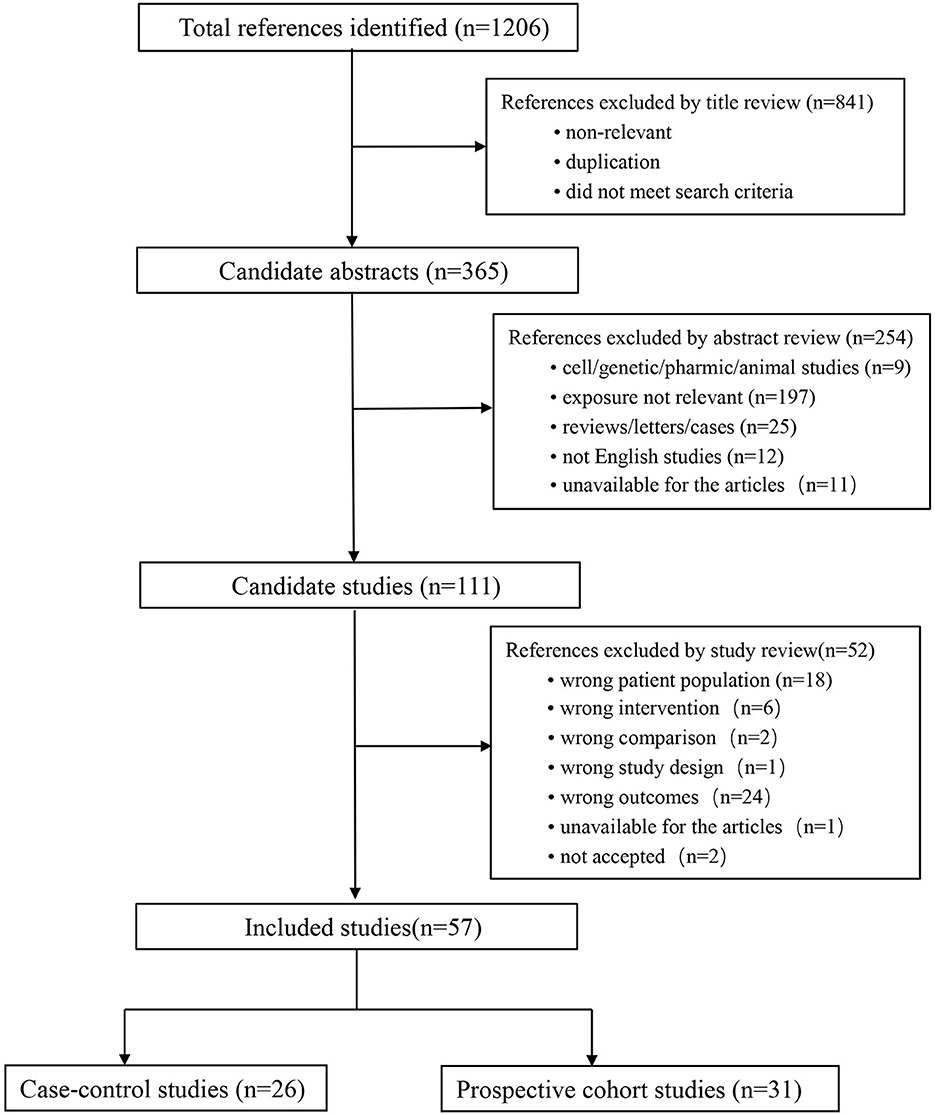
The detailed selection process is schematized in Figure 1. Our initial search yielded 1,206 records. After excluding 841 irrelevant articles by title and abstract screening, 365 full texts were carefully reviewed. Finally, 57 publications with 7,979,624 participants were included in this dose–response meta-analysis, including 27 case–control and 30 prospective cohort studies. All included studies were original studies published between 1990 and 2022.
Study characteristics
Supplementary Tables 3, 4 show the baseline characteristics of case–control and prospective cohort studies, respectively. Of the 57 eligible articles, 26 (21–46) studies were case–control studies and 31 (47–77) studies were prospective cohort studies. The studies were widely distributed in all regions of the world, of which 11 (24, 33–35, 42, 43, 45, 46, 63, 69, 77) were conducted in Asia, 18 (32, 39, 40, 47–49, 52, 53, 60, 62, 64, 66, 67, 71, 74, 75) in Europe, and 17 (22, 44, 50, 51, 55, 57–59, 61, 70, 72, 73, 76) in North America. South America, Africa, Oceania, and Australia each had six (26, 27, 30, 31, 41, 68), five (21, 29, 36–38), and two (56, 65) studies. In 26 (21–46) case–control studies, 107,691 participants and 24,241 cases were analyzed in the meta-analysis. In 31 (21–46) prospective cohort studies, 7,945,816 participants and 100,644 cases were analyzed.
Quality assessment
Supplementary Tables 5, 6 show the quality assessment of all eligible articles by the NOS tool for cohort studies. In case–control studies, only five showed a moderate NOS rating, while the remaining 21 were rated “high”. In prospective cohort studies, five studies had an NOS rating of “moderate”, and 22 had a high NOS rating. During the quality assessment, all the included studies that met the eligibility criteria were of moderate or high quality. Thus, no low-quality study was excluded from this study.
Sensitive analyses
Sensitivity analysis of included studies was performed by omitting one study each time. Our results were robust as sensitivity analysis indicated that a single study did not affect the overall impact size estimate (OR or RR).
Meta-analysis of BMI and BC
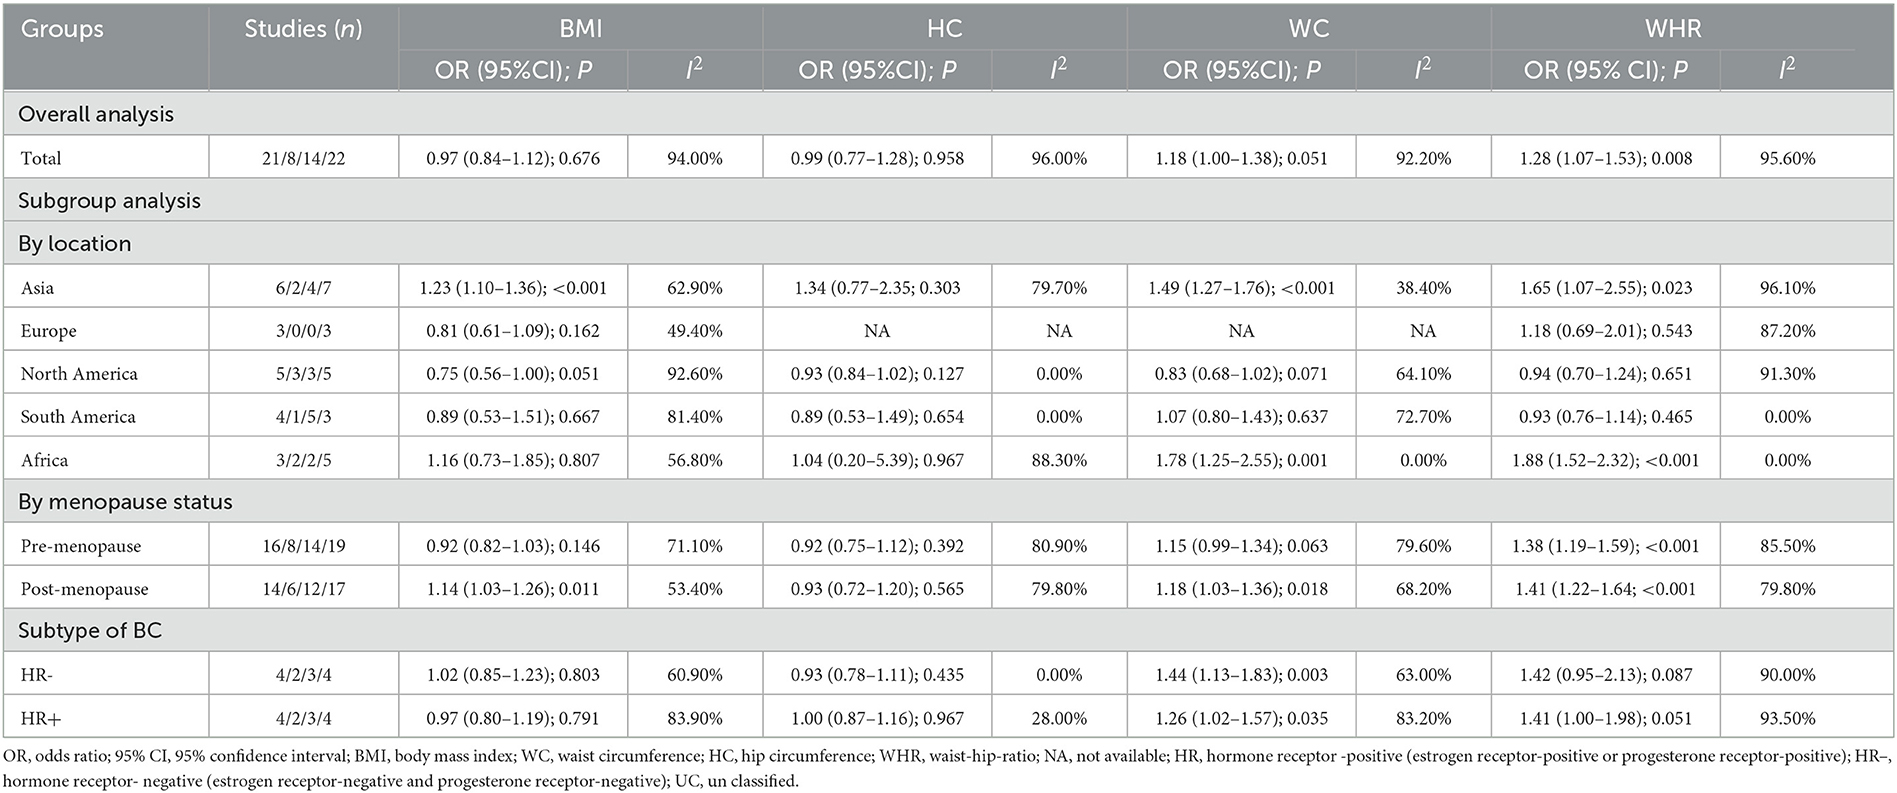
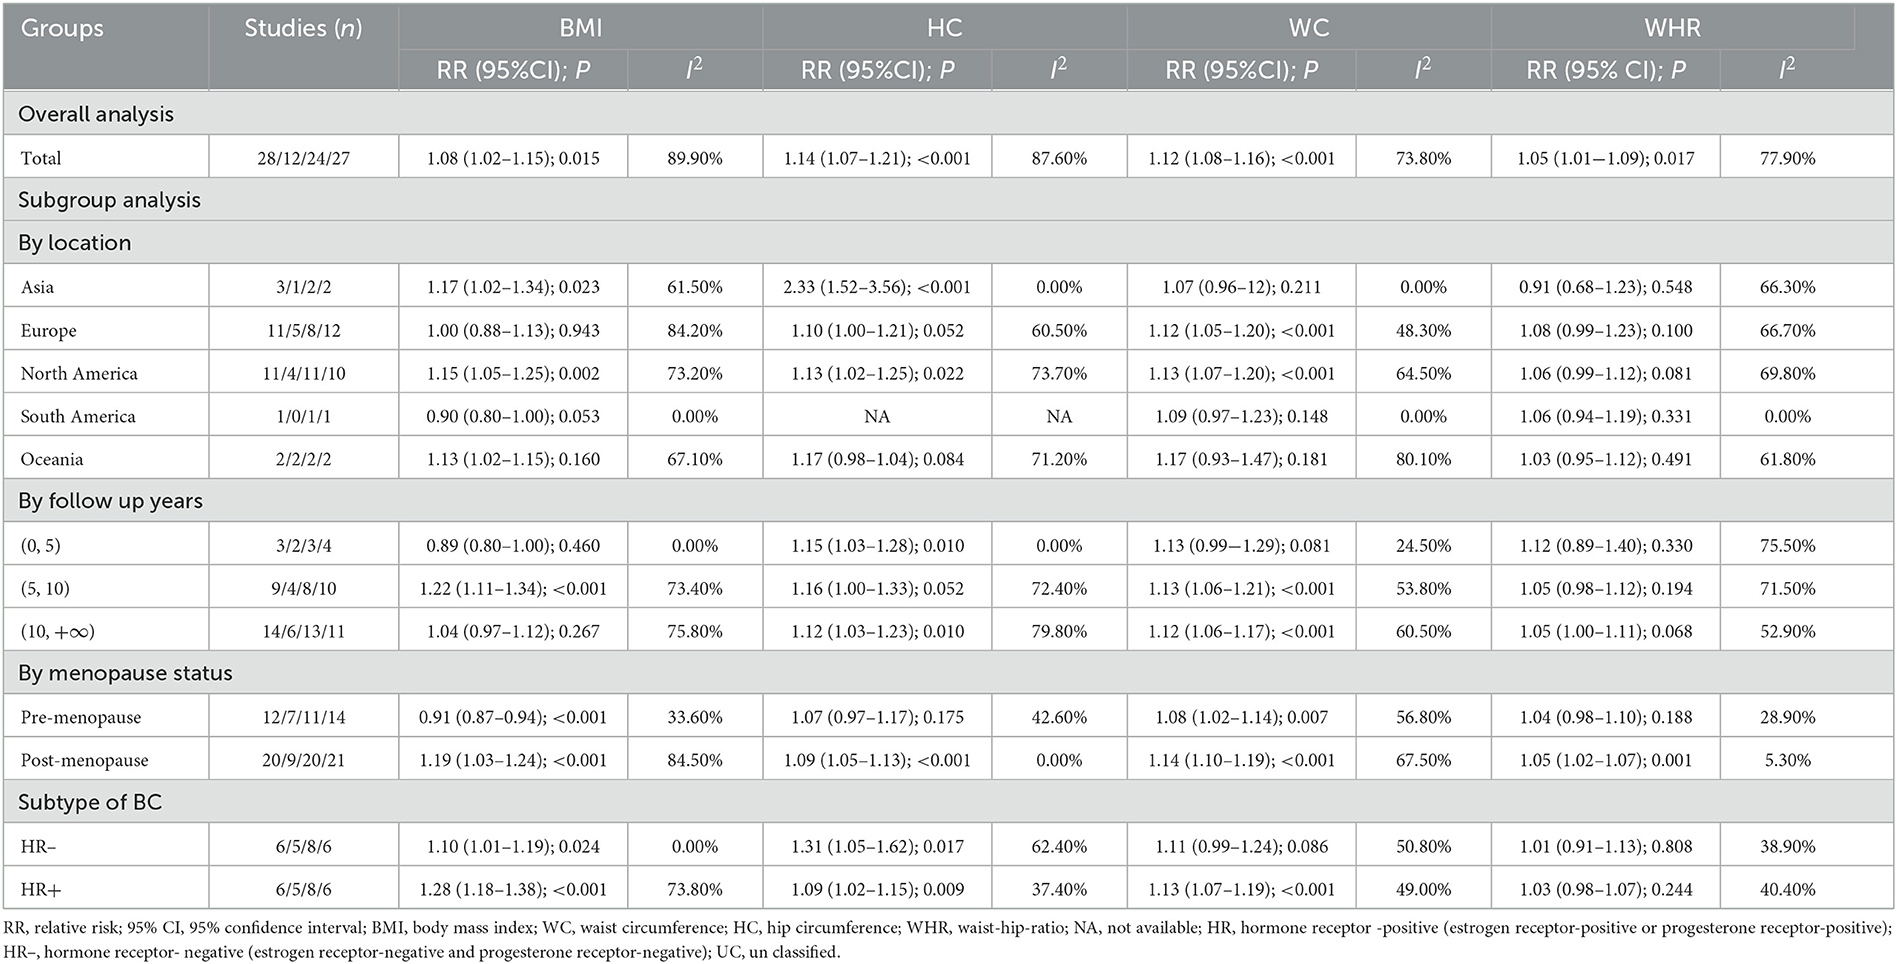
Tables 1, 2 show the multifactor-adjusted risk estimates generated from the case–control and prospective cohort studies. OR showed no statistically significant BMI associations (adjusted OR = 0.98; 0.88–1.11; P = 0.792) (Figure 2A). According to RR, BC was related to significant BMI changes (adjusted RR = 1.08; 1.01–1.16; P = 0.035) (Figure 3A).
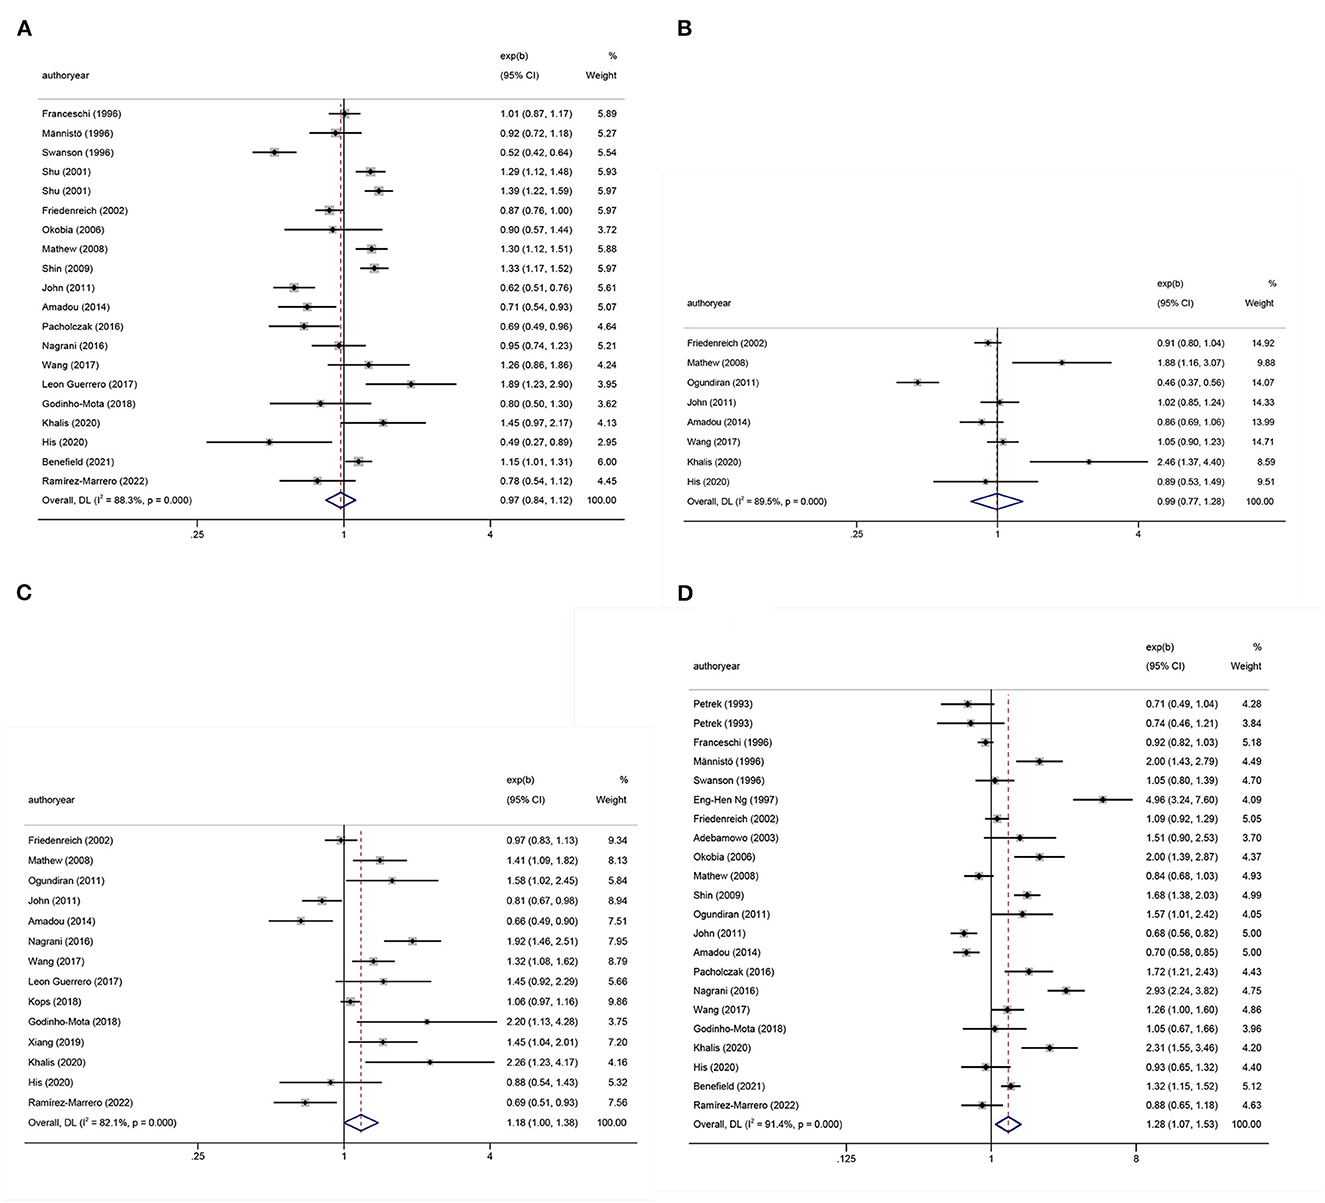
Figure 2. Forest plots of odds ratios (ORs) with corresponding 95% confidence intervals (CIs) of breast cancer risk for (A) body mass index (BMI), (B) hip circumference (HC), (C) waist circumference (WC), and (D) waist–hip ratio (WHR).
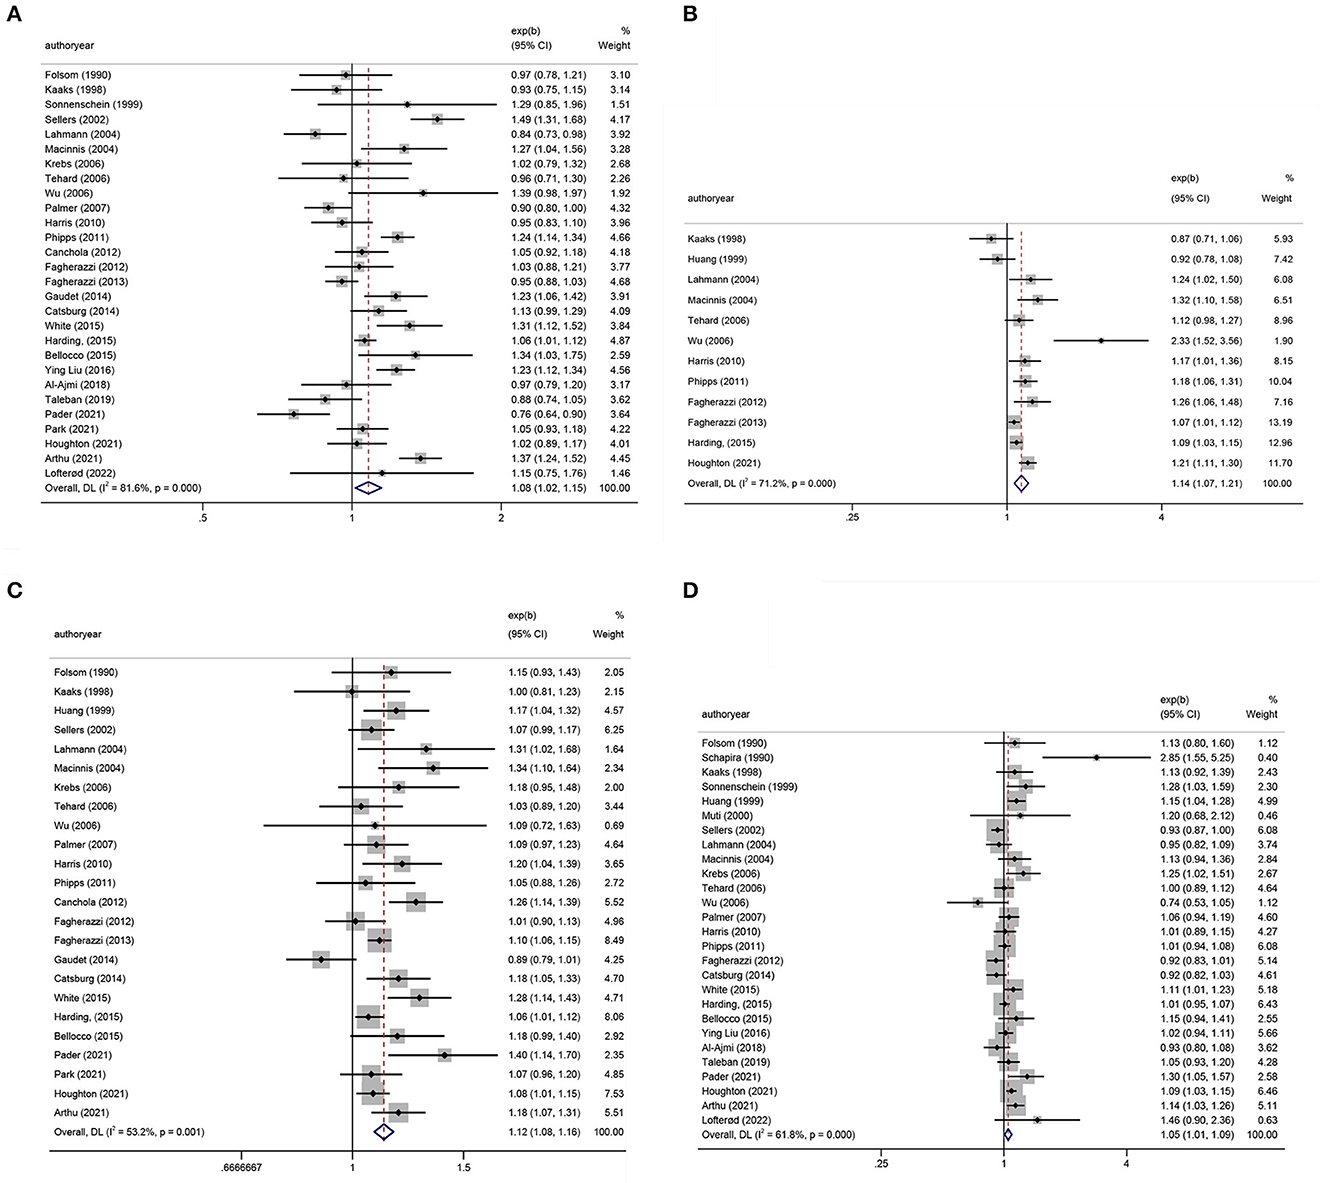
Figure 3. Forest plots of relative risks (RRs) with corresponding 95% confidence intervals (CIs) of breast cancer risk for (A) body mass index (BMI), (B) hip circumference (HC), (C) waist circumference (WC), and (D) waist–hip ratio (WHR).
Publication bias
To assess publication bias, Figures 4A–D presents Begg's filled funnel plots for the association with BMI in BC of OR (Figures 4A, B) and RR (Figures 4C, D). Begg's funnel plots seemed not perfectly symmetrical in RR but symmetrical in OR. Egger's test demonstrated some potential publication bias by OR (POR = 0.047, PRR = 0.138), but no substantial changes in the data after trim-and-fill analysis. Moreover, the filled funnel plots revealed no missing studies in theory. The subjective nature of Begg's funnel plots suggests that publication bias did not affect the robustness of the results.
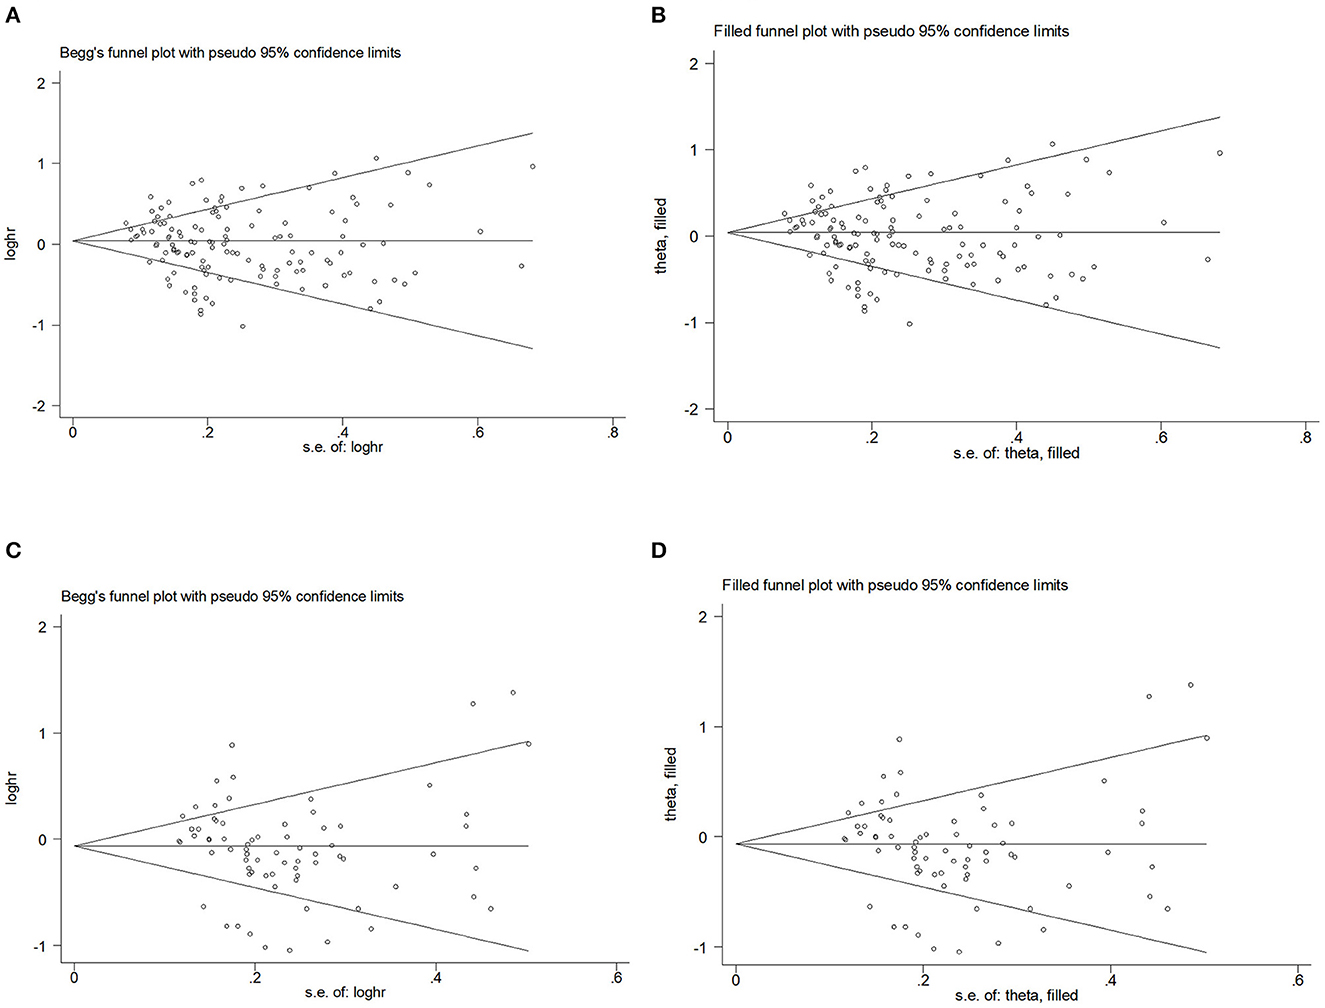
Figure 4. Begg's funnel plot and filled funnel plots of included studies showing odds ratios (ORs) and relative risks (RRs) for body mass index (BMI). (A) Begg's funnel plot, (B) filled funnel plot of OR, (C) Begg's funnel plot, and (D) filled funnel plot of RR.
Subgroup analysis
We performed subgroup analyses to evaluate the cause of between-study heterogeneity (Tables 1, 2). Significant heterogeneities were found in the study location, follow-up years, menopause status, and BC subtype.
The subgroup analysis of location OR showed a positive relationship between BMI and BC risk in Asia (adjusted OR = 1.23; 95% CI: 1.10–1.36; P < 0.001). In the subgroup analysis of RR, in both Asia (adjusted RR = 1.17; 95% CI: 1.02–1.34; P = 0.023) and North America (adjusted RR = 1.15; 95% CI: 1.05–1.25; P = 0.002), BMI was associated with a facilitative effect on BC.
In the subgroup analysis of follow-up time, regarding RR, the results became statistically significant when the follow-up was 5–10 years (adjusted RR = 1.22; 95% CI: 1.11–1.34; P < 0.001).
In the subgroup analysis of menstrual status, premenopausal obesity (adjusted OR = 0.92; 95% CI: 0.82–1.03; P = 0.146) inhibited the BC development, while postmenopausal (adjusted OR = 1.14; 95% CI: 1.03–1.26; P = 0.011) obesity promoted it. When the effect quantity for RR, premenopausal (adjusted RR = 0.91; 95% CI: 0.87–0.94; P < 0.001) and postmenopausal (adjusted RR = 1.19; 95% CI: 1.03–1.24; P < 0.001) obesity had consistent results as OR.
No BC subtype showed statistical significance by OR in subgroup analysis. Regarding RR, BMI was related to BC development in a promotive role, regardless of HR– BC (adjusted RR = 1.10; 95% CI: 1.01–1.19; P = 0.024) or HR+ BC (adjusted RR = 1.28; 95% CI: 1.18–1.38; P < 0.001).
Meta-analysis of HC and BC
According to OR, there were no statistically significant associations of HC (adjusted OR = 0.99; 0.77–1.28; P = 0.958) (Figure 2B). Regarding RR, BC was associated with significant changes in HC (adjusted RR = 1.14; 1.07–1.21; P < 0.001) (Figure 3B).
Publication bias
Begg's funnel plot and Egger's test were used to assess publication bias. The results showed that Begg's funnel plots were symmetrical in OR (Figures 5A, B) and RR (Figures 5C, D), Egger's test of OR and RR (POR = 0.195, PRR = 0.198) showed that there was no evidence of publication bias. The trim-and-fill analysis showed no substantial changes in OR and RR.
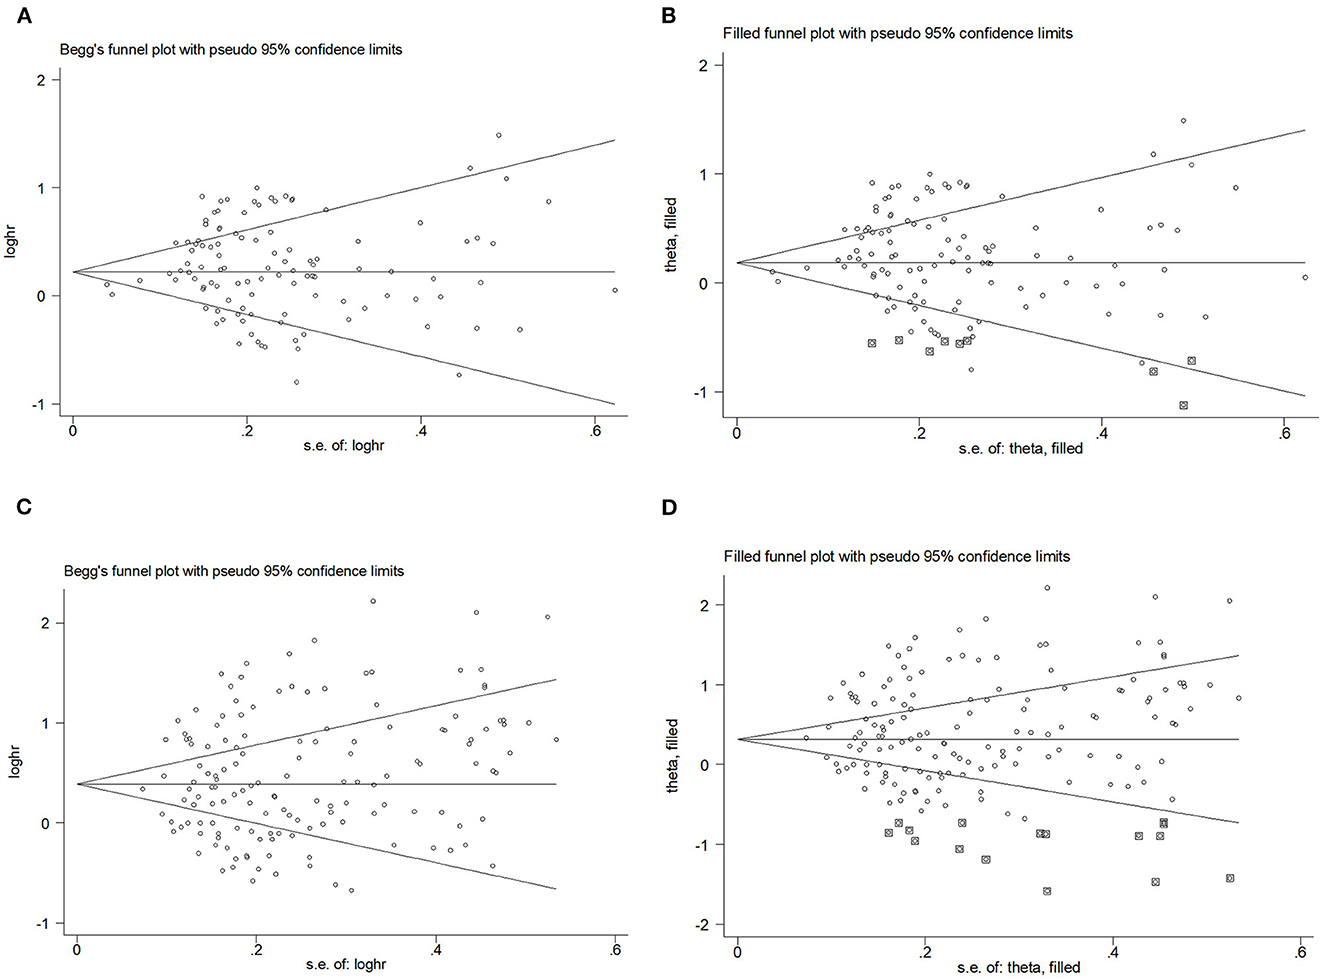
Figure 5. Begg's funnel plot and filled funnel plots of included studies showing odds ratios (ORs) and relative risks (RRs) for hip circumference (HC). (A) Begg's funnel plot, (B) filled funnel plot of OR, (C) Begg's funnel plot, and (D) filled funnel plot of RR.
Subgroup analysis
The subgroup analysis of location OR showed that HC showed no statistical significance in any location. Geographically, HC had a more significant promoting effect on BC development in Asia (adjusted RR = 2.33; 95% CI: 1.52–3.56; P < 0.001) and a weaker effect in North America (adjusted RR = 1.13; 95% CI: 1.02–1.25; P = 0.022).
In the subgroup analysis of follow-up time, studies showed that for RR, the promotion effect of WHR on BC was statistically significant when the follow-up time was <5 years (adjusted RR = 1.15; 95% CI: 1.03–1.28; P = 0.010) and >10 years (adjusted RR = 1.12; 95% CI: 1.03–1.23; P = 0.010).
In the subgroup analysis of menstrual status, no statistical significance appeared in OR. Regarding RR, we observed only postmenopausal obesity was associated with BC (adjusted RR = 1.09; 95% CI: 1.05–1.13; P < 0.001).
In the subgroup analysis of the BC subtype, regardless of molecular typing, the BC is independent of HC by OR. Regarding RR, HR+ BC (adjusted RR = 1.09; 95% CI: 1.02–1.15; P = 0.009) and HR- BC (adjusted RR = 1.31; 95% CI: 1.05–1.62; P = 0.017) are associated with HC.
Meta-analysis of WC and BC
The summary OR of BC was 1.18 (95% CI: 1.00–1.38; P = 0.051) (Figure 2C). According to RR, BC was similarly related to significant changes in WC (adjusted RR = 1.12; 1.08–1.16; P < 0.001) (Figure 3C).
Publication bias
Begg's funnel plot and Egger's test. Figures 6A–D presents Begg's filled funnel plots for the association with WC in BC. The symmetry of Begg's funnel plots by OR (Figures 6A, B) and RR (Figures 6C, D) is perfect. Egger's funnel plot showed that the study had some missing data in both OR and RR. Only Egger's test of OR indicates potential publication bias (POR = 0.038, PRR = 0.832) but no substantial change in the data after trim-and-fill analysis, so potential publication bias did not affect the robustness of the results.
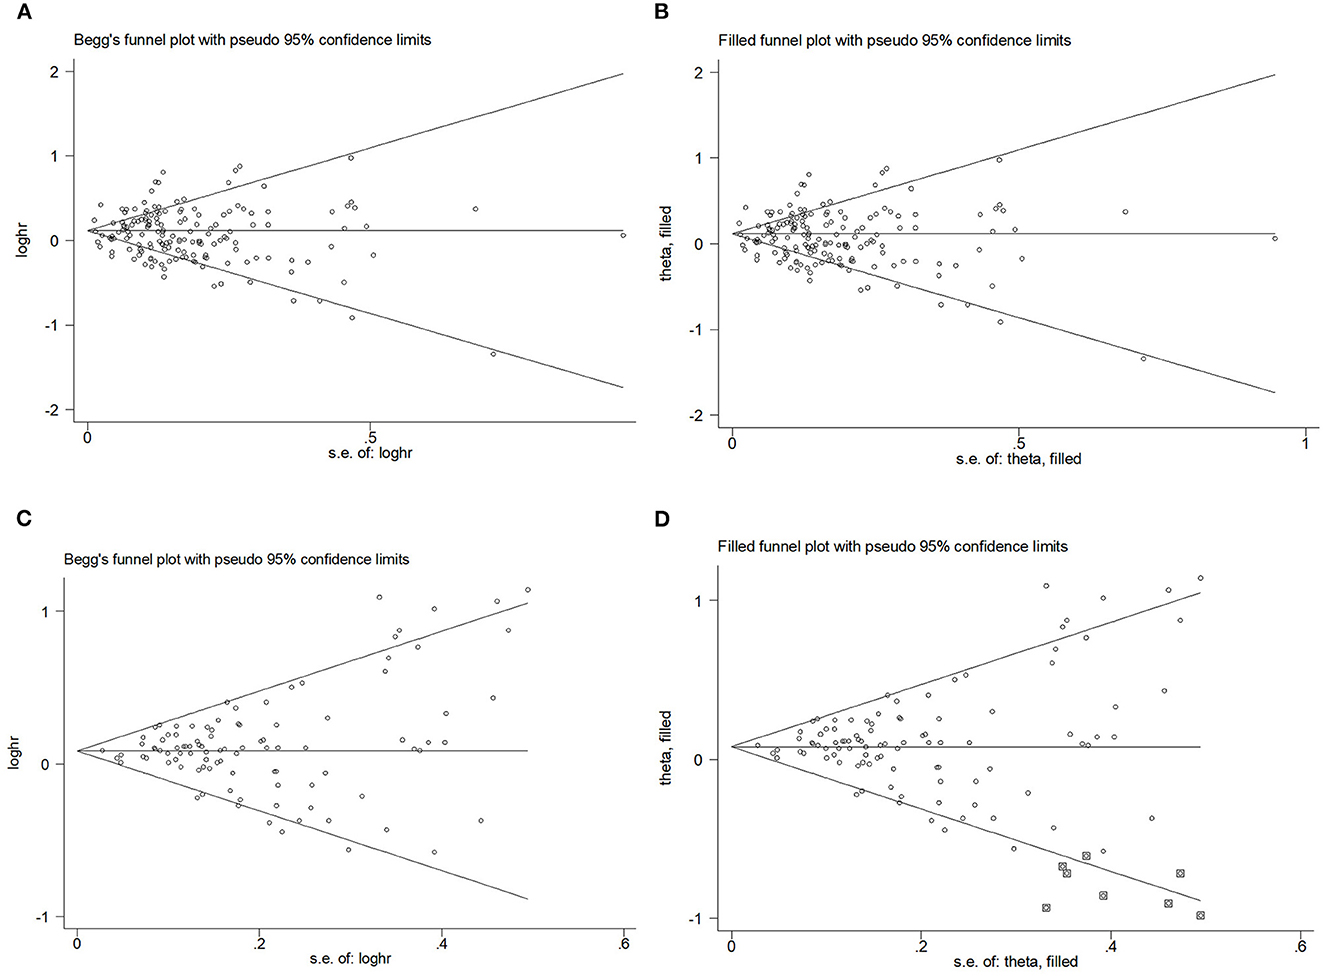
Figure 6. Begg's funnel plot and filled funnel plots of included studies showing odds ratios (ORs) and relative risks (RRs) for waist circumference (WC). (A) Begg's funnel plot, (B) filled funnel plot of OR, (C) Begg's funnel plot, and (D) filled funnel plot of RR.
Subgroup analysis
The subgroup analysis of location revealed that WC promoted BC by OR in Asia (adjusted OR = 1.49; 95% CI: 1.27–1.76; P < 0.001). In the summary of RR, in Europe (adjusted RR = 1.12; 95% CI: 1.05–1.20; P < 0.001), North America (adjusted RR = 1.15; 95% CI: 1.11–1.20; P < 0.001), and Oceania (adjusted RR= 1.13; 95% CI: 1.07–1.20; P < 0.001), WC had a facilitative effect on BC.
The subgroup analysis of follow-up time by RR revealed a statistically significant association with BC after more than 5-year follow-up time (adjusted RR = 1.13; 95% CI: 1.06–1.21; P < 0.001; adjusted RR = 1.12; 95% CI: 1.06–1.17; P < 0.001).
The subgroup analysis of menstrual status OR showed that a statistically significant difference in promoting BC with WC was equally indicated in premenopausal (adjusted OR = 1.15; 95% CI: 0.99–1.34; P = 0.063) and postmenopausal (adjusted OR = 1.18; 95% CI: 1.06–1.37; P = 0.004) status. Regarding RR, premenopausal (adjusted RR = 1.08; 95% CI: 1.02–1.14; P = 0.007) and postmenopausal (adjusted RR = 1.14; 95% CI: 1.10–1.19; P < 0.001) had similar results.
The subgroup analysis of BC subtype OR showed that stratification of estrogen-progestin receptor status did not alter the contribution of WC to BC (adjusted ORHR− = 1.44; 95% CI: 1.13–1.83; P = 0.003; adjusted ORHR+ = 1.26; 95% CI: 1.02–1.60; P = 0.035). Regarding RR, WC was associated with the BC development in a promotive role regardless of HR– BC (adjusted RR = 1.11; 95% CI: 0.99–1.24; P = 0.086) and HR+ BC (adjusted RR = 1.13; 95% CI: 1.07–1.19; P < 0.001).
Meta-analysis of WHR and BC
After pooling the results of all qualified articles, there were statistically significant associations of WHR (adjusted OR = 1.28; 1.07–1.53; P = 0.008) (Figure 2D) with BC. With effect values of RR, the relationship became weaker (RR = 1.05; 95% CI: 1.01–1.09; P = 0.017) (Figure 3D).
Publication bias
Begg's funnel plot and Egger's test were used to assess publication bias. The results showed that Begg's funnel plots were not symmetrical in OR (Figures 7A, B) and RR (Figures 7C, D), Egger's test (POR = 0.156, PRR = 0.394) showed that there was no evidence of publication bias. Egger's funnel plot showed that the study has some missing OR and RR data but no substantial change after trim-and-fill analysis.
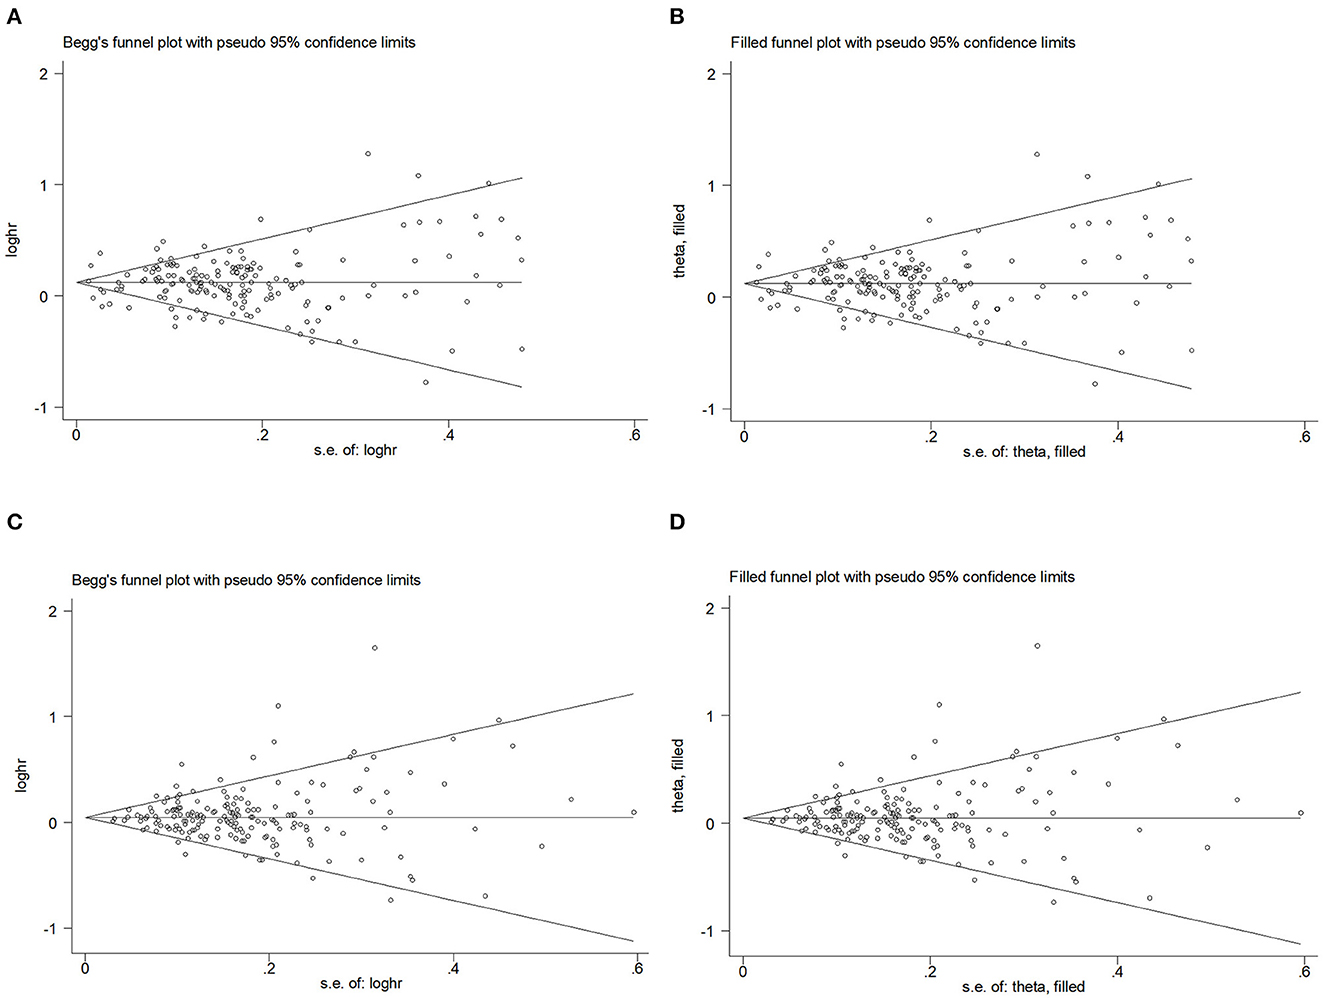
Figure 7. Begg's funnel plot and filled funnel plots of included studies showing odds ratios (ORs) and relative risks (RRs) for waist–hip ratio (WHR). (A) Begg's funnel plot, (B) filled funnel plot of OR, (C) Begg's funnel plot, and (D) filled funnel plot of RR.
Subgroup analysis
The subgroup analysis of location OR showed that there was a growing relationship between BC incidence and WHR when the regions were Asia (adjusted OR = 1.65; 95% CI: 1.07–2.55; P = 0.023) and Africa (adjusted OR = 1.88; 95% CI: 1.52–2.32; P < 0.001). No statistically significant differences were identified by RR location in any of the areas.
In the subgroup analysis of follow-up time by RR, the contribution of WHR to the BC response disappeared.
The subgroup analysis of menstrual status OR showed that WHR increased the risk of BC in premenopausal (adjusted OR = 1.38; 95% CI: 1.19–1.59; P < 0.001) and postmenopausal (adjusted OR = 1.41; 95% CI: 1.22–2.32; P < 0.001) periods. Regarding RR, the promotive effect of WHR on BC occurs in premenopausal status (adjusted RR = 1.04; 95% CI: 0.98–1.10; P = 0.188) and postmenopausal status (adjusted RR = 1.05; 95% CI: 1.02–1.07; P = 0.001).
The subgroup analysis of BC subtype OR showed that HR+ BC (adjusted OR = 1.41; 95% CI: 1.00–1.98; P = 0.051) and HR– BC (adjusted OR = 1.42; 95% CI: 0.95–2.13; P = 0.087) was associated with WHR. Both HR+ BC (adjusted RR = 1.01; 95% CI: 0.91–1.13; P = 0.808) and HR– BC (adjusted RR = 1.03; 95% CI: 0.98–1.07; P = 0.244) showed a weak relationship with WHR on BC.
Dose–response analysis
We performed a dose–response analysis of the BMI, WC, HC, and WHR. Regarding OR, we only obtained J-shaped curves (Figures 8A, B) for WC and WHR. The results reflected that BC risk began to rise when WC exceeded 83.80 cm (adjusted OR = 1.03; 95% CI: 1.01–1.06) or WHR exceeded 0.80 (adjusted OR = 1.02; 95% CI: 1.01–1.03). According to RR, we obtained an inverted J-shaped curve (Figure 8C) of premenopausal BMI studies, while in WHR, we obtained a J-shaped curve (Figure 8D). The study showed that when premenopausal BMI exceeded 23.40 kg/m2 (adjusted RR = 0.99; 95% CI: 0.98–0.99), BC risk decreased, while WHR above 0.78 (adjusted RR = 1.02; 95% CI: 1.01–1.03) increased BC risk.
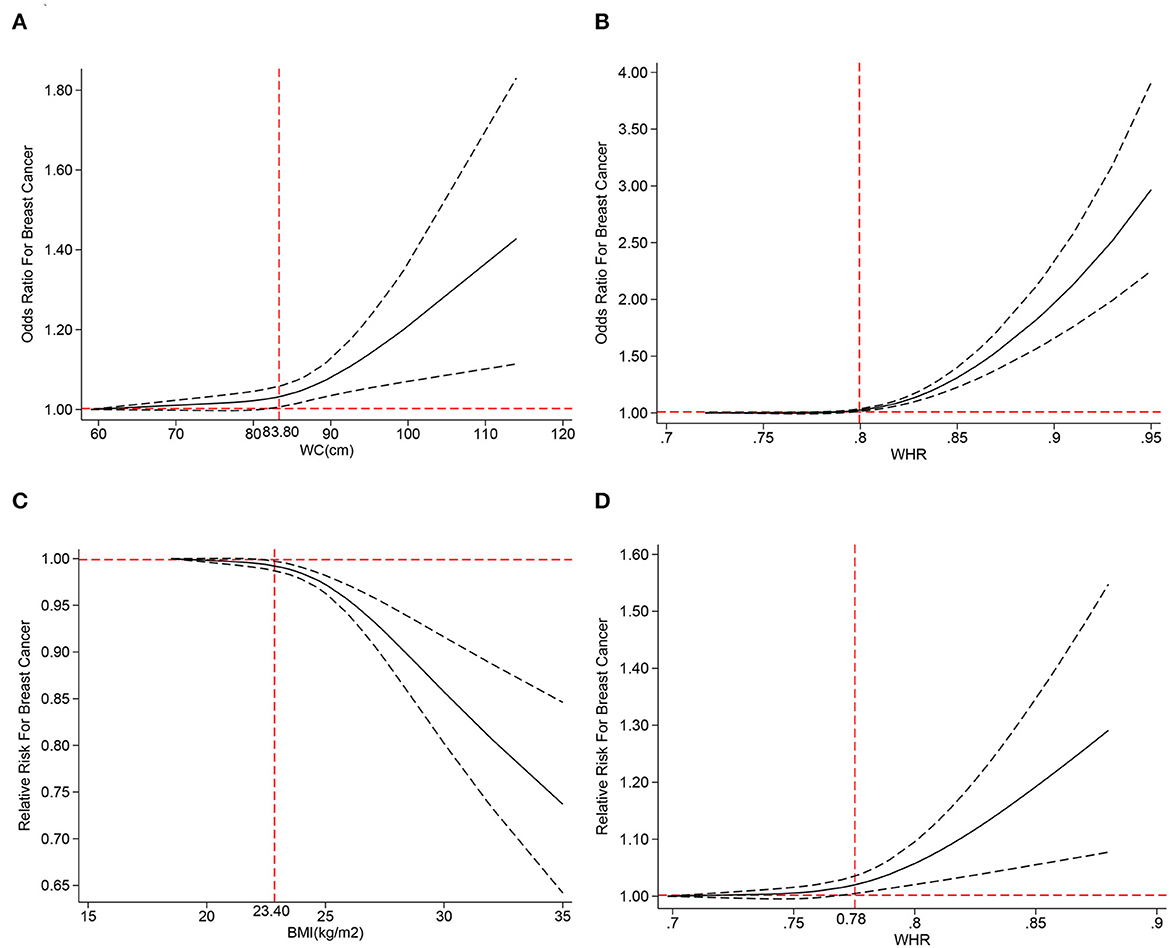
Figure 8. The dose–response analysis of central obesity and the risk of breast cancer for (A) waist circumference (WC) of odds ratios (ORs), (B) waist–hip ratio (WHR) of OR, (C) body mass index (BMI) of RR, and (D) waist–hip ratio (WHR) of relative risks (RRs).
Discussion
Association between central obesity and BC
According to our knowledge, this is the most extensive meta-analysis exploring the dose–response relationship between central obesity and BC. We found a significant association between central obesity and BC as measured by WC and WHR in case–control and prospective cohort studies. Contrarily, HC, and BMI showed some positive relationships only in cohort studies. Moreover, sensitivity and subgroup analyses showed a weak relationship between central obesity and BC risk. The dose–response analysis showed an increased risk of BC with higher WC and WHR, while the risk decreased with higher BMI (during premenopausal).
The four measures, BMI, HC, WC, and WHR, do not have the same clinical significance. As a fat deposition marker, BMI is associated with general obesity (10). HC, measured by wrapping a tape measure around the widest area of the buttocks, represented the adipose tissue level in the buttocks (78). WC and WHR, characterized by the abdominal or visceral adipose tissue levels, are more related to the metabolic mechanism of obesity involved in BC and were used as indicators to measure central obesity (79). Our study found that BMI increases postmenopausal BC risk but decreases premenopausal risk as many studies have shown (22, 41, 47, 69); second, central obesity evaluated by WC and WHR, not HC, can predict BC. A 2015 Sister Study proved that WC and WHR are related to BC irrespective of menopausal status, validating the results of the current study. We found no evidence of a relationship between HC and BC in a combined NHS and NHSII study (58).
Reasons for replacing HC by WC
We could elucidate anatomically the reasons for using WC instead of HC to measure central obesity. Abdominal fat mainly comprises large fat cells, whereas femur obesity is caused by an increase in normal-sized fat cells. Increasing adipose cell size decreases the insulin effect on glucose oxidation, perhaps due to a decrease in insulin receptors (80). Different glucose and insulin responses to oral glucose loading have been shown earlier in abdominal and gluteal adipocytes. Abdominal fat affects the progressive loss of glucose tolerance in surrounding tissues, leading to hyperinsulinemia and insulin insensitivity, but normal buttocks fat cells do not create this risk. Basal lipolysis rates in abdominal fat cells are greater, which compromises glucose oxidation and increases BC risk (81). This may explain why WC and WHR measure central obesity instead of HC.
Biological plausibility
The relationship between central obesity and BC is biologically plausible. Studies have shown that excess visceral obesity tissue (VAT) has more M1 macrophages, which secrete and release pro-inflammatory cytokines and adipokines, causing insulin resistance and altered insulin initiation signaling pathways, contributing to BC (82). White adipose tissue (WAT), an adipose tissue subtype combined with central obesity, secretes many inflammatory cytokines, including TNF-α, IL-6, and IL-1β, exhibiting steroid hormone and adipokine production and chronic subclinical inflammatory changes that increase the cancer risk (83). Obese people have many senescent cells (senescent cells accumulate primarily in the viscera during obesity, creating fat deposits). Senescent cells generate a vast secretome of inflammatory chemicals, which, if persistent, can aggravate tissue damage and promote tumor growth. Therefore, obesity may promote tumor growth by inducing cellular senescence (84).
Difference in menstrual status
According to menopausal status, our findings indicate that high WC and WHR promote BC in young women, both premenopausal and postmenopausal. Regarding premenopausal status, the finding is consistent with other prospective studies that have adjusted for BMI in premenopausal women (52, 57, 59, 62, 67, 76). The mechanisms underlying the increased central obesity and BC risk differ between premenopausal and postmenopausal. The obese and overweight groups had considerably lower estradiol levels than the normal BMI group during premenopause (85). The relationship was reversed after menopause, with the normal-weight group having the lowest estradiol levels. Studies on the effect of endogenous estrogen on BC risk in premenopausal women are rarer than in postmenopausal women and do not demonstrate a cause of premenopausal estrogen and BC risk (86, 87). We suspect that premenopausal women may be at risk due to the inflammatory reaction outlined above, not estrogen. After menopause, total estrogen decreases markedly, and most estrogen is derived from the aromatase conversion of plasma androstenedione to estrone in adipose tissue. This aromatase activity increases with body weight, raising postmenopausal plasma estrogen levels (88). In other studies, estradiol levels were consistently associated with central obesity, showing positive correlations with the WHR ratio and computed tomography-measured visceral fat area (89). Endogenously produced estrogens cause BC, and high plasma estrogen concentrations and bioavailability enhance postmenopausal BC risk (90). Thus, central adiposity may cause postmenopausal BC by increasing estrogen release. A prospective study shows that WC and WHR were more strongly associated with estrogen receptor (ER) and luminal BC in people who never took serotonin also suggests that central obesity may increase postmenopausal BC in part through estrogen levels (58).
In conclusion, central obesity promotes pre- and postmenopausal BC. A prospective investigation of central adiposity and BC risk by menopause state showed our findings (58). However, a meta-analysis by Chen et al. found that central obesity measured by WC, but not by WHR, was related to modestly increased risks of premenopausal (RR = 1.05, 95% CI: 0.99–1.10) and postmenopausal (RR = 1.06, 95% CI: 1.04–1.09) BC (91).
Subtypes of BC
Central obesity and molecular subtypes of BC are understudied, possibly due to sample size. The sister study found no association of WC or WHR with premenopausal estrogen receptor-positive/progesterone receptor-positive (ER+/PR+) cancer and had insufficient numbers to examine estrogen receptor-negative and progesterone receptor-negative (ER–PR–) tumors (76). After BMI adjustment, HC was positively associated with premenopausal ER+/PR+ and ER–/PR– cancers in the E3N cohort. However, independent of BC molecular typing, WC and WHR did not increase BC risk (52). We pooled enough cases to find statistically significant heterogeneity in the ER/PR status of WC and WHR; with different BC molecular subtypes, central obesity can produce a consistent promoting relationship and stronger correlation in the case–control study. Central obesity is associated with elevated insulin levels, insulin-like growth factors, and reduced sex hormone-binding globulin, which may be independent of ER/PR-mediated stimulation of tumor growth. Chronic inflammation and abnormalities in visceral fat-related metabolism, such as elevated insulin-like growth factor-1 levels and hyperinsulinemia, may also contribute to this association (45).
Sources of heterogeneity
This meta-analysis found a lot of variation across the case–control and prospective cohort studies, possibly due to methodology inconsistencies and recall and selection biases present in case–control studies. We also observed significant heterogeneity in the subgroup analyses. Two factors can cause subgroup analysis heterogeneity, first, with regional differences. Different regions have different levels of economic development, and higher prevalence rates are often found in the populations of countries with higher income levels (92) and second, exposure assessment differences. Some heterogeneity may also exist regarding different measurement methods, as in one part of the study, patients used self-reported, and the other part used instrumental measurements in hospitals.
Comparison with previous studies
Several systematic reviews and meta-analyses have examined central obesity and breast cancer risk. A 2002 meta-analysis found that BC risk increased with waist-to-hip ratio. However, the study was limited to the relationship between WHR and BC risk and lacked other measures. Moreover, the relationship between BC molecular subtypes and central obesity has not been examined (8). Harvie showed that adjusting BMI for central obesity eliminated the link between WC or WHR and postmenopausal BC risk. However, BMI correction for central obesity was not used in subsequent meta-analyses (9). Pooling 18 prospective cohort studies by Chen showed that central obesity, as measured by WC rather than WHR, was related to a modest increase in premenopausal and postmenopausal obesity risk (10). Although the evidence is substantial, there are insufficient case–control studies to examine it. To delve deeper into the relationship, we conducted a comprehensive study with a sufficiently large sample size to assess central obesity and BC risk regarding menopausal status, tumor subtypes, and various metrics such as BMI, WC, HC, and WHR. We also observed that central obesity was associated with an increased BC risk during premenopausal and postmenopausal and verified the opposite relationship between BMI and BC risk during premenopausal and postmenopausal. However, studies involving central obesity and different BC molecular typing are lacking, and more longitudinal and well-designed studies are needed to confirm or refute our findings.
Limitations
However, there are some limitations to our study. First, despite combining adjusted effect size estimates in the current meta-analysis, several important confounders, such as age, socioeconomic status, estrogen use, and other lifestyle factors, remained unaccounted for in all the studies. Second, participants may have undergone a pre- to postmenopausal transition during follow-up. In this study, the transition was not stratified, and menstrual status at the time of diagnosis was used as the criterion, which may have ignored the impact of premenopausal hormone levels on body shape. Third, our data suggested that central obesity may raise the risk of different molecular subtypes of BC, although further longitudinal studies are needed to validate this. Finally, as with all meta-analyses, this study was limited by the quality of the included studies. Observational studies are prone to selection bias, recall bias, and exaggerated associations. Interpreting observational studies is difficult, specifically since the studies included in our meta-analysis were rated at moderate risk of bias, mainly because of severe bias due to confounding confounders. Confounding bias may affect the validity of the associations we observed. We hope that the quality of the evidence will improve with future updates and more high-quality research.
Conclusion
This dose analysis showed that central obesity, as WC and WHR measured, was associated with premenopausal and postmenopausal BC risk and ER+/ER– BC risk. Our study suggests that women should prioritize body type management to prevent BC.
Data availability statement
The original contributions presented in the study are included in the article/Supplementary material, further inquiries can be directed to the corresponding author.
Author contributions
DW, GY, and CA conceived and designed the experiments. MY, HC, and XQ performed the experiments. MY and HC analyzed the data. HC, XQ, DC, FL, JY, CZ, and YN contributed materials and analysis tools. HC, MY, and DW wrote and revised the article. All authors read and approved the final manuscript before submission.
Funding
This study was funded by the National High Level Hospital Clinical Research Funding (2022-NHLHCRF-LX-02-01).
Acknowledgments
The authors thank Xiangling Deng and her nhanesR package.
Conflict of interest
The authors declare that the research was conducted in the absence of any commercial or financial relationships that could be construed as a potential conflict of interest.
Publisher's note
All claims expressed in this article are solely those of the authors and do not necessarily represent those of their affiliated organizations, or those of the publisher, the editors and the reviewers. Any product that may be evaluated in this article, or claim that may be made by its manufacturer, is not guaranteed or endorsed by the publisher.
Supplementary material
The Supplementary Material for this article can be found online at: https://www.frontiersin.org/articles/10.3389/fnut.2023.1236393/full#supplementary-material
References
1. Sung H, Ferlay J, Siegel RL, Laversanne M, Soerjomataram I, Jemal A, et al. Global cancer statistics 2020: GLOBOCAN estimates of incidence and mortality worldwide for 36 cancers in 185 countries. CA Cancer J Clin. (2021) 71:209–49. doi: 10.3322/caac.21660
2. Łyszczarz B, Nojszewska E. Productivity losses and public finance burden attributable to breast cancer in Poland, 2010-2014. BMC Cancer. (2017) 17:676. doi: 10.1186/s12885-017-3669-7
3. Britt KL, Cuzick J, Phillips K-A. Key steps for effective breast cancer prevention. Nat Rev Cancer. (2020) 20:417–36. doi: 10.1038/s41568-020-0266-x
4. Han H, Guo W, Shi W, Yu Y, Zhang Y, Ye X, et al. Hypertension and breast cancer risk: a systematic review and meta-analysis. Sci Rep. (2017) 7:44877. doi: 10.1038/srep44877
5. Sorimachi H, Omote K, Omar M, Popovic D, Verbrugge FH, Reddy YNV, et al. Sex and central obesity in heart failure with preserved ejection fraction. Eur J Heart Fail. (2022) 24:1359–70. doi: 10.1002/ejhf.2563
6. Oyerinde AS, Selvaraju V, Babu JR, Geetha T. Potential role of oxidative stress in the production of volatile organic compounds in obesity. Antioxidants. (2023) 12:129. doi: 10.3390/antiox12010129
7. World Cancer Research Fund/American Institute for Cancer Research. Continuous Update Project Expert Report 2018. Diet, Nutrition, Physical Activity and Cancer: A Global Perspective. About the Third Expert Report (2021). Available online at: http://www.dietandcancerreport.org (accessed September 20, 2020).
8. Connolly BS, Barnett C, Vogt KN Li T, Stone J, Boyd NF. A meta-analysis of published literature on waist-to-hip ratio and risk of breast cancer. Nutr Cancer. (2002) 44:127–38. doi: 10.1207/S15327914NC4402_02
9. Harvie M, Hooper L, Howell AH. Central obesity and breast cancer risk: a systematic review. Obes Rev. (2003) 4:157–73. doi: 10.1046/j.1467-789X.2003.00108.x
10. Chen GC, Chen SJ, Zhang R, Hidayat K, Qin JB, Zhang YS, et al. Central obesity and risks of pre- and postmenopausal breast cancer: a dose-response meta-analysis of prospective studies. Obes Rev. (2016) 17:1167–77. doi: 10.1111/obr.12443
11. Chan DSM, Abar L, Cariolou M, Nanu N, Greenwood DC, Bandera EV, et al. World Cancer Research Fund International: Continuous Update Project-systematic literature review and meta-analysis of observational cohort studies on physical activity, sedentary behavior, adiposity, and weight change and breast cancer risk. Cancer Causes Control. (2019) 30:1183–200. doi: 10.1007/s10552-019-01223-w
12. Wells GA, Shea B, O'Connell D, Peterson J, Welch V, Losos M, et al. The Newcastle-Ottawa Scale (NOS) for Assessing the Quality of Nonrandomised Studies in Meta-Analyses (2013). Available online at: https://www.ohri.ca/programs/clinical_epidemiology/oxford.asp
13. Huang Y, Cai X, Mai W, Li M, Hu Y. Association between prediabetes and risk of cardiovascular disease and all cause mortality: systematic review and meta-analysis. BMJ. (2016) 355:i5953. doi: 10.1136/bmj.i5953
14. Zhang J, Yu KF. What's the relative risk? A method of correcting the odds ratio in cohort studies of common outcomes. JAMA. (1998) 280:1690–1. doi: 10.1001/jama.280.19.1690
15. Slawinska A, Siwek M. Meta - and combined - QTL analysis of different experiments on immune traits in chickens. J Appl Genet. (2013) 54:483–7. doi: 10.1007/s13353-013-0177-6
16. Higgins JPT, Thompson SG, Deeks JJ, Altman DG. Measuring inconsistency in meta-analyses. BMJ. (2003) 327:557–60. doi: 10.1136/bmj.327.7414.557
17. Yuan M, Chen H, Chen D, Wan D, Luo F, Zhang C, et al. Effect of physical activity on prevention of postpartum depression: a dose-response meta-analysis of 186,412 women. Front Psychiatry. (2022) 13:984677. doi: 10.3389/fpsyt.2022.984677
18. Begg CB, Mazumdar M. Operating characteristics of a rank correlation test for publication bias. Biometrics. (1994) 50:1088–101. doi: 10.2307/2533446
19. Egger M, Davey Smith G, Schneider M, Minder C. Bias in meta-analysis detected by a simple, graphical test. BMJ. (1997) 315:629–34. doi: 10.1136/bmj.315.7109.629
20. Duval S, Tweedie R. Trim and fill: a simple funnel-plot-based method of testing and adjusting for publication bias in meta-analysis. Biometrics. (2000) 56:455–63. doi: 10.1111/j.0006-341X.2000.00455.x
21. Adebamowo CA, Ogundiran TO, Adenipekun AA, Oyesegun RA, Campbell OB, Akang EE, et al. Waist-hip ratio and breast cancer risk in urbanized Nigerian women. Breast Cancer Res. (2003) 5:R18–24. doi: 10.1186/bcr567
22. Amadou A, Torres Mejia G, Fagherazzi G, Ortega C, Angeles-Llerenas A, Chajes V, et al. Anthropometry, silhouette trajectory, and risk of breast cancer in Mexican women. Am J Prev Med. (2014) 46(3 Suppl. 1):S52–64. doi: 10.1016/j.amepre.2013.10.024
23. Benefield HC, Zirpoli GR, Allott EH, Shan Y, Hurson AN, Omilian AR, et al. Epidemiology of basal-like and luminal breast cancers among black women in the AMBER Consortium. Cancer Epidemiol Biomarkers Prev. (2021) 30:71–9. doi: 10.1158/1055-9965.EPI-20-0556
24. Franceschi S, Favero A, La Vecchia C, Barón AE, Negri E, Dal Maso L, et al. Body size indices and breast cancer risk before and after menopause. Int J Cancer. (1996) 67:181–6. doi: 10.1002/(SICI)1097-0215(19960717)67:2<181::AID-IJC5>3.0.CO;2-P
25. Friedenreich CM, Courneya KS, Bryant HE. Case-control study of anthropometric measures and breast cancer risk. Int J Cancer. (2002) 99:445–52. doi: 10.1002/ijc.10389
26. Godinho-Mota JCM, Gonçalves LV, Soares LR, Mota JF, Martins KA, Freitas-Junior I, et al. Abdominal adiposity and physical inactivity are positively associated with breast cancer: a case-control study. Biomed Res Int. (2018) 2018:4783710. doi: 10.1155/2018/4783710
27. His M, Biessy C, Torres-Mejía G, Ángeles-Llerenas A, Alvarado-Cabrero I, Sánchez GI, et al. Anthropometry, body shape in early-life and risk of premenopausal breast cancer among Latin American women: results from the PRECAMA study. Sci Rep. (2020) 10:2294. doi: 10.1038/s41598-020-59056-6
28. John EM, Sangaramoorthy M, Phipps AI, Koo J, Horn-Ross PL. Adult body size, hormone receptor status, and premenopausal breast cancer risk in a multiethnic population: the San Francisco Bay Area breast cancer study. Am J Epidemiol. (2011) 173:201–16. doi: 10.1093/aje/kwq345
29. Khalis M, Dossus L, Rinaldi S, Biessy C, Moskal A, Charaka H, et al. Body size, silhouette trajectory and the risk of breast cancer in a Moroccan case-control study. Breast Cancer. (2020) 27:748–58. doi: 10.1007/s12282-020-01072-5
30. Kops NL, Bessel M, Caleffi M, Ribeiro RA, Wendland EM. Body Weight and breast cancer: nested case-control study in Southern Brazil. Clin Breast Cancer. (2018) 18:e797–803. doi: 10.1016/j.clbc.2018.04.014
31. Leon Guerrero RT, Novotny R, Wilkens LR, Chong M, White KK, Shvetsov YB, et al. Risk factors for breast cancer in the breast cancer risk model study of Guam and Saipan. Cancer Epidemiol. (2017) 50(Pt B):221–33. doi: 10.1016/j.canep.2017.04.008
32. Männistö S, Pietinen P, Pyy M, Palmgren J, Eskelinen M, Uusitupa M. Body-size indicators and risk of breast cancer according to menopause and estrogen-receptor status. Int J Cancer. (1996) 68:8–13. doi: 10.1002/(SICI)1097-0215(19960927)68:1<8::AID-IJC2>3.0.CO;2-V
33. Mathew A, Gajalakshmi V, Rajan B, Kanimozhi V, Brennan P, Mathew BS, et al. Anthropometric factors and breast cancer risk among urban and rural women in South India: a multicentric case-control study. Br J Cancer. (2008) 99:207–13. doi: 10.1038/sj.bjc.6604423
34. Nagrani R, Mhatre S, Rajaraman P, Soerjomataram I, Boffetta P, Gupta S, et al. Central obesity increases risk of breast cancer irrespective of menopausal and hormonal receptor status in women of South Asian Ethnicity. Eur J Cancer. (2016) 66:153–61. doi: 10.1016/j.ejca.2016.07.022
35. Ng EH, Gao F, Ji CY, Ho GH, Soo KC. Risk factors for breast carcinoma in Singaporean Chinese women: the role of central obesity. Cancer. (1997) 80:725–31. doi: 10.1002/(SICI)1097-0142(19970815)80:4<725::AID-CNCR11>3.0.CO;2-V
36. Ogundiran TO, Huo D, Adenipekun A, Campbell O, Oyesegun R, Akang E, et al. Body fat distribution and breast cancer risk: findings from the Nigerian breast cancer study. Cancer Causes Control. (2012) 23:565–74. doi: 10.1007/s10552-012-9916-y
37. Okobia M, Bunker C, Zmuda J, Kammerer C, Vogel V, Uche E, et al. Case-control study of risk factors for breast cancer in Nigerian women. Int J Cancer. (2006) 119:2179–85. doi: 10.1002/ijc.22102
38. Okobia MN, Bunker CH, Zmuda JM, Osime U, Ezeome ER, Anyanwu SN, et al. Anthropometry and breast cancer risk in Nigerian women. Breast J. (2006) 12:462–6. doi: 10.1111/j.1075-122X.2006.00304.x
39. Pacholczak R, Klimek-Piotrowska W, Kuszmiersz P. Associations of anthropometric measures on breast cancer risk in pre- and postmenopausal women–a case-control study. J Physiol Anthropol. (2016) 35:7. doi: 10.1186/s40101-016-0090-x
40. Petrek JA, Peters M, Cirrincione C, Rhodes D, Bajorunas D. Is body fat topography a risk factor for breast cancer? Ann Intern Med. (1993) 118:356–62. doi: 10.7326/0003-4819-118-5-199303010-00006
41. Ramírez-Marrero FA, Nazario CM, Rosario-Rosado RV, Schelske-Santos M, Mansilla-Rivera I, Nie J, et al. Anthropometric measures and breast cancer risk among Hispanic women in Puerto Rico. Cancer Causes Control. (2022) 33:971–81. doi: 10.1007/s10552-022-01585-8
42. Shin A, Matthews CE, Shu XO, Gao YT, Lu W, Gu K, et al. Joint effects of body size, energy intake, and physical activity on breast cancer risk. Breast Cancer Res Treat. (2009) 113:153–61. doi: 10.1007/s10549-008-9903-x
43. Shu XO, Jin F, Dai Q, Shi JR, Potter JD, Brinton LA, et al. Association of body size and fat distribution with risk of breast cancer among Chinese women. Int J Cancer. (2001) 94:449–55. doi: 10.1002/ijc.1487
44. Swanson CA, Coates RJ, Schoenberg JB, Malone KE, Gammon MD, Stanford JL, et al. Body size and breast cancer risk among women under age 45 years. Am J Epidemiol. (1996) 143:698–706. doi: 10.1093/oxfordjournals.aje.a008803
45. Wang F, Liu L, Cui S, Tian F, Fan Z, Geng C, et al. Distinct effects of body mass index and waist/hip ratio on risk of breast cancer by joint estrogen and progestogen receptor status: results from a case-control study in Northern and Eastern China and implications for chemoprevention. Oncologist. (2017) 22:1431–43. doi: 10.1634/theoncologist.2017-0148
46. Xiang Y, Zhou W, Duan X, Fan Z, Wang S, Liu S, et al. Metabolic syndrome, and particularly the hypertriglyceridemic-waist phenotype, increases breast cancer risk, and adiponectin is a potential mechanism: a case-control study in Chinese women. Front Endocrinol. (2019) 10:905. doi: 10.3389/fendo.2019.00905
47. Al-Ajmi K, Lophatananon A, Ollier W, Muir KR. Risk of breast cancer in the UK biobank female cohort and its relationship to anthropometric and reproductive factors. PLoS ONE. (2018) 13:e0201097. doi: 10.1371/journal.pone.0201097
48. Arthur RS, Dannenberg AJ, Kim M, Rohan TE. The association of body fat composition with risk of breast, endometrial, ovarian and colorectal cancers among normal weight participants in the UK Biobank. Br J Cancer. (2021) 124:1592–605. doi: 10.1038/s41416-020-01210-y
49. Bellocco R, Marrone G, Ye W, Nyrén O, Adami HO, Mariosa D, et al. A prospective cohort study of the combined effects of physical activity and anthropometric measures on the risk of post-menopausal breast cancer. Eur J Epidemiol. (2016) 31:395–404. doi: 10.1007/s10654-015-0064-z
50. Canchola AJ, Anton-Culver H, Bernstein L, Clarke CA, Henderson K, Ma H, et al. Body size and the risk of postmenopausal breast cancer subtypes in the California Teachers Study cohort. Cancer Causes Control. (2012). doi: 10.1007/s10552-012-9897-x
51. Catsburg C, Kirsh VA, Soskolne CL, Kreiger N, Bruce E, Ho T, et al. Associations between anthropometric characteristics, physical activity, and breast cancer risk in a Canadian cohort. Breast Cancer Res Treat. (2014) 145:545–52. doi: 10.1007/s10549-014-2973-z
52. Fagherazzi G, Chabbert-Buffet N, Fabre A, Guillas G, Boutron-Ruault MC, Mesrine S, et al. Hip circumference is associated with the risk of premenopausal ER-/PR- breast cancer. Int J Obes. (2012) 36:431–9. doi: 10.1038/ijo.2011.66
53. Fagherazzi G, Vilier A, Balkau B, Clavel-Chapelon F, Magliano DJ. Anthropometrics, body shape over 12 years and risk of cancer events in pre- and post-menopausal women. Int J Cancer. (2013) 133:740–8. doi: 10.1002/ijc.28069
54. Folsom AR, Kaye SA, Prineas RJ, Potter JD, Gapstur SM, Wallace RB. Increased incidence of carcinoma of the breast associated with abdominal adiposity in postmenopausal women. Am J Epidemiol. (1990) 131:794–803. doi: 10.1093/oxfordjournals.aje.a115570
55. Gaudet MM, Carter BD, Patel AV, Teras LR, Jacobs EJ, Gapstur SM. Waist circumference, body mass index, and postmenopausal breast cancer incidence in the Cancer Prevention Study-II Nutrition Cohort. Cancer Causes Control. (2014) 25:737–45. doi: 10.1007/s10552-014-0376-4
56. Harding JL, Shaw JE, Anstey KJ, Adams R, Balkau B, Brennan-Olsen SL, et al. Comparison of anthropometric measures as predictors of cancer incidence: a pooled collaborative analysis of 11 Australian cohorts. Int J Cancer. (2015) 137:1699–708. doi: 10.1002/ijc.29529
57. Harris HR, Willett WC, Terry KL, Michels KB. Body fat distribution and risk of premenopausal breast cancer in the Nurses' Health Study II. J Natl Cancer Inst. (2011) 103:273–8. doi: 10.1093/jnci/djq500
58. Houghton SC, Eliassen H, Tamimi RM, Willett WC, Rosner BA, Hankinson SE. Central adiposity and subsequent risk of breast cancer by menopause status. J Natl Cancer Inst. (2021) 113:900–8. doi: 10.1093/jnci/djaa197
59. Huang Z, Willett WC, Colditz GA, Hunter DJ, Manson JE, Rosner B, et al. Waist circumference, waist:hip ratio, and risk of breast cancer in the Nurses' Health Study. Am J Epidemiol. (1999) 150:1316–24. doi: 10.1093/oxfordjournals.aje.a009963
60. Kaaks R, Van Noord PA, Den Tonkelaar I, Peeters PH, Riboli E, Grobbee DE. Breast-cancer incidence in relation to height, weight and body-fat distribution in the Dutch “DOM” cohort. Int J Cancer. (1998) 76:647–51. doi: 10.1002/(SICI)1097-0215(19980529)76:5<647::AID-IJC6>3.0.CO;2-Q
61. Krebs EE, Taylor BC, Cauley JA, Stone KL, Bowman PJ, Ensrud KE. Measures of adiposity and risk of breast cancer in older postmenopausal women. J Am Geriatr Soc. (2006) 54:63–9. doi: 10.1111/j.1532-5415.2005.00541.x
62. Lahmann PH, Hoffmann K, Allen N, van Gils CH, Khaw KT, Tehard B, et al. Body size and breast cancer risk: findings from the European Prospective Investigation into Cancer and Nutrition (EPIC). Int J Cancer. (2004) 111:762–71. doi: 10.1002/ijc.20315
63. Liu Y, Warren Andersen S, Wen W, Gao YT, Lan Q, Rothman N, et al. Prospective cohort study of general and central obesity, weight change trajectory and risk of major cancers among Chinese women. Int J Cancer. (2016) 139:1461–70. doi: 10.1002/ijc.30187
64. Lofterød T, Frydenberg H, Veierød MB, Jenum AK, Reitan JB, Wist EA, et al. The influence of metabolic factors and ethnicity on breast cancer risk, treatment and survival: The Oslo ethnic breast cancer study. Acta Oncol. (2022) 61:649–57. doi: 10.1080/0284186X.2022.2053573
65. Macinnis RJ, English DR, Gertig DM, Hopper JL, Giles GG. Body size and composition and risk of postmenopausal breast cancer. Cancer Epidemiol Biomarkers Prev. (2004) 13:2117–25. doi: 10.1158/1055-9965.2117.13.12
66. Muti P, Stanulla M, Micheli A, Krogh V, Freudenheim JL, Yang J, et al. Markers of insulin resistance and sex steroid hormone activity in relation to breast cancer risk: a prospective analysis of abdominal adiposity, sebum production, and hirsutism (Italy). Cancer Causes Control. (2000) 11:721–30. doi: 10.1023/A:1008966623901
67. Pader J, Basmadjian RB, O'Sullivan DE, Mealey NE, Ruan Y, Friedenreich C, et al. Examining the etiology of early-onset breast cancer in the Canadian Partnership for Tomorrow's Health (CanPath). Cancer Causes Control. (2021) 32:1117–28. doi: 10.1007/s10552-021-01460-y
68. Palmer JR, Adams-Campbell LL, Boggs DA, Wise LA, Rosenberg L. A prospective study of body size and breast cancer in black women. Cancer Epidemiol Biomarkers Prev. (2007) 16:1795–802. doi: 10.1158/1055-9965.EPI-07-0336
69. Park JW, Han K, Shin DW, Yeo Y, Chang JW, Yoo JE, et al. Obesity and breast cancer risk for pre- and postmenopausal women among over 6 million Korean women. Breast Cancer Res Treat. (2021) 185:495–506. doi: 10.1007/s10549-020-05952-4
70. Phipps AI, Chlebowski RT, Prentice R, McTiernan A, Stefanick ML, Wactawski-Wende J, et al. Body size, physical activity, and risk of triple-negative and estrogen receptor-positive breast cancer. Cancer Epidemiol Biomarkers Prev. (2011) 20:454–63. doi: 10.1158/1055-9965.EPI-10-0974
71. Schapira DV, Kumar NB, Lyman GH, Cox CE. Abdominal obesity and breast cancer risk. Ann Intern Med. (1990) 112:182–6. doi: 10.7326/0003-4819-112-3-182
72. Sellers TA, Davis J, Cerhan JR, Vierkant RA, Olson JE, Pankratz VS, et al. Interaction of waist/hip ratio and family history on the risk of hormone receptor-defined breast cancer in a prospective study of postmenopausal women. Am J Epidemiol. (2002) 155:225–33. doi: 10.1093/aje/155.3.225
73. Sonnenschein E, Toniolo P, Terry MB, Bruning PF, Kato I, Koenig KL, et al. Body fat distribution and obesity in pre- and postmenopausal breast cancer. Int J Epidemiol. (1999) 28:1026–31. doi: 10.1093/ije/28.6.1026
74. Taleban R, Sirous R, Sirous M, Razavi S, Taghvaei R, Sirous S, et al. The Relationship between anthropometric indices and breast cancer in central Iran. Nutr Cancer. (2019) 71:1276–82. doi: 10.1080/01635581.2019.1604005
75. Tehard B, Clavel-Chapelon F. Several anthropometric measurements and breast cancer risk: results of the E3N cohort study. Int J Obes. (2006) 30:156–63. doi: 10.1038/sj.ijo.0803133
76. White AJ, Nichols HB, Bradshaw PT, Sandler DP. Overall and central adiposity and breast cancer risk in the Sister Study. Cancer. (2015) 121:3700–8. doi: 10.1002/cncr.29552
77. Wu MH, Chou YC Yu JC, Yu CP, Wu CC, Chu CM, et al. Hormonal and body-size factors in relation to breast cancer risk: a prospective study of 11,889 women in a low-incidence area. Ann Epidemiol. (2006) 16:223–9. doi: 10.1016/j.annepidem.2005.02.015
78. Al-Jafar R, Wahyuni NS, Belhaj K, Ersi MH, Boroghani Z, Alreshidi A, et al. The impact of Ramadan intermittent fasting on anthropometric measurements and body composition: evidence from LORANS study and a meta-analysis. Front Nutr. (2023) 10:1082217. doi: 10.3389/fnut.2023.1082217
79. Bruning PF, Bonfrèr JM, Hart AA, van Noord PA, van der Hoeven H, Collette HJ, et al. Body measurements, estrogen availability and the risk of human breast cancer: a case-control study. Int J Cancer. (1992) 51:14–9. doi: 10.1002/ijc.2910510104
80. Olefsky JM. The insulin receptor: its role in insulin resistance of obesity and diabetes. Diabetes. (1976) 25:1154–62. doi: 10.2337/diab.25.12.1154
81. Kissebah AH, Vydelingum N, Murray R, Evans DJ, Hartz AJ, Kalkhoff RK, et al. Relation of body fat distribution to metabolic complications of obesity. J Clin Endocrinol Metab. (1982) 54:254–60. doi: 10.1210/jcem-54-2-254
82. Zimta A-A, Tigu AB, Muntean M, Cenariu D, Slaby O, Berindan-Neagoe I. Molecular links between central obesity and breast cancer. Int J Mol Sci. (2019) 20:5364. doi: 10.3390/ijms20215364
83. Iyengar NM, Hudis CA, Dannenberg AJ. Obesity and cancer: local and systemic mechanisms. Annu Rev Med. (2015) 66:297–309. doi: 10.1146/annurev-med-050913-022228
84. Fournier F, Diaz-Marin R, Pilon F, Neault M, Juneau R, Girouard G, et al. Obesity triggers tumoral senescence and renders poorly immunogenic malignancies amenable to senolysis. Proc Natl Acad Sci USA. (2023) 120:e2209973120. doi: 10.1073/pnas.2209973120
85. Carney PI. Obesity and reproductive hormone levels in the transition to menopause. Menopause. (2010) 17:678–9. doi: 10.1097/gme.0b013e3181e3a10a
86. Samavat H, Kurzer MS. Estrogen metabolism and breast cancer. Cancer Lett. (2015) 356(2 Pt A):231–43. doi: 10.1016/j.canlet.2014.04.018
87. Gaikwad NW, Yang L, Muti P, Meza JL, Pruthi S, Ingle JN, et al. The molecular etiology of breast cancer: evidence from biomarkers of risk. Int J Cancer. (2008) 122:1949–57. doi: 10.1002/ijc.23329
88. Baglietto L, English DR, Hopper JL, MacInnis RJ, Morris HA, Tilley WD, et al. Circulating steroid hormone concentrations in postmenopausal women in relation to body size and composition. Breast Cancer Res Treat. (2009) 115:171–9. doi: 10.1007/s10549-008-0069-3
89. Healy LA, Ryan AM, Carroll P, Ennis D, Crowley V, Boyle T, et al. Metabolic syndrome, central obesity and insulin resistance are associated with adverse pathological features in postmenopausal breast cancer. Clin Oncol. (2010) 22:281–8. doi: 10.1016/j.clon.2010.02.001
90. Key T, Appleby P, Barnes I, Reeves G. Endogenous sex hormones and breast cancer in postmenopausal women: reanalysis of nine prospective studies. J Natl Cancer Inst. (2002) 94:606–16. doi: 10.1093/jnci/94.8.606
91. Nakamura A, Osonoi T, Terauchi Y. Relationship between urinary sodium excretion and pioglitazone-induced edema. J Diabetes Investig. (2010) 1:208–11. doi: 10.1111/j.2040-1124.2010.00046.x
Keywords: central obesity, breast cancer, meta-analysis, body mass index, hip circumference, waist circumference, waist-hip-ratio
Citation: Chen H, Yuan M, Quan X, Chen D, Yang J, Zhang C, Nan Y, Luo F, Wan D, Yang G and An C (2023) The relationship between central obesity and risk of breast cancer: a dose–response meta-analysis of 7,989,315 women. Front. Nutr. 10:1236393. doi: 10.3389/fnut.2023.1236393
Received: 16 June 2023; Accepted: 29 September 2023;
Published: 09 November 2023.
Edited by:
José María Huerta, Carlos III Health Institute (ISCIII), SpainReviewed by:
Meseret Derbew Molla, University of Gondar, EthiopiaZaki A. Sherif, Howard University, United States
Copyright © 2023 Chen, Yuan, Quan, Chen, Yang, Zhang, Nan, Luo, Wan, Yang and An. This is an open-access article distributed under the terms of the Creative Commons Attribution License (CC BY). The use, distribution or reproduction in other forums is permitted, provided the original author(s) and the copyright owner(s) are credited and that the original publication in this journal is cited, in accordance with accepted academic practice. No use, distribution or reproduction is permitted which does not comply with these terms.
*Correspondence: Donggui Wan, MTEzOTY2MzYwN0BxcS5jb20=; Guowang Yang, Z3Vvd2FuZ195YW5nQDE2My5jb20=; Chao An, YW5uaWVfYnVjbUAxMjYuY29t
†These authors have contributed equally to this work and share first authorship
 Hongyang Chen
 Mengqi Yuan3,4†
 Dongmei Chen