
94% of researchers rate our articles as excellent or good
Learn more about the work of our research integrity team to safeguard the quality of each article we publish.
Find out more
ORIGINAL RESEARCH article
Front. Nutr., 12 July 2023
Sec. Food Chemistry
Volume 10 - 2023 | https://doi.org/10.3389/fnut.2023.1198802
This article is part of the Research TopicCoffee and Coffee By-Products: Innovative Approaches Fostering Nutritional, Sensory and Chemical QualityView all 5 articles
 Su Xu1,2*
 Yuze Liu1
 Zhenchun Sun2
 Guangjing Chen1
 Fengwei Ma1Ni Yang2Elias de Melo Virginio Filho3
 Ian D. Fisk2
Twenty agroforestry systems consisting of different management practices (conventional and organic) and shade types were set up for coffee plantations in 2,000 at the Tropical Agricultural Research and Higher Education Center (CATIE), Turrialba, Costa Rica. The physical (density, bulk density, moisture content, and roasting loss) and chemical attributes (mineral, total lipid, fatty acids, caffeine, and carbohydrate contents) of harvested green coffee beans were investigated. The full sun and Erythrina shade tree systems significantly improved (p < 0.05) the density of the green coffee beans and decreased (p < 0.05) the moisture content and roasting loss of the green coffee beans. The intensive organic (IO) management practice significantly increased some mineral contents, such as K, P, and Ca, in green coffee beans. The full sun system also significantly promoted (p < 0.05) some mineral contents, such as Ca and Mn, in green coffee beans. In terms of total lipid and fatty acids (FAs), compared with the moderate conventional (MC) management practice, the IO management practice was beneficial as it significantly increased (p < 0.05) the total lipid and FAs contents in the green coffee beans, while the Erythrina shade tree system significantly increased (p < 0.05) the total lipid and FAs contents of green coffee beans more efficiently than the other shade types. The caffeine content of green coffee beans was significantly higher (p < 0.05) under the intensive conventional (IC) and IO management practices than under the MC management practice and higher under the full sun system than under the shaded system. The Erythrina shade tree system significantly improved (p < 0.05) the carbohydrate content of green coffee beans. Overall, in consideration of sustainability, the IO management practice associated with the Erythrina shade tree system would be a useful combination for the local farmers to grow coffee trees.
Coffee is a major export product for developing countries and provides livelihoods for millions of people, constituting a major income for many countries in South and Central America, Africa, and Southeast Asia (1). It has been reported that the physical and chemical characteristics of green coffee beans are strongly correlated with environmental conditions (e.g., altitude, humidity, and sunlight), shade cover percentages, and agricultural practices (2–4). Nonetheless, field management methods are still highly conflicted between the physicochemical and organoleptic properties of coffee and shades and agricultural practices.
Somporn et al. (2) suggested that the weight and size of green coffee beans increased significantly under shade trees than under the full sun. Furthermore, lychee shade improved green coffee bean yield, total phenolic content, and antioxidant activity, while the full sun system promoted the generation of vanillic and caffeic acids. Similarly, Worku et al. (3) investigated the effects of altitude, shade, and postharvest processing on the content of biochemical substances and the quality of green coffee beans. It has been indicated that there are complicated interaction effects among altitude, shade levels, and postharvest processing on the biochemical composition of green coffee beans. For example, sucrose content increased significantly with altitude for wet-processed green coffee beans, but not for dry-processed green coffee beans; the sucrose content of green coffee beans grown without shade increased significantly with altitude. In contrast, Cassamo et al. (4) found that the physicochemical properties of green coffee beans were scarcely affected by altitude and light conditions (shade or full sun).
Management practices, especially organic and conventional fertilizers, have been proven to affect the yield and quality of green coffee beans (5–7). An increase in productivity has been achieved by using a large number of external agrochemical inputs and shortcutting ecological cycles (5, 8), which contribute to environmental pollution, degradation of soils (1, 6), and health hazards (7). The high annual production cost caused by the extensive use of these external inputs cannot be reduced easily, resulting in the vulnerability of coffee farmers to the unstable international coffee market (5). Nevertheless, environment, health, and demand for sustainable agricultural products such as organic coffee have led to 30% of coffee production being sustainably certified (9). Moreover, organic coffee production and certification have reduced the vulnerability of the income of coffee farmers to seasonal changes in coffee price and raw material costs (10), especially as farmers experimented with organic and shaded coffee production methods (5, 10). However, it is necessary to explore the interactions between management practices (organic and conventional fertilizers) and the physicochemical properties of green coffee beans.
Therefore, the aim of this research was to investigate the relationships between the agroforestry systems, including shade and fertilizers, and the physicochemical properties of green coffee beans, and attempt to explain whether the organic agroforestry system is more suitable for the production of green coffee beans.
This study was conducted at the Tropical Agricultural Research and Higher Education Center (CATIE), Turrialba, Costa Rica (9°53′44” N, 83°40′7” W, CATIE, Turrialba, Costa Rica) in 2000. According to the definition, it has a low elevation (600 m above sea level) and a wet coffee area with no obvious dry season. The annual mean rainfall, temperature, relative humidity, and solar radiation were 2,915 mm year−1, 22°C, 90.2%, and 15.9 MJ m−2 year−1, respectively.
There were 20 agroforestry systems with various shade types and management practices included in the partially randomized block design, where the shade trees played the major role, whereas subplots indicated the management practices (Supplementary Table S1). Three replicates were set up in the systems (Supplementary Figure S1). Shade type [originally 417 trees ha−1 (6 × 4 m2 interval)] was constituted by service tree and timber species that had different features (Supplementary Table S2).
Management practices included weed control, fertilization, and disease and pest control (Supplementary Table S3). Coffea arabica L. var. Caturra was planted at a density of 5,000 holes ha−1, and dead or dying plants were substituted annually. After planting (local practice), two plants within one hole were considered as one during the discussion. The inter-hole and inter-row distances were 1 and 2 m, respectively. The central part (225–300 m2) of the subplots (500–600 m2 in area) was researched (24 shade trees together with 100 coffee plants).
The coffee plants were manually pruned in 2004, with 1–4 resprouts left on every stump, based on the coffee resprout production potential during the subsequent harvest. Each coffee-planting hole constituted of 1–2 stumps and 1–4 resprouts per stump.
The coffee cherries from the different agroforestry systems were artificially harvested in the morning in both November 2013 and November 2014. All coffee cherries were then transported immediately from the field to the Industry Department of the Costa Rican Coffee Institute-ICAFE for wet processing and hot air drying. After that, all processed green coffee beans with vacuum packaging were shipped to the University of Nottingham, United Kingdom, and then stored at −20°C for analysis.
The coffee roasting process has been described by Caporaso et al. (11). Briefly, a coffee roaster (Roastilino, Fracino) with a nominal volume of approximately 200 g was used to roast the green coffee beans, and 50 g of each sample was prepared and roasted. The roasting time and air outlet temperature were set at 1 min 50 s and 166°C, respectively. After the first cracking process, all the coffee beans were roasted to a medium degree. Following the roasting, a mini chopper (CH180 mini chopper, 300 W, Kenwood) was used to grind 30 g of coffee beans into powdered form, and then the coffee powder samples were obtained using a 710-μm sieve. The samples were later kept under −20°C.
Green and roasted coffee beans were weighed with a balance (0.01 g, PFB 1200–2, KERN Ltd.) before and after roasting, and their weights were recorded (W1 for green beans and W2 for roasted beans). Thus,
All the coffee samples were weighed without containers and the weight was recorded as W3 (g). All the coffee samples were weighed together with their containers using a balance (0.01 g, PFB 1200–2, KERN Ltd.), and their total weight was recorded as W4 (g). Next, they were loaded into a 105°C drying oven (GenLab Ltd.). After 24 h, the coffee samples were weighed together with their containers again and their weight was recorded as W5 (g) (12). Thus:
The assumption was that all green coffee beans were considered to be half a triaxial ellipsoid (13). The length (major), width (minor), and thickness of each green coffee bean were measured using a Vernier-caliper (Accuracy: ± 0.02 mm, Carbon Fibre Composites Digital Caliper, Fisher Scientific) and recorded as a, b, and c, respectively. Thus, the volume of each green coffee bean could be calculated using the ellipsoid volume formula as follows:
Ten green coffee beans (three replicates) were randomly selected from each plot and their length, width, and thickness were measured (14). After that, the volumes of each green coffee bean were calculated, and then, the average volume [Va (mm3)] of the 10 green coffee beans was calculated. The total weight [W6 (g)] of the 10 green coffee beans was measured using a balance (0.01 g, PFB 1200–2, KERN Ltd.). Thus, the average density of an individual bean could be calculated as follows:
Approximately 20 g of the green coffee beans (three replicates) were weighed using a balance (0.01 g, PFB 1200–2, KERN Ltd., Fareham, United Kingdom). Next, the green coffee beans were put into a volumetric flask for volume measurement and recording (14). Thus, the average bulk density of the green coffee beans could be calculated.
This study used acid digestion to prepare the sample and inductively-coupled plasma mass spectrometry (ICP-MS) to measure the mineral content of the green coffee beans (15).
For acid digestion, 0.2 g of the coffee powder was placed into plastic tubes provided by Microwave Digestion System (Microwave Digestion System: Multiwave Go, AutonPaar). Six milliliters of 70% nitric acid (Trace Analysis Grade, Fisher, UK) was put into the plastic tubes, and then placed in the microwave digestion system for 40 min with a heating program: the system temperature was increased from 0°C to 160°C over 15 min and then kept for 15 min under 160°C before a 10-min cooling until it reached ambient temperature. After incubation, the samples were transferred to glass bottles. Next, 4, 5, and 5 mL of distilled water were used sequentially to clean the plastic tubes; the used water was then transferred to glass bottles and combined. Finally, 2 mL of the samples were transferred to inductively-coupled plasma (ICP) tubes, followed by the addition of distilled water (8 mL).
ICP-MS (Thermo-Fisher iCAP-Q model, Thermo-Fisher Scientific, Bremen, Germany) was used to analyze multiple elements in dilutions. Three operational models were adopted for instrument operation, (i) one collision-cell (Q-cell) that used He showed kinetic energy differentiation (He-cell) for eliminating polyatomic interferences, (ii) a standard mode (STD) for the evaluation of collision cell, and (iii) a hydrogen mode (H2-cell) with H2 gas being the cell gas. The samples were introduced via the autosampler (Cetac ASX-520), integrating the PEEK nebulizer (Burgener Mira Mist) for the ASXpress fast absorption module. By using the ASXpress unit, the internal standards were introduced into the sample stream onto an isolated line, with Ir (5 μg L−1), Rh (10 μg L−1), and Ge (10 μg L−1) being incorporated into the 2% HNO3 (trace analysis grade; Fisher Scientific, United Kingdom). Approximately 0, 20, 40, and 100 μg L−1 of mineral solutions (including Ag, Al, As, Ba, Be, Cd, Ca, Co, Cr, Cs, Cu, Fe, K, Li, Mg, Mn, Mo, Na, Ni, P, Pb, Rb, S, Se, Sr., Tl, U, V, and Zn) (Claritas-PPT grade CLMS-2; SPEX Certiprep Inc., Metuchen, NJ, United States) were used as the external multifactor calibration criteria, respectively. Ca, Mg, Na, and K criteria within the scope 0–30 mg L−1 were created with the bespoke external multi-element calibration solution (PlasmaCAL, SCP Science, France). The calibration of P, B, and S adopted the in-house standards (H3BO3, KH2PO4, and K2SO4). The present study adopted in-sample switching for measuring P and B under the STD model and Se under the H2-cell model, whereas the remaining factors were under the He-cell mode. By adopting the Qtegra™ software (Thermo-Fisher Scientific), the obtained samples were processed using external cross-calibration between an analog detector and the pulse-counting models.
The Bligh and Dyer (16) method was used to extract lipids from coffee. Coffee powders (0.1 g, wet basis) were soaked in chloroform:methanol (2:1; 2 mL) in a 15-mL centrifuge tube for 1 min with vortexing. Next, the samples were centrifuged at 1,600 × g and 4°C for 10 min. After centrifugation, three phases were presented in the samples; the bottom phase was carefully removed and placed in a clean glass vial. These steps were repeated thrice to fully extract the lipids. The bottom phase was then exposed to N2 to avoid lipid oxidation, and then stored. Finally, the lyophilized lipid samples were stored at −80°C with N2 added into the storage bottles to protect the lipid.
Approximately 0.1 g of coffee powder (wet foundation) was prepared, and the weight was recorded as W7 (g) using an analytical balance (0.1 mg, Sartorius 1712, Sartorius Ltd., Epsom, United Kingdom). An empty glass vial was weighed, and the weight was recorded as W8 (g). For each sample, the bottom phases of the three extractions were combined into the glass vial and dried using N2 gas. The weight of the glass vial containing the dried lipid extract was recorded as W9 (g) (17). The total lipid content by dry mass was calculated using the following formula:
Where MC was moisture content as a percentage.
Approximately 0.1 g of methyl pentadecanoate was weighed, and dissolved in 10 mL chloroform. After being added to the dried lipid extract, chloroform (2 mL) was vortexed for 2 min. The mixture (1 mL) was filtered with the PTFE syringe filter (0.45 μm, Whatman, Buckinghamshire, United Kingdom), and moved into the novel glass vial. Internal reference (100 μL) was added, and then 200 μL of trimethylsulfonium hydroxide solution was added for the change of fatty acids to fatty acid methyl esters (FAMEs). The mixture was incubated for 10 min at room temperature to guarantee a complete conversion. Finally, the mixture was placed into a gas chromatography (GC) vial for analysis (17).
A gas chromatograph (Trace GC Ultra, Thermo Scientific) containing an auto-injection system (AS3000) and connected with a quadruple mass spectrometer (DSQII Quadrupole GC–MS, 50–380 m/z, Thermo Scientific) was used. A vaporization injector in the split model (3.0 mm liner, split flow 50 mL min−1, 250°C) was adopted to inject the sample (1 μL) in the capillary column (Phenomenex Zebron ZB-FFAP, film thickness 0.25 μm, 30 m × 0.25 mm I.D). For the oven, it was first kept under 120°C for 1 min before being heated at 5°C min−1 to 250°C for 2 min. FAME standards (Supelco37 Component FAME Mix) were adopted to compare the retention time of each peak. The Thermo Scientific Xcalibur software program was adopted to compare the mass spectrum with a standard library for identification verification. The Thermo Scientific Xcalibur software program was adopted to calculate the peak area of each FA. Moreover, the FA content was calculated using the formula below (17):
(Dry weight of coffee powder = wet weight of coffee powder × (1-moisture content))
The criteria for the preparation of caffeine was 10/20/40/50 mg L−1. After being put into a 50-mL centrifuge tube containing boiling water (20 mL), 0.1 g of coffee powder was vortexed for 5 min. The samples were centrifuged for 10 min at 1600 × g and at room temperature. After the centrifugation, the liquid stage was transferred to the novel glass vial. Caffeine was extracted completely by repeating the above processes three times. The mixed sample was then left for cooling under ambient temperature, followed by filtration using a 0.45-μm syringe filter (hydrophilic nylon syringe filter, Millipore Corporation). Before liquid chromatography-mass spectrometry, the eventual water extract dilution (1:1) was performed (LC/MS) (18).
The LC device (1,100 Series, Agilent) containing one degasser (G1322A, Agilent), an auto-sampler (G1313A, Agilent), and a pump (G1312A, Agilent) was connected to the Quattro Ultima mass spectrometer (Micromass, UK Ltd.) under the electrospray ion source.
Caffeine was separated with a 5-μm Kromasil 5 ODS (C18) column (250 × 3.20 mm, Phenomenex), and the column was stored at room temperature. The mobile stage contained 0.3% aqueous formic acid (eluent A) and methanol (eluent B) at the 0.4 mL min−1 flow rate. Next, 25% of B was applied first as a solvent, while 60% of B was modified immediately after this operation at 8 min. During the injection process, the column was re-equilibrated with 25% of B for 4 min.
Caffeine (M + H)+ ions were generated by operating the electrospray ionization source in the positive model (3.5KV) from 4.0–8.0 min with the 400°C desolvation temperature and 500 L h−1 desolvation gas (N2) flow rate. The caffeine measurement was then completed by operating a mass spectrometer under a selected ion recording model. The criteria for the molecular weight and retention time were compared to identify the compounds. Masslynx software (version 4.0, Waters) was adopted to compare the peak regions of the samples and the norms for quantification (18).
The carbohydrate standard mixture, comprising arabinose, galactose, glucose, and mannose was prepared. The concentration of arabinose and glucose were 2.5, 5, 10, and 20 mg L−1, while the concentration of galactose was 5, 10, 40, and 80 mg L−1, and the concentration of mannose was 5, 10, 20, and 40 mg L−1.
Saeman’s hydrolysis was used to extract carbohydrates from green coffee beans (19). Approximately 30 mg of green coffee powder (wet basis) was put in a round bottom Pyrex tube, and 1 mL of 12 M H2SO4 was added. The tube was sealed and put into a 37°C water bath for 60 min. The samples were then eliminated, and 11 mL of demineralized water was added. The samples were then put into a 100°C water bath for 120 min. After that, the samples were removed and placed in a cold-water bath until they were cool enough to handle. Next, 1 mL of the sample was then placed in a 15-mL Falcon tube, followed by the addition of 10 mM NaOH (9 mL) to make a 1–10 dilution.
Carbohydrates were analyzed using the Dionex ICS-3000 Ion Chromatography System (Thermo Scientific). The reagent-free ion chromatography was configured with an auto-injection system (AS autosampler) and coupled to the Dionex ICS-3000 system, with a computer controller, and electrochemical detection (ED 40). The mobile stage (10 mM NaOH) was separated using the CarboPac PA 20 column (3 × 150 mm) at the column temperature, injection volume, and flow rate of 30°C, 10 μL, and 0.5 mL min−1, respectively. Their retention time with standard solutions was compared to identify the carbohydrates. The peak areas were calculated using Thermo Scientific Chromeleon software. The concentration of the carbohydrates was determined using a standard curve.
In this experiment, shade types were used as the major plot, whereas the subplots indicated management practices and the imbalanced framework was observed because not every management practice was indicated for every shade type (Supplementary Table S4). Hence, diversities between various management practices and shade types were compared with the given pre-planned contrast models (5, 20) (Supplementary Table S4).
Adopting SPSS statistic software (Version 22.0, IBM, United States), the one-way analysis of variance contrast model was used to analyze the data, with treatments assigned as the contrast element for exploring eight contrast groups (Supplementary Table S4). The significant differences between the contrast groups are presented as p < 0.05. Moreover, the mean for each management practice together with the shade type in every contrast model was calculated.
According to the contrast model, contrast results for density, bulk density, moisture content, and roasting loss were determined (Table 1). In terms of density, bulk density, moisture content, and roasting loss, there were no significant differences (p > 0.05) between the management practices.
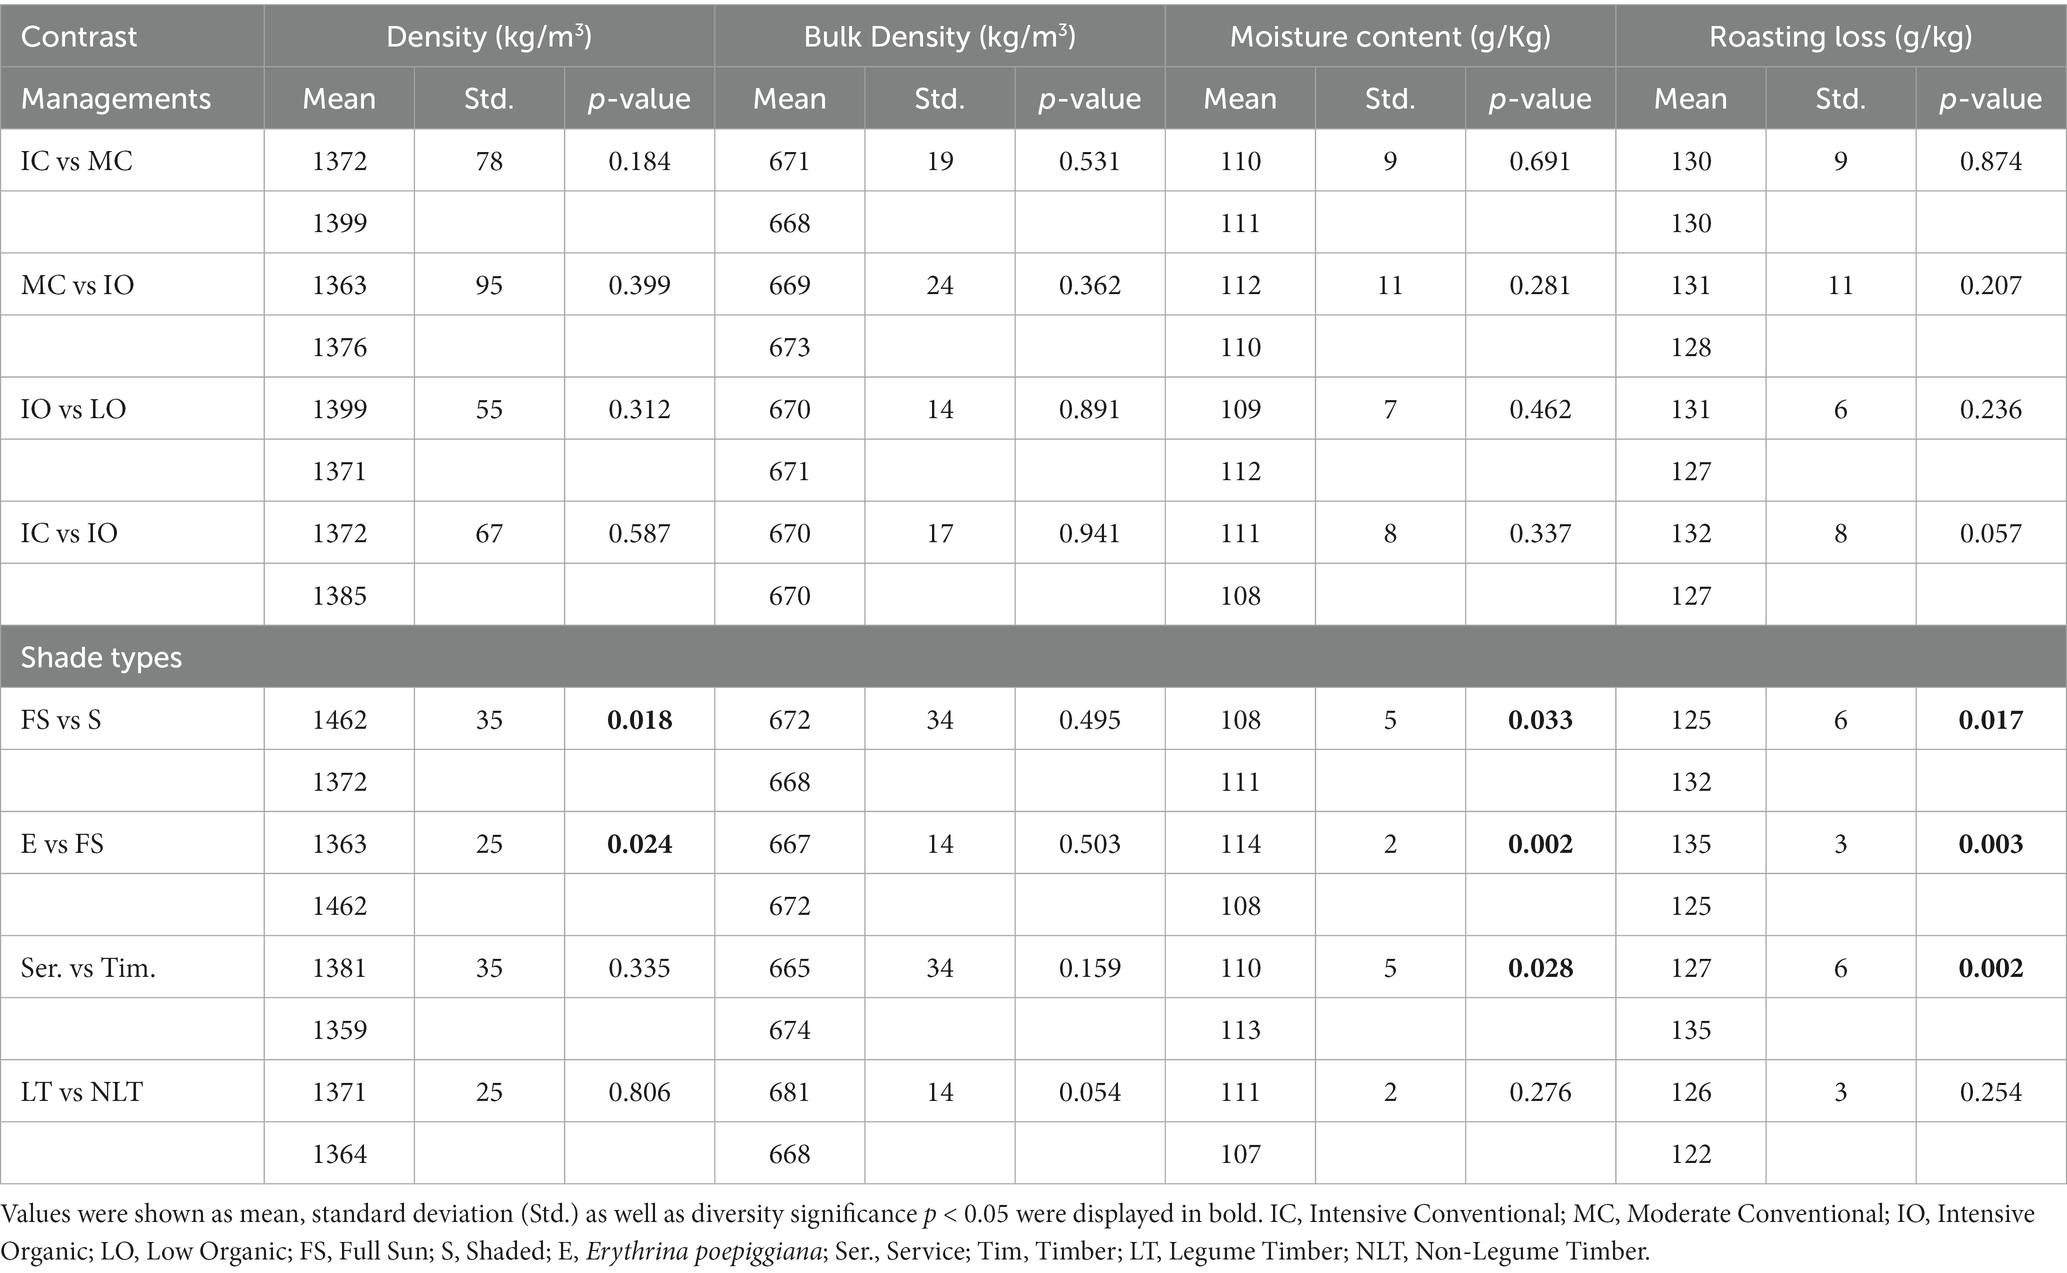
Table 1. Contrast results for density (Kg/m3), bulk density (Kg/m3), moisture content (g/Kg) and roasting loss (g/Kg).
The density of green coffee beans was approximately 1,300–1,400 kg m−3, which was higher than the water density (1,000 kg m−3) (13). Consequently, the green coffee bean density increased with decreasing moisture content. Therefore, under the full sun system, the green coffee bean density significantly increased (p < 0.05) compared with the shaded and Erythrina systems. However, for the service and timber groups, no significant difference (p > 0.05) was observed in green coffee bean density, although the green coffee bean moisture content significantly decreased (p < 0.05) under the service system compared with the timber system. This might be reasonable as shading also prolongs the ripening of coffee beans to help the coffee plant absorb more nutrients. Under a similar shaded system, on the one hand, shading increases the moisture content of green coffee beans, which leads to a decrease in coffee bean density; on the other hand, shading improves the absorbance of nutrients, which may increase coffee bean density (21). Under a similar shaded system, these two factors compete with each other during the growth of the coffee plant, resulting in the density of green coffee beans showing no significant difference (p > 0.05) between the service and timber systems.
With regards to the moisture content, the green coffee beans under the full sun system significantly decreased (p < 0.05) compared with the Erythrina and shaded systems. Moreover, under the service system, green coffee beans had significantly decreased (p < 0.05) moisture content compared with that under the timber system. Compared with the full sun system, the major impact of the shaded system on coffee physiology is related to the reduced wind speeds and temperature fluctuation, which led to the increase in air relative humidity and variations in the aerodynamic roughness of the coffee plants. Taken together, these changes decrease leaf-to-air vapor pressure deficit and restrain the stomatal opening, which results in a decline in transpiration rates. Therefore, water loss caused by exceeding coffee tree evapotranspiration will decrease (1). In addition, the shaded agroforestry system improves the water status of the coffee tree, which is known to affect bean size and density (1). The size of ripe cherries and coffee beans increases in the shaded system because the shading decreases air and plant surface temperature, and thus prolongs bean ripening to generate larger fruits.
During the coffee bean roasting process, even though dry matter loss was approximately 5–8%, the total roasting loss was inconceivably approximately 15–18% (22). Furthermore, the water content decreased from approximately 10–12% to 2–3%, when bean temperatures were below 160°C (23). These indicated that the water loss contributed to the main mass loss during coffee bean roasting. Consequently, the roasting loss of green coffee beans in the full sun system was reduced significantly (p < 0.05) compared with the Erythrina and shaded systems because they presented lower moisture content in the full sun system. Similarly, it can be observed that the roasting loss of green coffee beans in the service system was significantly downregulated (p < 0.05) relative to that in the timber system.
Twenty-eight minerals, including macroelements, such as K, Mg, P, S, and Ca, and microelements, such as Mn, Fe, Cu, Zn, Na, Mo, Co, Ba, Sr., and Rb, were found in the green coffee beans, while only some main minerals (K, Mg, P, S, Ca, Mn, Fe, Cu, Zn, Na, and Mo) were analyzed and are presented in Table 2. No significant differences (p > 0.05) were detected in Mg and Fe contents under the various management practices and shade types.
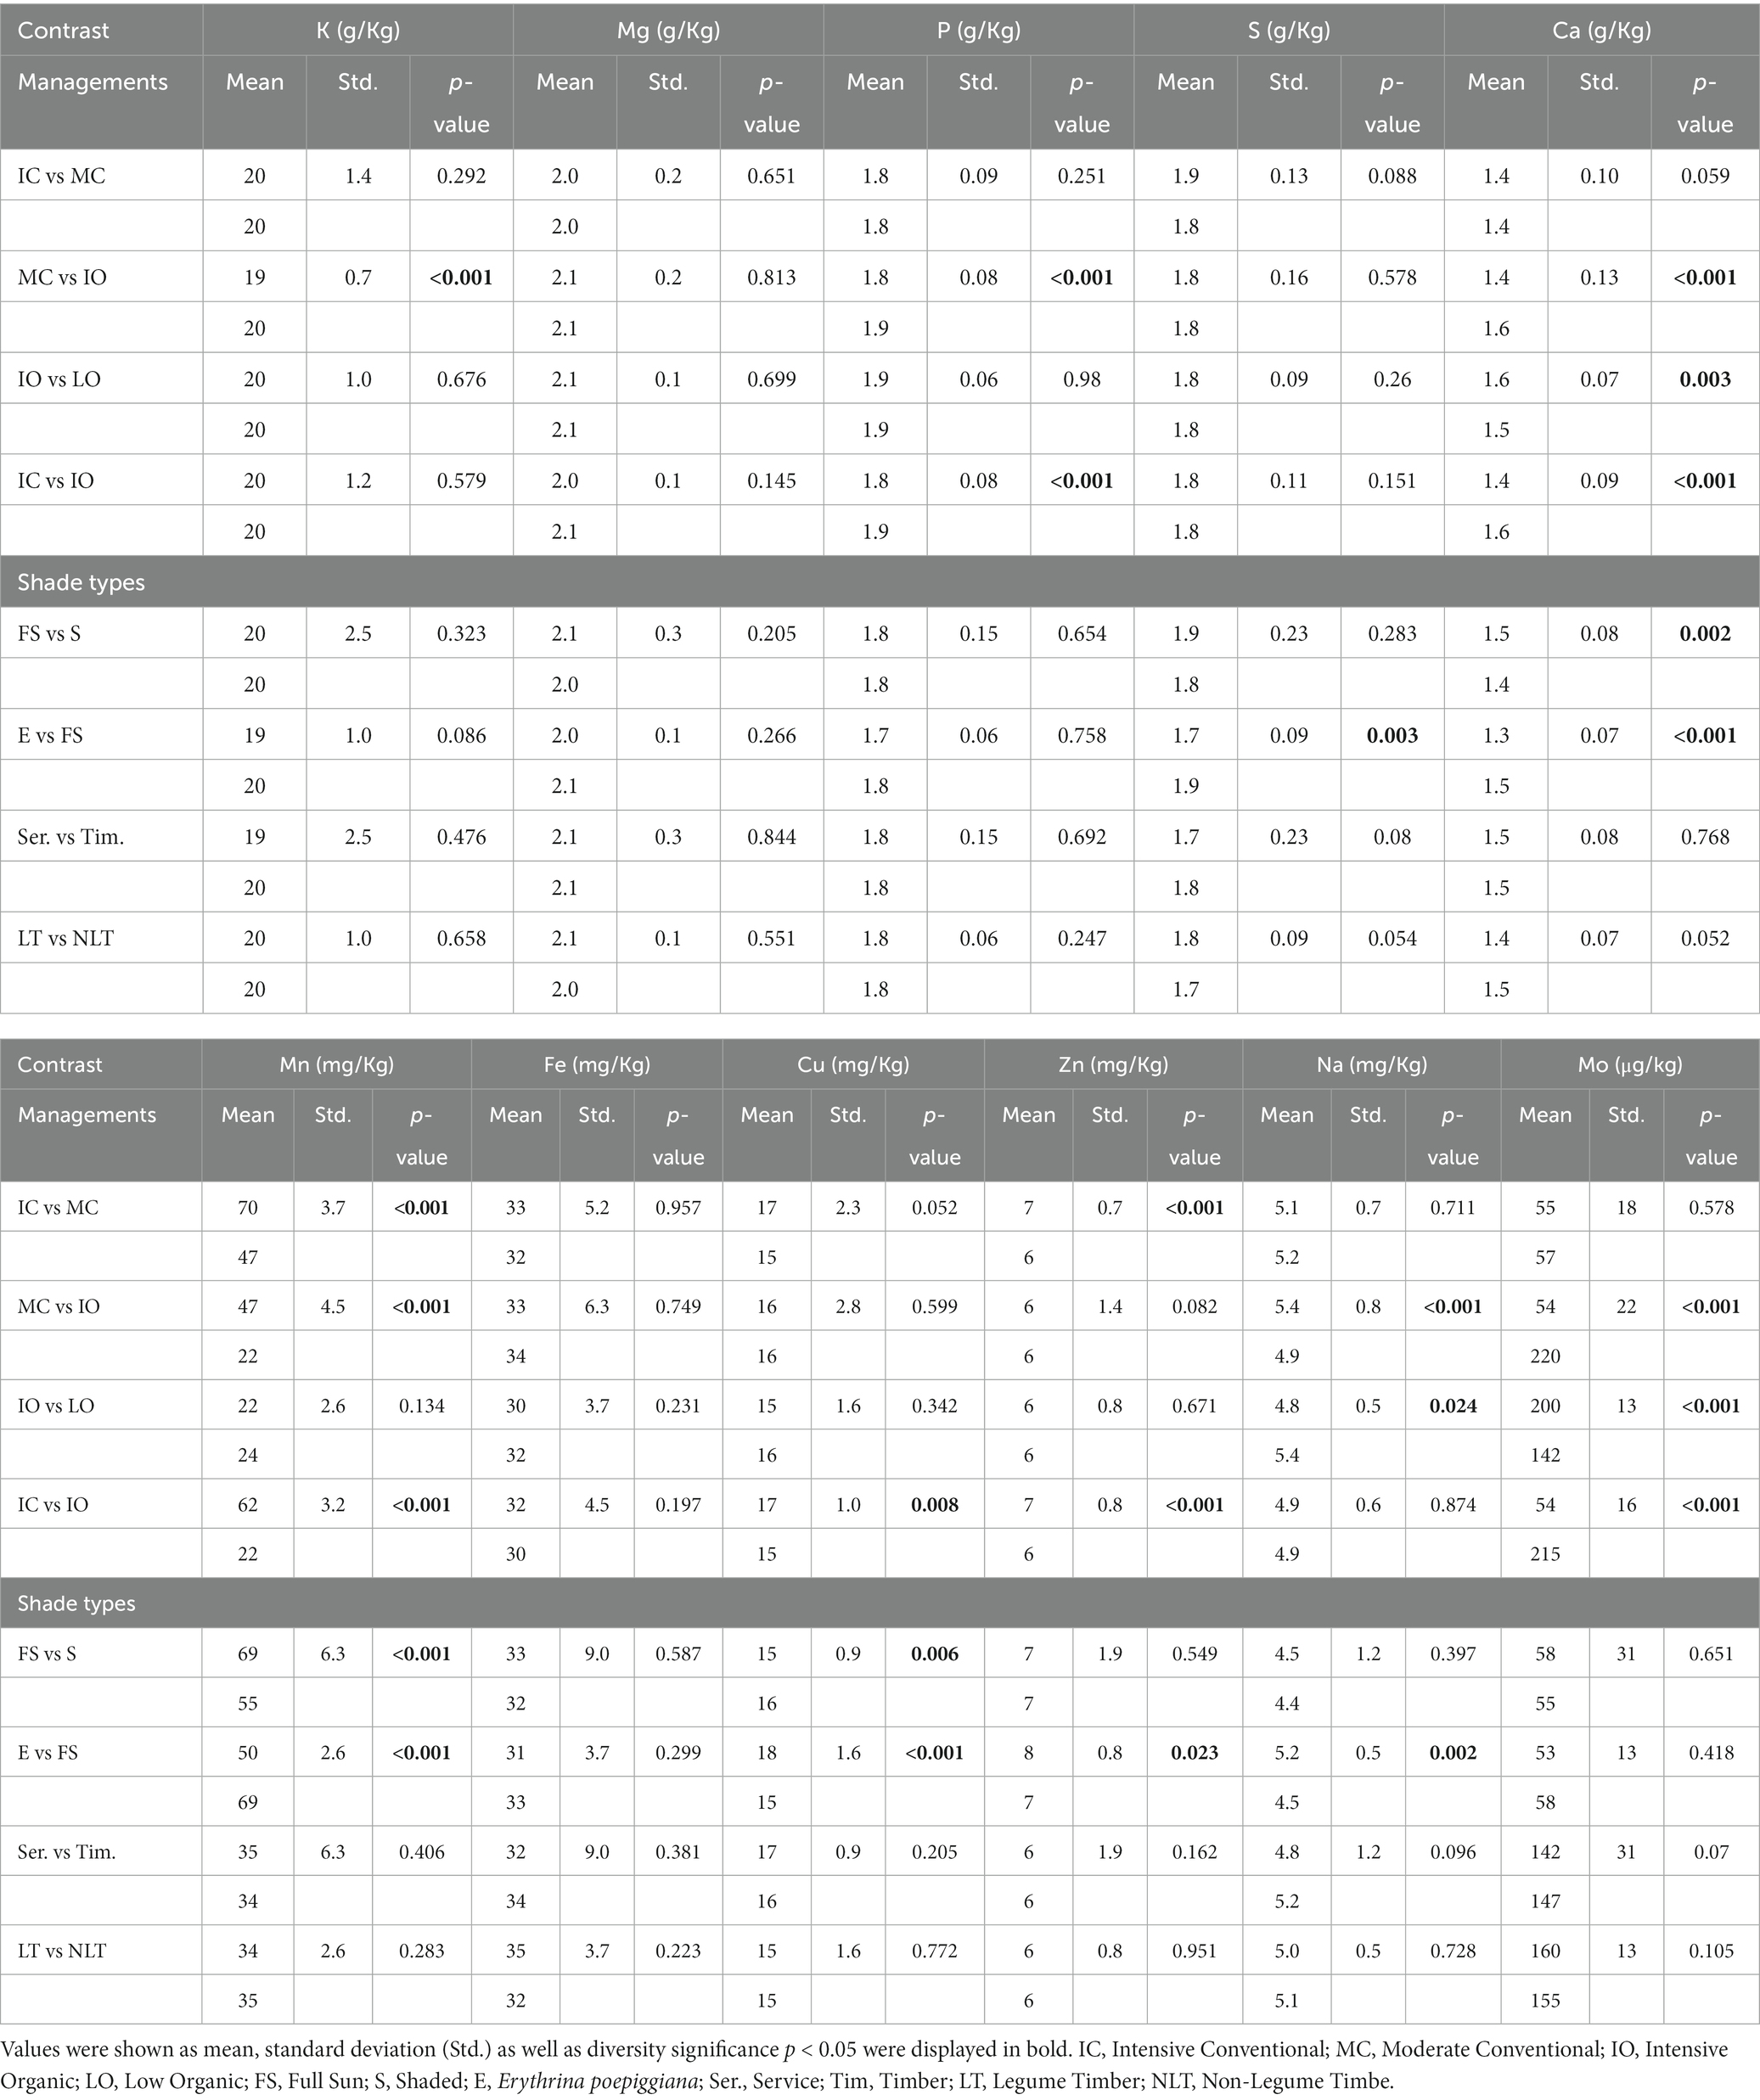
Table 2. Contrast results for major mineral contents (mg/g) by dry weight of green coffee beans.
The ability of a plant to absorb minerals and other nutrients from the soil is extremely complicated. It is determined by the gene as well as the growing environment of the plant, such as temperature, light intensity, fertilizer level, moisture content, and salinity of the soil (24).
In this experiment, the greater quantities of K and P in green coffee beans under the intensive organic (IO) management practice compared with the intensive conventional (IC) and moderate conventional (MC) management practices were related to the higher input of these elements in the IO management practice. However, in terms of IO and LO management practices, although the application amounts of K and P in the IO (326 and 205 kg ha−1 year−1) were much higher than those in the LO management practice, which were 44 kg ha−1 year−1 and 2 kg ha−1 year−1 for K and P, respectively, no significant differences (p > 0.05) in K and P contents of green coffee beans were detected between these two management practices. Haggar et al. (5) reported that the organic management practice improved the organic matter content and cation exchange capacity of the soil in the Costa Rica site. Therefore, although the application amounts of K and P in the LO management practice were much lower, the LO management practice was able to make up for the low input amounts with more organic matter and a stronger cation exchange capacity.
The higher Ca content of green coffee beans in the IO management practice was related to the high content of Ca in chicken manure (25). In this experiment, chicken manure was used as the fertilizer in the IO management practice. Additionally, the Mn, Cu, and Zn contents of green coffee beans decreased significantly (p < 0.05) in the IO, while the Mo quantity was significantly higher (p < 0.05) in the enhanced IO management practice, as organic management practice decreased the soil acidity or increased soil pH (5), and thus, restricted the absorptivity of Mn, Cu, and Zn, and improved the absorbance of Mo (26). For Na, its content was significantly lower (p < 0.05) under the IO system compared with the MC and LO systems, as the higher absorbance of Ca in the IO system restrained Na uptake (6).
The moisture content of the soil, light intensity, and temperature are the major external elements that influence the absorption and transport of minerals in the plant (27). The Costa Rica site is regarded as a wet coffee zone with an average annual rainfall of 2,915 mm year−1. Thus, all coffee plants and corresponding soils in the different shade types have no shortage of water and the moisture content cannot be considered a factor to affect the mineral absorption of coffee plants from the soil. The shade system reduces the temperature and light intensity of coffee plants as well as the soil (1). Nonetheless, the ability of plants to absorb minerals increases with increasing temperature when the temperature is below 40°C (28). Moreover, the higher light intensity improves the absorptivity of the minerals in plants (27). Therefore, the S, Ca, and Mn contents were significantly upregulated (p < 0.05) under the full sun system compared with those under the Erythrina and shaded systems because of the elevated temperature as well as enhanced light intensity. However, the quantities of Cu, Zn, and Na significantly decreased (p < 0.05) in the full sun system compared with those of the Erythrina and shaded systems because of the antagonism of Ca, Cu, Zn, and Na (6). Compared with Cu, Zn, and Na uptakes, the coffee plant absorbed much more Ca, therefore, the excess Ca uptake restricted the coffee plant from uptaking more Cu, Zn, and Na.
Total lipid and FA levels were measured, and 10 fatty acids, including palmitic acid (C16:0), linoleic acid (C18:2), stearic acid (C18:0), arachidic acid (C20:0), behenic acid (C22:0), oleic acid (C18:1), lignoceric acid (C24:0), linolenic acid (C18:3), cosenoic acid (20:1), and myristic acid (C14:0) were found in the green coffee beans (Table 3).
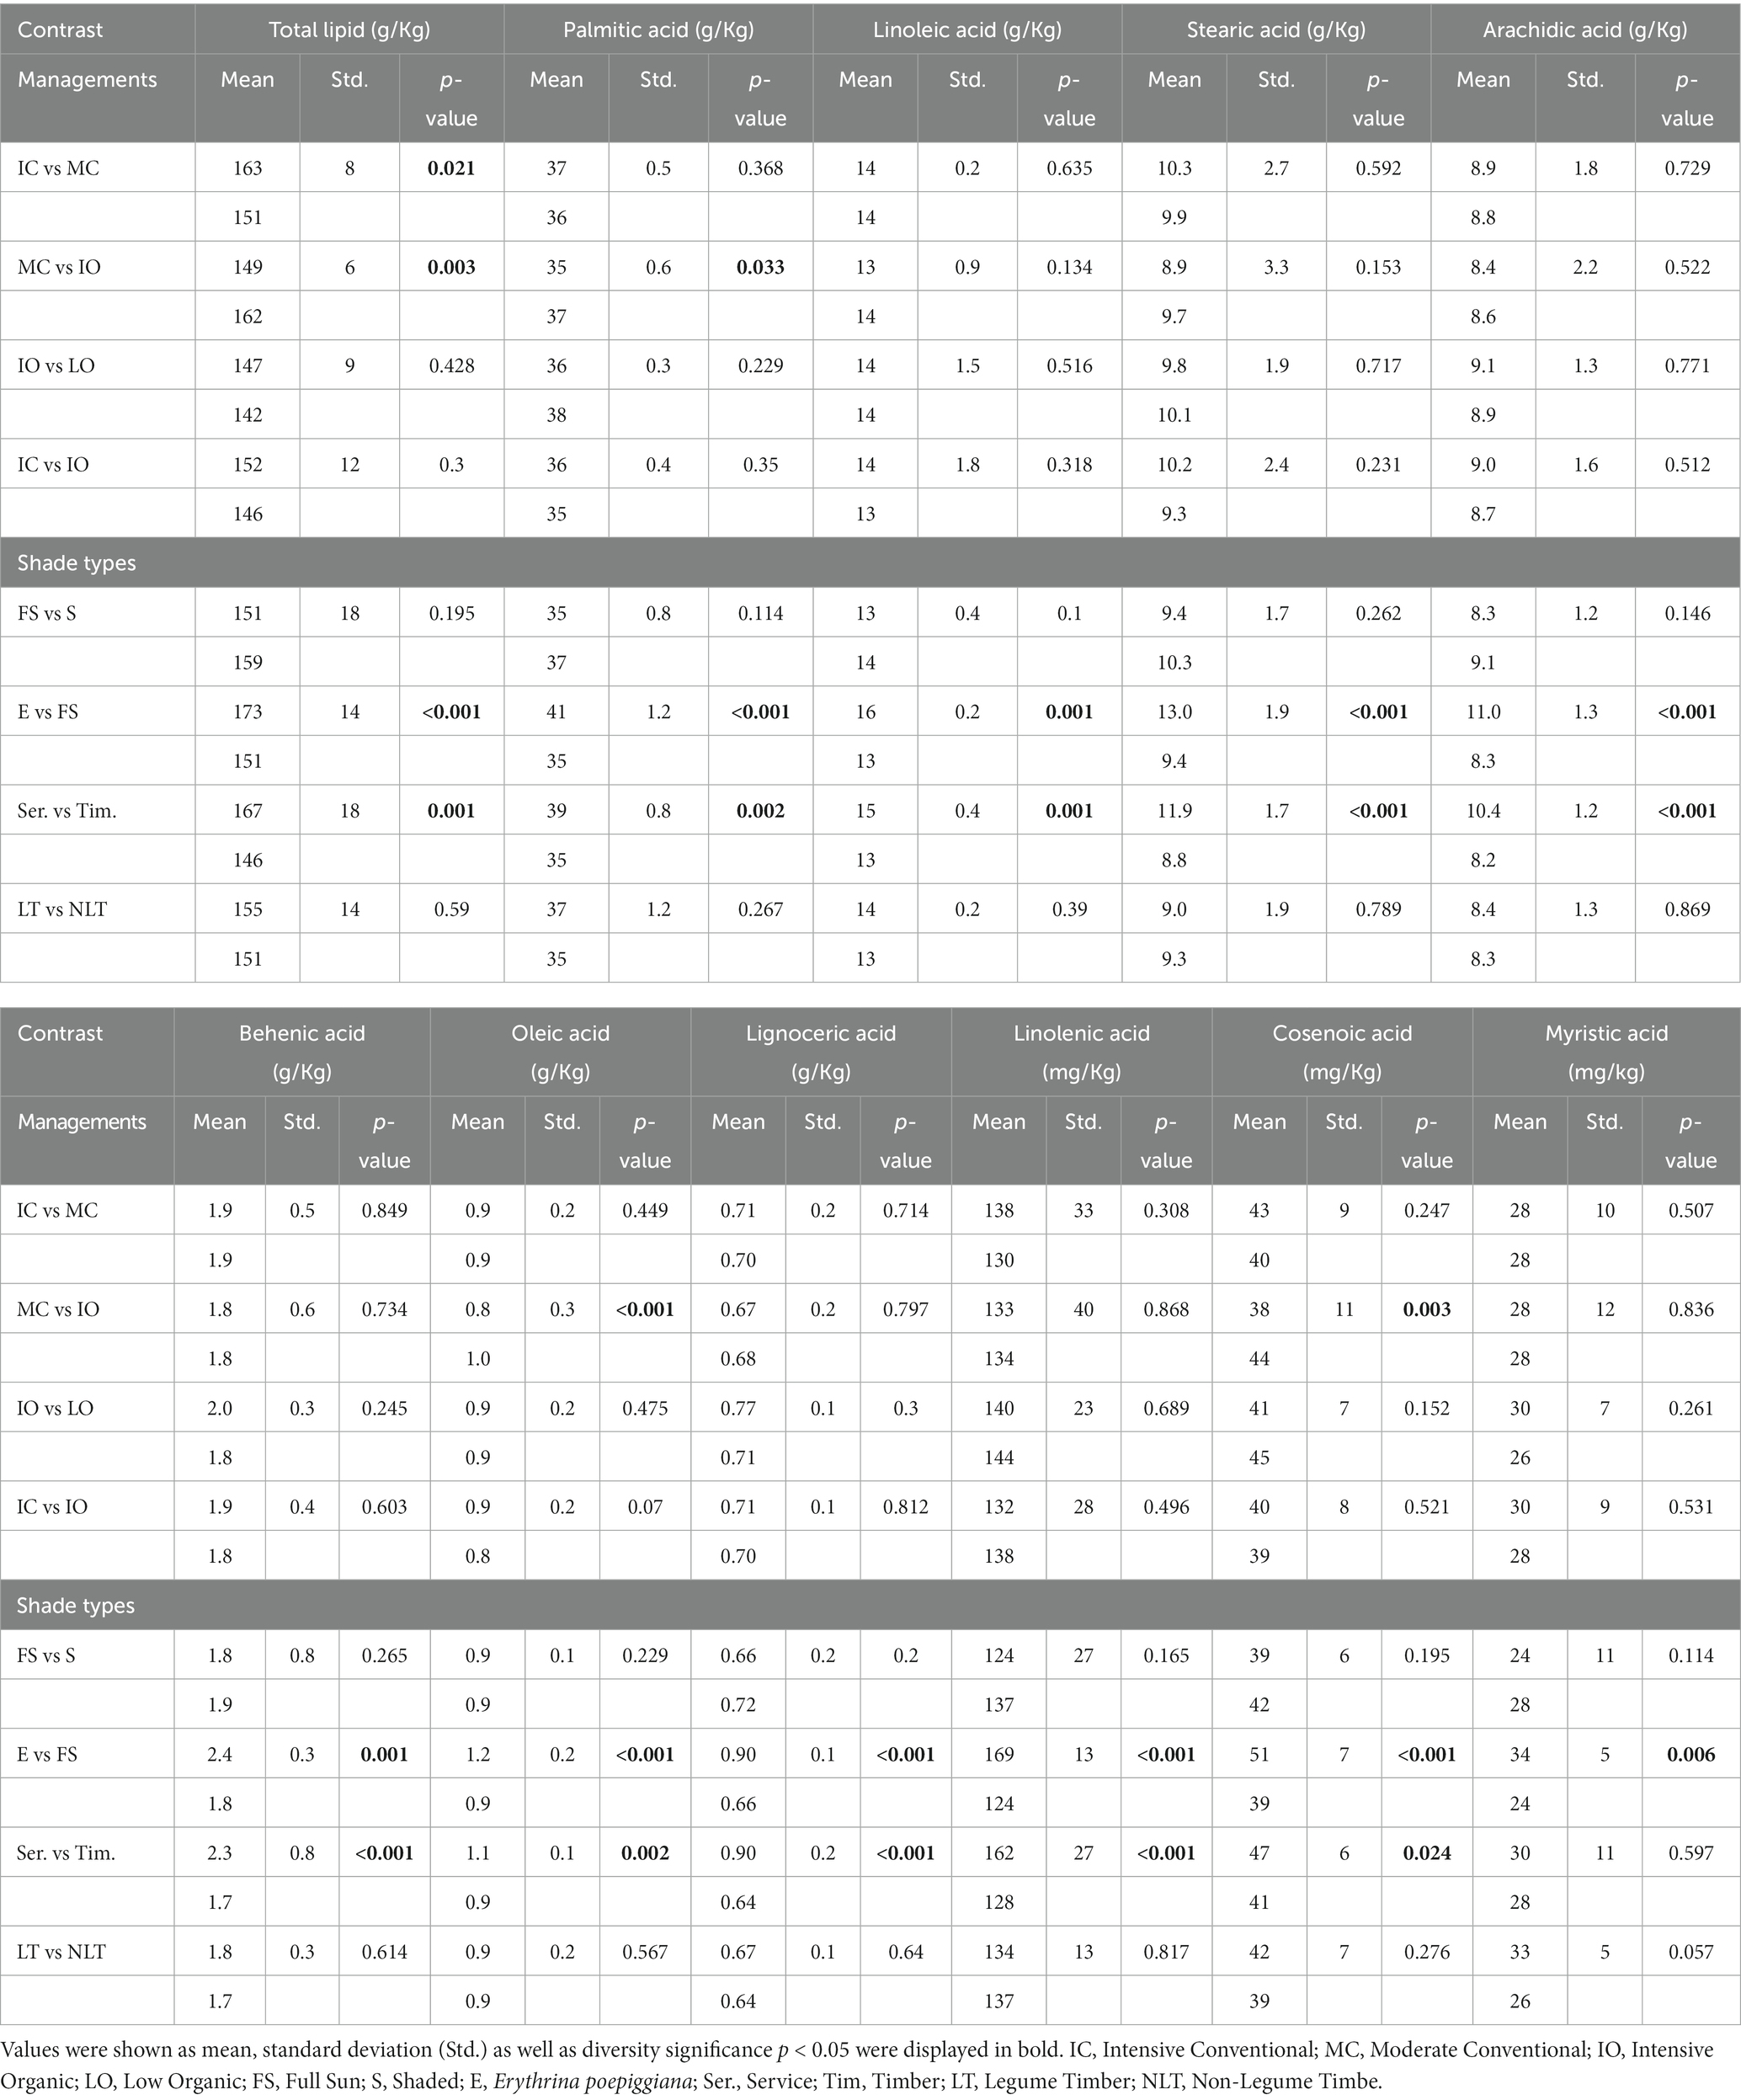
Table 3. Contrast outcomes for total lipid and fatty acids contents (g/Kg and mg/Kg) based on green coffee bean dry weight.
The formation of lipids in coffee plants is a complicated process, which includes many complex biochemical reactions, especially enzymatic reactions. Furthermore, energy and some chemical elements, such as C, H, O, N, and P play an essential role in lipid biosynthesis in the coffee plant (29). Ohlrogge and Browse (29) stated that the acetyl-coenzyme A (CoA) in the plastid contributed to all the carbon atoms present in FA, and they also explained all possible lipid biosynthesis pathways in the plant. In addition, they considered that the synthesis rate of FA in leaves was six times higher in the light than in the dark. As a result, in this experiment, various fertilizer degrees and shade types (light intensity) might affect the total lipid and FAs quantities in green coffee beans.
Regarding the various fertilizer degrees, the overall lipid content was significantly reduced (p < 0.05) in the MC compared with the IC management practice due to the lower input amount of fertilizer in the MC management practice. With the slower release of plant-available nutrients and lower availability of organic fertilizers in the IO management practice and even a higher fertilizer input level (30), the overall lipid and all FA quantities under the IO were similar to those under the IC management practice and even significantly higher (p < 0.05) for the overall lipid and a few FAs, including oleic acid, palmitic acid, and cosenoic acid than under the MC management practice. Therefore, for total lipid and FA contents in the green coffee beans, the performance of the IO management practice with a higher fertilizer input amount kept up with its counterpart IC, and to some extent, even exceeded the MC management practice, as the IO management practice improved the soil environment, and increased cation exchange capacity and organic matter in the soil (5). Furthermore, for the IO and LO, although the input amount of fertilizer in the LO was much lower, no significant difference (p > 0.05) was detected in the total lipid and FAs contents between these two organic management practices. In our contrast model, while comparing with the IO, the LO management practice was integrated with legume species Chloroleucon and Erythrina. Typically, legume species supplement N2 shortage because of the low input degree by N2 fixation (31). In contrast, the lower external inputs may be compensated by the high pruning intensity such as in Erythrina, due to the abandonment of Erythrina shade tree-pruned branches and leaves (5).
With regards to the role of shade types in the overall lipid and FA contents, there were no significant differences (p > 0.05) between the full sun and shaded systems, and between non-legume and legume timber systems, proving that neither N2 fixation nor light intensity was a major element affecting lipid levels in this experiment. Nonetheless, the overall lipid and FA quantities were significantly upregulated (p < 0.05) in the Erythrina system compared with the full sun and timber systems (the Erythrina was the only service shade tree in the current experiment, thus, in the contrast group service vs. timber, the service tree could be replaced directly with Erythrina). It could be explained by the intensive pruning of Erythrina (7). The intensive pruning of Erythrina supplied available nutrients directly to the soil as well as to the coffee plant, which could promote the biosynthesis of lipids in the coffee plant.
The polysaccharides content was decided by measuring the acidolysis solution of coffee powder using high-performance liquid chromatography (HPLC). Table 4 shows the result of caffeine and polysaccharides content.
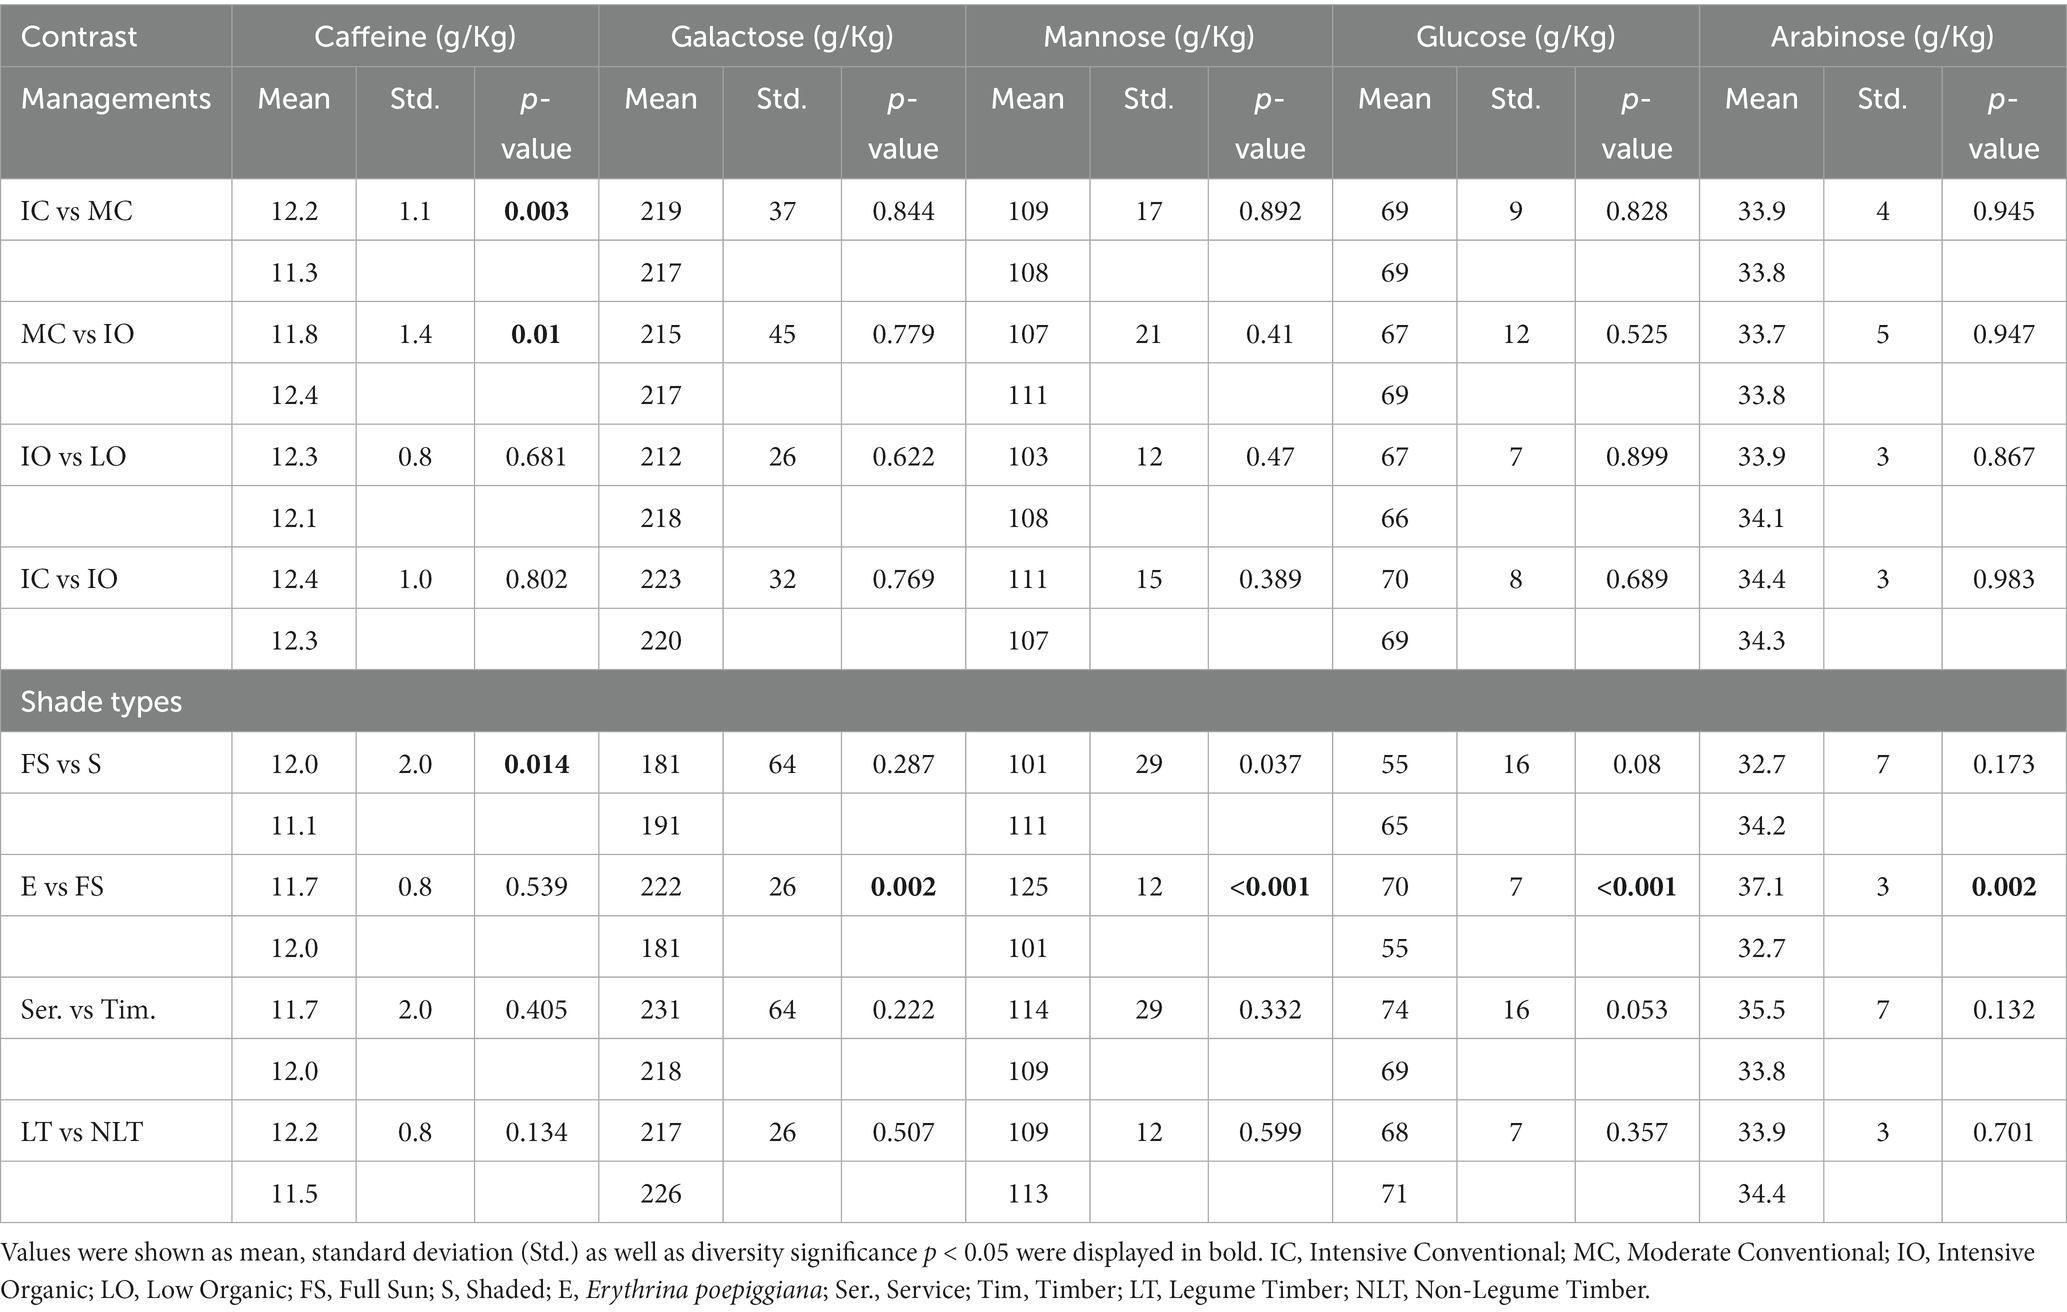
Table 4. Contrast outcomes for caffeine (g/Kg) and carbohydrates contents (g/Kg) based on green coffee bean dry weight.
In plants, the conversion of inorganic C into organic C is accomplished mainly by photosynthesis. Otherwise, plants can take the fungi-fixed and organic-derived C (32). Moreover, light intensity, water availability, CO2 concentration, and temperature affect photosynthesis (33). For every contrast group under the various management practices, shade types were kept constant. Therefore, temperature and light intensity might remain unchanged when various management practices were compared for every contrast group. The various management practices did not affect CO2 content because the atmospheric condition was identical. In addition, the Costa Rica site represented a wet coffee area with abundant water resources. Hence, carbohydrate contents were not significant (p > 0.05) among the various management practices.
No significant differences (p > 0.05) were observed with regard to carbohydrate content in the full sun compared with the shaded systems, or in the service compared with timber, as well as in non-legume compared with legume timber systems in this experiment, indicating that neither N2 fixation nor shaded cover or light intensity of the shade trees was a major element affecting carbohydrate content in the green coffee beans. However, the galactose, mannose, glucose, and arabinose contents were significantly higher (p < 0.05) under the Erythrina system when compared with the full sun system. This was related to the high organic matter, especially the organic C used directly by the coffee plant due to the extreme pruning of the Erythrina shade tree (the branches and leaves of Erythrina were maintained on the field after pruning) (34).
The caffeine quantity was significantly enhanced (p < 0.05) in the IC as well as IO management practices compared with the MC because of the increased fertilizer amounts, particularly nitrogen. Following the long-term management practice, the IO management practice showed a similar green coffee bean caffeine level compared with the IC management practice, which might greatly increase (p < 0.05) compared with the MC management practice. However, the caffeine level was not significantly different (p > 0.05) in the IO as well as the LO systems. While relative to the IO management practice, the LO management practice was integrated with Chloroleucon and Erythrina, two legume species, which supplement the N2 shortage because of the low input degree by N2 fixation (10). In contrast, the lower external inputs may be compensated by the high pruning intensity such as in Erythrina, due to the elimination of Erythrina shade tree-pruned branches and leaves (7, 34).
The caffeine quantity in the green coffee beans significantly increased (p < 0.05) in the full sun system relative to the shaded system, as the light improved the formation of the purine ring of caffeine (22). Nevertheless, the green coffee bean caffeine quantity did not show any significant differences (p > 0.05) between legume timber and non-legume timber systems, even though the legume trees could fix N2, which is the main component of caffeine. Furthermore, there were no significant differences (p > 0.05) in green coffee bean caffeine contents between the Erythrina and full sun systems, or between the timber and service systems, although shade cover affecting the light intensity between these shade systems was significantly different. As a result, the N2 fixation in the legume tree and the differences in shade cover between the Erythrina and full sun systems, or between the timber and service systems were not major elements to influence the caffeine quantity in the green coffee beans.
To improve the responses of agroforestry systems in relation to the physical and chemical characteristics of the coffee bean, the entry of adequate light must be controlled with combinations, densities, and adequate management practices of trees associated with coffee cultivation. The Erythrina service tree combined with timber or alone, can generate contributions from the annual pruning practice with the incorporation of biomass, in addition to N2 fixation. The inclusion of organic fertilizers in fertilization programs constitutes a strategy with potential.
In conclusion, compared with conventional management practices, the IO management practice improves the nutritional content of coffee beans, such as some minerals, lipids, and caffeine. Therefore, the IO management practice can be considered an excellent substitution for the MC management practice. Additionally, to some extent, the IO management practice may be a good option, when there is a cost limitation of the IC management practice. In terms of shade types, the Erythrina system promotes the performance of green coffee beans due to the replenishment of organic matter in the soil by extremely strong pruning. As a result, the Erythrina system can be used as the main shade tree.
The original contributions presented in the study are included in the article/Supplementary material, further inquiries can be directed to the corresponding author.
SX: methodology, data curation, formal analysis, investigation, writing–original draft, and writing–review and editing. YL and GC: data curation and writing–original draft. ZS: formal analysis, and writing–review and editing. FM: writing–original draft, and writing–review and editing. NY: supervision, and writing–review and editing. EM: methodology, project administration, and resources. IF: methodology, conceptualization, project administration, and supervision. All authors contributed to the article and approved the submitted version.
This work was supported by Guizhou Provincial Science and Technology Projects (QKHPTRC-CXTD [2022] 002, QKHZC [2022] ZD No. 015, and QKHJC-ZK [2021] YB 175); the BBSRC [BB/N021126/1]; Talent Introduction Program of Guiyang University (GYU-ZRD [2018]-022); the Discipline and Master’s Site Construction Project of Guiyang University by Guiyang City Financial Support Guiyang University [SY-2020]; and the Innovation and Entrepreneurship Project of Guizhou for College Students (S202110976077).
We thank the Industry Department of the Costa Rican Coffee Institute-ICAFE, who prepared the coffee samples that were sent for the study, and the PCP-AGROFORESTA Scientific Platform which provided technical and scientific support to the experiment during the study phase.
The authors declare that the research was conducted in the absence of any commercial or financial relationships that could be construed as a potential conflict of interest.
All claims expressed in this article are solely those of the authors and do not necessarily represent those of their affiliated organizations, or those of the publisher, the editors and the reviewers. Any product that may be evaluated in this article, or claim that may be made by its manufacturer, is not guaranteed or endorsed by the publisher.
The Supplementary material for this article can be found online at: https://www.frontiersin.org/articles/10.3389/fnut.2023.1198802/full#supplementary-material
1. DaMatta, FM, Ronchi, CP, Maestri, M, and Barros, RS. Ecophysiology of coffee growth and production. Braz J Plant Physiol. (2007) 19:485–12. doi: 10.1590/S1677-04202007000400014
2. Somporn, C, Kamtuo, A, Theerakulpisut, P, and Siriamornpun, S. Effect of shading on yield, sugar content, phenolic acids and antioxidant property of coffee beans (Coffea Arabica L. cv. Catimor) harvested from North-Eastern Thailand. J Sci Food Agr. (2012) 92:1956–63. doi: 10.1002/jsfa.5568
3. Worku, M, De Meulenaer, B, Duchateau, L, and Boeckx, P. Effect of altitude on biochemical composition and quality of green arabica coffee beans can be affected by shade and postharvest processing method. Food Res Int. (2018) 105:278–5. doi: 10.1016/j.foodres.2017.11.016
4. Cassamo, CT, Mangueze, AVJ, Leitão, AE, Pais, IP, Moreira, R, Campa, C, et al. Shade and altitude implications on the physical and chemical attributes of green coffee beans from Gorongosa Mountain, Mozambique. Agronom. (2022) 12:2540. doi: 10.3390/agronomy12102540
5. Haggar, J, Barrios, M, Bolaños, M, Merlo, M, Moraga, P, Munguia, R, et al. Coffee agroecosystem performance under full sun, shade, conventional and organic management regimes in Central America. Agrofor Syst. (2011) 82:285–1. doi: 10.1007/s10457-011-9392-5
6. Lynch, J, and Läuchli, A. Potassium transport in salt-stressed barley roots. Planta. (1984) 161:295–1. doi: 10.1007/BF00398718
7. Nygren, P, Fernandez, MP, Harmand, JM, and Leblanc, HA. Symbiotic dinitrogen fixation by trees: an underestimated resource in agroforestry systems? Nutr Cycl Agroecosys. (2012) 94:123–12. doi: 10.1007/s10705-012-9542-9
8. Beer, J, Muschler, R, Kass, D, and Somarriba, E. Shade management in coffee and cacao plantations. Agrofor Syst. (1998) 38:139–4. doi: 10.1023/A:1005956528316
9. Potts, J, Lynch, M, Wilkings, A, Huppe, G, Cunningham, M, and Voora, V. The state of sustainability initiatives review 2014: standards and the green economy. Int Inst Sustain Dev. (2014)
10. Bacon, C. Confronting the coffee crisis: can fair trade, organic, and specialty coffees reduce small-scale farmer vulnerability in northern Nicaragua? World Dev. (2005) 33:497–1. doi: 10.1016/j.worlddev.2004.10.002
11. Caporaso, N, Whitworth, MB, and Fisk, ID. Prediction of coffee aroma from single roasted coffee beans by hyperspectral imaging. Food Chem. (2022) 371:131159–9. doi: 10.1016/j.foodchem.2021.131159
12. Baggenstoss, J, Poisson, L, Luethi, R, Perren, R, and Escher, F. Influence of water quench cooling on degassing and aroma stability of roasted coffee. J Agric Food Chem. (2007) 55:6685–91. doi: 10.1021/jf070338d
13. Dutra, ER, Oliveira, LS, Franca, AS, Ferraz, VP, and Afonso, RJCF. A preliminary study on the feasibility of using the composition of coffee roasting exhaust gas for the determination of the degree of roast. J Food Eng. (2001) 47:241–6. doi: 10.1016/S0260-8774(00)00116-3
14. Franca, AS, Oliveira, LS, Mendonça, JC, and Silva, XA. Physical and chemical attributes of defective crude and roasted coffee beans. Food Chem. (2005) 90:89–94. doi: 10.1016/j.foodchem.2004.03.028
15. Chilimba, AD, Young, SD, Black, CR, Meacham, MC, Lammel, J, and Broadley, MR. Agronomic biofortification of maize with selenium (se) in Malawi. Field Crop Res. (2012) 125:118–8. doi: 10.1016/j.fcr.2011.08.014
16. Bligh, EG, and Dyer, WJ. A rapid method of total lipid extraction and purification. Can J Biochem Physiol. (1959) 37:911–7. doi: 10.1139/o59-099
17. Nantiyakul, N, Furse, S, Fisk, ID, Tucker, G, and Gray, DA. Isolation and characterization of oil bodies from Oryza sativa bran and studies of their physical properties. J Cereal Sci. (2013) 57:141–5. doi: 10.1016/j.jcs.2012.11.002
18. McCusker, RR, Goldberger, BA, and Cone, EJ. Caffeine content of specialty coffees. J Anal Toxicol. (2003) 27:520–2. doi: 10.1093/jat/27.7.520
19. Saeman, JF. Kinetics of wood saccharification-hydrolysis of cellulose and decomposition of sugars in dilute acid at high temperature. Ind Eng Chem. (1945) 37:43–52. doi: 10.1021/ie50421a009
20. Xu, S, Liu, Y, Ma, F, Yang, N, Virginio Filho, EDM, and Fisk, ID. Impact of agro-forestry systems on the aroma generation of coffee beans. Front Nutr. (2022) 9:9. doi: 10.3389/fnut.2022.968783
21. Cannell, MGR. Factors affecting arabica coffee bean size in Kenya. J Hort Sci. (1974) 49:65–76. doi: 10.1590/s1677-04202007000400014
22. Eggers, R, and Pietsch, A. Technology I: roasting In: C Ronald, editor. Coffee: Recent developments. New York: Wiley-Blackwell Press (2008). 90–107.
23. Gloess, AN, Vietri, A, Wieland, F, Smrke, S, Schönbächler, B, López, JAS, et al. Evidence of different flavour formation dynamics by roasting coffee from different origins: on-line analysis with PTR-ToF-MS. Int J Mass Spectrom. (2014) 365-366:324–7. doi: 10.1016/J.IJMS.2014.02.010
24. Martínez-Ballesta, MC, Dominguez-Perles, R, Moreno, DA, Muries, B, Alcaraz-López, C, Bastías, E, et al. Minerals in plant food: effect of agricultural practices and role in human health a review. Agron Sustain Dev. (2010) 30:295–9. doi: 10.1051/agro/2009022
25. Boateng, SA, Zickermann, J, and Kornahrens, M. Poultry manure effect on growth and yield of maize. WAJAE. (2006) 9. doi: 10.4314/wajae.v9i1.45682
26. Olsen, SR, and Watanabe, FS. Interaction of added gypsum in alkaline soils with uptake of iron, molybdenum, manganese, and zinc by sorghum. Soil Sci Soc Am J. (1979) 43:125–12. doi: 10.2136/sssaj1979.03615995004300010023x
27. Caruso, G, Villari, A, and Villari, G. Quality characteristics of Fragaria vesca L. fruits influenced by NFT solution EC and shading In: MA Nichols, editor. South Pacific soilless culture conference-SPSCC. Palmerston: International Society for Horticultural Science Press (2003). 167–75.
28. Starck, Z, Siwiec, A, and Chotuj, D. Distribution of calcium in tomato plants in response to heat stress and plant growth regulators. Plant Soil. (1994) 167:143–8. doi: 10.1007/BF01587609
29. Ohlrogge, J, and Browse, J. Lipid biosynthesis. Plant Cell. (1995) 7:957–12. doi: 10.2307/3870050
30. Castro-Tanzi, S, Dietsch, T, Urena, N, Vindas, L, and Chandler, M. Analysis of management and site factors to improve the sustainability of smallholder coffee production in Tarrazú. Costa Rica Agr Ecosyst Environ. (2012) 155:172–1. doi: 10.1016/j.agee.2012.04.013
31. Anderson, L, and Gibbs, M. The biosynthesis of caffeine in the coffee plant. J Biol Chem. (1962) 237:1941–4. doi: 10.1016/S0021-9258(19)73963-5
32. Stumpf, W, Conn, PM, and Preiss, J. The biochemistry of plants: carbohydrates. New York: Academic Press (2012).
33. Bradbury, AG, and Halliday, DJ. Chemical structures of green coffee bean polysaccharides. J Agric Food Chem. (1990) 38:389–2. doi: 10.1021/jf00092a010
34. Boreux, V, Vaast, P, Madappa, LP, Cheppudira, KG, Garcia, C, Ghazoul, J, et al. Agroforestry coffee production increased by native shade trees, irrigation, and liming. Agron Sustain Dev. (2016) 36:1–9. doi: 10.1007/s13593-016-0377-7
Keywords: agriculture, shade trees, organic management practice, coffee, physicochemical properties
Citation: Xu S, Liu Y, Sun Z, Chen G, Ma F, Yang N, de Melo Virginio Filho E and Fisk ID (2023) Effects of agro-forestry systems on the physical and chemical characteristics of green coffee beans. Front. Nutr. 10:1198802. doi: 10.3389/fnut.2023.1198802
Edited by:
Nurhan Uslu, Selçuk University, TürkiyeReviewed by:
Chao-Hui Feng, Kitami Institute of Technology, JapanCopyright © 2023 Xu, Liu, Sun, Chen, Ma, Yang, de Melo Virginio Filho and Fisk. This is an open-access article distributed under the terms of the Creative Commons Attribution License (CC BY). The use, distribution or reproduction in other forums is permitted, provided the original author(s) and the copyright owner(s) are credited and that the original publication in this journal is cited, in accordance with accepted academic practice. No use, distribution or reproduction is permitted which does not comply with these terms.
*Correspondence: Su Xu, eHM4NTE1QDEyNi5jb20=
Disclaimer: All claims expressed in this article are solely those of the authors and do not necessarily represent those of their affiliated organizations, or those of the publisher, the editors and the reviewers. Any product that may be evaluated in this article or claim that may be made by its manufacturer is not guaranteed or endorsed by the publisher.
Research integrity at Frontiers
Learn more about the work of our research integrity team to safeguard the quality of each article we publish.