 Dean Kaličanin
 Maja Cvek2
 Ana Barić
94% of researchers rate our articles as excellent or good
Learn more about the work of our research integrity team to safeguard the quality of each article we publish.
Find out more
ORIGINAL RESEARCH article
Front. Nutr., 05 May 2023
Sec. Nutrition and Metabolism
Volume 10 - 2023 | https://doi.org/10.3389/fnut.2023.1188612
This article is part of the Research TopicVitamin D: From Pathophysiology to Clinical ImpactView all 20 articles
Introduction: Vitamin D insufficiency is a global health problem affecting healthy and diseased individuals, including patients with Hashimoto’s thyroiditis (HT). Identifying dietary factors that may affect vitamin D levels and providing dietary guidelines accordingly can alleviate this problem. We therefore aimed to identify still unknown associations of dietary patterns, assessed through the Food Frequency Questionnaire (FFQ) with vitamin D blood levels.
Materials and methods: FFQ was collected from 459 patients from Croatian Biobank of Patients with Hashimoto’s thyroiditis (CROHT), while total 25(OH)D was measured from their stored serum samples. We performed linear regression analysis between vitamin D levels and weekly intake of 24 food groups in 459 patients with HT (ALL), and in two disease-severity groups (MILD and OVERT).
Results: The main results of our study are observations of: (1) an inverse association between vitamin D levels and coffee consumption (ALL: β = −0.433, p = 0.005; OVERT: β = −0.62, p = 0.008); (2) an inverse association between vitamin D levels and sweets consumption (ALL: β = −0.195, p = 0.034; OVERT: β = −0.431, p = 0.006); (3) positive association between vitamin D levels and vegetable consumption (ALL: β = 0.182, p = 0.019; OVERT, β = 0.311, p = 0.009). Importantly, effect sizes of all three associations were more prominent in HT patients with prolonged and more severe disease (OVERT).
Conclusion: Further research into the functional and causal relationships of the observed associations is important to provide guidance regarding coffee/sugar intake on vitamin D status. A well-balanced diet can help prevent vitamin D deficiency and improve the quality of life of patients with HT, especially those in later stages of disease characterized by greater metabolic imbalance.
Hashimoto’s thyroiditis (HT) is considered the most common thyroid disorder and one of the most frequent autoimmune disorders in general (1). It has constant rise in incidence and it mostly affects female population, especially women between the ages of 30 and 60 (2, 3). The main characteristic of HT is damage of thyroid tissue resulting from lymphocytic infiltration that usually leads to hypothyroidism (4). For that reason, HT is the major cause of hypothyroidism in developed areas of the world (2). Another important characteristics of HT is the presence of thyroid antibodies against thyroid peroxidase (TPOAb) and/or thyroglobulin (TgAb), which are key markers for diagnosis of HT, along with a characteristic thyroid ultrasound (5).
Genetic, environmental and existential factors play a role in the etiology of HT (6). Environmental factors trigger the disease onset and high iodine intake is considered the main factor in the development of HT, while several other proposed risk factors include viral and bacterial infections, intestinal microbiota, low selenium, iron deficiency, various toxins, and drugs (6–9). In addition, dietary factors have also been suggested to act as environmental modifiers of disease (10–16). In the last decade, vitamin D insufficiency/deficiency has been associated with various endocrine and autoimmune diseases (diabetes, systemic lupus erythematosus, multiple sclerosis, rheumatoid arthritis, autoimmune thyroid disorders (AITD), adrenal diseases, cardiovascular diseases), cancers, infections, inflammatory responses and depression (17). Our research group has already analyzed associations of dietary habits with HT (10) and vitamin D levels with HT (18). In this paper, we focus on the analysis of dietary patterns associated to vitamin D levels in patients with HT.
Vitamin D is a steroid prohormone with confirmed role in calcium and phosphorus homeostasis and regulation of bone mineral metabolism. Biologically active form of vitamin D, calcitriol (1,25(OH)2D) exerts its role by binding to the nuclear vitamin D receptor (VDR) (19) which then regulates the expression of more than 200 genes (3–5% of the human genome) (20). The main circulating form of vitamin D, calcidiol 25(OH)D, has been established as an main indicator of vitamin D sufficiency in the body (21). Vitamin D sufficiency levels in Croatia are the same as those recommended by The American Endocrinology Society: a sufficiency stands for 25(OH)D levels ≥30 ng/mL (75 nmol/L), insufficiency is defined for levels between 21 AND 29 ng/mL (50–75 nmol/L) whereas deficiency is considered when 25(OH)D levels ≤20 ng/mL (50 nmol/L). Although, some other guidelines propose lower vitamin D sufficiency threshold of 20 ng/mL (22), we follow guidelines that are valid in our population.
Humans get vitamin D from three different sources: sun exposure, dietary intake and supplementation. It is estimated that about 80% of the total vitamin D is in the form of vitamin D3 which is mainly produced in skin from 7-dehydrocholecalciferol, under exposure to sunlight. Smaller content comes from food of animal origin such as fish (wild fresh salmon, sardines, cod liver oil), egg yolk, fortified milk, cheese, and meat (beef, pork) (23–25). Milk is fortified with vitamin D in the United States and Canada, however, majority of European countries do not fortify milk with vitamin D. Vitamin D2 is not synthesized in the body, but can be taken in with food of plant origin (mushrooms, yeast) (24). The production of vitamin D is not stable, so the produced amount depends on: sex, age, body mass index (BMI), skin pigmentation, latitudes, season, number of sunny days, weather, sun exposure, use of sunscreen, time spent indoor, sedentary lifestyle, cultural and religious habits and customs, education, dietary behavior, (in)availability of food rich in vitamin D (26–28).
Many studies observed positive effects of intake of fortified food or food rich in vitamin D (eggs and fatty fish) on blood vitamin D levels (23, 29–32). Adherence to the Mediterranean diet, characterized by high consumption of polyphenols, fibers and monounsaturated fatty acids (MUFA) (33), is also associated with elevated vitamin D levels (34).
Our study aims to comprehensively analyze associations of dietary habits, assessed through the food frequency questionnaire (FFQ), and vitamin D levels in a group of patients with HT from the Croatian Biobank of HT patients (CROHT biobank) (35, 36). To consider the influence of HT-disease severity on relationship between food intake and vitamin D levels, we also performed analyses in two subgroups of HT patients, those that are in the early stages of HT (MILD) and those in progressed HT (OVERT). To our knowledge, this is the first study that analyzed associations of dietary factors/patterns and vitamin D levels in patients with the most common autoimmune thyroid disorder.
HT patients were derived from the recently established CROHT biobank (36). The CROHT biobank contains stored biological samples (DNA, serum and plasma), data of more than 200 phenotypes and various clinical measures for 500 HT patients. Patient recruitment was carried out in the Outpatient clinic for thyroid disorders in the Clinical department of nuclear medicine at the University Hospital of Split from 2013 to 2017 (Figure 1). Diagnosis of HT was determined by the specialists in nuclear medicine, following European Thyroid Association (ETA) recommendations and guidelines for the Management of Subclinical Hypothyroidism (37). In more detail, HT was diagnosed using data obtained by clinical examination, thyroid ultrasound (echographic pattern of diffuse thyroid disease) and assessment of thyroid-related biochemical parameters (increased thyroid-stimulating hormone (TSH) and/or decreased thyroid hormones: triiodothyronine (T3), thyroxine (T4), or free thyroxine (fT4) and/or increased thyroid autoantibodies (TPOAb and TgAb)). Reference ranges for our population are: TSH (0.3–3.6 mIU/L), T3 (1.3–3.6 nmol/L), T4 (57.3–161 nmol/L), fT4 (10.3–22.8 pmol/l), TPOAb (1–16 IU/mL), TgAb (5–100 IU/mL). Plasma levels of TSH, T3, T4, fT4, TgAb, and TPOAb were measured by immunoassay using the fully automated “Liaison” Biomedica Chemiluminescence Analyzer (DiaSorin, Saluggia, Italy).
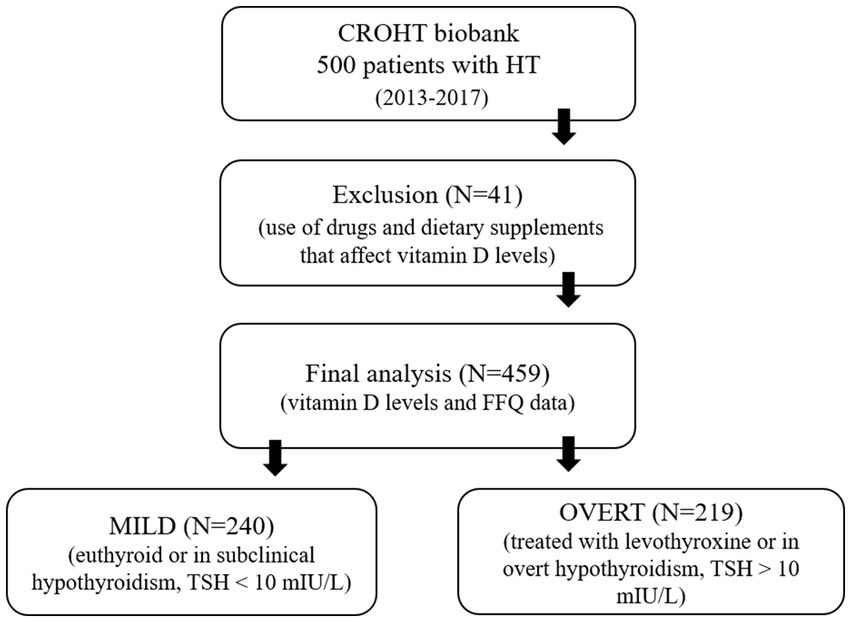
Figure 1. Recruitment of patients with Hashimoto’s thyroiditis (HT) in the study.
Total 25(OH)D (vitamin D in the text) was measured from the stored serum samples in 459 HT patients (92.37% of females), using LIAISON 25(OH) Vitamin D Total chemiluminescence immunoassay (DiaSorin, Saluggia, Italy). Recruitment of HT patients took place uniformly throughout all four seasons of the year. CROHT biobank was thoroughly searched, for each HT patient, for the use of drugs and dietary supplements that affect vitamin D levels, such as corticosteroids, anticonvulsants, vitamin D supplements or daily use of calcium supplements. HT patients (N = 41) using any of these medications/supplementations were excluded from this study.
Prior to recruitment to CROHT biobank all HT patients: (i) were introduced to general aims of scientific projects performed under CROHT biobank; (ii) gave consent for usage of their samples for future scientific research and (iii) signed an Agreement for participation. Ethics Committee from the University of Split School of Medicine (Classification no. 003–08/14–03/0001 and Registry no. 2181–198–03-04-14-0028; Classification no. 003–08/19–03/0003 and Reg. no. 2181–198–03-04-19-0019) and the Ethics Committee from the University Hospital of Split (Classification no. 530–02/13–01/11; Registry no. 2181–147-01/06/J.B.-14–2; Classification no. 500–03/18–01/80 and Reg. no. 2181–147-01/06/M.S.-18–2) approved this research and declared that it was in accordance with the provisions of the Code of Ethics and the Helsinki Declaration.
The dietary habits of patients with HT were collected through FFQ developed by experienced researchers and used in a previous study (10). The FFQ assessed the frequency of consumption of 51 food products, using categories: every day/always (converted to 7), 2–3 times a week (converted to 2.5), once a week/sometimes (converted to 1), once a month (converted to 0.25), rarely (converted to 0.125) and never (converted to 0). Plant oil, olive oil and animal fat were assessed using additional question with three consumption frequencies: always, sometimes, and never. We calculated weekly consumption of 54 food items and grouped them into 24 food categories.
Continuous variables were presented as mean and standard deviation (SD) or median and first- third quartile (Q1–Q3). Differences between tested groups were assessed with Mann Whitney U-test and t-test for independent samples. Categorical variables were presented as whole numbers and percentages, while differences were assessed with the chi-squared test. The association between vitamin D levels and weekly intake of 24 food groups was examined using linear regression model, where vitamin D level was the dependent variable and 24 food groups were independent variables. We performed linear regression analysis in all 459 patients with HT (ALL), and in the two subgroups depending on HT severity at the time of recruitment (MILD and OVERT). Patients with HT who were euthyroid (TSH within reference ranges) or in subclinical hypothyroidism (TSH within the range of 3.6–10 mIU/L) were assigned to the MILD group. Patients who were in overt hypothyroidism (TSH > 10 mIU/L) or were treated with levothyroxine (LT4) therapy were assigned to the OVERT group.
We included age, sex, score of physical activity, body mass index (BMI), smoking status and seasonality of blood sampling as covariates in each model. Additionally, we included LT4 therapy status as a covariate when performing analyses in ALL and OVERT groups. Kolmogorov–Smirnov test was used for testing normality of residuals distribution while Levene’s test was used for testing homogeneity of variance. Statistical analyses were performed using SPSS statistical software (SPSS Inc., Chicago, IL, United States).
The main clinical and sociodemographic characteristic of ALL 459 patients with HT and two subgroups of patients with HT according to disease severity (240 MILD and 219 OVERT) are presented in Table 1. We observed high proportions of vitamin D deficiency and insufficiency in our cohort. More precisely, vitamin D deficiency was observed in 51.84% of ALL, 47.92% of MILD and 56.16% of OVERT HT patients. Strikingly, very small proportion of participants had sufficient vitamin D levels: 10.63% in ALL, 11.66% in MILD and 9.59% in OVERT. Regarding other clinical information, the two subgroups of patients have comparable levels of TSH and thyroid hormones (Table 1), however, the thyroid gland of patients in the early stage of the disease (MILD) is still able to produce sufficient amounts of hormones, whereas the thyroid gland of patients from the OVERT group is no longer functioning adequately and euthyroidism is mostly restored due to synthetic hormone intake (LT4 therapy). Other clinical features indicate that patients from the OVERT group are in more advanced and severe stage of HT compared to patients from the MILD group as they have higher median values for: BMI, anti-thyroid antibodies and the number of hypothyroidism symptoms. It is very useful to have two groups of patients that reflect the severity of HT as it enables us to investigate how/if the clinical characteristic in question changes with disease exacerbation.
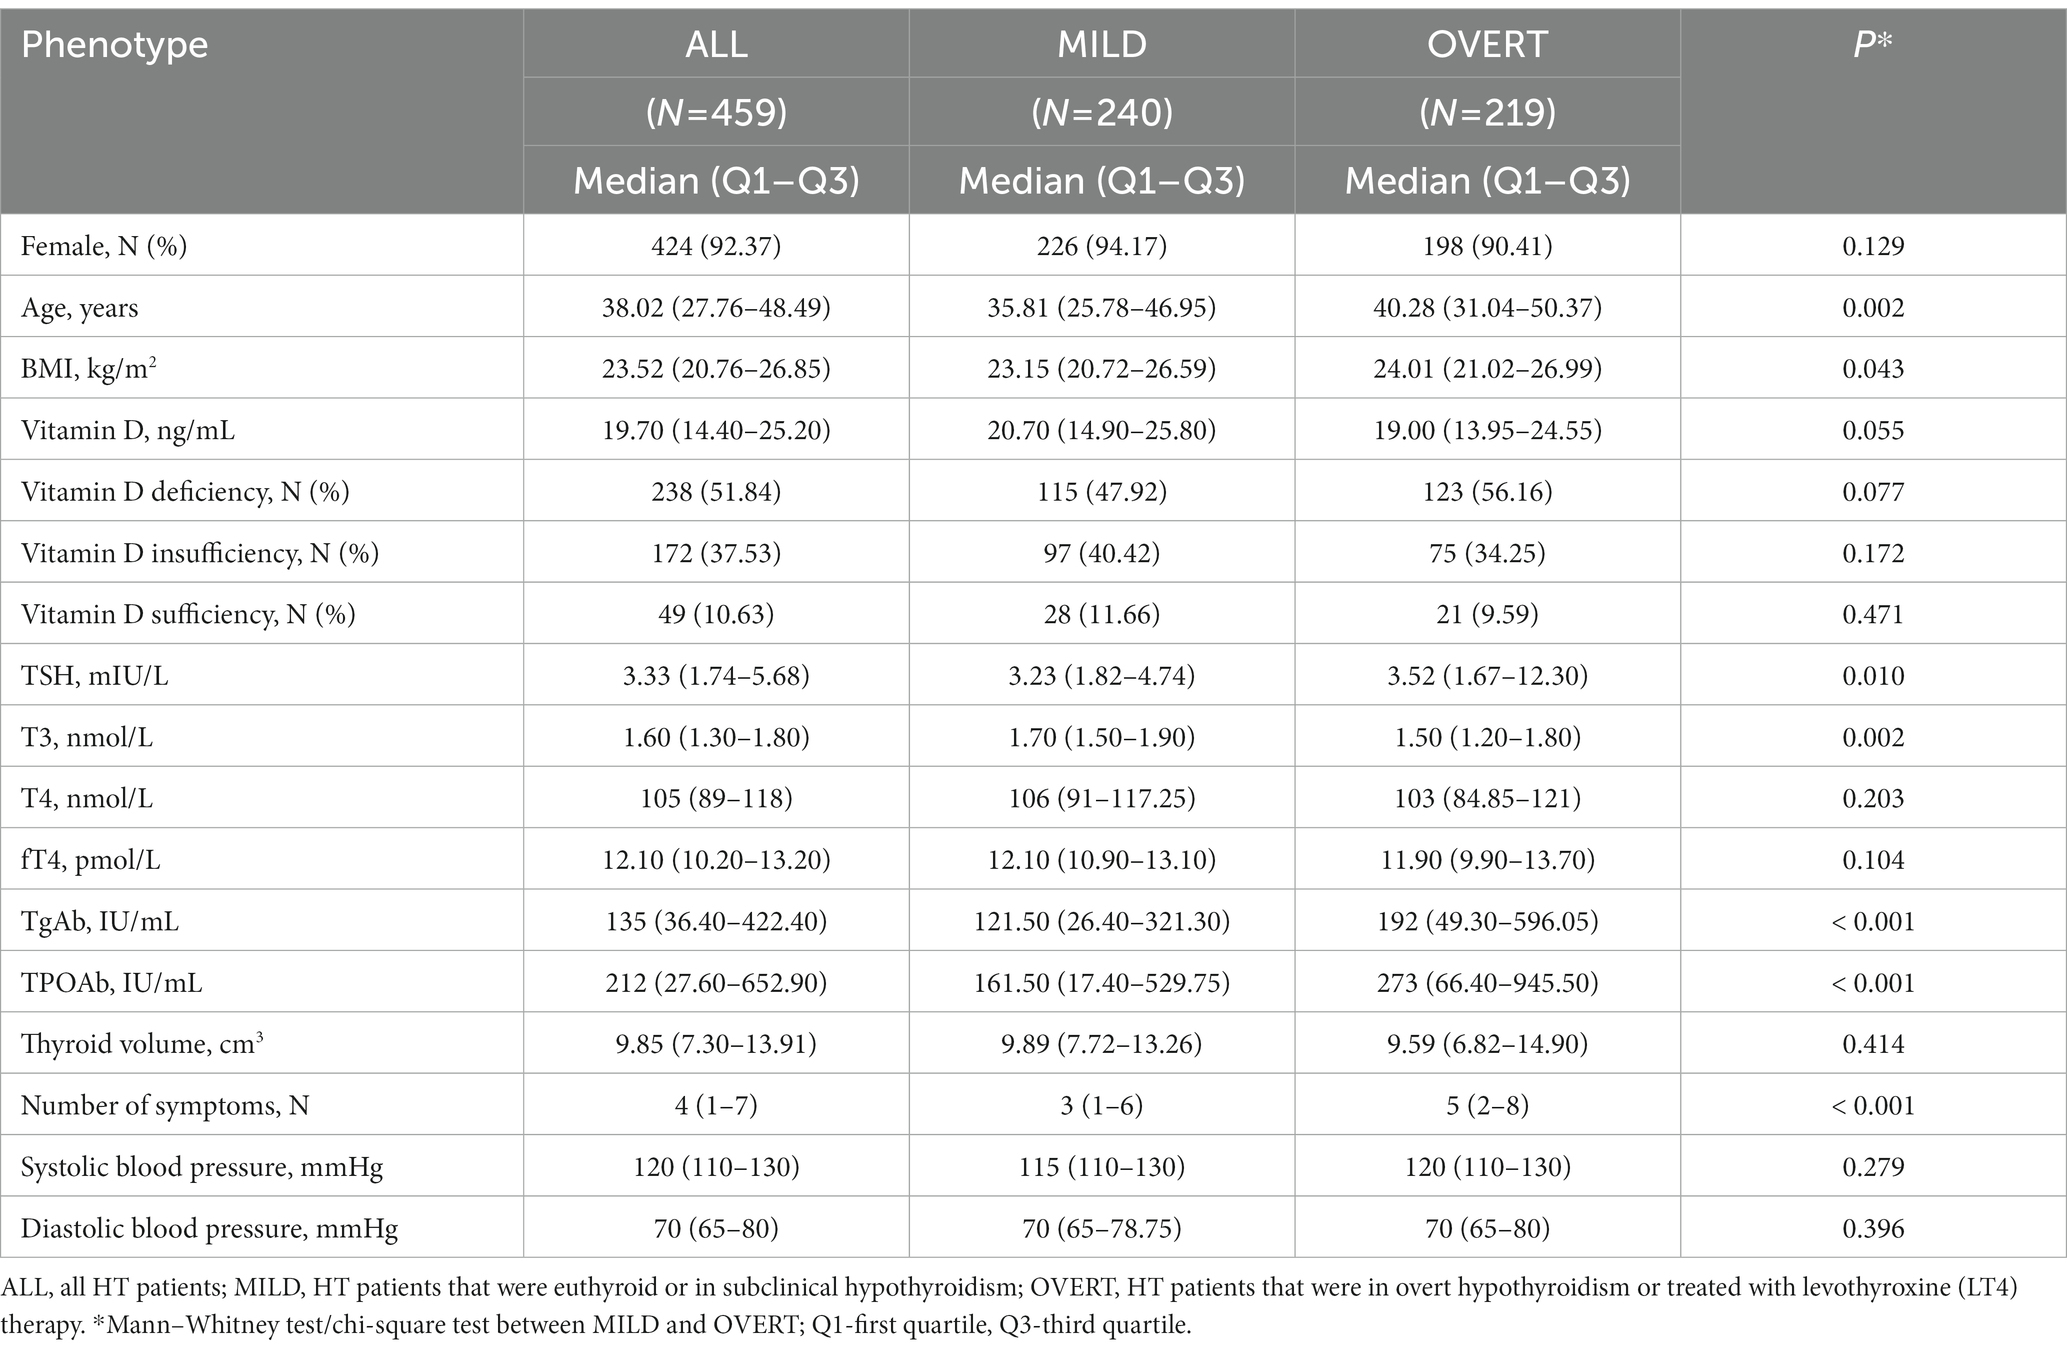
Table 1. Clinical characteristics of HT patients (ALL) and HT patients divided in two disease-severity groups (MILD and OVERT).
Frequency of weekly consumption of 24 food groups in ALL, MILD, and OVERT HT patients is shown in Table 2. The most frequently consumed food groups are milk and milk products followed by vegetables (almost 10 times per week), whereas the least frequently consumed food include oily fish, white fish and seafood (less then once per week).
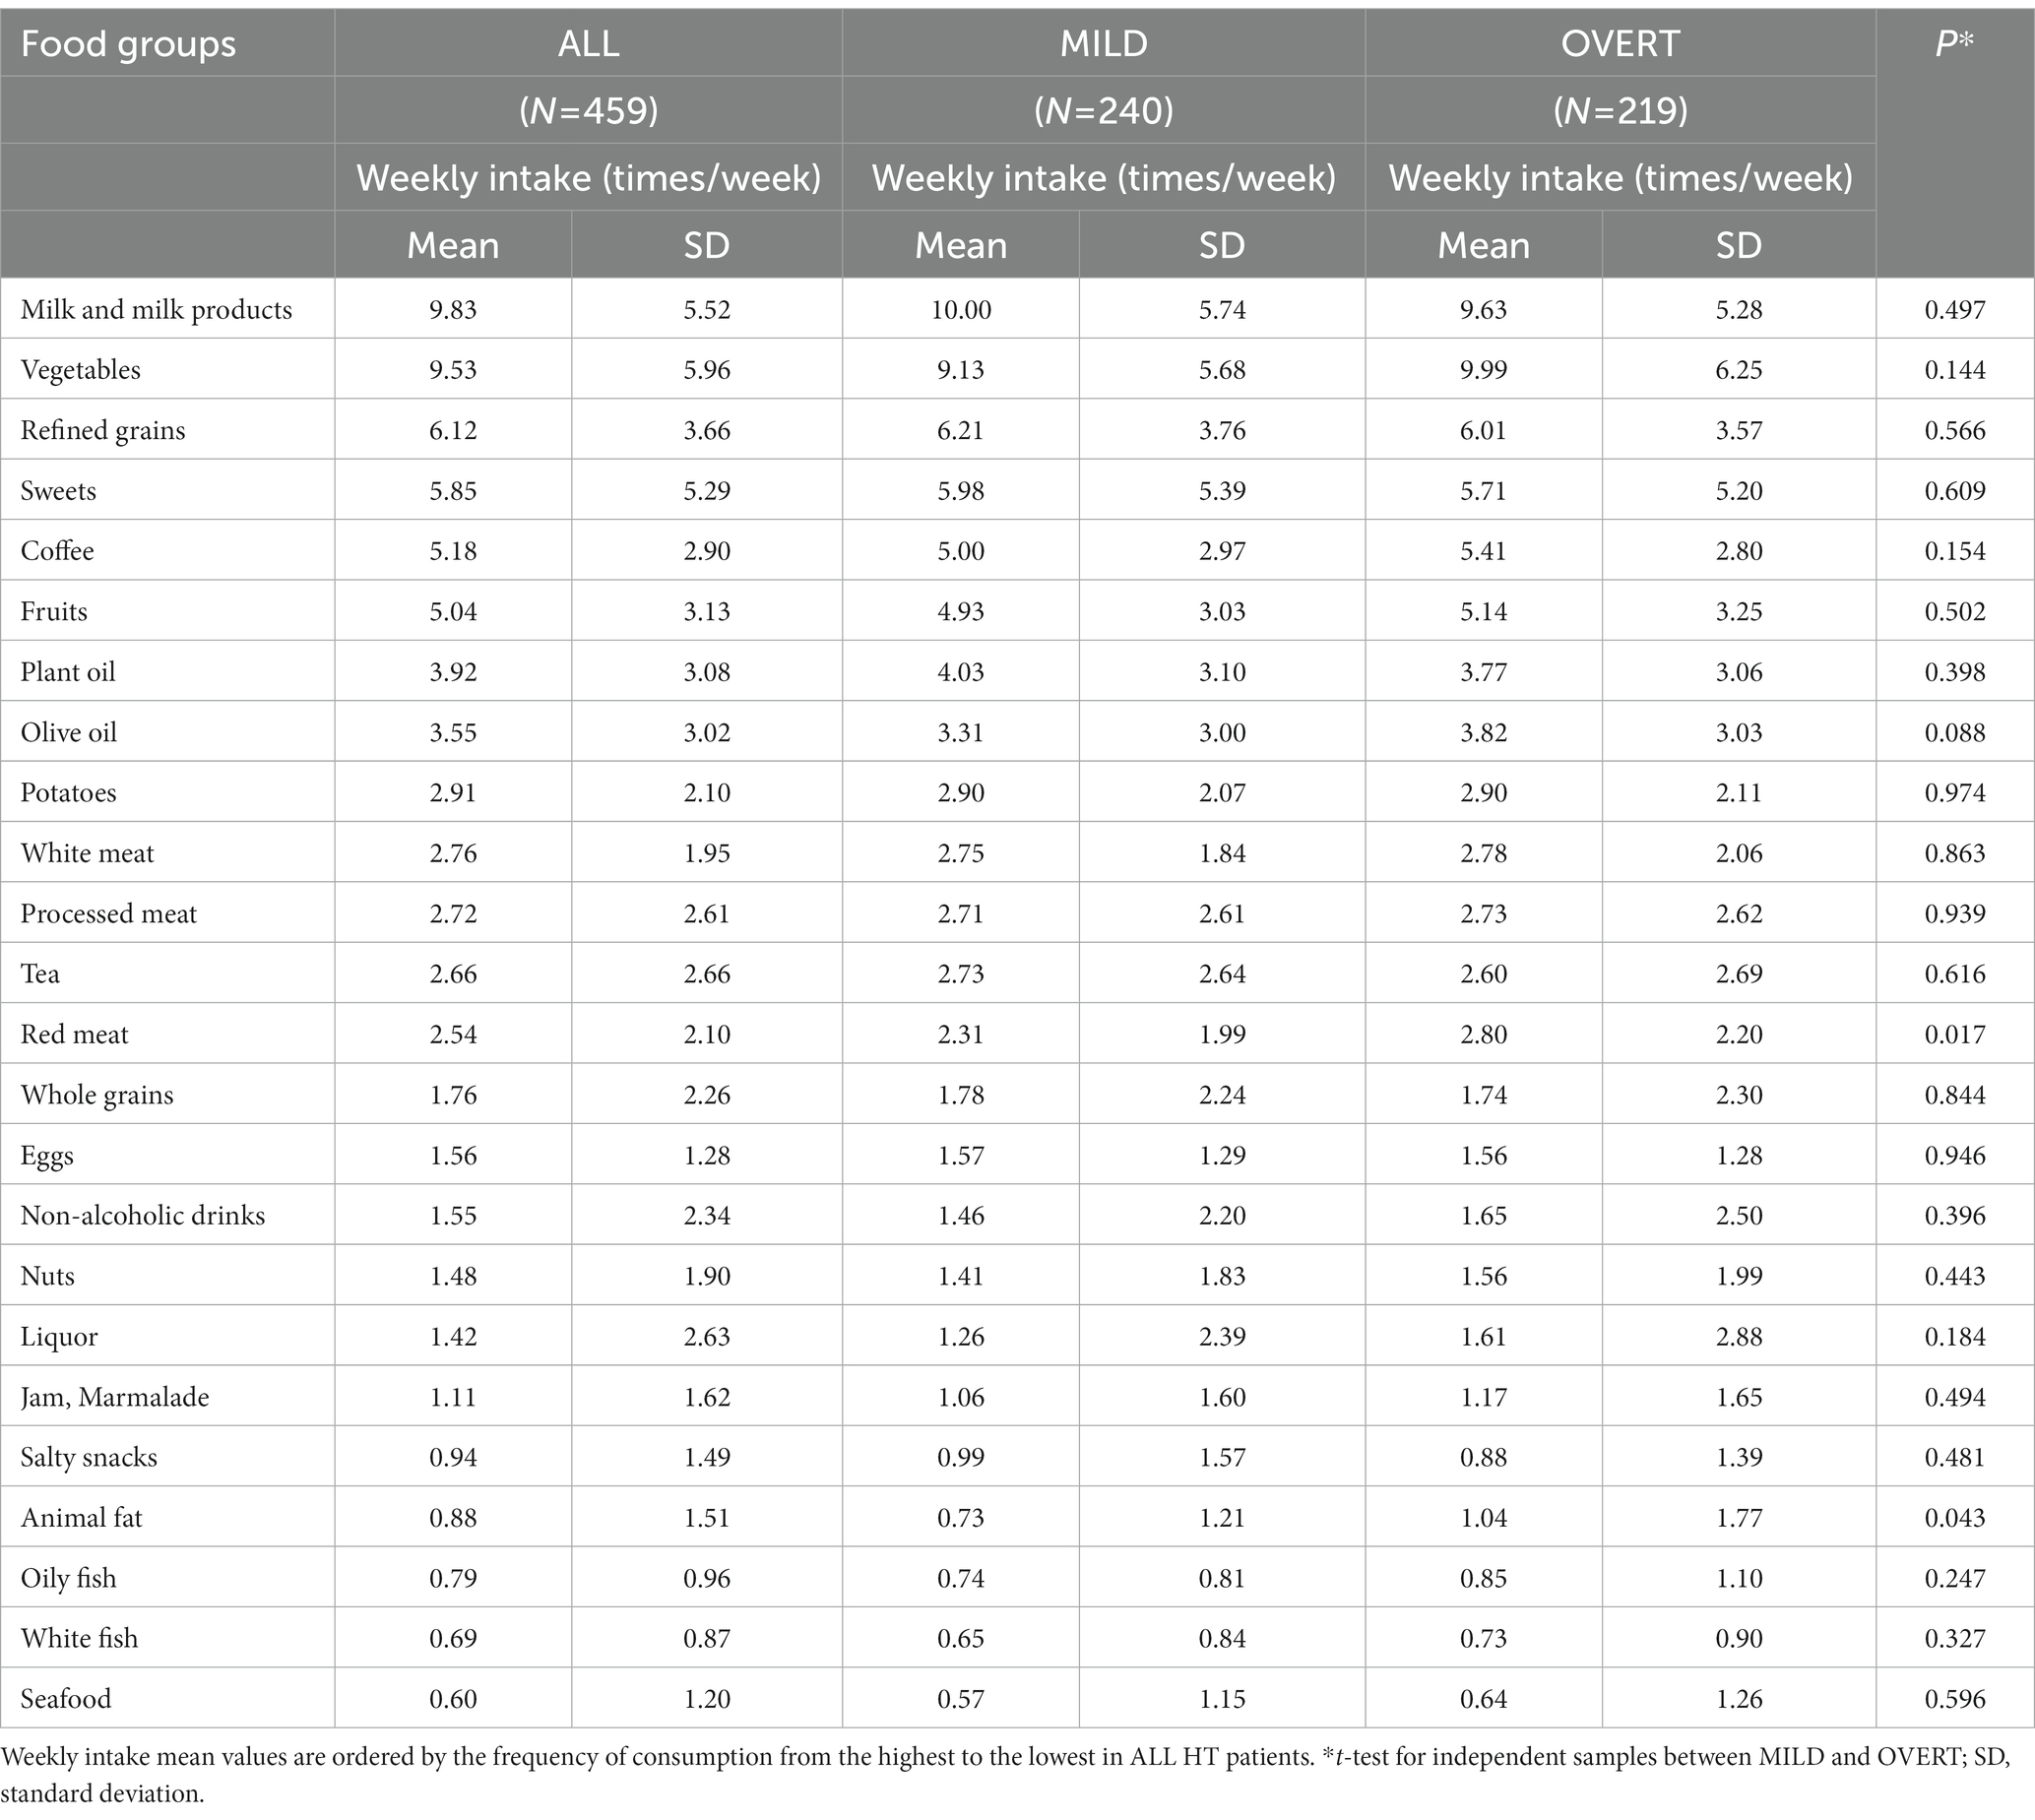
Table 2. Frequency of weekly consumption of 24 food groups in ALL, MILD, and OVERT patients with HT.
We identified significant associations between vitamin D levels and the intake of three food groups in ALL and OVERT HT patients: (1) an inverse association between coffee consumption and vitamin D levels (ALL: β = −0.433, p = 0.005; OVERT: β = −0.62, p = 0.008); (2) an inverse association between sweets consumption and vitamin D levels (ALL: β = −0.195, p = 0.034; OVERT: β = −0.431, p = 0.006); (3) positive association between vegetable consumption and vitamin D levels (ALL: β = 0.182, p = 0.019; OVERT: β = 0.311, p = 0.009) (Table 3). We also identified three marginal positive associations with vitamin D: plant oil (ALL: β = 0.265, p = 0.060) milk and milk products (ALL: β = 0.145, p = 0.081) and non-alcoholic drinks (ALL: β = 0.333, p = 0.091; MILD: β = 0.529, p = 0.088).
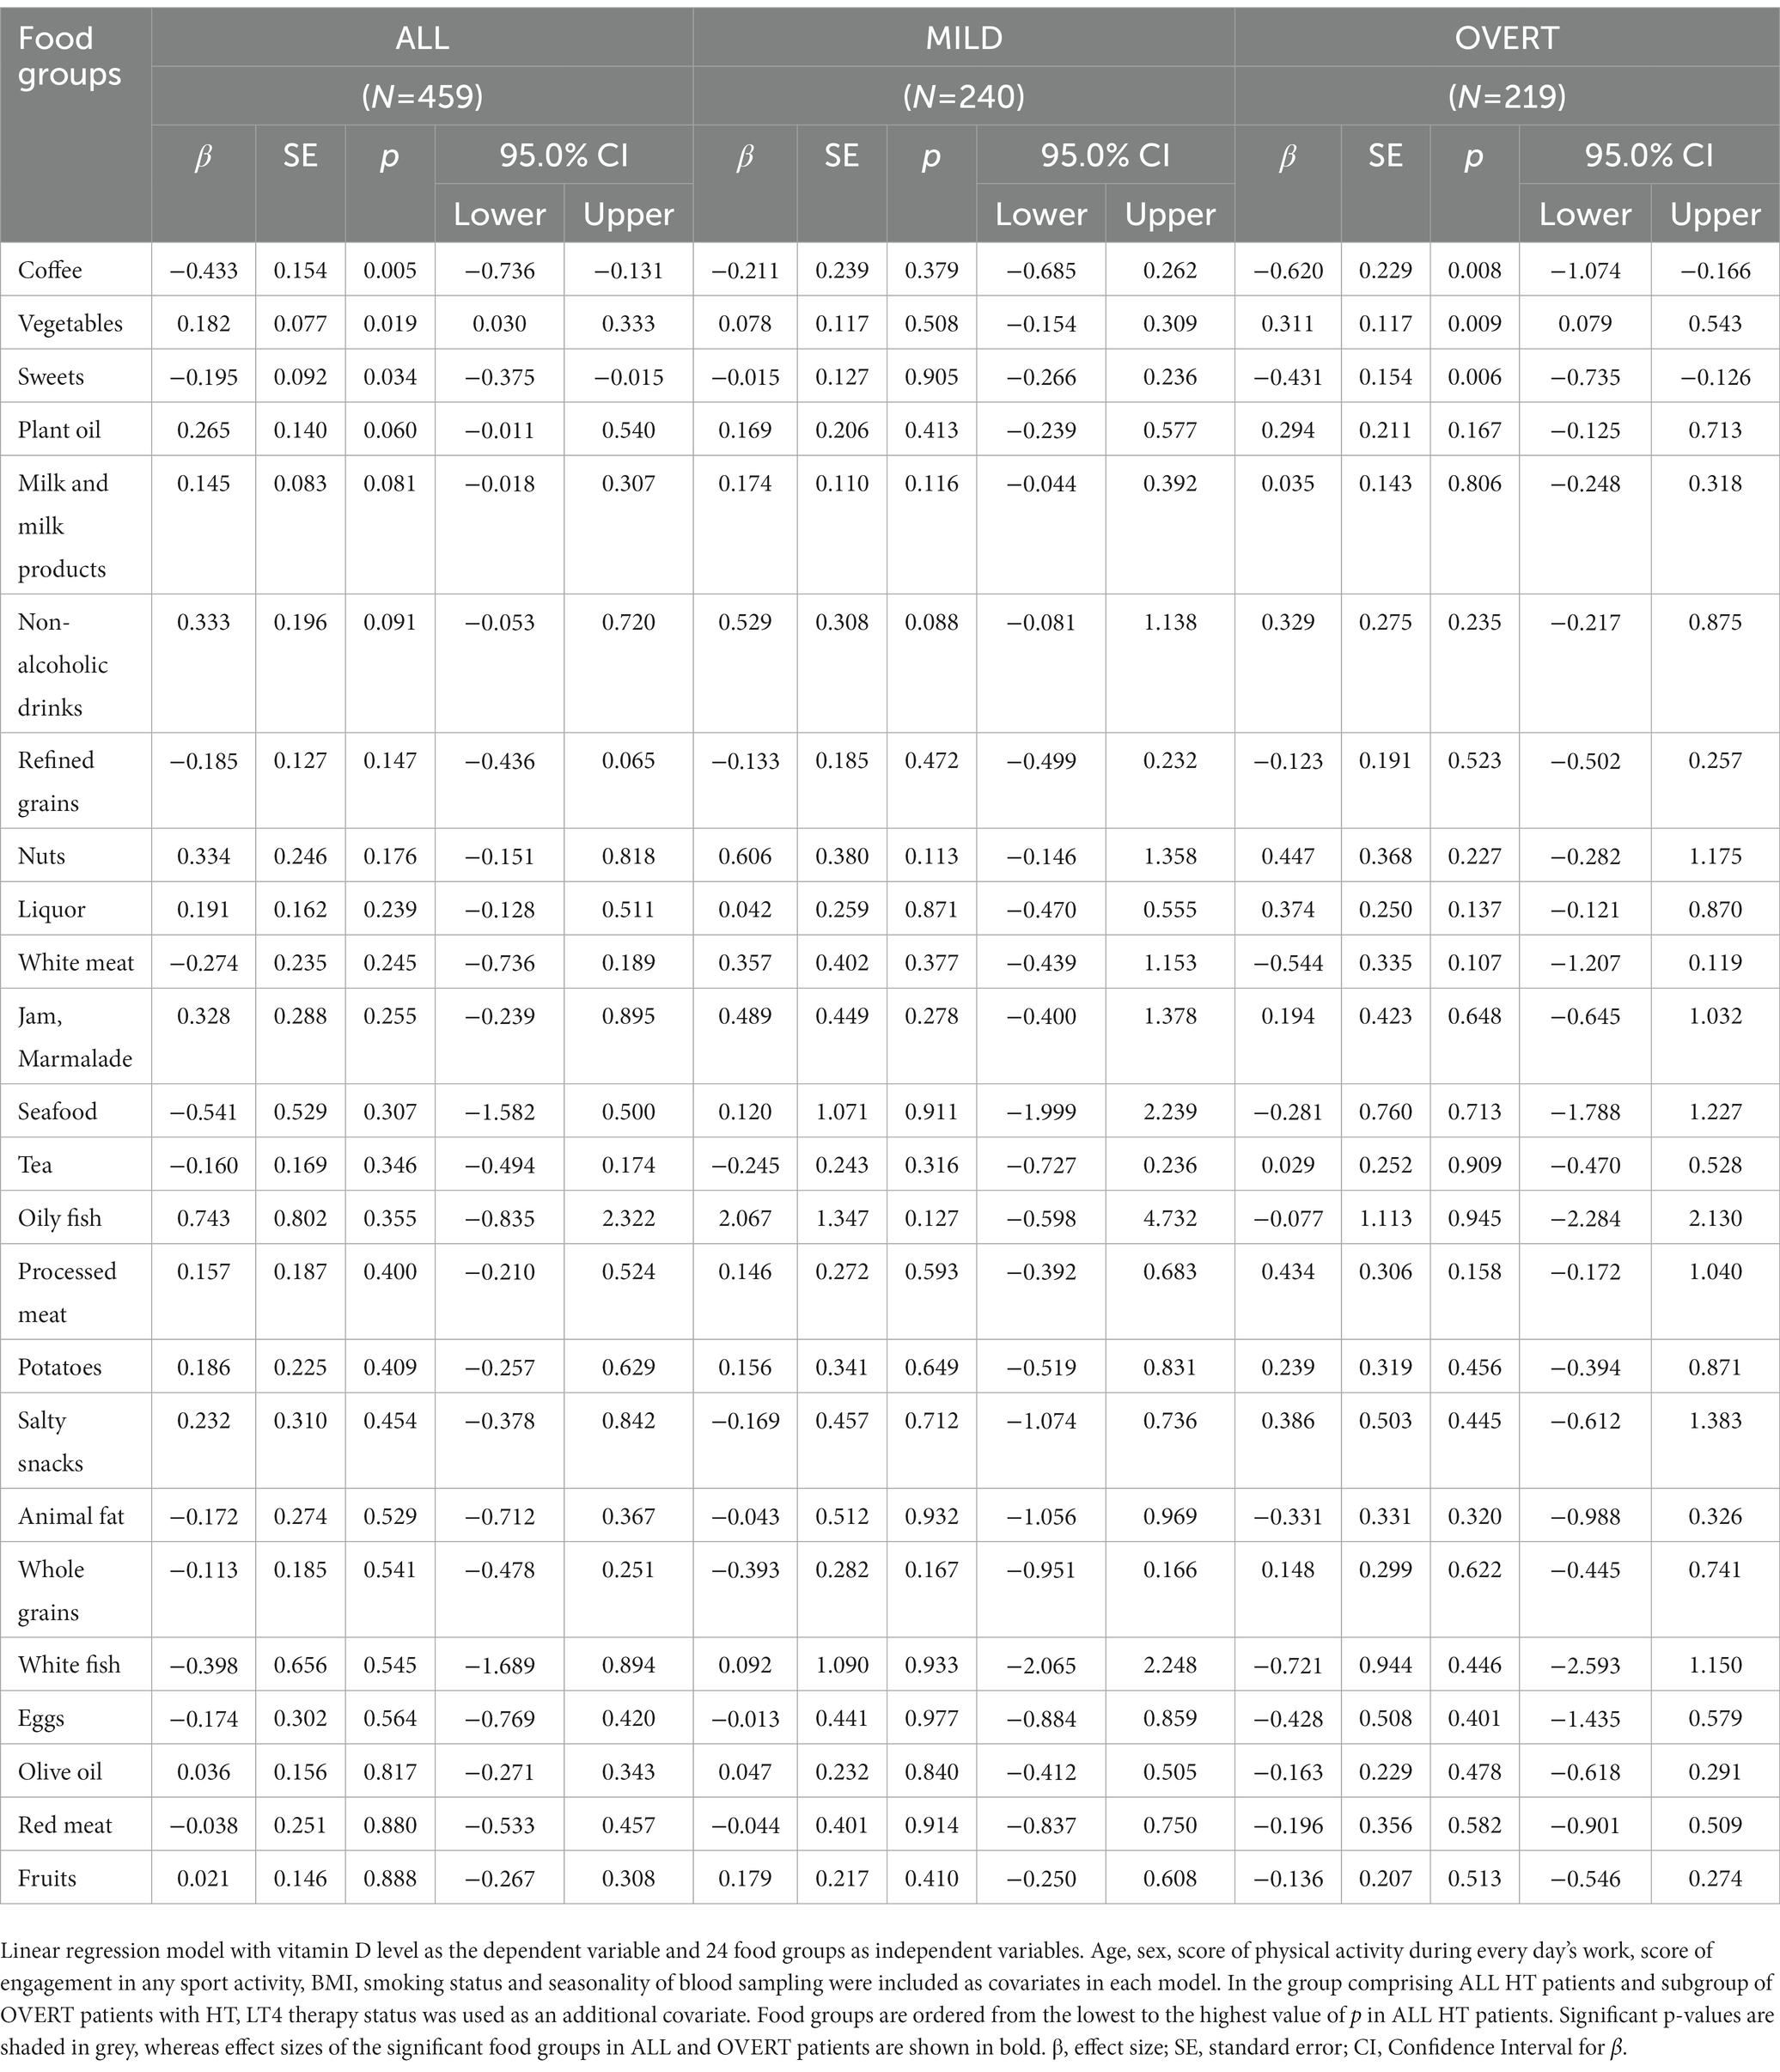
Table 3. Association analysis results between vitamin D levels and consumption of 24 food groups in ALL, MILD, and OVERT patients with HT.
In this observational study, we analyzed the relationship between dietary patterns and vitamin D levels in patients with HT, the most common autoimmune disease today. The main findings of our study are observations of negative association between vitamin D levels and coffee and sweets consumption and positive association between vitamin D levels and vegetable consumption. Another important observation from our study is that effect sizes of all three observed associations were more prominent in HT patients with prolonged and more severe disease (OVERT).
Autoimmune diseases are often associated with reduced vitamin D levels (17). This is also true for our HT patients, since we observed low median vitamin D levels and high percentage of vitamin D deficiency, especially in the OVERT subgroup of HT patients (Table 1). Participants from our cohort live in the region of Split (Croatia) with the Mediterranean climate with more than 2,600 h of sunshine per year (equivalent to 108 days). Therefore, it is not easy to explain high proportion of vitamin insufficiency/deficiency in our participants since they live in a region with many sunny days. Although, we do not have information on daily sunlight exposure or outdoor activities of our participants, it appears that the lifestyle of our subjects is characterized by an increased indoor activities or office work. To overcome the problem of vitamin D deficiency, it is necessary to define the factors that affect vitamin D levels, especially those that are easily modifiable, such as those from the diet, which is the main focus of this paper.
We therefore aimed to test if there are, yet unknown, specific dietary patterns or types of food that are associated with decreased/increased vitamin D levels in ALL HT patients, and in subgroups of HT patients depending on disease severity (MILD and OVERT). We adjusted our analyses for all relevant “vitamin D modifying factors” (age, sex, BMI, smoking, physical activity and seasonality of blood withdraw) to decrease the impact of these factors on patient’s vitamin D levels and to minimize the heterogeneity between individuals. The main results of our study are observations of two inverse associations between vitamin D levels and consumptions of coffee and sweets (ALL and OVERT). We additionally detected one positive association between vitamin D levels and consumption of vegetables (ALL and OVERT) (Table 3). Importantly, we observe that effect sizes of all three associations are larger in HT patients with prolonged and more severe disease (OVERT) than in ALL patients (Table 3). Beside the marked thyroid dysfunction and a high rate of vitamin D deficiency, OVERT group of patients presents many distinct clinical features, especially when compared to patients in the beginning of disease (MILD). These include older age, higher BMI, higher thyroid antibodies and higher number of hypothyroidism symptoms (Table 1). It is well known that thyroid hormones affect basal metabolism and that patients with HT have many metabolic parameters disturbed, possibly including the vitamin D metabolic pathways (38, 39). Additionally, our group of patients with HT mainly consists of women (90.41% in OVERT) most of whom have vitamin D deficiency (Table 1). Therefore, beside appropriate therapy, adjusted diet and careful micronutrient intake can improve vitamin D levels of HT patients. In the next paragraphs we discuss our findings.
There are more than 1,000 different components in coffee. The best known are bioactive phenolic compounds such as caffeine, chlorogenic acids, cafestol, and kahweol, however, coffee also comprises various carbohydrates, lipids, nitrogenous components, vitamins, minerals, and alkaloids (40, 41). We observed relatively high frequency of coffee consumption in our cohort of HT patients, with an average of 5.4 times per week in ALL HT patients (Table 2). Many studies evaluated the impact of coffee on health outcomes. The largest study so far, an umbrella review of meta-analysis of coffee consumption and multiple health outcomes, concluded that coffee consumption is generally associated with beneficial effects on health, mirrored as reduction in all-cause mortality, cardiovascular mortality and total cancer (40). However, several harmful effects of coffee were also observed, namely, association with the risk of bone fractures in women (40). This last association links coffee intake with the bone metabolism, which is highly dependent on vitamin D levels.
Regarding association of coffee intake and vitamin D levels, two large-scale observational studies reported negative association between vitamin D levels and coffee intake (42, 43). Another study of 741 premenopausal women, which is more similar to ours with respect to the age and the sex of participants, found statistically significant association between higher intake of caffeine containing cola drinks, assessed through FFQ, and decreased vitamin D levels (44). Several other studies reported inconsistent findings regarding vitamin D levels and caffeine intake (45–47). Although there are contradictions in reports of coffee consumption and vitamin D levels, the results of our study are in line with the two biggest studies performed in healthy adult individuals (42, 43).
Our observation suggests that association between higher coffee consumption and decreased vitamin D levels may not only be the feature of general population but also of HT patients. It is therefore, important to understand the influence of coffee consumption on vitamin D levels, and subsequently on other linked metabolic parameters, such as those in bone metabolism. The data on this topic is very scarce and the causal relationship has yet to be investigated and explained. This leads us to an important message from our cross-sectional analysis, which is that observed inverse association between coffee consumption and vitamin D levels does not indicate a causal relationship between the two. For example, there may be another confounding phenotype that is associated with both phenotypes of interest (coffee and vitamin D), which is actually driving causality. Finally, it may be possible that individuals that regularly drink coffee also spend more time indoors than non-regular drinkers which may lead to residual confounding. However, given the plausible literature evidence of this inverse association, further research is highly required.
We also observed an inverse association between sweets intake and vitamin D levels (Table 3) in ALL and, especially, OVERT group. This food group is formed by combining the intake of several types of sweets with high sugar content (cakes, chocolate, cookies, bonbons). Our HT patients often consume sweets, almost six times per week, which puts this food group in the fourth place of the most consumed food groups (Table 2).
Several studies have also previously observed a negative association between consumption of sweets (or sugar) and vitamin D levels. For example, an inverse association between sugar intake, assessed by FFQ, and vitamin D levels was observed in 32 participants from 13 to 25 years of age (48). Similarly, a study of 129 healthy Argentinian boys observed an inverse association between vitamin D levels and plasma glucose concentration (49). Finally, consumption of sugar-sweetened non-alcoholic beverages showed negative association with vitamin D levels (44). Taken altogether, observational studies consistently point to an inverse relationship between high sugar intake and low vitamin D levels. However, there are no clear functional explanations for observed associations. Of relevance, vitamin D is involved in glucose homeostasis/metabolism (50–52), regulation of insulin secretion and insulin resistance (50, 52, 53). There are also number of studies that report an inverse association between vitamin D and metabolic parameters such as fasting glucose or insulin resistance (54–57).
Another thing to bear in mind is that there is a link between coffee (our main result) and sugar consumption as sugar is often added to coffee to soften its bitterness. Therefore, sugar added to coffee may be an additional factor, to the regular coffee ingredients, that may negatively affect vitamin D levels.
We observed significant positive association between vegetable consumption and vitamin D levels in ALL and OVERT patients. Vegetables are one of the most frequently consumed food groups in our cohort with an average of 9.53 times per week in ALL HT patients (Table 2). Several studies have also observed positive associations between plant-based food and vitamin D levels, such as the study of 73 people from Australia, explaining this by the beneficial impact of a wide range of plant micronutrients and phytochemicals on vitamin D levels (58). Another positive correlation between “fruits and vegetables” diet and vitamin D, assessed through FFQ, was shown in 4372 participants from Switzerland (59). Yet another study observed significant correlation between vegetable diet and vitamin D levels suggesting that diet rich in vegetables may have a role in the maintenance of vitamin D levels in children (60). Additionally, an adherence to healthy Mediterranean diet, that includes frequent consumption of vegetables and dairy products (61) was positively associated with vitamin D levels (62). Similarly, a study in Uruguayan population found that higher intake of vegetables, nuts and fish was associated with lower risk of vitamin D deficiency (63).
Plant food is generally thought to be poor with vitamin D content (64), however, recent data suggest that plants may also be the source of vitamin D, especially vitamin D3 and its metabolites (65). Nevertheless, common anti-inflammatory roles of vitamin D and nutrients from vegetables may be a crosslink for the observed association and deserve further investigation.
Consumption of plant oil was found to be marginally significant in ALL patients with HT. Positive association may be explained by usual fortification of a plant oils with vitamin D (66). The most frequently consumed plant oil in Croatia is a sunflower oil that is typically fortified with vitamin D.
We also found marginally significant positive association between consumption of milk and dairy products with vitamin D levels in ALL patient with HT. Milk/milk products is also one of the most frequently consumed food groups in our cohort with an average of 9.83 times per week in ALL group. Since our FFQ did not differentiate the type of milk (unfortified or fortified with vitamin D) we can conclude that observed association between milk/milk products and vitamin D levels can be, at least partially, explained by vitamin D fortification.
We identified marginally significant positive association between non-alcoholic drinks intake and vitamin D levels in ALL and MILD. Although non-alcoholic drinks are usually sugar-sweetened and generally show a negative association with vitamin D levels (52, 67), our opposite result may be explained by a common intake of a specific non-alcoholic national drink, called Cedevita, in our population. It is a naturally fruity flavored multivitamin drink which is a source of 9 vitamins (vitamin C, E and B complex: B1, B2, B3, B5, B6, B9, and B12). We have already observed beneficial effects of this drink on general health in our previous study (10). However, we have to stay cautious with interpretation of our results, as there is no prior evidence of the beneficial effect of non-alcoholic drinks to vitamin D levels.
We did not detect associations of vitamin D levels with the two well-known food sources of vitamin D: oily-fish and eggs. The lack of association can be explained by the very low frequency of oily-fish consumption, which is less than once per week (0.79 times per week in ALL HT patients). The same applies to the consumption of eggs, which are consumed on average 1.56 times per week in ALL HT patients (Table 2). Therefore, the contribution of these two foods to the total levels of vitamin D in our HT patients is low. In addition, although our participants come from the Mediterranean region of Croatia, only 8.6% of them strictly adhere to the Mediterranean diet (manuscript under preparation), which means that vitamin D levels of the vast majority of our patients are not increased by the known vitamin D rich food. Beside vitamin-D rich food, the other main sources of vitamin D are fortified foods, mainly dairy products and supplements (64, 68, 69). According to the current data, fortification of dairy products with vitamin D is carried out in several countries: USA, Canada, Sweden, Norway, and Finland. Other countries, such as Croatia, do not have systematic vitamin D-milk fortification (23). Randomized control studies and observational studies have shown positive effects of fortified foods on serum vitamin D levels, and the association was stronger in countries with national vitamin D fortification policies (23, 32).
A limitation of our research is that our FFQ was not designed to collect quantitative data of food intake, therefore we could not calculate nutritional composition of consumed food. Another limitation is that our observational study was not designed to determine the causality between dietary habits and vitamin D levels. The causality between observed associations need to be further investigated using various analytical strategies. One of them, Mendelian randomization methods, may provide reliable evidence of causality before embarking on randomized control trials (70).
The biggest advantage of our study is that we used a large cohort of stringently diagnosed HT patients recruited in clinical settings with precisely defined two subgroups stratified by severity of disease. To our knowledge, this is the first study that analyzed association of dietary habits with vitamin D levels in patients with HT.
Insufficient levels of vitamin D and high proportions of vitamin D deficiencies are global health burden for all, healthy and diseased individuals. Patients with HT are not exception to this problem, mainly those in more severe stage of disease. Practical solutions for increasing vitamin D levels include higher exposure to sun light, intake of vitamin D supplementation and vitamin D rich or fortified food. Additionally, avoidance of factors that may negatively affect vitamin D blood levels may alleviate the problem of vitamin D deficiency (71, 72). Non-pharmacological factors that may affect vitamin D levels, such as those from food, are becoming increasingly important, as they are cheaper and easier to modify. For example, consumption of foods that show evidence of negative association with vitamin D levels, such as coffee and sweets, should be avoided, at least during winter–spring season. Functional and causal relationships of observed associations are not known and need to be further investigated to ultimately provide guidelines regarding coffee/sugar intake and vitamin D status. The results of our study show that food factors may have greater impact on vitamin D levels in OVERT HT patients in more severe stages of disease.
The raw data supporting the conclusions of this article will be made available by the authors, without undue reservation.
Ethics Committee from the University of Split School of Medicine (Classification no. 003–08/14–03/0001 and Registry no. 2181–198–03-04-14-0028; Classification no. 003–08/19–03/0003 and Reg. no. 2181–198–03-04-19-0019) and the Ethics Committee from the University Hospital of Split (Classification no. 530–02/13–01/11; Registry no. 2181–147-01/06/J.B.-14–2; Classification no. 500–03/18–01/80 and Reg. no. 2181–147-01/06/M.S.-18–2) approved this research. The patients/participants provided their written informed consent to participate in this study.
VB and DK conceived the study idea and drafted the manuscript. DK, AB, AP, and VB formed the biobank of patients with Hashimoto’s thyroiditis (CROHT). MC and AB performed the measurements and diagnosis of HT. DK performed the statistical analysis. VŠ and AP reviewed the manuscript. All authors have read and agreed to the final version of the manuscript.
This formation of the CROHT biobank was supported by the Croatian Science Foundation under the project “Genome-wide association analysis of Hashimoto’s thyroiditis” (grant no. 4950). Vitamin D measurements were obtained under the HAZU Foundation project “Analysis of the role of vitamin D with the presence and clinical manifestation of Hashimoto’s thyroiditis.”
The authors declare that the research was conducted in the absence of any commercial or financial relationships that could be construed as a potential conflict of interest.
All claims expressed in this article are solely those of the authors and do not necessarily represent those of their affiliated organizations, or those of the publisher, the editors and the reviewers. Any product that may be evaluated in this article, or claim that may be made by its manufacturer, is not guaranteed or endorsed by the publisher.
1. Caturegli, P, De Remigis, A, and Rose, NR. Hashimoto thyroiditis: clinical and diagnostic criteria. Autoimmun Rev. (2014) 13:391–7. doi: 10.1016/j.autrev.2014.01.007
2. McLeod, DS, and Cooper, DS. The incidence and prevalence of thyroid autoimmunity. Endocrine. (2012) 42:252–65. doi: 10.1007/s12020-012-9703-2
3. Mincer, DL, and Jialal, I. Hashimoto thyroiditis. StatPearls. Treasure Island, FL, StatPearls Publishing LLC (2021).
4. Sweeney, LB, Stewart, C, and Gaitonde, DY. Thyroiditis: an integrated approach. Am Fam Physician. (2014) 90:389–96.
5. Zaletel, K, and Gaberšček, S. Hashimoto’s thyroiditis: from genes to the disease. Curr Genomics. (2011) 12:576–88. doi: 10.2174/138920211798120763
6. Wiersinga, WM. Clinical relevance of environmental factors in the pathogenesis of autoimmune thyroid disease. Endocrinol Metab. (2016) 31:213–22. doi: 10.3803/EnM.2016.31.2.213
7. Effraimidis, G, and Wiersinga, WM. Mechanisms in endocrinology: autoimmune thyroid disease: old and new players. Eur J Endocrinol. (2014) 170:R241–52. doi: 10.1530/eje-14-0047
8. Burek, CL, and Talor, MV. Environmental triggers of autoimmune thyroiditis. J Autoimmun. (2009) 33:183–9. doi: 10.1016/j.jaut.2009.09.001
9. Rayman, MP. Multiple nutritional factors and thyroid disease, with particular reference to autoimmune thyroid disease. Proc Nutr Soc. (2019) 78:34–44. doi: 10.1017/s0029665118001192
10. Kaličanin, D, Brčić, L, Ljubetić, K, Barić, A, Gračan, S, Brekalo, M, et al. Differences in food consumption between patients with Hashimoto’s thyroiditis and healthy individuals. Sci Rep. (2020) 10:10670. doi: 10.1038/s41598-020-67719-7
11. Ruggeri, RM, Giovinazzo, S, Barbalace, MC, Cristani, M, Alibrandi, A, Vicchio, TM, et al. Influence of dietary habits on oxidative stress markers in Hashimoto’s thyroiditis. Thyroid. (2021) 31:96–105. doi: 10.1089/thy.2020.0299
12. Tonstad, S, Nathan, E, Oda, K, and Fraser, G. Vegan diets and hypothyroidism. Nutrients. (2013) 5:4642–52. doi: 10.3390/nu5114642
13. Matana, A, Torlak, V, Brdar, D, Popović, M, Lozić, B, Barbalić, M, et al. Dietary factors associated with plasma thyroid peroxidase and thyroglobulin antibodies. Nutrients. (2017) 9:1186. doi: 10.3390/nu9111186
14. Asik, M, Gunes, F, Binnetoglu, E, Eroglu, M, Bozkurt, N, Sen, H, et al. Decrease in TSH levels after lactose restriction in Hashimoto’s thyroiditis patients with lactose intolerance. Endocrine. (2014) 46:279–84. doi: 10.1007/s12020-013-0065-1
15. Lundin, KE, and Wijmenga, C. Coeliac disease and autoimmune disease-genetic overlap and screening. Nat Rev Gastroenterol Hepatol. (2015) 12:507–15. doi: 10.1038/nrgastro.2015.136
16. Liontiris, MI, and Mazokopakis, EE. A concise review of Hashimoto thyroiditis (HT) and the importance of iodine, selenium, vitamin D and gluten on the autoimmunity and dietary management of HT patients. Points that need more investigation. Hell J Nucl Med. (2017) 20:51–6. doi: 10.1967/s002449910507
17. Kowalówka, M, Główka, AK, Karaźniewicz-Łada, M, and Kosewski, G. Clinical significance of analysis of vitamin D status in various diseases. Nutrients. (2020) 12:2788. doi: 10.3390/nu12092788
18. Cvek, M, Kaličanin, D, Barić, A, Vuletić, M, Gunjača, I, Torlak Lovrić, V, et al. Vitamin D and Hashimoto’s thyroiditis: observations from CROHT biobank. Nutrients. (2021) 13:2793. doi: 10.3390/nu13082793
19. Zhao, R, Zhang, W, Ma, C, Zhao, Y, Xiong, R, Wang, H, et al. Immunomodulatory function of vitamin D and its role in autoimmune thyroid disease. Front Immunol. (2021) 12:574967. doi: 10.3389/fimmu.2021.574967
20. Vondra, K, Stárka, L, and Hampl, R. Vitamin D and thyroid diseases. Physiol Res. (2015) 64:S95–S100. doi: 10.33549/physiolres.933083
21. Ramasamy, I, and Vitamin, D. Metabolism and guidelines for vitamin D supplementation. Clin Biochem Rev. (2020) 41:103–26. doi: 10.33176/aacb-20-00006
22. Ross, AC, Manson, JE, Abrams, SA, Aloia, JF, Brannon, PM, Clinton, SK, et al. The 2011 report on dietary reference intakes for calcium and vitamin D from the Institute of Medicine: what clinicians need to know. J Clin Endocrinol Metab. (2011) 96:53–8. doi: 10.1210/jc.2010-2704
23. Itkonen, ST, Erkkola, M, and Lamberg-Allardt, CJE. Vitamin D fortification of fluid milk products and their contribution to vitamin D intake and vitamin D status in observational studies-a review. Nutrients. (2018) 10:1054. doi: 10.3390/nu10081054
24. Wilson, LR, Tripkovic, L, Hart, KH, and Lanham-New, SA. Vitamin D deficiency as a public health issue: using vitamin D2 or vitamin D3 in future fortification strategies. Proc Nutr Soc. (2017) 76:392–9. doi: 10.1017/s0029665117000349
25. Maurya, VK, and Aggarwal, M. Factors influencing the absorption of vitamin D in GIT: an overview. J Food Sci Technol. (2017) 54:3753–65. doi: 10.1007/s13197-017-2840-0
26. Holick, MF. Environmental factors that influence the cutaneous production of vitamin D. Am J Clin Nutr. (1995) 61:638S–45S. doi: 10.1093/ajcn/61.3.638S
27. Kraus, FB, Medenwald, D, and Ludwig-Kraus, B. Do extreme summers increase blood vitamin D (25-hydroxyvitamin D) levels? PLoS One. (2020) 15:e0242230. doi: 10.1371/journal.pone.0242230
28. Shahudin, NN, Sameeha, MJ, Mat Ludin, AF, Manaf, ZA, Chin, KY, and Jamil, NA. Barriers towards sun exposure and strategies to overcome these barriers in female indoor workers with insufficient vitamin D: a qualitative approach. Nutrients. (2020) 12:2994. doi: 10.3390/nu12102994
29. Macdonald, HM. Contributions of sunlight and diet to vitamin D status. Calcif Tissue Int. (2013) 92:163–76. doi: 10.1007/s00223-012-9634-1
30. Rodríguez-Rodríguez, E, Aparicio Vizuete, A, Sánchez-Rodríguez, P, Lorenzo Mora, AM, López-Sobaler, AM, and Ortega, RM. Vitamin D deficiency in Spanish population. Importance of egg on nutritional improvement. Nutr Hosp. (2019) 36:3–7. doi: 10.20960/nh.02798
31. Brock, K, Cant, R, Clemson, L, Mason, RS, and Fraser, DR. Effects of diet and exercise on plasma vitamin D (25(OH)D) levels in Vietnamese immigrant elderly in Sydney, Australia. J Steroid Biochem Mol Biol. (2007) 103:786–92. doi: 10.1016/j.jsbmb.2006.12.048
32. Black, LJ, Seamans, KM, Cashman, KD, and Kiely, M. An updated systematic review and meta-analysis of the efficacy of vitamin D food fortification. J Nutr. (2012) 142:1102–8. doi: 10.3945/jn.112.158014
33. Bonaccio, M, Pounis, G, Cerletti, C, Donati, MB, Iacoviello, L, and de Gaetano, G. Mediterranean diet, dietary polyphenols and low grade inflammation: results from the MOLI-SANI study. Br J Clin Pharmacol. (2017) 83:107–13. doi: 10.1111/bcp.12924
34. Zupo, R, Lampignano, L, Lattanzio, A, Mariano, F, Osella, AR, Bonfiglio, C, et al. Association between adherence to the Mediterranean diet and circulating vitamin D levels. Int J Food Sci Nutr. (2020) 71:884–90. doi: 10.1080/09637486.2020.1744533
35. Brčić, L, Barić, A, Gračan, S, Brekalo, M, Kaličanin, D, Gunjača, I, et al. Genome-wide association analysis suggests novel loci for Hashimoto’s thyroiditis. J Endocrinol Investig. (2019) 42:567–76. doi: 10.1007/s40618-018-0955-4
36. Brčić, L, Barić, A, Benzon, B, Brekalo, M, Gračan, S, Kaličanin, D, et al. AATF and SMARCA2 are associated with thyroid volume in Hashimoto’s thyroiditis patients. Sci Rep. (2020) 10:1754. doi: 10.1038/s41598-020-58457-x
37. Pearce, SH, Brabant, G, Duntas, LH, Monzani, F, Peeters, RP, Razvi, S, et al. 2013 ETA guideline: management of subclinical hypothyroidism. Eur Thyroid J. (2013) 2:215–28. doi: 10.1159/000356507
38. Mikulska, AA, Karazniewicz-Lada, M, Filipowicz, D, Ruchala, M, and Glowka, FK. Metabolic characteristics of Hashimoto’s thyroiditis patients and the role of microelements and diet in the disease management-an overview. Int J Mol Sci. (2022) 23:6580. doi: 10.3390/ijms23126580
39. Fang, F, Chai, Y, Wei, H, Wang, K, Tan, L, Zhang, W, et al. Vitamin D deficiency is associated with thyroid autoimmunity: results from an epidemiological survey in Tianjin, China. Endocrine. (2021) 73:447–54. doi: 10.1007/s12020-021-02688-z
40. Poole, R, Kennedy, OJ, Roderick, P, Fallowfield, JA, Hayes, PC, and Parkes, J. Coffee consumption and health: umbrella review of meta-analyses of multiple health outcomes. BMJ. (2017) 359:j5024. doi: 10.1136/bmj.j5024
42. Chen, Q, Kord-Varkaneh, H, Santos, HO, Genario, R, and Dang, M. Higher intakes of dietary caffeine are associated with 25-hydroxyvitamin D deficiency. Int J Vitam Nutr Res. (2021) 92:85–90. doi: 10.1024/0300-9831/a000727
43. Nakamura, K, Kitamura, K, Takachi, R, Saito, T, Kobayashi, R, Oshiki, R, et al. Impact of demographic, environmental, and lifestyle factors on vitamin D sufficiency in 9084 Japanese adults. Bone. (2015) 74:10–7. doi: 10.1016/j.bone.2014.12.064
44. Duchaine, CS, and Diorio, C. Association between intake of sugar-sweetened beverages and circulating 25-hydroxyvitamin D concentration among premenopausal women. Nutrients. (2014) 6:2987–99. doi: 10.3390/nu6082987
45. Lee, MJ, Hsu, HJ, Wu, IW, Sun, CY, Ting, MK, and Lee, CC. Vitamin D deficiency in northern Taiwan: a community-based cohort study. BMC Public Health. (2019) 19:337. doi: 10.1186/s12889-019-6657-9
46. Al-Othman, A, Al-Musharaf, S, Al-Daghri, NM, Yakout, S, Alkharfy, KM, Al-Saleh, Y, et al. Tea and coffee consumption in relation to vitamin D and calcium levels in Saudi adolescents. Nutr J. (2012) 11:56. doi: 10.1186/1475-2891-11-56
47. Al-Raddadi, R, Bahijri, S, Borai, A, and AlRaddadi, Z. Prevalence of lifestyle practices that might affect bone health in relation to vitamin D status among female Saudi adolescents. Nutrition. (2018) 45:108–13. doi: 10.1016/j.nut.2017.07.015
48. Mutti, DO, and Marks, AR. Blood levels of vitamin D in teens and young adults with myopia. Optom Vis Sci. (2011) 88:377–82. doi: 10.1097/OPX.0b013e31820b0385
49. Hirschler, V, Maccallini, G, Aranda, C, Fernando, S, and Molinari, C. Association of vitamin D with glucose levels in indigenous and mixed population Argentinean boys. Clin Biochem. (2013) 46:197–201. doi: 10.1016/j.clinbiochem.2012.11.005
50. Muñoz-Garach, A, García-Fontana, B, and Muñoz-Torres, M. Vitamin D status, calcium intake and risk of developing type 2 diabetes: an unresolved issue. Nutrients. (2019) 11:642. doi: 10.3390/nu11030642
51. Sisley, SR, Arble, DM, Chambers, AP, Gutierrez-Aguilar, R, He, Y, Xu, Y, et al. Hypothalamic vitamin D improves glucose homeostasis and reduces weight. Diabetes. (2016) 65:2732–41. doi: 10.2337/db16-0309
52. Olson, ML, Maalouf, NM, Oden, JD, White, PC, and Hutchison, MR. Vitamin D deficiency in obese children and its relationship to glucose homeostasis. J Clin Endocrinol Metab. (2012) 97:279–85. doi: 10.1210/jc.2011-1507
53. Kadowaki, S, and Norman, AW. Dietary vitamin D is essential for normal insulin secretion from the perfused rat pancreas. J Clin Invest. (1984) 73:759–66. doi: 10.1172/jci111269
54. Orgaz-Molina, J, Magro-Checa, C, Rosales-Alexander, JL, Arrabal-Polo, MA, Buendía-Eisman, A, Raya-Alvarez, E, et al. Association of 25-hydroxyvitamin D serum levels and metabolic parameters in psoriatic patients with and without arthritis. J Am Acad Dermatol. (2013) 69:938–46. doi: 10.1016/j.jaad.2013.08.007
55. Alharazy, S, Alissa, E, Lanham-New, S, Naseer, MI, Chaudhary, AG, and Robertson, MD. Association between vitamin D and glycaemic parameters in a multi-ethnic cohort of postmenopausal women with type 2 diabetes in Saudi Arabia. BMC Endocr Disord. (2021) 21:162. doi: 10.1186/s12902-021-00825-3
56. Ehrampoush, E, Mirzay Razzaz, J, Arjmand, H, Ghaemi, A, Raeisi Shahraki, H, Ebrahim Babaei, A, et al. The association of vitamin D levels and insulin resistance. Clin Nutr ESPEN. (2021) 42:325–32. doi: 10.1016/j.clnesp.2021.01.012
57. Esteghamati, A, Aryan, Z, and Nakhjavani, M. Vitamin D deficiency is associated with insulin resistance in nondiabetics and reduced insulin production in type 2 diabetics. Horm Metab Res. (2015) 47:273–9. doi: 10.1055/s-0034-1389903
58. Berg, J, Seyedsadjadi, N, and Grant, R. Increased consumption of plant foods is associated with increased bone mineral density. J Nutr Health Aging. (2020) 24:388–97. doi: 10.1007/s12603-020-1339-y
59. Marques-Vidal, P, Waeber, G, Vollenweider, P, and Guessous, I. Socio-demographic and lifestyle determinants of dietary patterns in French-speaking Switzerland, 2009-2012. BMC Public Health. (2018) 18:131. doi: 10.1186/s12889-018-5045-1
60. Oh, HY, Lee, SY, Yoon, J, Cho, HJ, Kim, YH, Suh, DI, et al. Vegetable dietary pattern may protect mild and persistent allergic rhinitis phenotype depending on genetic risk in school children. Pediatr Allergy Immunol. (2020) 31:920–9. doi: 10.1111/pai.13308
61. Bach-Faig, A, Berry, EM, Lairon, D, Reguant, J, Trichopoulou, A, Dernini, S, et al. Mediterranean diet pyramid today. Science and cultural updates. Public Health Nutr. (2011) 14:2274–84. doi: 10.1017/s1368980011002515
62. Barrea, L, Muscogiuri, G, Laudisio, D, Pugliese, G, de Alteriis, G, Colao, A, et al. Influence of the Mediterranean diet on 25- Hydroxyvitamin D levels in adults. Nutrients. (2020) 12:1439. doi: 10.3390/nu12051439
63. Moliterno, P, Donangelo, CM, Borgarello, L, Pécora, M, Olascoaga, A, Noboa, O, et al. Association of dietary patterns with cardiovascular and kidney phenotypes in an Uruguayan population cohort. Nutrients. (2021) 13:2213. doi: 10.3390/nu13072213
64. Ross, AC, Taylor, CL, Yaktine, AL, and Valle, HBDel, editors. Dietary reference intakes for calcium and vitamin D. Washington, DC: National Academy of Sciences (2011).
65. Black, LJ, Lucas, RM, Sherriff, JL, Björn, LO, and Bornman, JF. In pursuit of vitamin D in plants. Nutrients. (2017) 9:136. doi: 10.3390/nu9020136
66. Yang, Z, Laillou, A, Smith, G, Schofield, D, and Moench-Pfanner, R. A review of vitamin D fortification: implications for nutrition programming in Southeast Asia. Food Nutr Bull. (2013) 34:S81–9. doi: 10.1177/15648265130342s110
67. García-Contreras, F, Paniagua, R, Avila-Díaz, M, Cabrera-Muñoz, L, Martínez-Muñiz, I, Foyo-Niembro, E, et al. Cola beverage consumption induces bone mineralization reduction in ovariectomized rats. Arch Med Res. (2000) 31:360–5. doi: 10.1016/s0188-4409(00)00090-4
68. Calvo, MS, Whiting, SJ, and Barton, CN. Vitamin D fortification in the United States and Canada: current status and data needs. Am J Clin Nutr. (2004) 80:1710S–6S. doi: 10.1093/ajcn/80.6.1710S
69. Yetley, EA. Assessing the vitamin D status of the US population. Am J Clin Nutr. (2008) 88:558S–64S. doi: 10.1093/ajcn/88.2.558S
70. Davies, NM, Holmes, MV, and Davey, SG. Reading Mendelian randomisation studies: a guide, glossary, and checklist for clinicians. BMJ. (2018) 362:k601. doi: 10.1136/bmj.k601
71. Burgaz, A, Akesson, A, Oster, A, Michaëlsson, K, and Wolk, A. Associations of diet, supplement use, and ultraviolet B radiation exposure with vitamin D status in Swedish women during winter. Am J Clin Nutr. (2007) 86:1399–404. doi: 10.1093/ajcn/86.5.1399
72. Freedman, DM, Cahoon, EK, Rajaraman, P, Major, JM, Doody, MM, Alexander, BH, et al. Sunlight and other determinants of circulating 25-hydroxyvitamin D levels in black and white participants in a nationwide U.S. study. Am J Epidemiol. (2013) 177:180–92. doi: 10.1093/aje/kws223
Keywords: autoimmune thyroid disease, coffee intake, 25 hydroxy vitamin D, sweets intake, vegetables intake, food frequency questionnaire
Citation: Kaličanin D, Cvek M, Barić A, Škrabić V, Punda A and Boraska Perica V (2023) Associations between vitamin D levels and dietary patterns in patients with Hashimoto’s thyroiditis. Front. Nutr. 10:1188612. doi: 10.3389/fnut.2023.1188612
Edited by:
Francesca Gorini, National Research Council (CNR), ItalyReviewed by:
Katarzyna Lachowicz, Warsaw University of Life Sciences, PolandCopyright © 2023 Kaličanin, Cvek, Barić, Škrabić, Punda and Boraska Perica. This is an open-access article distributed under the terms of the Creative Commons Attribution License (CC BY). The use, distribution or reproduction in other forums is permitted, provided the original author(s) and the copyright owner(s) are credited and that the original publication in this journal is cited, in accordance with accepted academic practice. No use, distribution or reproduction is permitted which does not comply with these terms.
*Correspondence: Vesna Boraska Perica, dmJvcmFza2FAbWVmc3QuaHI=
Disclaimer: All claims expressed in this article are solely those of the authors and do not necessarily represent those of their affiliated organizations, or those of the publisher, the editors and the reviewers. Any product that may be evaluated in this article or claim that may be made by its manufacturer is not guaranteed or endorsed by the publisher.
Research integrity at Frontiers
Learn more about the work of our research integrity team to safeguard the quality of each article we publish.