
94% of researchers rate our articles as excellent or good
Learn more about the work of our research integrity team to safeguard the quality of each article we publish.
Find out more
ORIGINAL RESEARCH article
Front. Nutr., 12 May 2023
Sec. Clinical Nutrition
Volume 10 - 2023 | https://doi.org/10.3389/fnut.2023.1162031
This article is part of the Research TopicNutrition and Non-Alcoholic/Metabolic Dysfunction-Associated Fatty Liver Disease (NAFLD/MAFLD): Prevention and ManagementView all 8 articles
 Hui Wu1
 Jiang-Long Guo1,2
 Jing-Jiong Yao1,3Jia-Jun Yu1,3Run-Yu Xia1,4Wei-Qing Huang1,2
 Xuan Tang1,5*Guang-Ming He1*
Background and aims: Vitamin C, as an antioxidant, may play a role in the treatment of NAFLD. This research aimed to investigate the association of serum vitamin C levels with the risk of NAFLD and to further examine the causal relationship by Mendelian randomization (MR) method.
Methods: The cross-sectional study selected 5,578 participants of the National Health and Nutrition Examination Survey (NHANES), 2005–2006 and 2017–2018. The association of serum vitamin C levels with NAFLD risk was evaluated under a multivariable logistic regression model. A two-sample MR study, using genetic data from large-scale genome-wide association studies (GWAS) of serum vitamin C levels (52,014 individuals) and NAFLD (primary analysis: 1,483 cases /17,781 controls; secondary analysis: 1,908 cases/340,591 controls), was conducted to infer causality between them. The inverse-variance-weighted (IVW) was applied as the main method of MR analysis. A series of sensitivity analyzes were used to evaluate the pleiotropy.
Results: In the cross-sectional study, results showed that Tertile 3 group (Tertile 3: ≥1.06 mg/dl) had a significantly lower risk (OR = 0.59, 95% CI: 0.48 ~ 0.74, p < 0.001) of NAFLD than Tertile 1 group (Tertile 1: ≤0.69 mg/dl) after full adjustments. In regard to gender, serum vitamin C was protective against NAFLD in both women (OR = 0.63, 95% CI: 0.49 ~ 0.80, p < 0.001) and men (OR = 0.73, 95% CI: 0.55 ~ 0.97, p = 0.029) but was stronger among women. However, in the IVW of MR analyzes, no causal relationship between serum vitamin C levels and NAFLD risk was observed in the primary analysis (OR = 0.82, 95% CI: 0.47 ~ 1.45, p = 0.502) and secondary analysis (OR = 0.80, 95% CI: 0.53 ~ 1.22, p = 0.308). MR sensitivity analyzes yielded consistent results.
Conclusion: Our MR study did not support a causal association between serum vitamin C levels and NAFLD risk. Further studies with greater cases are warranted to confirm our findings.
Non-alcoholic fatty liver disease (NAFLD) is the most common chronic liver disorder today with a worldwide incidence of approximately 25% (1) and is one of the main reasons for liver cirrhosis in adults in the United States (2). NAFLD refers to steatosis in more than 5% of hepatocytes that is related with metabolic risk factors (particularly abnormal obesity and type II diabetes) and without excessive alcoholic beverage use (30 g/d in men, 20 g/d in women) and other chronic liver diseases (3). The pathogenesis of NAFLD is poorly comprehended. The “multiple hits” theory proposes that various factors, including insulin resistance, gut microbes, genetic susceptibility, and epigenetic factors, can jointly drive the development of NAFLD (4). Among them, oxidative stress is considered as an important cause of inducing “multiple hits” (5). There are no effective drugs for the cure of NAFLD passed by Food and Drug Administration (FDA). Vitamin C, as a commonly used antioxidant, has aroused researchers’ interest.
Vitamin C can react with free radicals and oxides form less reactive products, to protect cells from the damage of these substances in normal physiological reaction or disease so that it is often considered the preferred antioxidant (6). In genetics, vitamin C has a certain degree of epigenetic regulation function. Related studies have found that when humans lack vitamin C, it may disrupt the methylation-demethylation response of DNA and histones, resulting in phenotype changing (7). Vitamin C as an antioxidant, it is widely used in the cure and prevention of diverse diseases, such as the treatment of COVID-19 (8), prevention of skin aging (9), prevention of macular degeneration (10), adjuvant treatment of Periodontitis (11), etc. Xie et al. found a negative association between serum vitamin C levels and NAFLD (12). However, their study only selected the data from the National Health and Nutrition Examination Survey (NHANES) database from 2017 to 2018, and their study was limited only to cross-sectional studies and did not deeply explore them genetically. At present, there are few clinical trials on the effect of vitamin C on NAFLD, through searching Home–ClinicalTrials.gov , only Professor Georgios Papatheodoridis from the University of Athens is conducting the study, and the clinical trial results have not been released.
Therefore, to assess the effects of plasma vitamin C concentration on NAFLD risk, we first conducted an observational study with data based the US population from NHANES database (13). Furthermore, we applied Mendelian randomization (MR) approach to assess the causal correlation of circulating vitamin C levels with the risk of NAFLD. This approach could infer causality with genetically instrumental variables (IVs). Since the genetic variants are assigned arbitrarily during gamete formation under no effect from environmental and lifestyle factors, MR analysis is less susceptible to the biases from reverse causality and uncontrolled confounders, which instead were commonly found in conventional observational studies (14, 15).
We analyzed the data from the NHANES 2005–2006 and 2017–2018. A cross-sectional study was designed to assess health and nutrition status of Americans’ adults and children with the nationally representative study. Participants in this study were interviewed about demographics, socioeconomic, dietary habits, and health. The NHANES is a major program of the National Center for Health Statistics (NCHS) and it was approved by the Research Ethics Review Board at the NCHS. A total of 19,602 participants participated the survey during 2005–2006 and 2017–2018. However, we excluded 5,560 samples with unknown serum vitamin C levels and 8,464 samples with unknown NAFLD results. Therefore, the final analytic sample included 5,578 participants with complete serum vitamin C levels and NAFLD results.
To analyze serum specimens, the blood samples were collected, processed, stored, and delivered to Atlanta, GA’s Division of Laboratory Sciences, National Center for Environmental Health, Centers for Disease Control and Prevention. NHANES quality assurance and quality control processes (QA/QC) meet Clinical Laboratory Improvement Act (CLIA) criteria. Isocratic ultra-high performance liquid chromatography (UPLC) with electrochemical detection at 450 mV was used to quantify vitamin C in serum (range 200 nA). The peak area of vitamin C in the unknown is compared to the peak area of a known amount in a calibrator solution for quantification. The calibration solution is corrected by comparing the peak area of the internal standard with that of the unknown.
Liver steatosis and fibrosis were determined by using the controlled attenuation parameter (CAP) from the vibration-controlled transient elastography (VCTE). NAFLD was defined by controlled attenuation parameter (CAP) scores of 248 dB/m without excessive alcohol consumption and viral hepatitis.
R version 4.2.2 was used for all analyzes. For categorical variables, counts and proportions were employed, while means and standard deviations were used for continuous data. And then, the two-sided p < 0.05 was regarded as statistical significance. Serum vitamin C was divided into tertiles, and the tertile 1 (T1) was used as the reference. This research constructed logistic regression models to evaluate the associations of serum vitamin C concentrations with NAFLD risk.
Four Logistic regression models were constructed to assess the relationship. The first model did not adjust for its associated covariates, roughly estimating the association. The second model was further adjusted for age, gender, and race. The third model controlled for marital status, BMI, PIR, education level, smoking status, CVD, PA total time, and PA total MET. The fourth model was adjusted for DM and hypertension. The detailed descriptions of the covariates adjusted for are shown in Supplementary text. We also examined whether the association differed between male and female. These models were specified as follows:
Crude model: not adjusted.
Model 1: adjusted for age, gender and race.
Model 2: Model 1 + Marital status, BMI, PIR, educational level, smoking status, CVD, PA total time and PA total MET.
Model 3: Model 2 + DM and Hypertension.
Figure 1 shows an overview of the present MR study. To obtain valid causal estimates, IVs in the MR model need to satisfy the three assumptions (Figure 1): 1 genetic variants are significantly associated with the serum vitamin C levels; (2) they are not influenced by potential confounders; and (3) they influence NAFLD only via serum vitamin C levels.
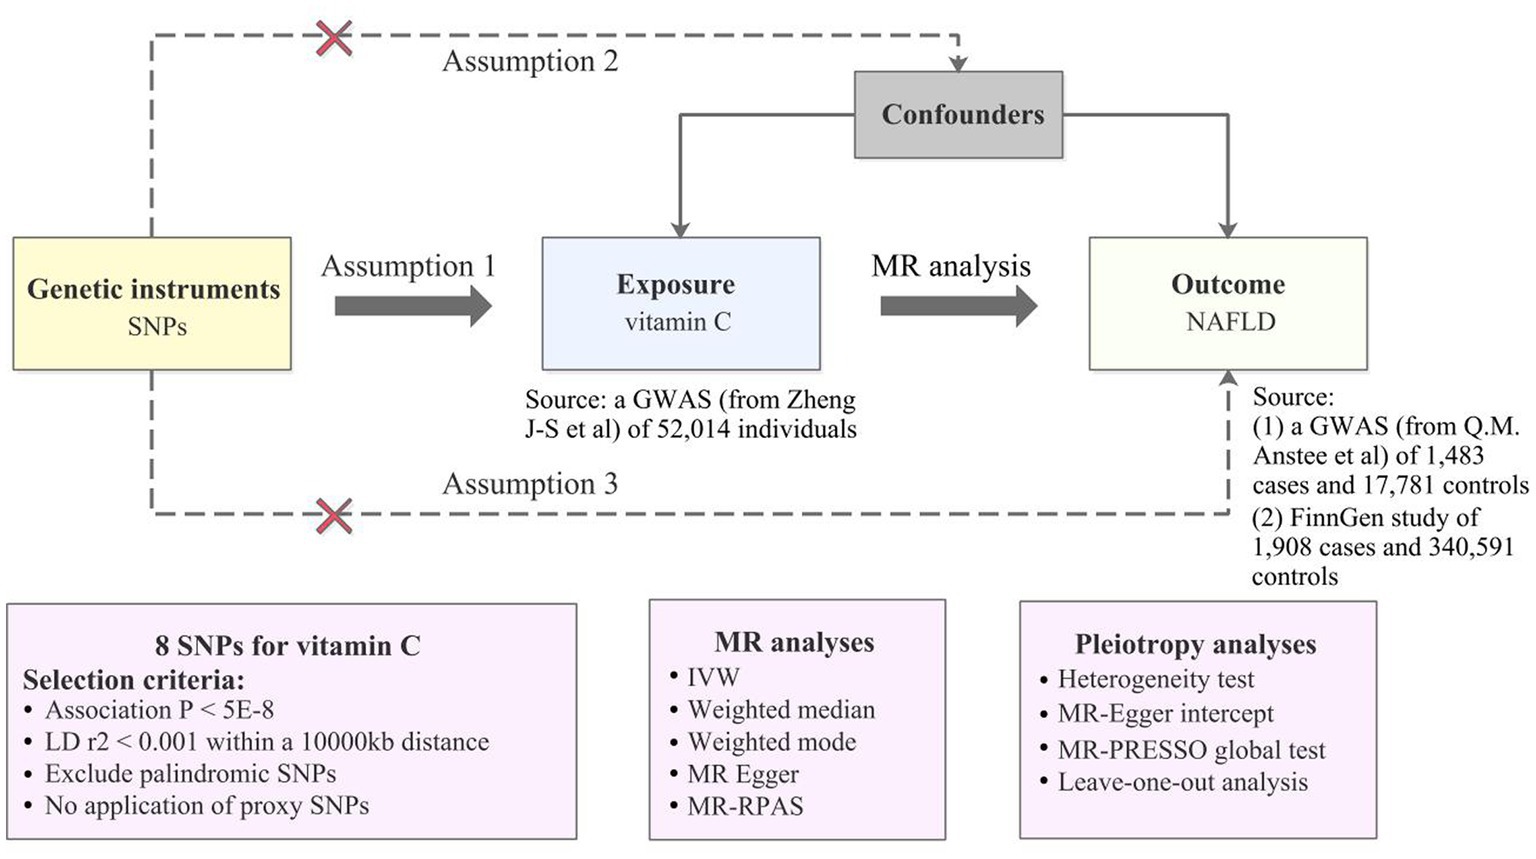
Figure 1. An overview of MR analysis. SNPs, single-nucleotide polymorphisms; GWAS, genome-wide association studies; MR, Mendelian randomization; LD, linkage disequilibrium; IVW, inverse variance weighted; MR-RAPS, MR-Robust Adjusted Profile Score; NAFLD, non-alcoholic fatty liver disease; MR-PRESSO, MR-Pleiotropy RESidual Sum and Outlier.
Summary-level GWAS statistics of NAFLD were obtained from a largely European population-based meta-analysis by Anstee et al., with 1,483 cases and 17,781 controls, as a primary analysis (16) and the FinnGen study with 1908 cases and 340,591 controls of European descent, as a secondary analysis (17, 18). In the Anstee et al. GWAS, patients with NAFLD were enlisted from clinics at some top European tertiary liver centers, and after undergoing a liver biopsy, biopsy tissues were evaluated by liver pathologists in accordance with established standards (16). NAFLD Cases in FinnGen consortium were diagnosed under the standard of International Classification of Disease code K76.0. Detailed information on data sources is demonstrated in Supplementary Table S1.
Genetic instruments (SNPs) of plasma vitamin C levels were obtained from the most recent meta-analysis of genome-wide association study (GWAS) with up to 52,018 European participants included, which identified 11 lead SNPs explaining approximately 1.87% of the variance of circulating vitamin C (19). There were four studies involved in this large-scale GWAS: the Fenland study, European Prospective Investigation into Cancer and Nutrition (EPIC)-InterAct study, EPIC-Norfolk study, and EPIC-CVD study (19). Rs174547 located in the FADS1 gene was directly removed in the analysis for encoding plasma phospholipid fatty acids synthesis-associated enzyme (19), avoiding related pleiotropic effects on our results. Additionally, we also exclude rs12524110 identified as a palindromic SNP in the harmonization process. The remaining 9 SNPs were selected as IVs in this MR analysis (Supplementary Table S2). The specific selection criteria are illustrated in Figure 1 and Supplementary Table S2.
The main MR analysis was carried out by employing inverse-variance weighted (IVW) method under a random-effects model, which combined the Wald ratios by dividing the SNP–outcome effect by the SNP–exposure effect (20). The results were presented as odds ratios (ORs) for the risk of NAFLD per one standard deviation rise in the serum vitamin C levels. We also used MR-Egger (21), MR-RAPS (22), Weighted mode (23) and Weighted-median (24) as sensitivity analyzes to validate the results from IVW. To reduce possible pleiotropic biases, we firstly searched for and remove a confounding SNP (rs174547) using the PhenoScanner V2 database1 (25). The potential horizontal pleiotropy was evaluated using MR-Egger regression based on its intercept term, of which the value close to zero (p > 0.05) indicates no evidence for the existence of directional pleiotropy (21). Moreover, MR Pleiotropy RESidual Sum and Outlier (PRESSO) global test was utilized to remove any outliers leading to horizontal pleiotropy (26). The Cochran Q test for the IVW model was used to detect heterogeneity (27). Specifically, no heterogeneity was suggested when the Cochran Q test value of p was >0.05 and I2 was <25%. Besides, the Rucker Q’ test for the MR-Egger model was applied, with the difference value of Q - Q’ calculated. In detail, the value of p >0.05 in Q–Q’ shows that no potential pleiotropy was examined, and provides strong support that IVW model could better fit in the MR analyzes (27). In addition, the leave-one-out analysis was applied to examine whether any single SNP significantly drove the IVW estimates. Finally, we performed MR Steiger filtering test to exclude “FALSE” direction in case of possible reverse causation of plasma vitamin C on NAFLD (28). All MR analyzes were performed from the ‘TwoSampleMR’ (version 0.5.6) and ‘MR-PRESSO’ package (26) in R software 4.2.2. p-value <0.05 was considered as statistical significance.
We calculated F-statistic, an indicator of instrument strength measure, and the F-statistic above 10 reveals a low chance of weak instrument bias in our MR analysis (29).
Overall characteristics of the study subjects by gender are summarized in Table 1. There are 2,819 women (50.54%) and 2,759 men (49.46%) in the final analytic sample. There were 35.2% NAFLD and 64.8% not NAFLD among all samples. Except for age, race, marital status, PIR, and hypertension, there were statistically significant differences between males and females in the remaining results (p < 0.05). Table 1 shows that serum vitamin C levels are higher in women than in men, but the prevalence of NAFLD is higher than in men.
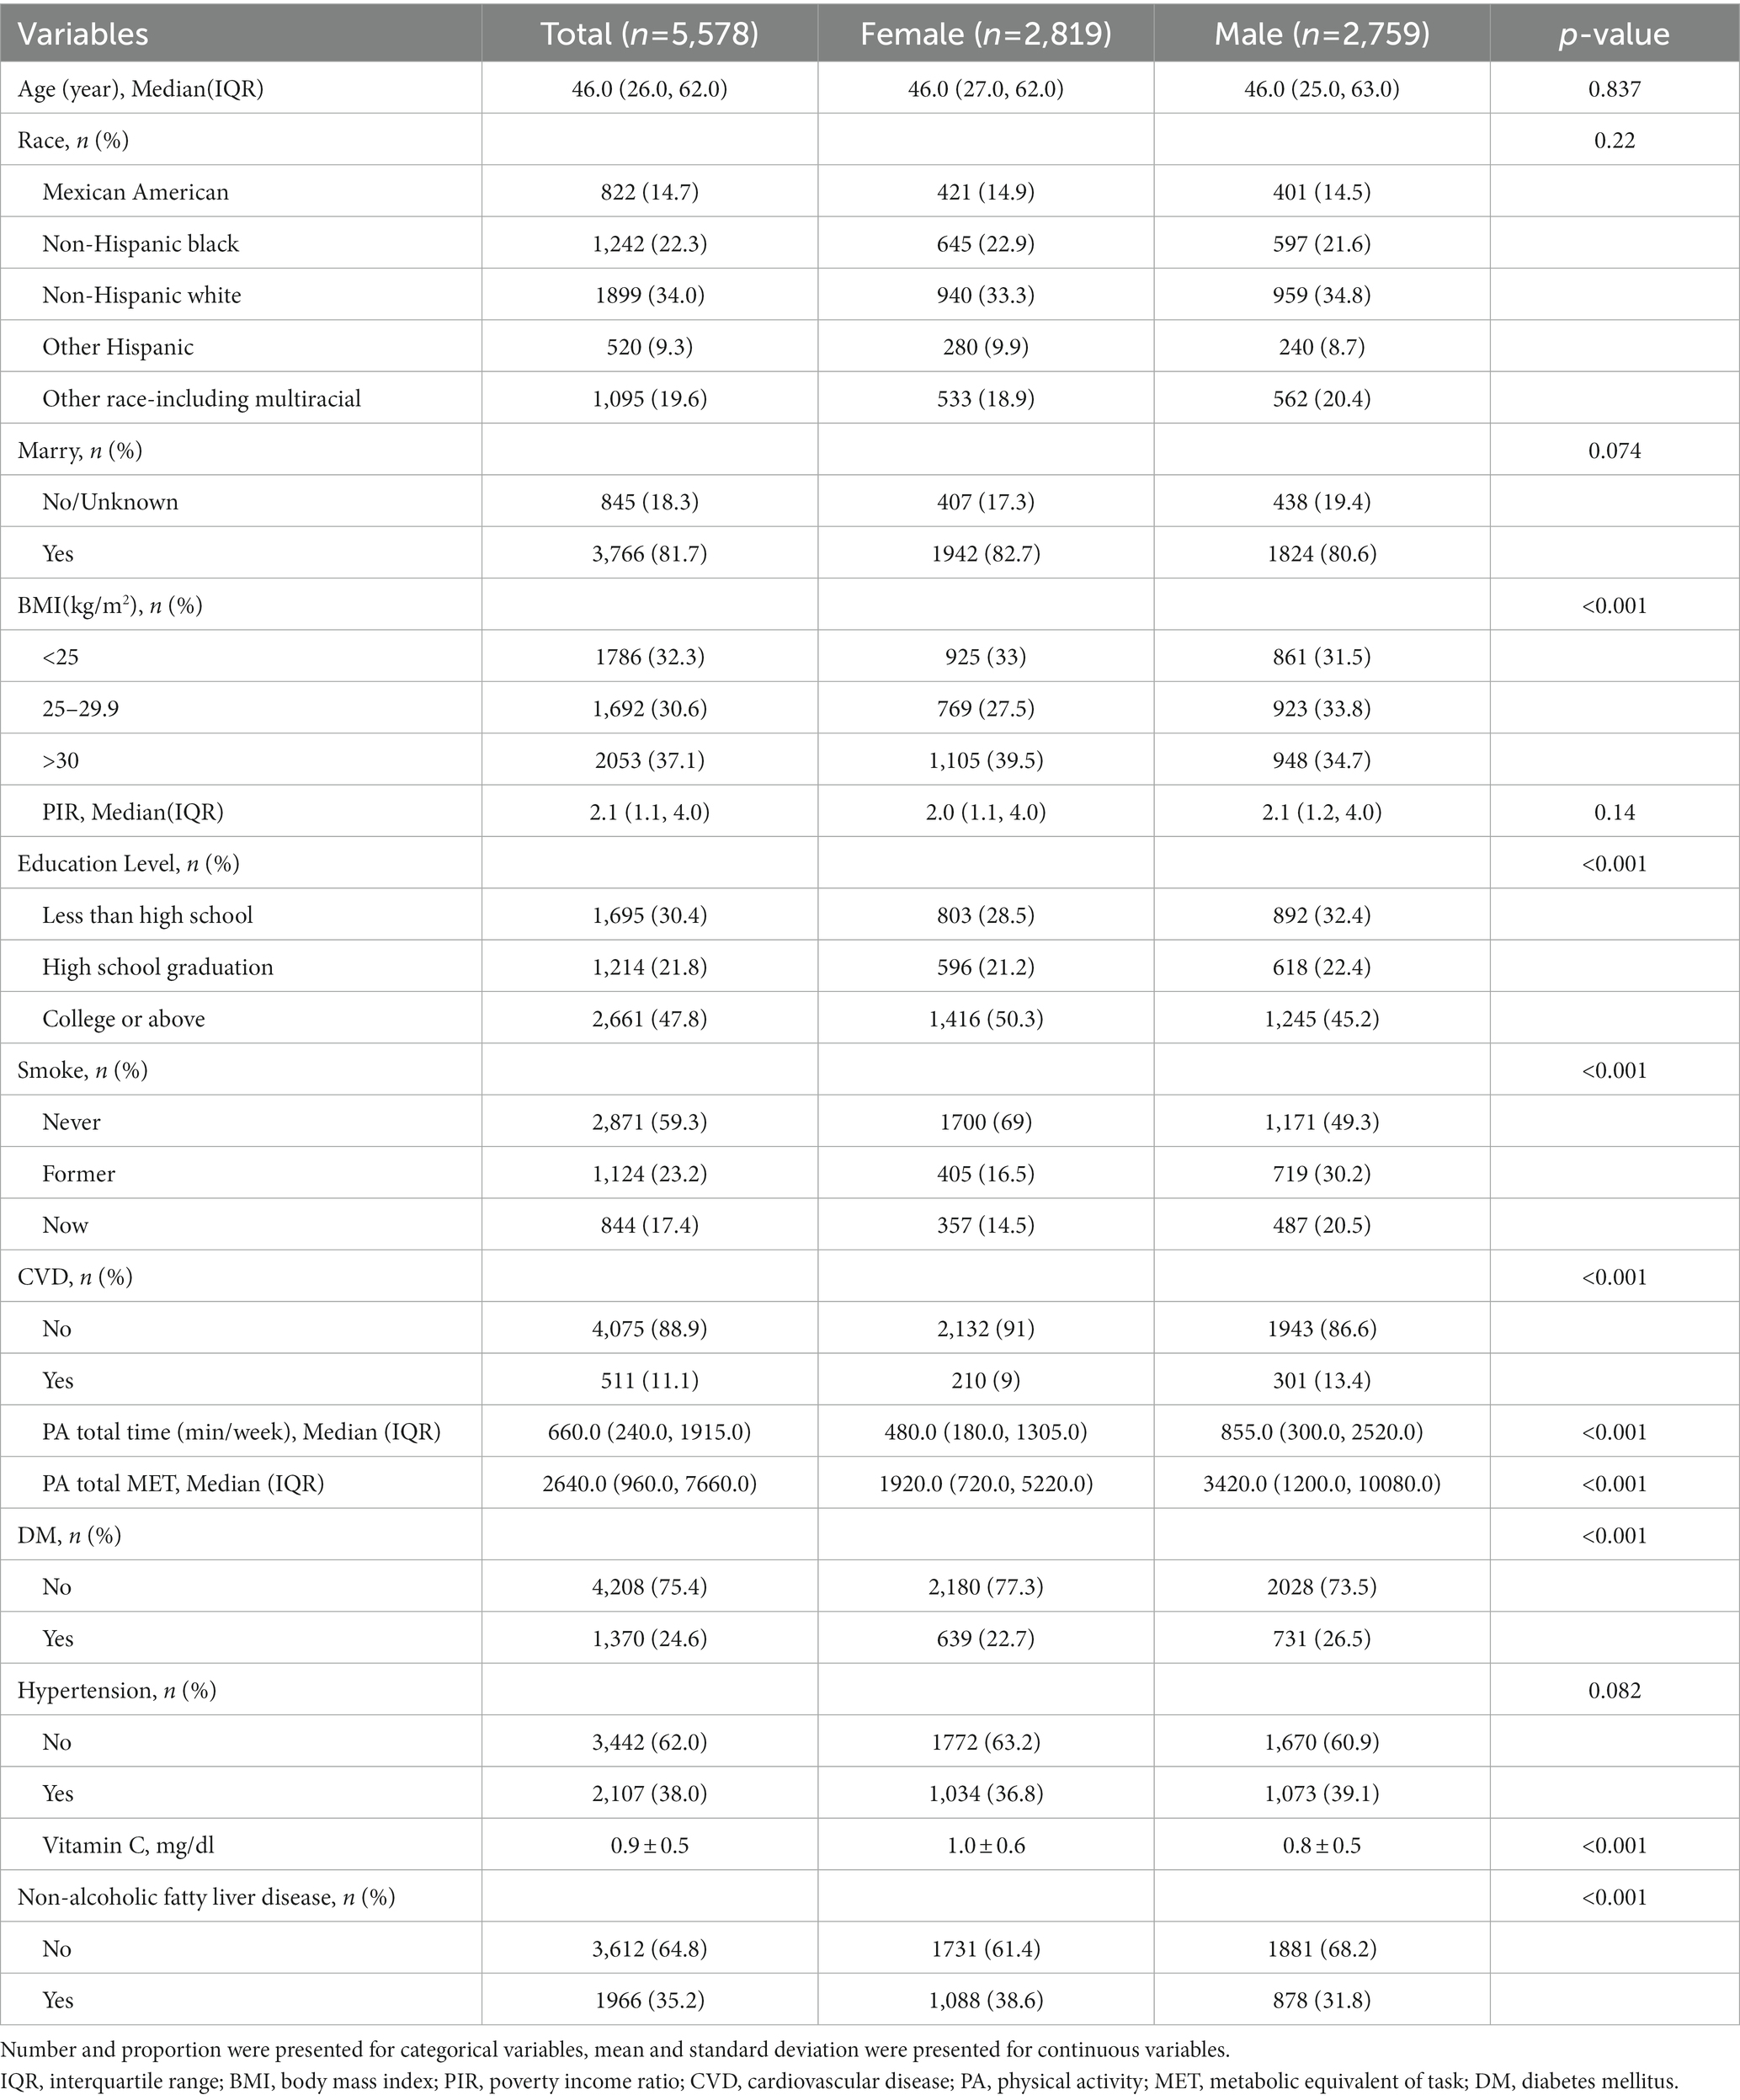
Table 1. Basic characteristic of study participants.
Table 2 illustrates the association between the serum level of vitamin C and the risk of NAFLD. The results indicated that the serum vitamin C levels had the weakest protective correlation for the risk of NAFLD in the crude model (OR: 0.71, 95% CI: 0.64 ~ 0.80, p < 0.001). After adjusting for age, gender, and race in the model 1, the association magnitude increased slightly (OR: 0.63, 95% CI: 0.55 ~ 0.71, p < 0.001). The model 2 on the basis of the model 1, which controlled marital status, BMI, PIR, education level, smoking status, CVD, PA total time, and PA total MET (OR: 0.66, 95% CI: 0.55 ~ 0.79, p < 0.001). The model 3 adjusted for diabetes and hypertension, the association was stable (OR = 0.66, 95% CI: 0.55 ~ 0.80, p < 0.001).
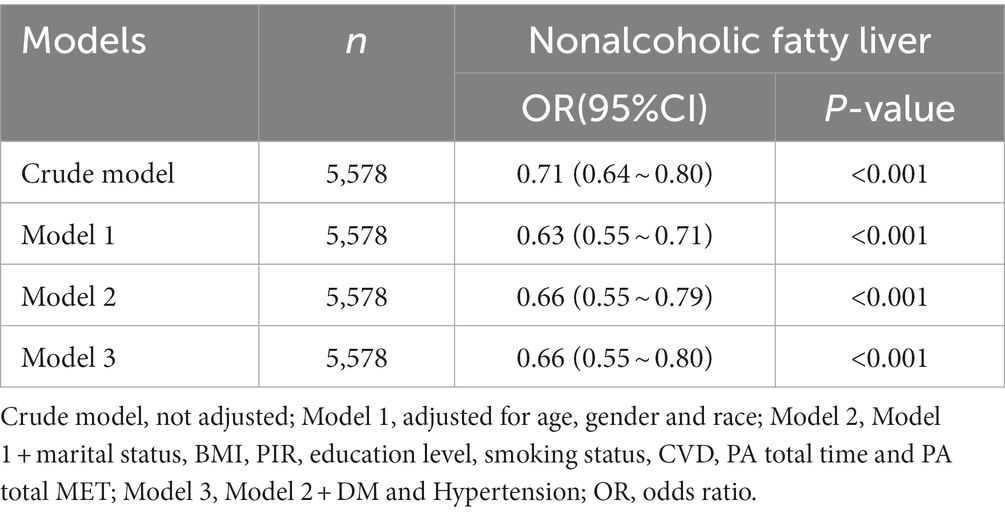
Table 2. Association between serum vitamin C level and NAFLD (All Participants), NHANES 2005–2006, 2017–2018.
Table 3 shows the association of different concentrations of serum vitamin C with the risk of developing NAFLD. Logistic Regression analysis found that in the four models with different regulatory factors, the risk of NAFLD was lower in the T3 group (≥1.06 mg/dl) than in the T1 group (≤0.69 mg/dl). The T3 risk decreased by 33.0% in crude model without controlled covariates (OR: 0.67, 95% CI: 0.59 ~ 0.77, p < 0.001). After adjusting for the covariates, the protective effect of serum vitamin C concentration on NAFLD risk was stable in the T3 group from model 1 to model 3 (Model 1: OR: 0.59, 95% CI: 0.51 ~ 0.67, p < 0.001; Model 2: OR: 0.59, 95% CI: 0.48 ~ 0.73, p < 0.001; Model 3: OR: 0.59, 95% CI: 0.48 ~ 0.74, p < 0.001), but the risk degree of NAFLD decreased slightly compared with model 1.
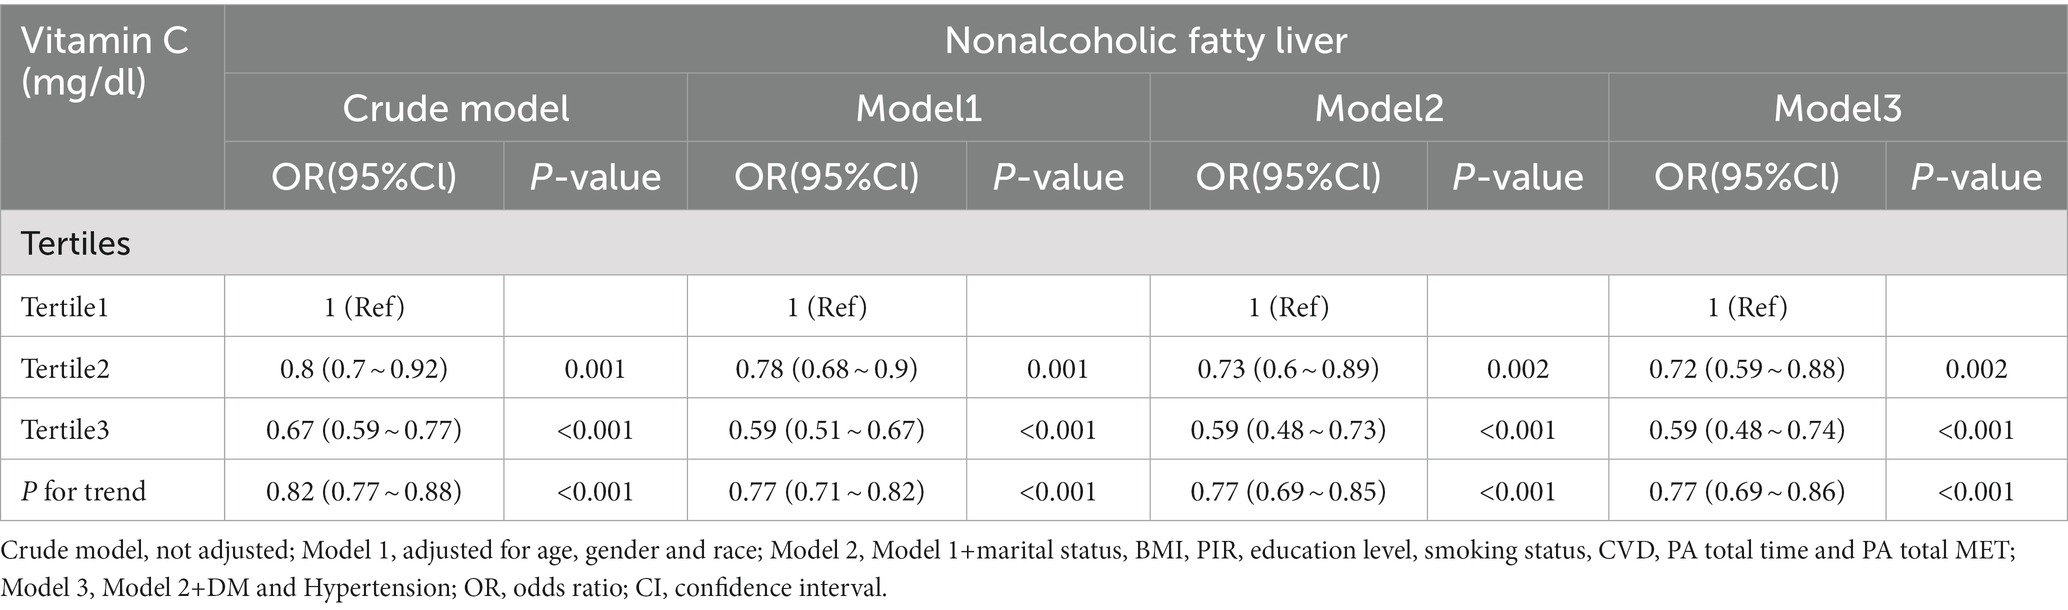
Table 3. Association between serum vitamin C levels and NAFLD (Tertiles), NHANES 2005–2006, 2017–2018.
Table 4 illustrates the correlation between serum vitamin C levels and the risk of NAFLD in women. In crude model, serum vitamin C has a certain protective effect against NAFLD (OR: 0.60, 95% CI: 0.51 ~ 0.71, p < 0.001). When adjusting for covariates such as age and race, the effect increased slightly (OR: 0.54, 95% CI: 0.46 ~ 0.64, p < 0.001). However, with more covariates of control, the effect gradually decreased. Of these, serum vitamin C and the risk of NAFLD showed the least effect in model 3 (OR: 0.63, 95% CI: 0.49 ~ 0.80, p < 0.001).
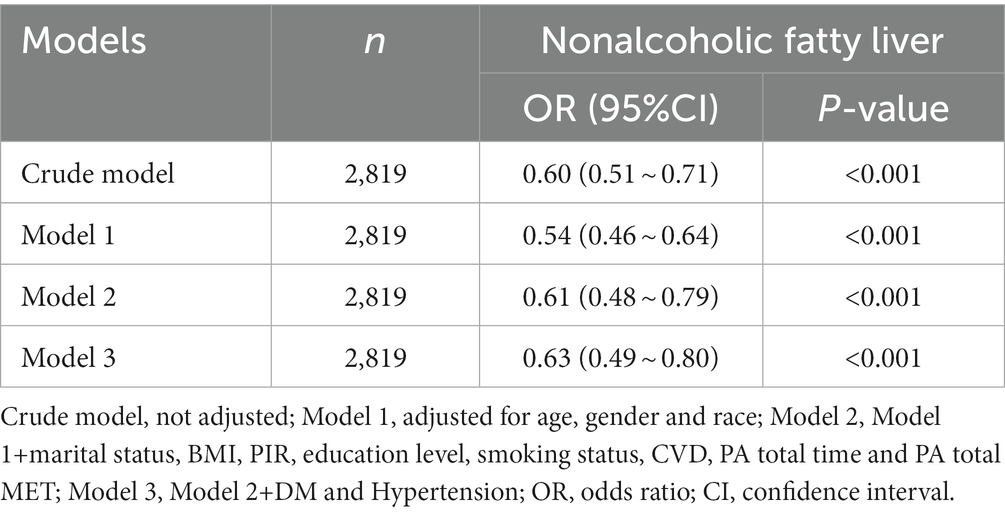
Table 4. Association of serum vitamin C levels and NAFLD in women.
Table 5 shows the relationship between serum vitamin C levels and NAFLD in men. In crude model, serum vitamin C showed the weakest protection against the risk of developing NAFLD (OR: 0.78, 95% CI: 0.65 ~ 0.93, p = 0,006). However, when adjusting for covariates, the level of protection has slightly increased (Model 1: OR: 0.75, 95% CI: 0.62 ~ 0.90, p = 0.002; Model 2: OR: 0.73, 95% CI: 0.56 ~ 0.97, p = 0.03; Model 3: OR: 0.73, 95% CI: 0.55 ~ 0.97, p = 0.029).
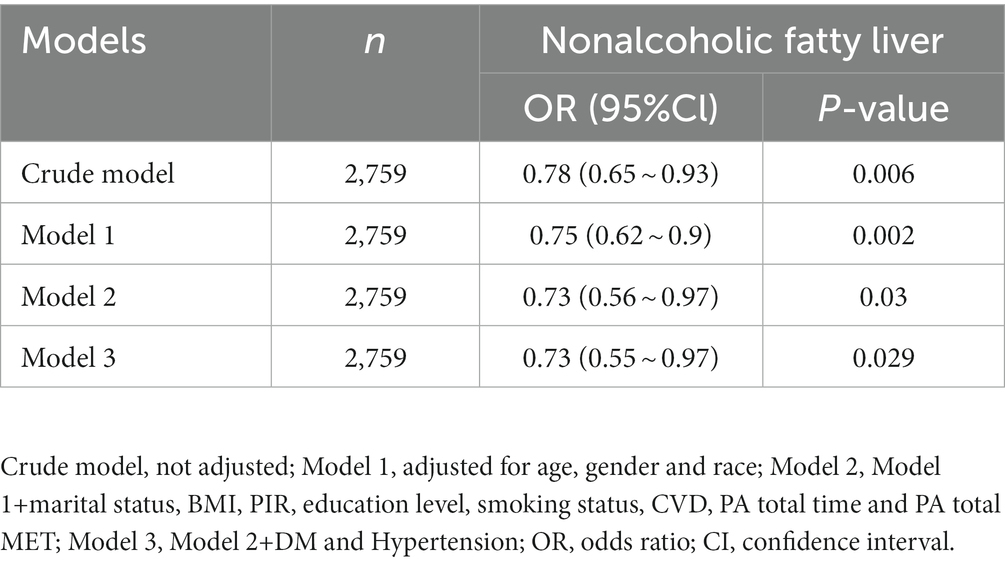
Table 5. Association of serum vitamin C levels and NAFLD in men.
Under the selection criteria for SNPs, only 8 SNPs remained for analyzing circulating vitamin C on NAFLD from Austee et al. and from FinnGen, respectively. The related excluding SNPs are described in the genetic instrument selection part and Supplementary Table S2. Our findings were unlikely to be affected by weak instruments, according to the F-statistics of the selected SNPs, which ranged from 34 to 420. The detail demonstrations above are presented in Supplementary Table S2.
In the IVW model, no causal association was suggested between a one SD change in the log-transformed levels of plasma vitamin C and the risk of NAFLD both in the primary analysis (OR: 0.82, 95% CI: 0.47 ~ 1.45, p = 0.502) and the secondary analysis (OR: 0.80, 95% CI: 0.53 ~ 1.22, p = 0.308). Results with similar direction and magnitude from two sources were observed in the other four methods (Figure 2; Supplementary Table S3). The leave-one-out analyzes of these results are presented in Supplementary Figure S1, which identified no SNPs strongly influencing the pooled estimates. The scatterplots are presented in Supplementary Figure S2. The forest plots are presented in Supplementary Figure S3, indicating the MR effect size of vitamin C on NAFLD. In the pleiotropic analysis, a slight sign of heterogeneity (Q = 12.42, p = 0.088; I2 = 39.1%) and no horizontal pleiotropy (Egger intercept = −0.022, p = 0.592) was detected in the primary analysis (Table 6). No heterogeneity (Q = 7.34, p = 0.394; I2 = 0%) and horizontal pleiotropy (Egger intercept = 0.006, p = 0.830) was found in the secondary analysis (Table 6).
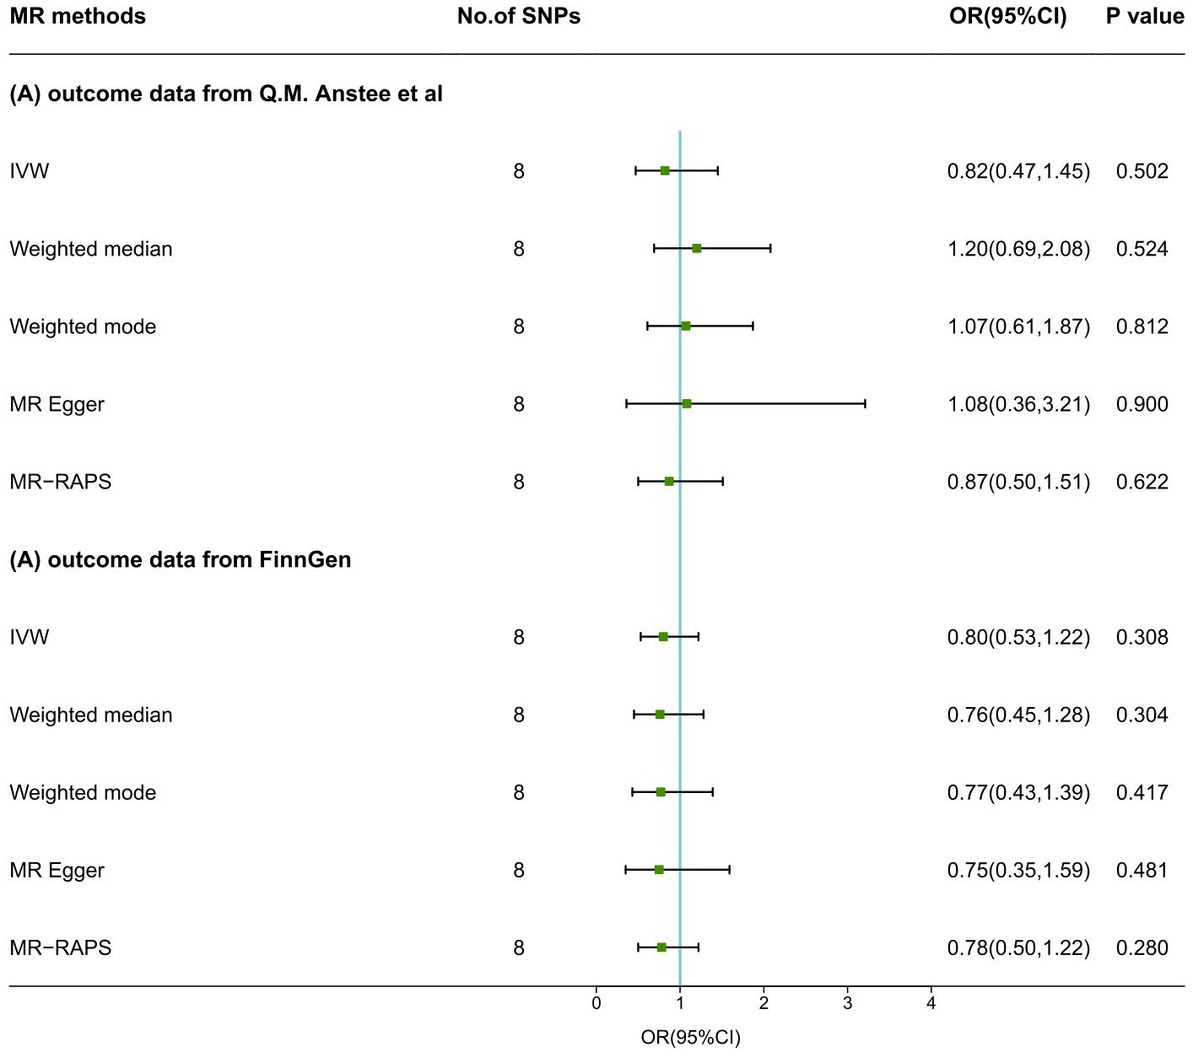
Figure 2. MR results of serum vitamin C levels on NAFLD. SNPs, single-nucleotide polymorphisms; MR, Mendelian randomization; IVW, inverse variance weighted; MR-RAPS, MR-Robust Adjusted Profile Score; OR, odds ratio; CI, confidence interval.
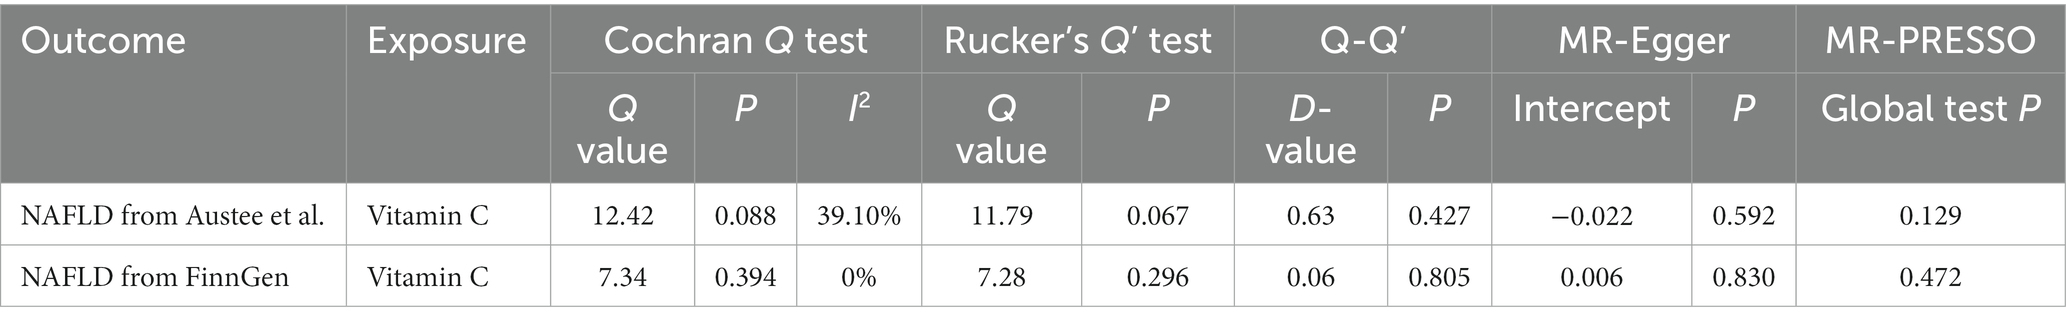
Table 6. Sensitivity analysis between vitamin C and NAFLD.
In this study, we combined a cross-sectional investigation using the NHANES 2005–2006 and 2017–2018, and a two-sample MR analysis with the summary GWAS data to investigate the relationship between serum vitamin C levels and NAFLD risks. Our observational research results indicated that serum vitamin C concentration were inversely related with the risk of NAFLD especially among females, but MR suggested that this association was not causal.
Observational studies focusing on the protective effect of increased serum vitamin C levels or vitamin C intake on NAFLD were numerous (11, 12, 30–35). However, compared with dietary recall questionnaires, serum vitamin C concentrations can measure physical vitamin C levels more exactly. Published studies have showed an inverse correlation of serum vitamin C concentrations with NAFLD risk (12, 31, 35), which was consistent with our results. It is worthy noted that our findings proved that the serum vitamin C was protective against NAFLD in both women and men, which was conflicting in previous studies reporting nonsignificant results among men (12, 35). The more significant protection effects among females may possibly be a result of the lower levels of mitochondrial oxidative stress and the higher levels of antioxidant enzymes (36).
Clinical trials were relatively deficient focusing on the protective effect of increased serum vitamin C levels or vitamin C intake on NAFLD. A 24-month randomized controlled trial (RCT) by Nobili et al. found that diet intervention and added physical activity were related with a critical improvement in abnormal liver histology and laboratory examination in pediatric NAFLD rather than the pharmacological treatment including alpha-tocopherol plus ascorbic acid (37). Similarly, another 12-month RCT indicated that dietary control and physical exercise can be responsible for a marked improvement of liver work and glucose metabolism in NAFLD children exceeding any antioxidant therapy (38). Nevertheless, a recent RCT suggested that a total of 12 weeks of vitamin C supplementation (particularly 1,000 mg/day) ameliorated liver function and glucose metabolism in NAFLD patients (39). All in all, whether traditional observational research with notable biases from unmeasured or uncontrolled confounders or the three mentioned small-scale RCTs with various study design and measurements can affect the accuracy of results. MR analysis can estimate the lifetime impact of serum vitamin C levels and not the impact at a specific time or a period, with GWAS datasets of large-scale sample. Therefore, it is genetically vital to study the association between serum vitamin C concentration and the risk of NAFLD.
Both the primary and secondary MR analyzes indicated that genetically predisposition to circulating vitamin C was not casually related with NAFLD, whereas our observational study also supported the inverse association between them. The specific relationship of vitamin C on NAFLD is currently unknown, but several potential biological mechanisms exist. On the one hand, as a commonly used antioxidant, vitamin C could reduce the generation of mitochondrial ROS, increase the levels of antioxidant enzymes, and improve the electron transport chain activity found in the liver (40). On the other hand, a study reported that long-term vitamin C deficiency can decelerate the development of NAFLD by inhibiting de novo lipogenesis (41). Such results illustrated the double impacts of vitamin C on NAFLD where its anti-oxidative impact may work in restraining NAFLD progression while scarce vitamin C can suppress de novo lipogenesis. Consequently, a null association between circulating vitamin C concentrations and the risk of NAFLD in MR studies might result from a counterbalance of anti-oxidative effect and lipid accumulation. The results were also consistent in our sensitivity analyzes, showing the validity of genetic instruments and the stable estimations.
The current study has several strengths. The primary advantage of this study is a large cross-sectional NHANES-based study combined with a two-sample MR analysis. Cross-sectional studies can explore the relationship between serum vitamin C concentration and NAFLD risk from the epidemiological level. MR study addresses the inherent impacts of residual confounding, reverse causality, and measurement errors in conventional epidemiological investigations. Besides, two separate GWAS datasets of NAFLD generated similar results, supporting the robustness of our MR analyzes. There are also some limitations that should be noted. First, because the diagnosis and treatment regimen of NAFLD are not clear, this study only determined hepatic steatosis and fibrosis by CAP in VCTE, and then defined NAFLD. Second, with sex-stratified difference observed in our cross-sectional study, we cannot further explore the sex-specified association in the MR study for the lack of available GWAS data. More studies are needed to investigate the sex-specific associations and confirm our findings between genetically predisposition to serum vitamin C levels and NAFLD risk. Third, this MR study is limited by the comparatively insufficient cases of NAFLD in both two sources. Thus, we cannot exclude weak correlation of genetically determined serum vitamin C levels with NAFLD. Finally, our cross-sectional and genetic data did not come from the same samples, because we employed people of European ancestry for the MR research and members of a multi-ethnic U.S. population for the cross-sectional investigation. To rule out potential confounding variables for population heterogeneity, future work is needed on the same ethnicity.
In summary, our study did not support a causality between genetically determined serum vitamin C and the risk of NAFLD, even though the cross-sectional study indicated a significant association between them. The observational study results could be biased due to uncontrolled confounders. Therefore, based on the current study, no strong evidence proved that higher serum vitamin C may be help in the prevention or treatment of NAFLD. Further studies with larger cases are required to confirm our conclusions.
The original contributions presented in the study are included in the article/Supplementary files, further inquiries can be directed to the corresponding authors.
J-LG and HW conceptualized the study, analyzed and interpreted the data, and revised and edited the manuscript. J-LG, HW, J-JiY, J-JuY, XT, and W-QH drafted the manuscript. J-LG, HW, R-YX, and G-MH provided advice for the project. W-QH and G-MH provided administrative support. All authors read and approved the final manuscript.
The authors wish to acknowledge the authors and participants of the involved GWAS for providing summary statistics data.
The authors declare that the research was conducted in the absence of any commercial or financial relationships that could be construed as a potential conflict of interest.
All claims expressed in this article are solely those of the authors and do not necessarily represent those of their affiliated organizations, or those of the publisher, the editors and the reviewers. Any product that may be evaluated in this article, or claim that may be made by its manufacturer, is not guaranteed or endorsed by the publisher.
The Supplementary material for this article can be found online at: https://www.frontiersin.org/articles/10.3389/fnut.2023.1162031/full#supplementary-material
1. Younossi, ZM, Koenig, AB, Abdelatif, D, Fazel, Y, Henry, L, and Wymer, M. Global epidemiology of nonalcoholic fatty liver disease-Meta-analytic assessment of prevalence, incidence, and outcomes. Hepatology. (2016) 64:73–84. doi: 10.1002/hep.28431
2. Chalasani, N, Younossi, Z, Lavine, JE, Diehl, AM, Brunt, EM, Cusi, K, et al. The diagnosis and management of non-alcoholic fatty liver disease: practice guideline by the American Association for the Study of Liver Diseases, American College of Gastroenterology, and the American Gastroenterological Association. Am J Gastroenterol. (2012) 107:811–26. doi: 10.1038/ajg.2012.128
3. European Association for the Study of the Liver. EASL-EASD-EASO clinical practice guidelines for the management of non-alcoholic fatty liver disease. Diabetologia. (2016) 59:1121–40. doi: 10.1007/s00125-016-3902-y
4. Buzzetti, E, Pinzani, M, and Tsochatzis, EA. The multiple-hit pathogenesis of non-alcoholic fatty liver disease (NAFLD). Metabolism. (2016) 65:1038–48. doi: 10.1016/j.metabol.2015.12.012
5. Friedman, SL, Neuschwander-Tetri, BA, Rinella, M, and Sanyal, AJ. Mechanisms of NAFLD development and therapeutic strategies. Nat Med. (2018) 24:908–22. doi: 10.1038/s41591-018-0104-9
6. Bielski, BH, Richter, HW, and Chan, PC. Some properties of the ascorbate free radical. Ann N Y Acad Sci. (1975) 258:231–7. doi: 10.1111/j.1749-6632.1975.tb29283.x
7. Camarena, V, and Wang, G. The epigenetic role of vitamin C in health and disease. Cell Mol Life Sci. (2016) 73:1645–58. doi: 10.1007/s00018-016-2145-x
8. Milani, GP, Macchi, M, and Guz-Mark, A. Vitamin C in the treatment of COVID-19. Nutrients. (2021) 13:1172. doi: 10.3390/nu13041172
9. Pullar, JM, Carr, AC, and Vissers, MCM. The roles of vitamin C in skin health. Nutrients. (2017) 9:866. doi: 10.3390/nu9080866
10. Evans, JR, and Lawrenson, JG. Antioxidant vitamin and mineral supplements for preventing age-related macular degeneration. Cochrane Database Syst Rev. (2017) 7:Cd000253. doi: 10.1002/14651858.CD000253.pub4
11. Fageeh, HN, Fageeh, HI, Prabhu, A, Bhandi, S, Khan, S, and Patil, S. Efficacy of vitamin C supplementation as an adjunct in the non-surgical management of periodontitis: a systematic review. Syst Rev. (2021) 10:5. doi: 10.1186/s13643-020-01554-9
12. Xie, Z-Q, Li, H-X, Tan, W-L, Yang, L, Ma, X-W, Li, W-X, et al. Association of Serum Vitamin C with NAFLD and MAFLD among adults in the United States. Front Nutr. (2021) 8:795391. doi: 10.3389/fnut.2021.795391
13. Ahluwalia, N, Dwyer, J, Terry, A, Moshfegh, A, and Johnson, C. Update on NHANES dietary data: focus on collection, release, analytical considerations, and uses to inform public policy. Adv Nutr. (2016) 7:121–34. doi: 10.3945/an.115.009258
14. Sekula, P, Del Greco, MF, Pattaro, C, and Köttgen, A. Mendelian randomization as an approach to assess causality using observational data. J Am Soc Nephrol. (2016) 27:3253–65. doi: 10.1681/ASN.2016010098
15. Didelez, V, and Sheehan, N. Mendelian randomization as an instrumental variable approach to causal inference. Stat Methods Med Res. (2007) 16:309–30. doi: 10.1177/0962280206077743
16. Anstee, QM, Darlay, R, Cockell, S, Meroni, M, Govaere, O, Tiniakos, D, et al. Genome-wide association study of non-alcoholic fatty liver and steatohepatitis in a histologically characterised cohort. J Hepatol. (2020) 73:505–15. doi: 10.1016/j.jhep.2020.04.003
17. FinnGen. {FinnGen}. Documentation of R8 release. (2022). Available at: https://finngen.gitbook.io/documentation/. (Accessed January 8, 2023).
18. Kurki, MI, Palta, P, Sipilä, TP, Kristiansson, K, Donner, K, Reeve, MP, et al. FinnGen: unique genetic insights from combining isolated population and national health register data. Med Rxiv. (2022) 2022:22271360. doi: 10.1101/2022.03.03.22271360
19. Zheng, J-S, Ja, L, Sofianopoulou, E, Imamura, F, Stewart, ID, Day, FR, et al. Plasma vitamin C and type 2 diabetes: genome-wide association study and Mendelian randomization analysis in European populations. Diabetes Care. (2021) 44:98–106. doi: 10.2337/dc20-1328
20. Burgess, S, Butterworth, A, and Thompson, SG. Mendelian randomization analysis with multiple genetic variants using summarized data. Genet Epidemiol. (2013) 37:658–65. doi: 10.1002/gepi.21758
21. Bowden, J, Davey Smith, G, and Burgess, S. Mendelian randomization with invalid instruments: effect estimation and bias detection through egger regression. Int J Epidemiol. (2015) 44:512–25. doi: 10.1093/ije/dyv080
22. Zhao, Q, Wang, J, Hemani, G, Bowden, J, and Small, DS. Statistical inference in two-sample summary-data Mendelian randomization using robust adjusted profile score. Ann Stat. (2020) 48:1742–69. doi: 10.1214/19-AOS1866
23. Hartwig, FP, Davey Smith, G, and Bowden, J. Robust inference in summary data Mendelian randomization via the zero modal pleiotropy assumption. Int J Epidemiol. (2017) 46:1985–98. doi: 10.1093/ije/dyx102
24. Bowden, J, Davey Smith, G, Haycock, PC, and Burgess, S. Consistent estimation in Mendelian randomization with some invalid instruments using a weighted median estimator. Genet Epidemiol. (2016) 40:304–14. doi: 10.1002/gepi.21965
25. Kamat, MA, Blackshaw, JA, Young, R, Surendran, P, Burgess, S, Danesh, J, et al. Pheno scanner V2: an expanded tool for searching human genotype-phenotype associations. Bioinformatics. (2019) 35:4851–3. doi: 10.1093/bioinformatics/btz469
26. Verbanck, M, Chen, C-Y, Neale, B, and Do, R. Detection of widespread horizontal pleiotropy in causal relationships inferred from Mendelian randomization between complex traits and diseases. Nat Genet. (2018) 50:693–8. doi: 10.1038/s41588-018-0099-7
27. Bowden, J, Del Greco, MF, Minelli, C, Davey Smith, G, Sheehan, N, and Thompson, J. A framework for the investigation of pleiotropy in two-sample summary data Mendelian randomization. Stat Med. (2017) 36:1783–802. doi: 10.1002/sim.7221
28. Hemani, G, Tilling, K, and Davey, SG. Orienting the causal relationship between imprecisely measured traits using GWAS summary data. PLoS Genet. (2017) 13:e1007081. doi: 10.1371/journal.pgen.1007081
29. Palmer, TM, Lawlor, DA, Harbord, RM, Sheehan, NA, Tobias, JH, Timpson, NJ, et al. Using multiple genetic variants as instrumental variables for modifiable risk factors. Stat Methods Med Res. (2012) 21:223–42. doi: 10.1177/0962280210394459
30. Wei, J, Lei, G-H, Fu, L, Zeng, C, Yang, T, and Peng, S-F. Association between dietary vitamin C intake and non-alcoholic fatty liver disease: a cross-sectional study among middle-aged and older adults. PLoS One. (2016) 11:e0147985. doi: 10.1371/journal.pone.0147985
31. Stenzel, AP, Carvalho, R, Jesus, P, Bull, A, Pereira, S, Saboya, C, et al. Serum antioxidant associations with metabolic characteristics in metabolically healthy and unhealthy adolescents with severe obesity: an observational study. Nutrients. (2018) 10:150. doi: 10.3390/nu10020150
32. Ivancovsky-Wajcman, D, Fliss-Isakov, N, Salomone, F, Webb, M, Shibolet, O, Kariv, R, et al. Dietary vitamin E and C intake is inversely associated with the severity of nonalcoholic fatty liver disease. Dig Liver Dis. (2019) 51:1698–705. doi: 10.1016/j.dld.2019.06.005
33. Luo, X, Zhang, W, He, Z, Yang, H, Gao, J, Wu, P, et al. Dietary vitamin C intake is associated with improved liver function and glucose metabolism in Chinese adults. Front Nutr. (2021) 8:779912. doi: 10.3389/fnut.2021.779912
34. Hu, Z, Li, Y, Ma, B, Lei, S, and Wang, X. Iron metabolism mediates the relationship between vitamin C and hepatic steatosis and fibrosis in NAFLD. Front Nutr. (2022) 9:952056. doi: 10.3389/fnut.2022.952056
35. Jiang, Y, Cao, H, Chen, X, Yu, G, Song, C, Duan, H, et al. Associations of serum folate and vitamin C levels with metabolic dysfunction-associated fatty liver disease in US adults: a nationwide cross-sectional study. Front Public Health. (2022) 10:1022928. doi: 10.3389/fpubh.2022.1022928
36. Ostan, R, Monti, D, Gueresi, P, Bussolotto, M, Franceschi, C, and Baggio, G. Aging and longevity in humans: an update of an intriguing/neglected. Clin Sci. (2016) 130:1711–25. doi: 10.1042/CS20160004
37. Nobili, V, Manco, M, Devito, R, Di Ciommo, V, Comparcola, D, Sartorelli, MR, et al. Lifestyle intervention and antioxidant therapy in children with nonalcoholic fatty liver disease: a randomized, controlled trial. Hepatology. (2008) 48:119–28. doi: 10.1002/hep.22336
38. Nobili, V, Manco, M, Devito, R, Ciampalini, P, Piemonte, F, and Marcellini, M. Effect of vitamin E on aminotransferase levels and insulin resistance in children with non-alcoholic fatty liver disease. Aliment Pharmacol Ther. (2006) 24:1553–61. doi: 10.1111/j.1365-2036.2006.03161.x
39. He, Z, Li, X, Yang, H, Wu, P, Wang, S, Cao, D, et al. Effects of Oral vitamin C supplementation on liver health and associated parameters in patients with non-alcoholic fatty liver disease: a randomized clinical trial. Front Nutr. (2021) 8:745609. doi: 10.3389/fnut.2021.745609
40. Ezhilarasan, D, and Lakshmi, T. A molecular insight into the role of antioxidants in nonalcoholic fatty liver diseases. Oxidative Med Cell Longev. (2022) 2022:1–15. doi: 10.1155/2022/9233650
Keywords: vitamin C, Mendelian randomization, NHANES, NAFLD, cross-sectional study
Citation: Wu H, Guo J-L, Yao J-J, Yu J-J, Xia R-Y, Huang W-Q, Tang X and He G-M (2023) Serum vitamin C levels and risk of non-alcoholic fatty liver disease: results from a cross-sectional study and Mendelian randomization analysis. Front. Nutr. 10:1162031. doi: 10.3389/fnut.2023.1162031
Edited by:
Dimitra Rafailia Bakaloudi, University of Washington, United StatesReviewed by:
Laleh Mahmoudi, Shiraz University of Medical Sciences, IranCopyright © 2023 Wu, Guo, Yao, Yu, Xia, Huang, Tang and He. This is an open-access article distributed under the terms of the Creative Commons Attribution License (CC BY). The use, distribution or reproduction in other forums is permitted, provided the original author(s) and the copyright owner(s) are credited and that the original publication in this journal is cited, in accordance with accepted academic practice. No use, distribution or reproduction is permitted which does not comply with these terms.
*Correspondence: Guang-Ming He, Z3lleWhnbUAxNjMuY29t; Xuan Tang, MTAwMjUwMTIxM0BxcS5jb20=
Disclaimer: All claims expressed in this article are solely those of the authors and do not necessarily represent those of their affiliated organizations, or those of the publisher, the editors and the reviewers. Any product that may be evaluated in this article or claim that may be made by its manufacturer is not guaranteed or endorsed by the publisher.
Research integrity at Frontiers
Learn more about the work of our research integrity team to safeguard the quality of each article we publish.