- Department of Colorectal Surgery, The Second Affiliated Hospital and Yuying Children’s Hospital of Wenzhou Medical University, Wenzhou, China
Introduction: Previous observational studies have demonstrated the relationship between leisure sedentary behavior, physical activity, and nonalcoholic liver disease (NAFLD). However, whether these associations are causal or confounding factors remains unclear.
Methods: Pooled genetic data from the UK Biobank and other large genome-wide association studies (GWAS) were used to extract instrumental variables representing sedentary television watching, computer use, driving, vigorous physical activity (VPA), and moderate-to-vigorous physical activity (MVPA). The two-sample Mendelian randomization (MR) method was used to explain the causal relationship between them and NAFLD. The inverse variance of the weighted method was used as the main analysis method, and MR-Egger, weighted median, MR-PRESSO, and other supplementary methods were also used. A sensitivity analysis was also performed. Simultaneously, the common risk factors for NAFLD were further analyzed for potential mediating associations.
Results: We observed that sedentary television viewing (odds ratio (OR): 1.84; 95% confidence interval (CI): 1.09–3.10; p = 0.021) and genetically predicted VPA duration (OR: 0.0033; 95% CI: 0.000015–0.70; p = 0.036) were suggestively associated with the risk of NAFLD. Using a computer (OR: 1.51; 95% CI: 0.47–4.81; p = 0.484), driving (OR: 0.78; 95% CI: 0.05–11.94; p = 0.858), and MVPA time (OR: 0.168; 95% CI: 0.01–2.81; p = 0.214) were not significantly associated with NAFLD. The role of heterogeneity versus pleiotropy was limited in all the analyses.
Discussion: This study supports the association between sedentary television watching and an increased risk of NAFLD, along with vigorous physical activity as a possible protective factor for NAFLD.
1. Introduction
Nonalcoholic fatty liver disease (NAFLD) is an important chronic liver disease worldwide. NAFLD is a general term for a series of diseases ranging from hepatic steatosis to nonalcoholic steatohepatitis and may even develop into cirrhosis and hepatocellular carcinoma, among which the most common type is NAFLD (1). The incidence of NAFLD has increased globally in recent years. In developed countries, it was the most common cause of chronic liver disease, and its prevalence and mortality rate due to liver disease are gradually increasing in many developing countries. The prevalence of NAFLD in China has even reached 29.2% (2).
Moreover, with the increasing prevalence of NAFLD, there is a corresponding increase in the economic and social burden on society. Research on risk factors can provide more information for the prevention of NAFLD. Previous observational studies have discovered that risk factors for NAFLD include obesity, metabolic abnormalities, smoking, drinking, and waist circumference (3, 4). However, the above factors still need to be further confirmed owing to the potential confounding and reverse causality inherent in observational studies.
Leisure sedentary behavior (LSB) refers to waking body behaviors that rely on lying down and sitting to maintain a low metabolic state (energy expenditure ≤ 1.5 metabolic equivalents) of body posture. This includes watching television (TV), using computers, driving, etc. Previous studies have discovered that prolonged sitting is associated with an increased risk of death from chronic diseases, whereas high physical activity (PA) levels can reduce this risk (5). In a study based on Physical Activity Guidelines for Americans, those who sitting more than 8 h/day were associated with increased risk for NAFLD, indicate that sedentary behavior is an independent predictor of NAFLD (6). A recent retrospective cohort study reported that regardless of confounding factors such as age, sex, energy intake, occupational PA, smoking, and alcohol consumption, sustained TV time was associated with a 2.3-fold increased risk of fatty liver disease (95% confidence interval (CI) 1.2–4.5) (7). Also, a study in China found that, the overall computer/mobile devices usage time levels and overall NAFLD, with a 1.99-fold (95% CI 1.29–3.05) increase in the prevalence of NAFLD in participants who viewed a screen ≥10 h/d compared to those who viewed a screen<1 h/d (8). PA cannot be ignored in terms of sedentary behavior, and the relationship between the two is very close. Long periods of sedentary behavior tend to indicate less PA. Many studies and reviews have shown that lack of PA and excess nutrition are the root causes of NAFLD (9). However, due to the lack of prospective studies on the relationship between LSB, PA, and the incidence of NAFLD, causal inference between LSB and NAFLD cannot be correctly established because retrospective studies are susceptible to potential confounding factors. Therefore, we inferred a causal relationship between LSB, PA, and NAFLD through a Mendelian-randomization (MR) study.
As an epidemiological method, MR has strong power to infer causality. It uses genetic variation as an instrumental variable (IV) for exposure and outcome, usually single-nucleotide polymorphisms (SNPs). The IVs are derived from large genome-wide association studies (GWAS) databases. However, these genetic variants are randomly assigned in deceleration division, which can reduce the influence of potential confounding factors and reverse causality and more directly prove the causal relationship between exposure and outcome (10, 11). Moreover, with the increase and accumulation of GWAS studies in recent years, the acquisition of MR-design data has become increasingly common and accurate.
In this study, we identified SNPs associated with NAFLD, LSB, and PA from a recent large GWAS dataset and explored the causal relationship between NAFLD, LSB, and PA using a two-sample MR method.
2. Materials and methods
2.1. Study design
SNPs were used as IVs for LSB in the MR study. Exposure and outcome SNP data were obtained from large GWAS databases. Three basic principles of MR research (Figure 1) were followed in the study design (12). The basic steps included the following: (1) selection of IVs related to exposure, (2) finding instrumental SNPs representing outcomes from GWAS datasets, (3) extracting and harmonising exposure and outcome data, (4) MR analysis, and (5) evaluation and analysis of MR results. All data in this study are publicly available, and relevant ethical approval and informed consent have been provided in previous studies.
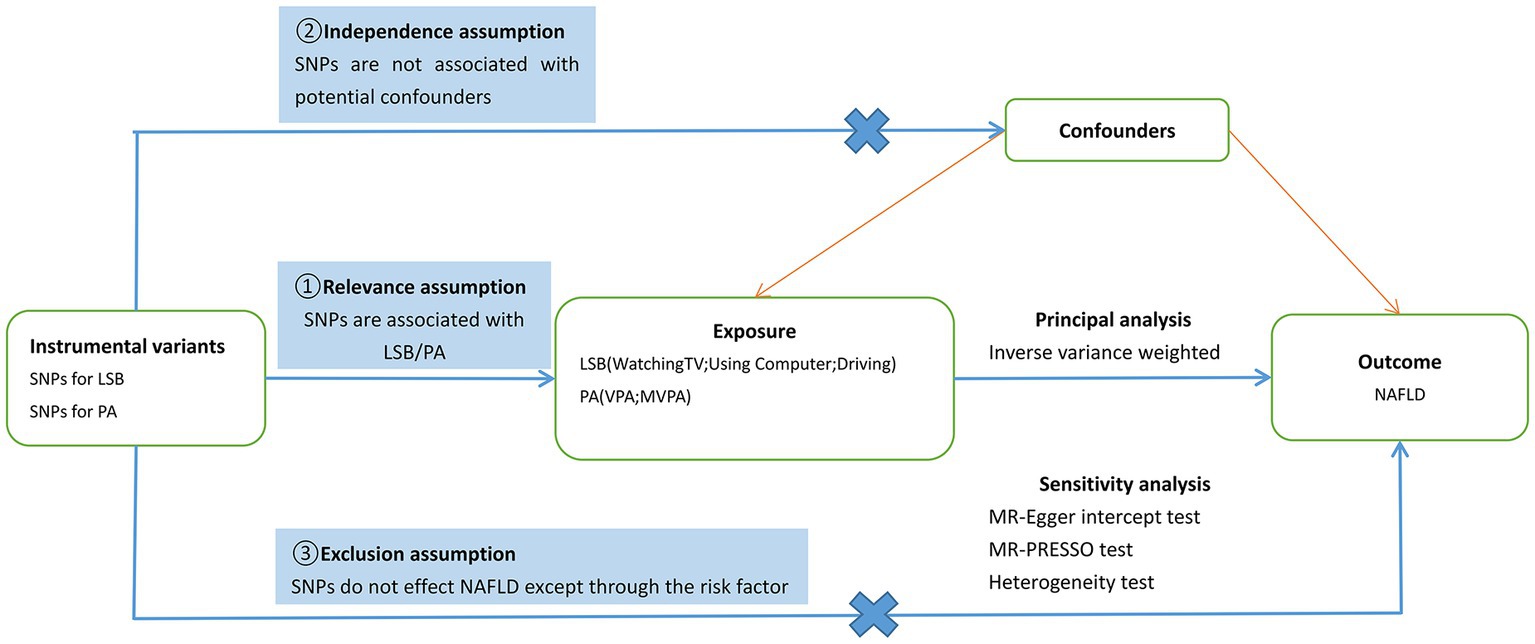
Figure 1. Schematic diagram of the present Mendelian randomization study. SNPs, single nucleotide polymorphisms; LSB, Leisure Sedentary Behavior; PA, Physical Activity; NAFLD, nonalcoholic fatty liver disease; VPA, vigorous physical activity; MVPA, moderate-to-vigorous physical activity; MR-PRESSO, MR Pleiotropy Residual Sum and Outlier.
2.2. Data sources of exposure samples
In this study, exposure included LSB and PA. The SNPs associated with sedentary behavior were identified from a recent large GWAS dataset of 422,218 European individuals; 45.7% were men, and 54.3% were women (13). LSB in this study included three specific behaviors: watching TV, using computers, and driving. Results were obtained in the form of a questionnaire in which participants answered the following questions: “How many hours do you spend watching TV on a typical day?,” “How many hours do you spend using the computer on a typical day?,” “How many hours do you spend driving on a typical day?.” The mean age of the participants was 57.4 years (standard deviation (SD): 8.0), and the data obtained showed an average of 2.8 h per day of TV watching (SD: 0.8), 1.0 h per day of recreational computer use (SD: 1.2), and 0.9 h per day of driving (SD: 1.0).
PA SNPs were derived from a UK Biobank GWAS study, which included 377,234 individuals from Europe (14). In this study, PA mainly included moderate-to-vigorous PA (MVPA) and vigorous PA (VPA). Relevant data were obtained using a touchscreen questionnaire, similar to the International Physical Activity Questionnaire (15). MVPA and VPA data were obtained by recording and calculating the responses to the following questions: “How many days did you do 10 min or more of vigorous physical activity in a typical week? (These are activities that make you sweat or breathe hard, such as fast cycling, aerobics, heavy lifting),” “In a typical week, how many days did you do 10 min or more of moderate physical activities like carrying light loads, cycling at a normal pace? (Do not include walking).”
2.3. IV selection
We screened for effective IVs using the following steps: (1) the genome-wide significance level was set at p < 5 × 10⁻⁸ to meet the first key hypothesis; that is, these SNPs were significantly associated with exposure (16), (2) Linkage disequilibrium clumping (r2 < 0.001, region size = 10,000 kb) was performed to ensure the independence of SNPs (17), (3) R2 and F-statistics were used to test the interpretation and strength of IVs, and the low-intensity IVs (F-statistics < 10) were removed. R2 = 2 × EAF × (1 − EAF) × betaˆ2/(2 × EAF × (1 − EAF) × betaˆ2) + 2 × EAF × (1 − EAF) × se × N × betaˆ2, F = R2 × (N−2)/(1−R2) (18, 19), (4) The phenotypes of SNPs were queried using PhenoScanner V2, and SNPs closely related to confounding factors (such as body mass index (BMI), body weight, waist circumference, hypertension, and other risk factors for NAFLD) were excluded to meet the second hypothesis (20). This guarantees the exclusivity of IVs. In this study, 36, 11, 0, 1, and 4 confounding SNPs associated with TV watching, computer use, driving, VPA, and MVPA, were removed, respectively. The specific information of the excluded SNPs is presented in Supplementary Table S2, and (5) For the third key hypothesis, we excluded SNPs that were correlated closely with the outcome (p < 5 × 10⁻⁸ (21)); Finally, 78, 22, 2, 5, and 4 SNPs were found to be associated with TV watching, computer use, driving, VPA, and MVPA. Detailed information regarding the SNPs is provided in Supplementary Table S3. For SNPs in the exposure data that could not be extracted from the outcome data, we used proxy SNPs with a cutoff R2 > 0.8. These SNPs were discarded if no proxies were identified.
2.4. Data sources of outcome samples
IVs for outcomes were derived from a large GWAS dataset of 1,483 European NAFLD cases and matching 17,781 controls. Their mean age was 50.1 (SD: 13.0); 47.3% were women, and 52.7% were men. The diagnostic criterion for NAFLD is pathological examination after liver biopsy (22).
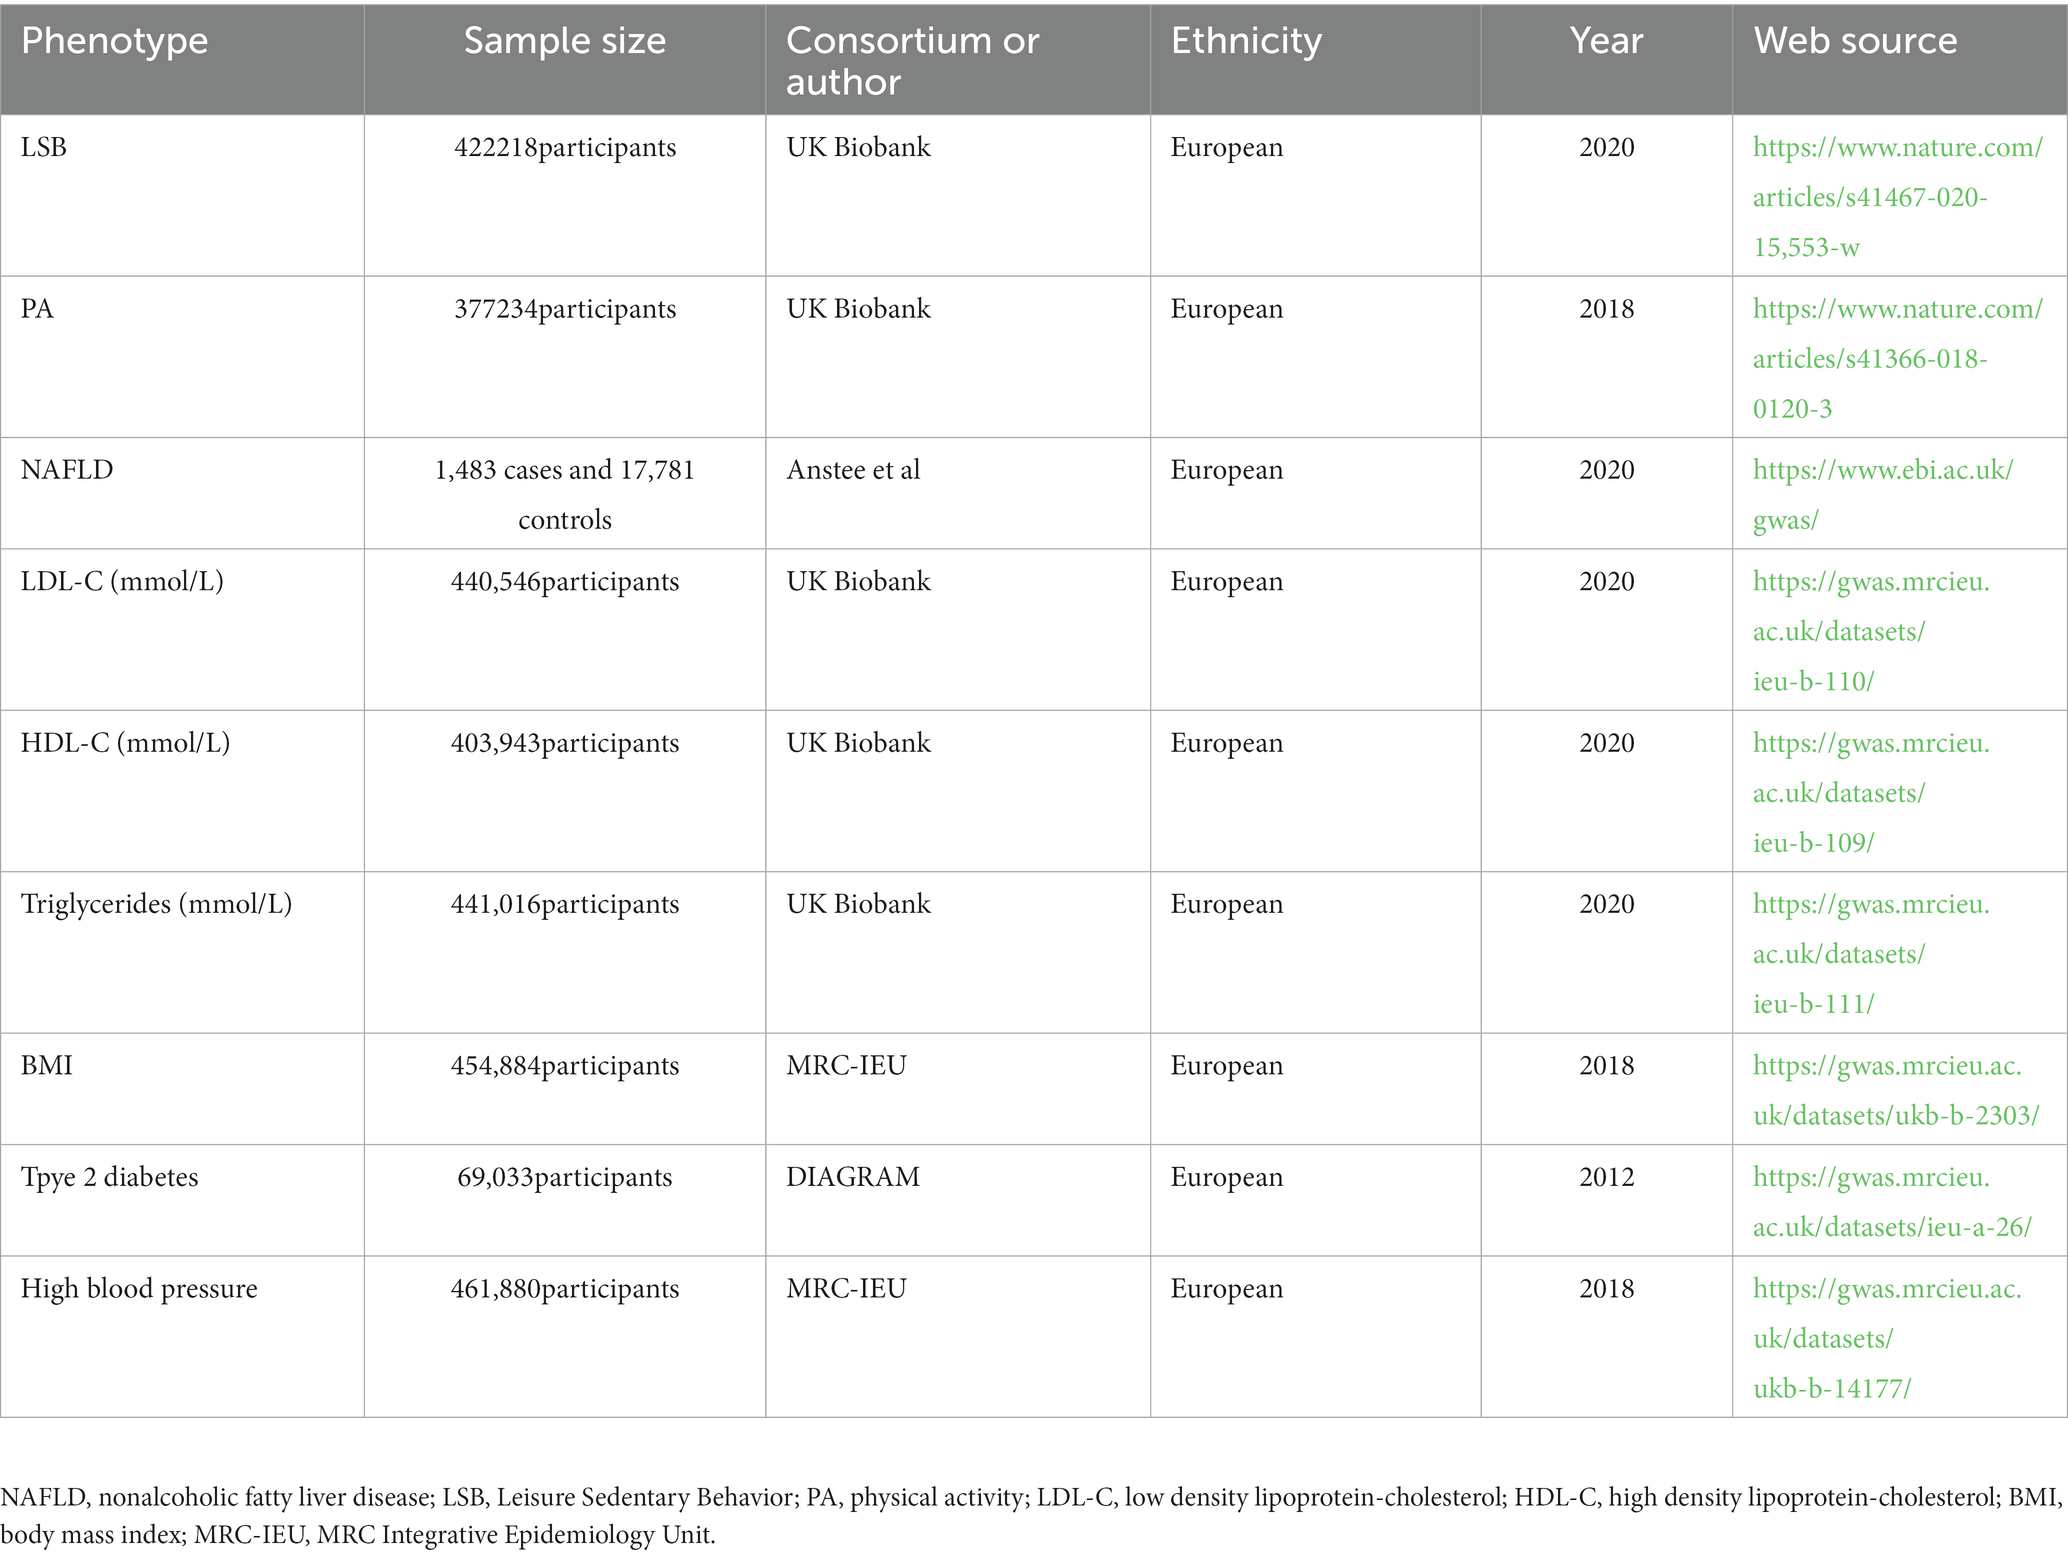
In addition to exploring the relationship between LSB, PA, and NAFLD, the causal relationship between LSB, PA, and the risk factors for NAFLD was also studied. These risk factors mainly include triglyceride, LDL-C, HDL-C, type 2 diabetes, BMI, and hypertension. GWAS related to lipid traits, including triglyceride, LDL-C, and HDL-C, were obtained from the UK Biobank (23). The GWAS dataset associated with BMI and hypertension was obtained from the MRC Integrative Epidemiology Unit database. Related to diabetes, GWAS comes from DIAGRAM (24). All SNPs of the above NAFLD risk factors were searched for using the IEU OpenGWAS project platform.1 Ethical approval was obtained from each GWAS dataset. The specific information of the datasets is presented in Table 1.
2.5. Statistical analysis
In this MR Study, the primary statistical analysis method used was the inverse variance of the weighted method (IVW). It provides the main causal relationship between SNP exposure and outcome. Moreover, as long as SNPs are valid and do not show pleiotropy, IVW is the most commonly used and convincing MR statistical method (25). We also used the weighted median (26), MR-Egger (27), simple median, MR-RAPS (28), and MR-PRESSO (29) for statistical analysis. When there is heterogeneity among SNPs, IVW (multiplicative random effects) is more reliable than IVW (fixed effect) (30). The weighted median method estimates the MR for each IV by assuming that at least 50% of IVs are valid. The MR-Egger is mainly used to evaluate horizontal pleiotropy. When the intercept is off 0, there is directional pleiotropy, and when there is horizontal pleiotropy, the slope of the MR Egger regression is a relatively effective MR estimate (27). In the IVW analysis, MR-RAPS was corrected for horizontal pleiotropy using robust adjusted profile scores (28). We also used MR-PRESSO, which can identify outliers of pleiotropy, and then removed abnormal SNPs to obtain a relatively accurate MR estimate without bias (29). Finally, we used leave-one-out analysis to assess the effects of individual SNPs on the MR assessment.
To determine heterogeneity among IVs in this MR study, we mainly used Cochran’s Q and I2 statistics. The MR-Egger intercept, PhenoScanner V2, and MR-PRESSO global tests were used to determine pleiotropy between IVs. Power calculations were made using the online tool mRnd and based on the outcome data sample size, proportion of R2 sum, cases, and type I error rate of 0.05 (31). Taking into account multiple analyses, the Bonferroni-corrected value of p < 0.01 (0.05/5 exposures) was considered significant. p-values between 0.01 and 0.05 were considered suggested associations. All MR Analyses in this study were performed using R software (version 4.2.1) (32). The R packages used were TwoSampleMR (33) and MR-PRESSO.
3. Results
3.1. MR analysis of primary results
After the above screening steps, 11 SNPs could not be extracted from the NAFLD dataset among the 78 SNPs that represented watching TV. Among them, rs2184364, rs405797, rs55909997, rs66852340, rs7716447, rs7991062, and rs9569764 were replaced by rs4349826, rs178193, rs12401598, rs7668784, rs16867703, rs7335993, and rs956973 and other alternative SNPs. The remaining four SNPs were excluded from the analysis. Among the SNPs that represented computer use, rs11274218 and rs12874776 were replaced by rs12994113 and rs77640194, respectively, because they were not present in the NAFLD dataset. Rs166835 and rs2068625 were omitted because of a lack of relevant information. Rs35933007 was removed by MR-PRESSO because of its pleiotropic effect. Rs2854277, which represents MVPA, was excluded because no replacement could be found.
In the IVW analysis, genetically predicted TV viewing time was suggestively associated with increased odds of NAFLD (odds ratio (OR): 1.84; 95% CI: 1.09–3.10; p = 0.021). Additional tests, such as MR-Egger, simple median, and MR-PRESSO, increased the stability of the results (Table 2 and Figure 2). However, the causal association between computer use and driving with NAFLD prevalence was not confirmed (computer use: OR: 1.51; 95% CI: 0.47–4.81; p = 0.484; driving: OR: 0.78; 95% CI: 0.05–11.94; p = 0.858). In the context of PA, genetically predicted VPA duration was suggestively associated with a reduced risk of NAFLD (OR: 0.0033; 95% CI: 0.000015–0.70; p = 0.036), indicating a lower risk of NAFLD in those who reported VPA activity on 3 or more days per week than in those who reported no VPA activity per week. However, it was not confirmed with MVPA (OR: 0.168; 95% CI: 0.01–2.81; p = 0.214) (Table 2 and Figures 3, 4).
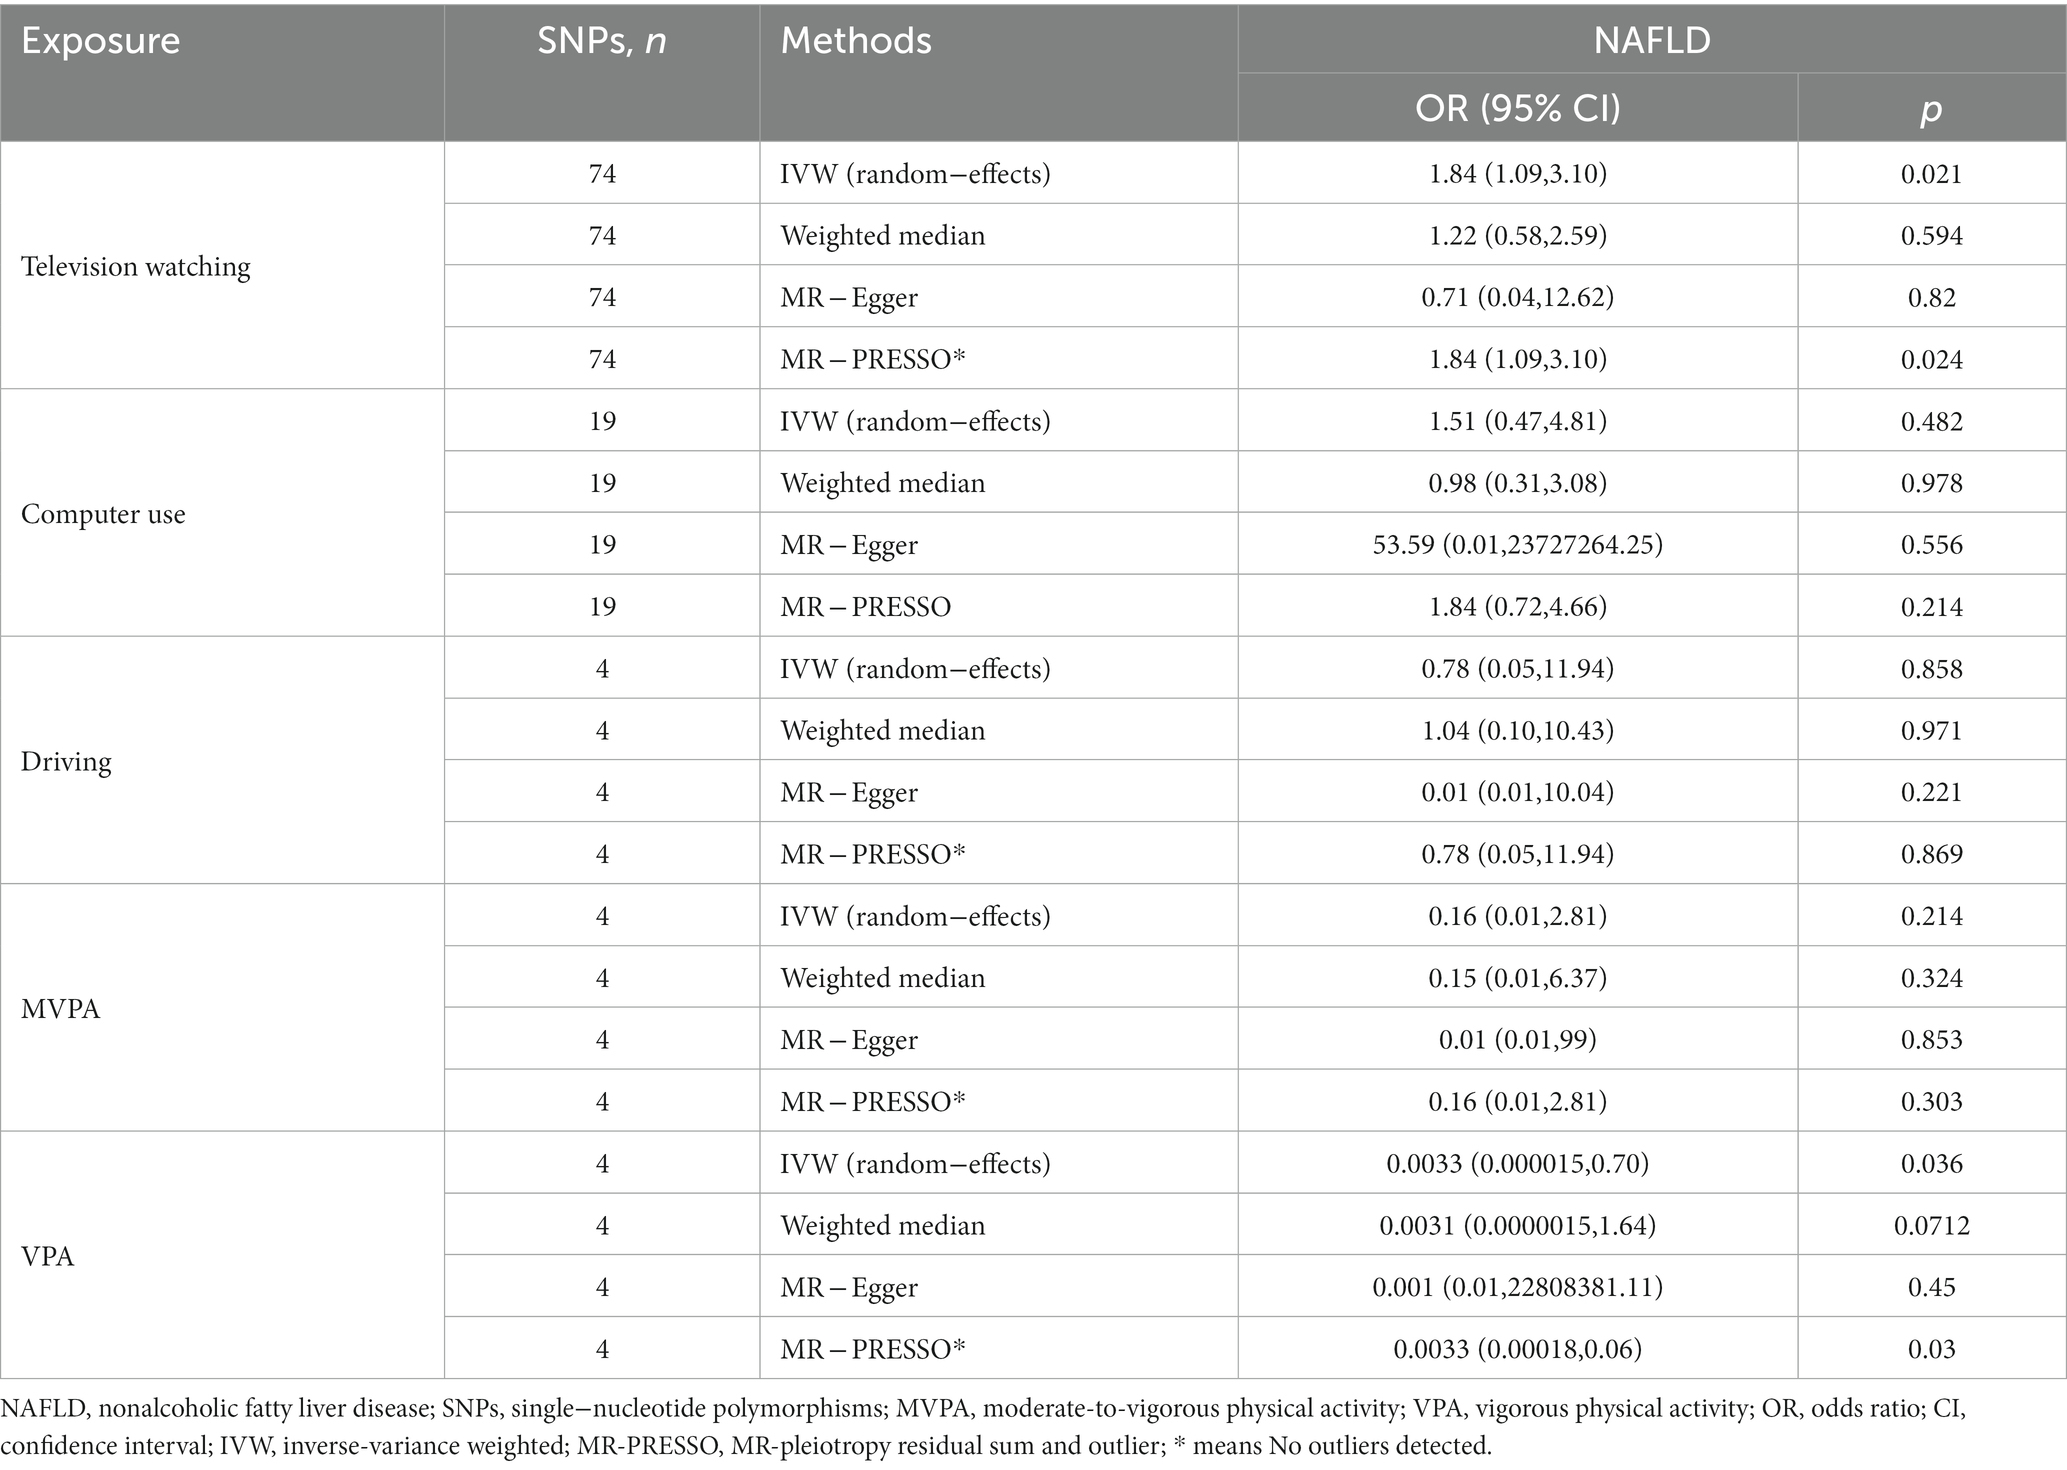
Table 2. MR estimates of the causal association between leisure sedentary behaviors and PA with the risk of NAFLD.
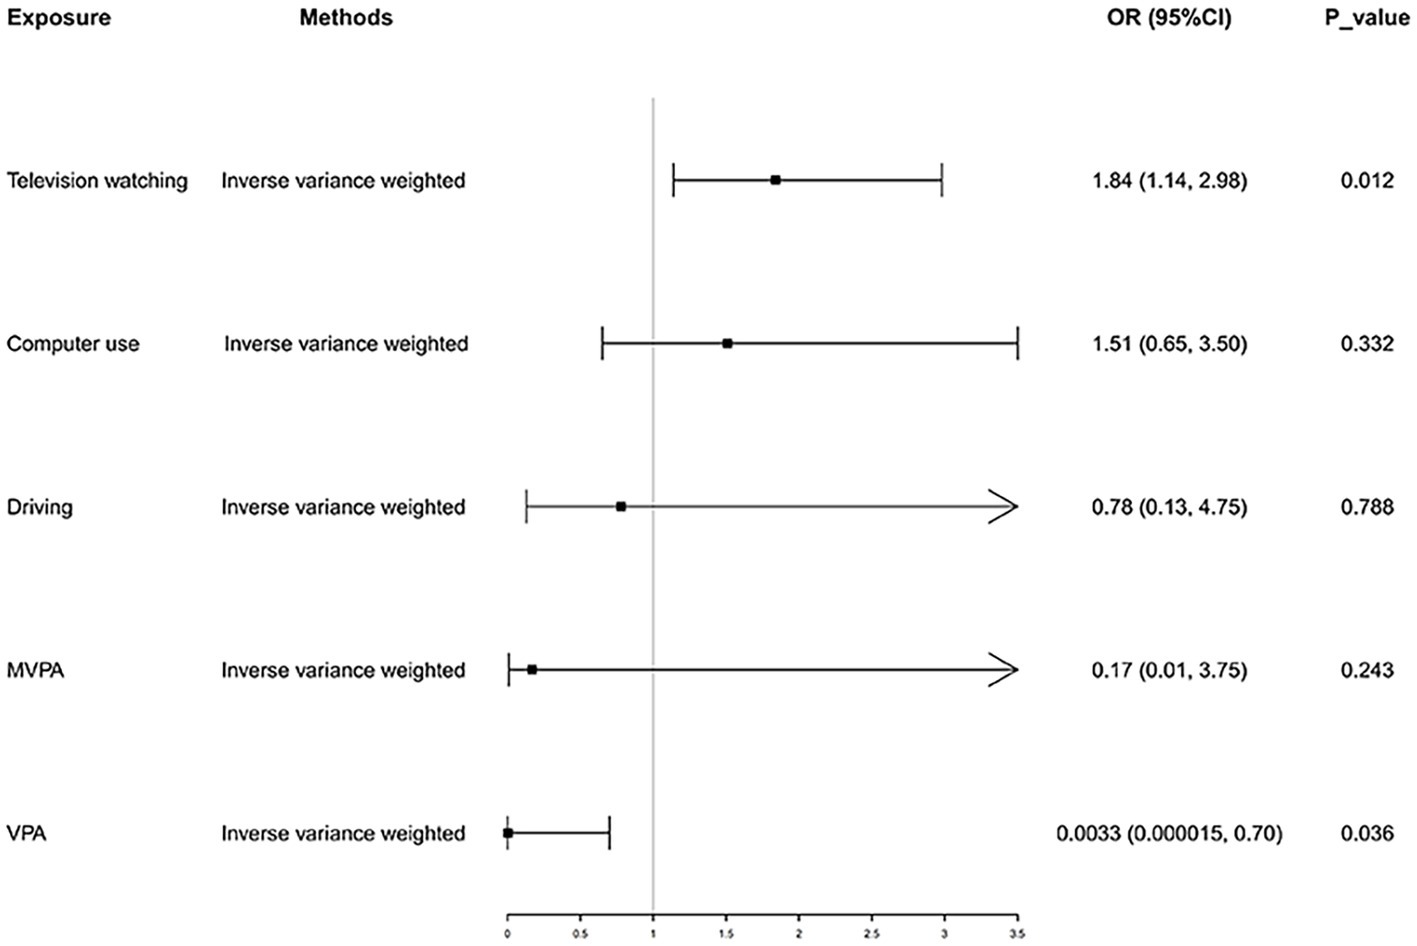
Figure 2. Causal effect of LSB and PA on NAFLD. NAFLD, nonalcoholic fatty liver disease; MVPA, moderate-tovigorous physical activity; VPA, vigorous physical activity.
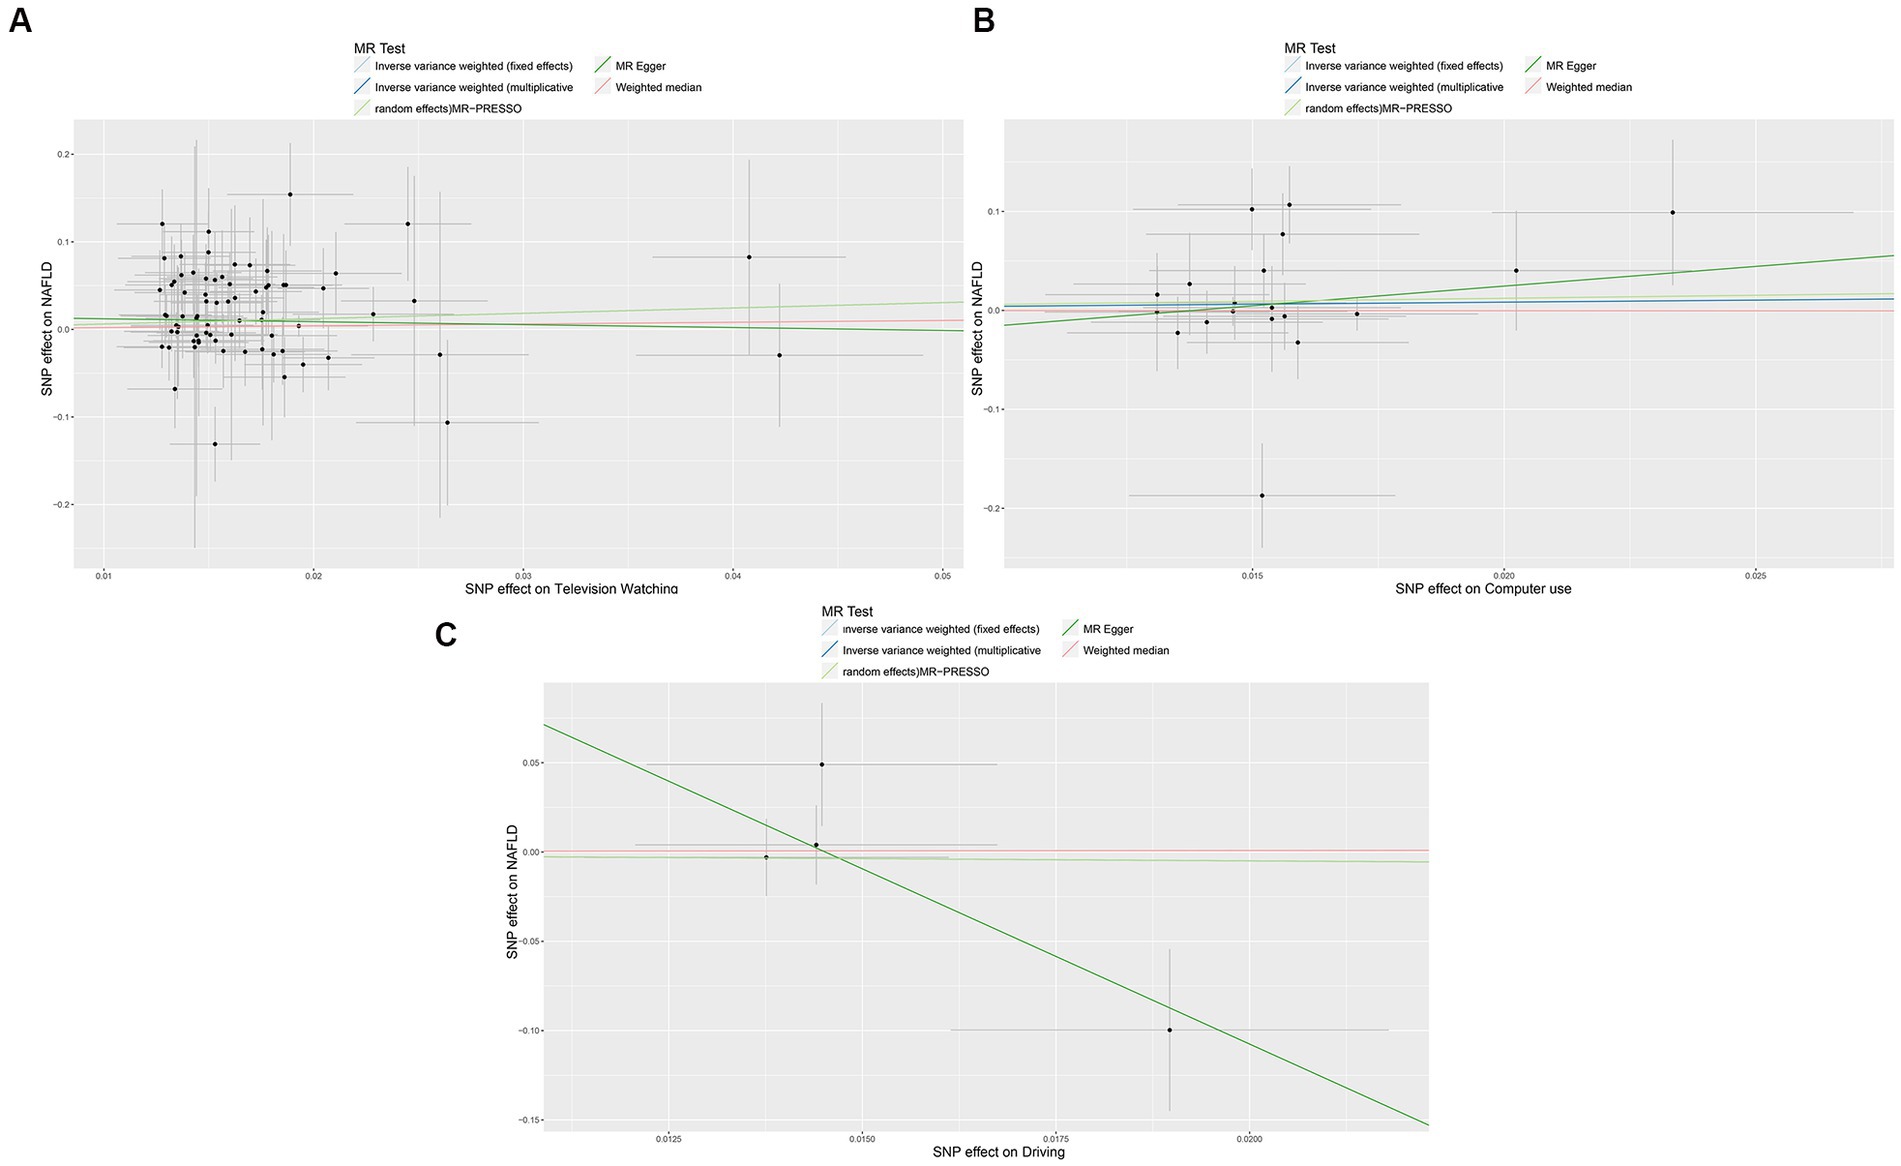
Figure 3. Scatter plots showing the genetic relationship between LSB with the risk of NAFLD, (A) television watching; (B) Computer use; (C) driving. NAFLD, nonalcoholic fatty liver disease; LSB, Leisure Sedentary Behavior. MVPA, moderate-to-vigorous physical activity; VPA, vigorous physical activity. MR-PRESSO, MR Pleiotropy Residual Sum and Outlier.

Figure 4. Scatter plots showing the genetic relationship between PA with the risk of NAFLD, (A) VPA; (B) MVPA. PA, physical activity; NAFLD, nonalcoholic fatty liver disease; VPA, vigorous physical activity; MVPA, moderate-to-vigorous physical activity.
Heterogeneity was examined using Cochran’s Q and I2 tests. TV-watching-NAFLD (p = 0.137; I2 = 15.3%) and VPA-NAFLD (p = 0.830; I2 = 0) showed no significant heterogeneity among the IVs. Some heterogeneity was observed between computer use and driving in NAFLD (PCochran’s Q < 0.05, or I2 > 25%, Table 3) (34, 35). Pleiotropy was assessed by the MR-Egger intercept p and MR-PRESSO global test p. TV-watching-NAFLD (Pintercept = 0.513; Pglobal test = 0.153) and VPA-NAFLD (Pintercept = 0.613; Pglobal test = 0.85), and similar conclusions were identified in other results (Table 2) (29, 36). Leave-one-out analysis did not identify a single SNP that strongly influenced the causality between watching TV and NAFLD. However, there were two SNPs that strongly influenced the causal relationship between VPA and NAFLD (Figure 5). This study had 100 and 94% power, illustrating the causal relationship between watching TV and VPA and NAFLD, whereas the power between computer use, driving, MVPA, and NAFLD was 75, 8, and 68%, respectively.
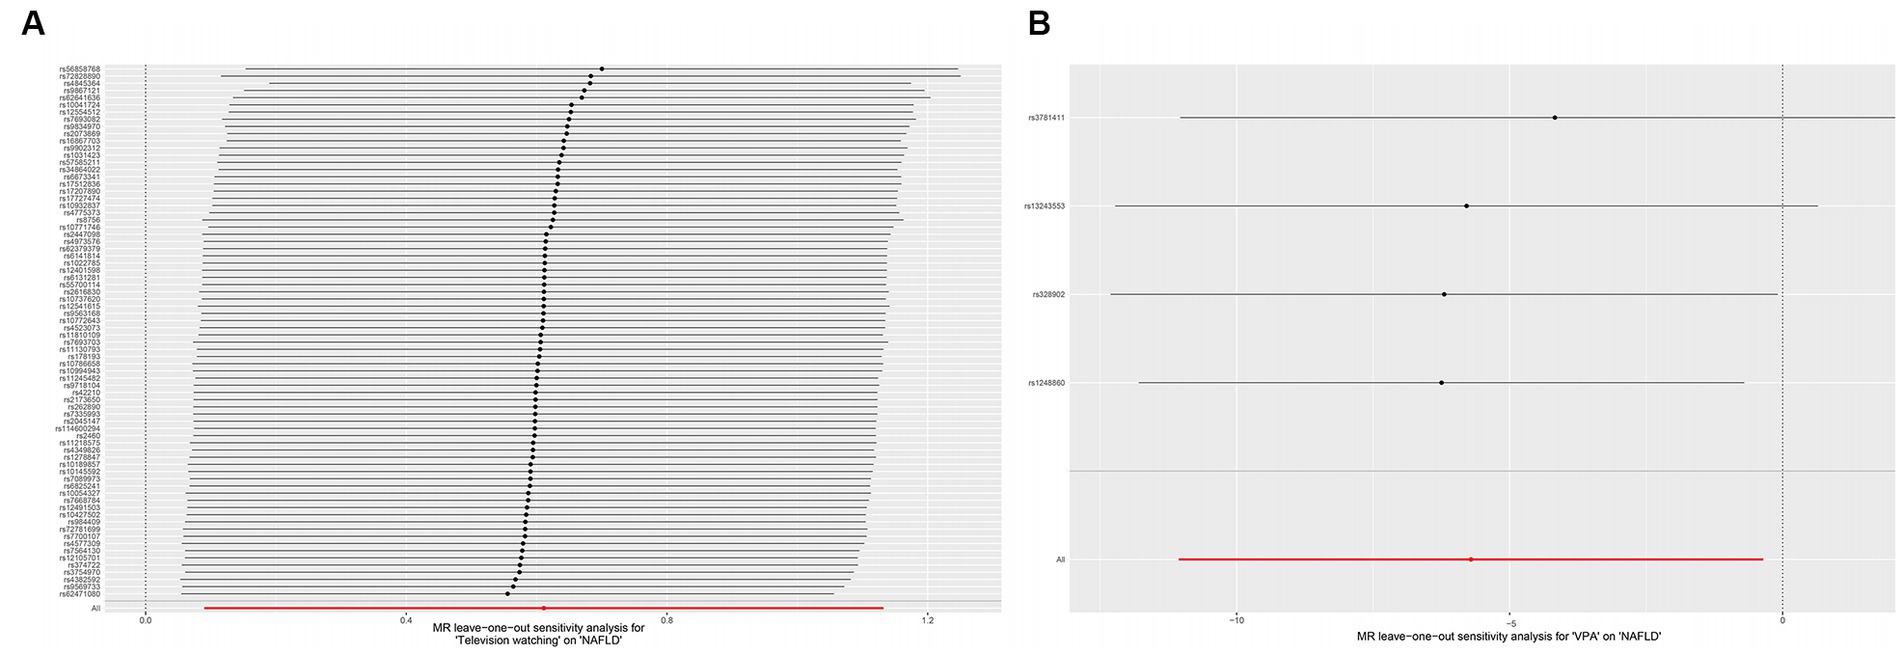
Figure 5. Plots of leave-one-out analyses for the causal effect of leisure television watching (A) and VPA (B) with the risk of NAFLD. VPA, vigorous physical activity; NAFLD, nonalcoholic fatty liver disease.
3.2. MR analysis of risk factors
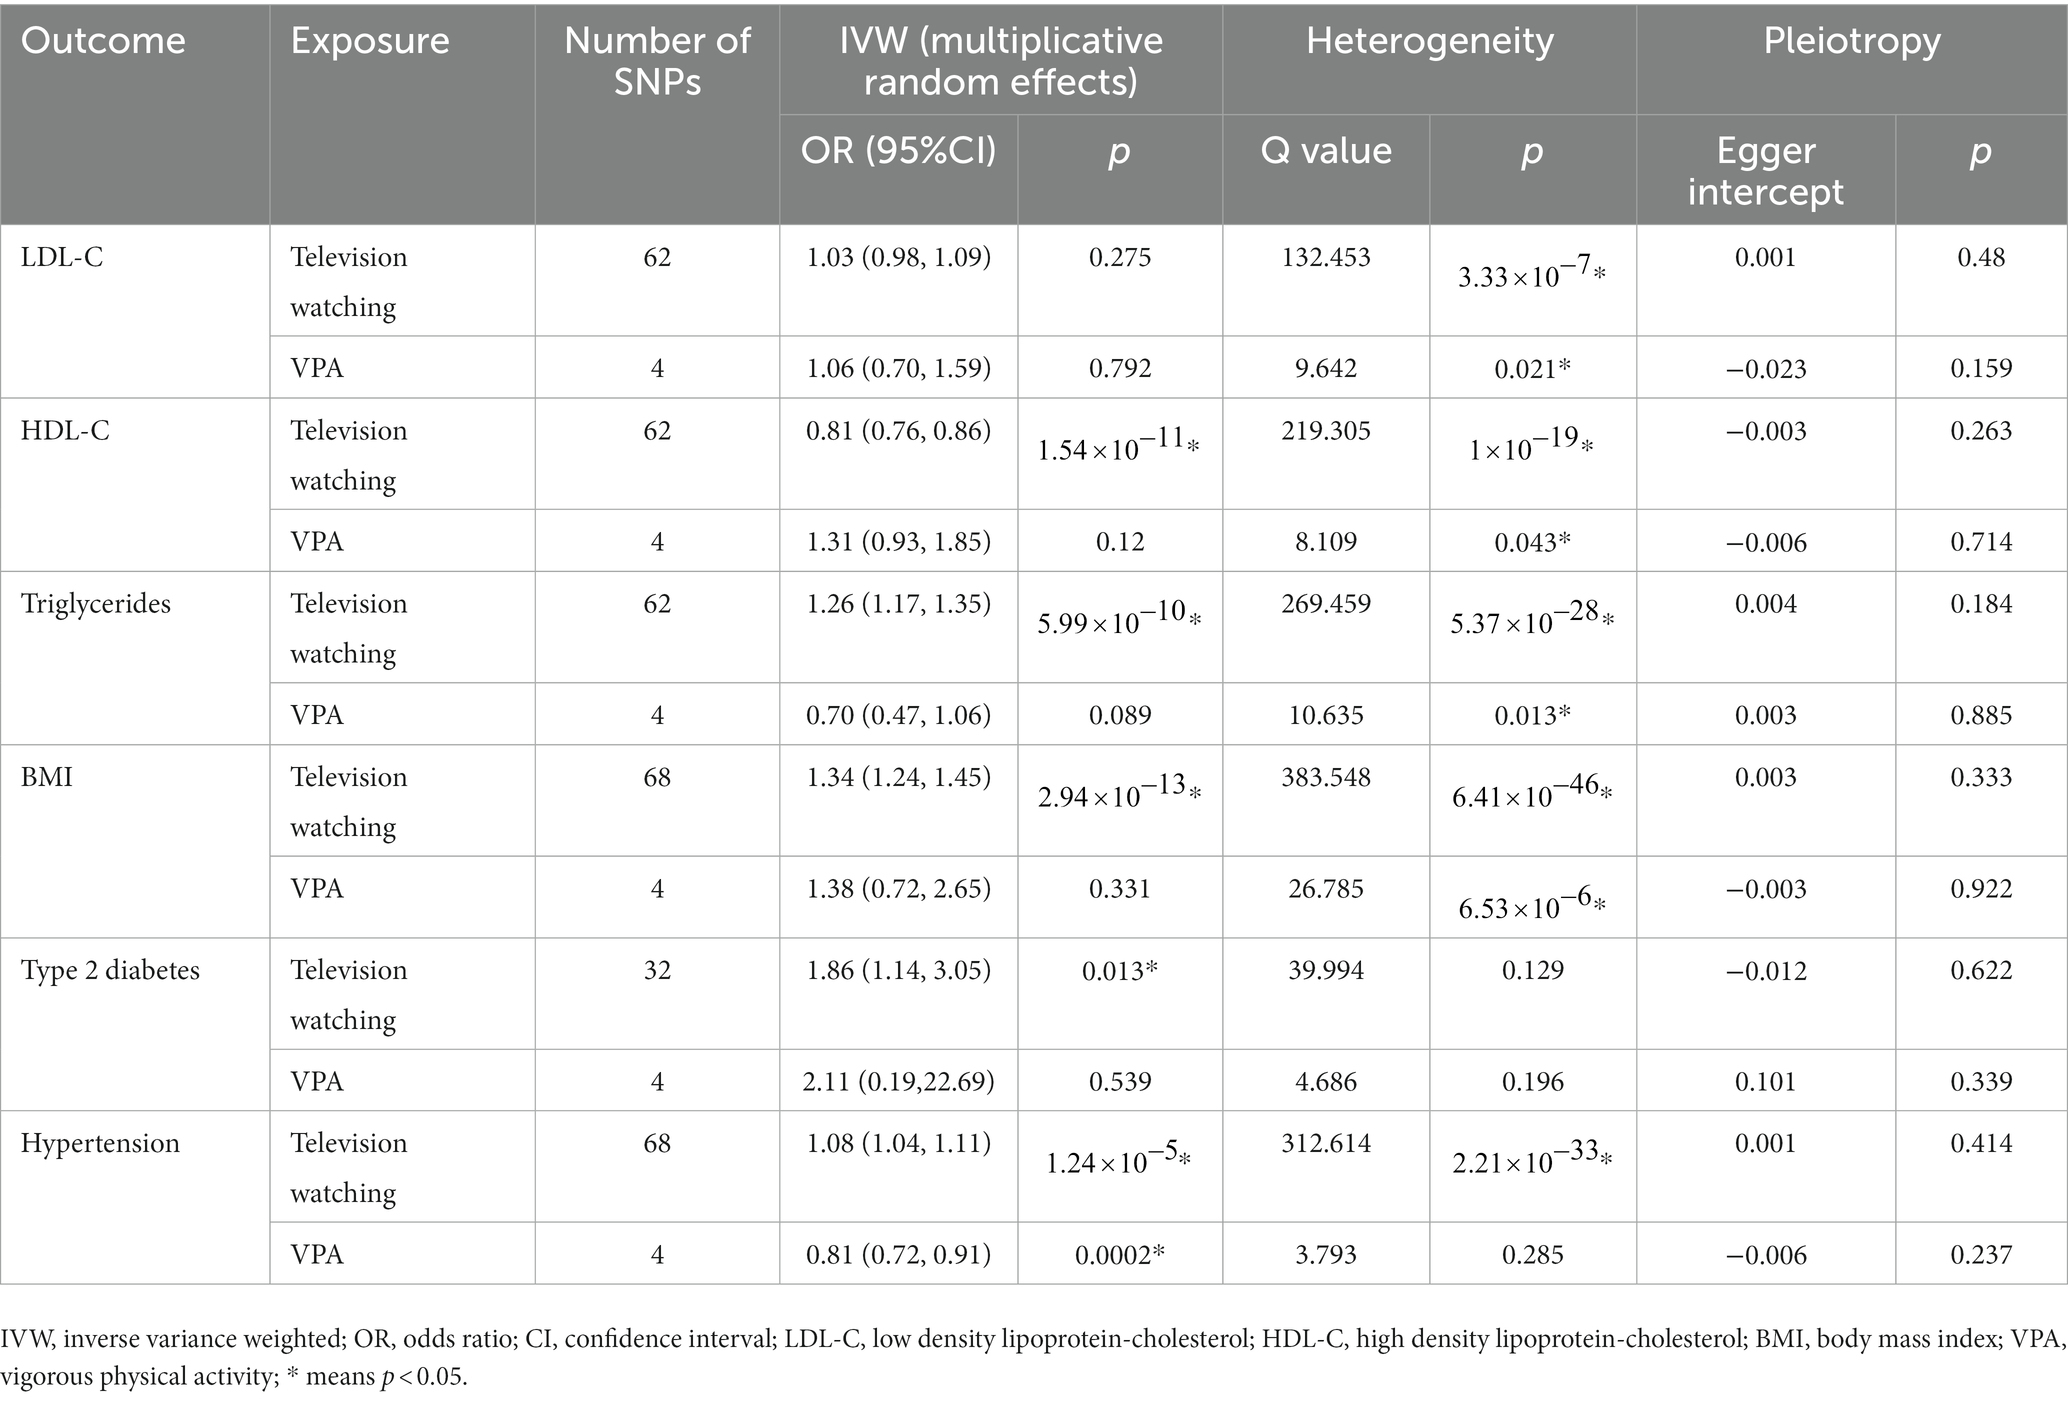
We further explored whether there are potential mediating factors linking TV watching and VPA with NAFLD. We performed MR analyses of common risk factors for TV viewing and VPA with NAFLD. The results showed that one SD increase in TV watching time was associated with a 1.34-fold increase in BMI, a 1.07-fold increase in the risk of hypertension, a 19.4% decrease in HDL levels, 1.25-fold increase in triglyceride levels, and a 1.86-fold increase in the risk of type 2 diabetes. When vigorous PA increased by one SD, the risk of hypertension decreased by 19.1%, and there was no obvious causal relationship with BMI, TG, etc. (Table 4).
4. Discussion
This two-sample MR Study provides strong and valid genetic evidence that leisurely sedentary TV watching leads to an increased risk of NAFLD and that increased VPA exposure reduces the risk for NAFLD. However, not all sedentary behaviors supported these results. Sedentary behaviors, such as computer use, driving, and MVPA, did not affect the risk of NAFLD. This finding was consistent with that of the primary MR analysis method (IVW) and other MR analyses and provided us with more genetic insights into the association between LSB and NAFLD.
Many studies have shown that sedentary behavior can increase the risk of obesity, hypertension, and other diseases (37, 38). Related animal studies have shown that PA alleviates the process of hepatic steatosis. Mechanistically, daily PA in rats prevents the development of hepatic steatosis and NAFLD by increasing the content and strengthening the function of liver mitochondria, and inhibiting hepatic lipogenesis (39). When the activity of rats was restricted, it was discovered that complete fatty acid oxidation in the liver and mitochondrial enzyme activities (citrate synthase, β-hydroxy-acyl-CoA dehydrogenase, and cytochrome oxidase) were decreased, while the liver contents of fatty acid synthase and acetyl-CoA carboxylase were increased. Although the phosphorylation status of acetyl-CoA carboxylase decreased, hepatic malonyl-CoA concentrations were significantly increased. However, these steps are all necessary for fatty acid synthesis and triglyceride production in the liver. Eventually, the incidence of fatty liver in rats increased (39). At the same time, a recent study on sedentary behavior and liver fat content also reported that liver fat content increased by 1.15% for every additional hour of sitting. These data can be understood by comparing the reduction in liver fat by 1.7% after 4 weeks of aerobic cycling intervention in obese men and women with sedentary habits (40). Our study also revealed similar results on the association between sedentary behavior, PA, and NAFLD. However, in this study, sedentary behavior limited to TV watching was associated with an increased risk of NAFLD, and the protective effect of PA on NAFLD was limited to VPA. This may be because watching TV is more relaxing than using computers and driving and requires less mental and limb activity. Studies have shown that leisure TV watching often means higher food and total energy intake compared with other sedentary behaviors such as reading, writing, and driving, which are usually induced by TV advertisements, and other unhealthy lifestyles, often replacing PA, thus increasing the risk of obesity (41, 42). Obesity is an identified risk factor for NAFLD. In this study, MVPA did not have the expected effect of reducing NAFLD risk, suggesting that walking, slow cycling, etc., may not have a significant protective effect against NAFLD. These findings strengthen the basis for further exploration and evaluation of the relationship between LSB, PA, and NAFLD.
In this study, we also analyzed the mediating reasons for the causal relationship between TV viewing and VPA and NAFLD. TV watching was associated with higher BMI, higher risk of hypertension, lower HDL levels, higher triglyceride levels, and a higher risk of type 2 diabetes. VPA reduces the risk of hypertension. Previous observational studies have shown that elevated BMI and blood lipid levels are clear risk factors for fatty liver disease (3). Previous studies have also demonstrated that the relationship between hypertension, diabetes, and NAFLD is often bidirectional (43). An Italian prospective study demonstrated for the first time that individuals with underlying hypertension had a nearly double risk of liver fibrosis progression (44). However, the association between diabetes and NAFLD is complex. Patients with type 2 diabetes show a high prevalence of NAFLD. In the Valpolicella Heart Diabetes study, the prevalence of NAFLD in nearly 3,000 patients with type 2 diabetes was 69.5% (45). Previous animal studies have also identified a relationship between the glucose-insulin pathway and NAFLD. Disruption of hepatic insulin signalling induces NAFLD and hepatic insulin resistance through insulin receptor substrate-2 gene deletion, leading to upregulation of SREBP-1, leading to the development of obesity, diabetes and NAFLD in laboratory animals (9). The above evidence demonstrates that BMI, blood lipid levels, hypertension, and diabetes may be mediating factors for NAFLD occurrence. TV watching may increase the risk of these risk factors and further affect NAFLD development. However, specific mediation analyses were lacking to determine the direct effects of TV watching and VPA on NAFLD. Nonetheless, this should not diminish the role of sedentary TV watching and VPA as etiological and protective factors for NAFLD. Reduced TV watching time and increased VPA time still affect NAFLD through possible intermediary factors.
This study used an MR analysis, which has the advantage of reducing residual confounding and reverse causality. Cochrane’s Q, MR-PRESSO global tests, and MR-Egger were used to examine the sensitivity of the results, and no heterogeneity or pleiotropy was observed among the main results. Simultaneously, the power of the two positive results exceeded 80%, which strengthened the stability of the results.
This study has some limitations. Firstly, it was difficult to stratify NAFLD for further study because the outcome data came from a large statistical GWAS. Secondly, some heterogeneity was identified in the study of mediating factors, which may be caused by different methods of data collection. Thirdly, although we performed sensitivity analyses that did not show substantial pleiotropy, we cannot rule out the possibility that horizontal pleiotropy may have biased the MR results. Fourthly, the power of the relationship between computer use, driving, MVPA, and NAFLD was 75, 8, and 68%, respectively, which did not reach the 80% threshold, possibly because the selected IVs had insufficient ability to explain computer use, driving, etc. Therefore, caution should be exercised when interpreting the association between computer use, driving, and NAFLD. Fifthly, there were two SNPs that strongly influenced the causal relationship between VPA and NAFLD in leave-one-out analysis. This may be due to too few SNPs in the study that are strongly associated with VPA, which requires larger GWAS studies to obtain more genetic data. Finally, since both exposure and outcome individuals were from Europe, it was difficult to interpret the results in the entire population. To our knowledge, this is the first MR study to explore the causal relationship between LSB and NAFLD using a large GWAS dataset. The study findings further prove that sedentary behavior contributes to an increased prevalence of NAFLD. At the same time, we also explored the mediating factors and observed that NAFLD is often the result of multiple factors. However, the specific proportion of mediating factors influencing NAFLD requires further study.
5. Conclusion
In conclusion, this MR Study demonstrated that more leisurely sedentary TV-watching time was associated with an increased risk of NAFLD, whereas more VPA time was associated with a corresponding reduction in NAFLD risk, although not at the level of significance after multiple testing correction. Although this study provides evidence for the prevention of NAFLD, the specific potential mechanism warrants more research.
Data availability statement
The original contributions presented in the study are included in the article/Supplementary material, further inquiries can be directed to the corresponding author.
Author contributions
XZ and KC: conceptualization, software, data curation, visualization, and manuscript writing. SY and MQ: writing review, visualization, and editing. CL: supervision of the study. All authors contributed to the article and approved the submitted version.
Funding
This study was funded by the Wenzhou Municipal Science and Technology Bureau (Y20220888).
Acknowledgments
The authors would like to express our gratitude to Chen (MTIyMTg1MTlAemp1LmVkdS5jbg==) for his MR training course. His excellent sharing of MR process makes it easier for us to accomplish this work. The authors would like to thank Editage (www.editage.cn) for English language editing.
Conflict of interest
The authors declare that the research was conducted in the absence of any commercial or financial relationships that could be construed as a potential conflict of interest.
Publisher’s note
All claims expressed in this article are solely those of the authors and do not necessarily represent those of their affiliated organizations, or those of the publisher, the editors and the reviewers. Any product that may be evaluated in this article, or claim that may be made by its manufacturer, is not guaranteed or endorsed by the publisher.
Supplementary material
The Supplementary material for this article can be found online at: https://www.frontiersin.org/articles/10.3389/fnut.2023.1158810/full#supplementary-material
Abbreviations
IVs, Instrumental variables; GWAS, genome-wide association study; VPA, vigorous physical activity; NAFLD, nonalcoholic fatty liver disease; TV, television; CI, confidence interval; OR, odds ratio; PA, physical activity; MR, Mendelian-randomisation; SNP, single-nucleotide polymorphism; LSB, leisure sedentary behavior; SD, standard deviation; MVPA, moderate-to-vigorous PA; VPA, vigorous PA; IVW, inverse-variance weighted.
Footnotes
References
1. Marchesini, G, Roden, M, and Vettor, R. Response to: comment to "EASL-EASD-EASO clinical practice guidelines for the management of non-alcoholic fatty liver disease". J Hepatol. (2017) 66:466–7. doi: 10.1016/j.jhep.2016.11.002
2. Zhou, F, Zhou, J, Wang, W, Zhang, XJ, Ji, YX, Zhang, P, et al. Unexpected rapid increase in the burden of NAFLD in China from 2008 to 2018: a systematic review and Meta-analysis. Hepatology. (2019) 70:1119–33. doi: 10.1002/hep.30702
3. Cotter, TG, and Rinella, M. Nonalcoholic fatty liver disease 2020: the state of the disease. Gastroenterology. (2020) 158:1851–64. doi: 10.1053/j.gastro.2020.01.052
4. Brunt, EM, Wong, VW, Nobili, V, Day, CP, Sookoian, S, Maher, JJ, et al. Nonalcoholic fatty liver disease. Nat Rev Dis Primers. (2015) 1:15080. doi: 10.1038/nrdp.2015.80
5. Ekelund, U, Steene-Johannessen, J, Brown, WJ, Fagerland, MW, Owen, N, Powell, KE, et al. Lancet physical activity series 2 executive Committe; lancet sedentary behaviour working group. Does physical activity attenuate, or even eliminate, the detrimental association of sitting time with mortality? A harmonised meta-analysis of data from more than 1 million men and women. Lancet. (2016) 388:1302–10. doi: 10.1016/S0140-6736(16)30370-1
6. Kim, D, Vazquez-Montesino, LM, Li, AA, Cholankeril, G, and Ahmed, A. Inadequate physical activity and sedentary behavior are independent predictors of nonalcoholic fatty liver disease. Hepatology. (2020) 72:1556–68. doi: 10.1002/hep.31158
7. Helajärvi, H, Pahkala, K, Heinonen, OJ, Juonala, M, Oikonen, M, Tammelin, T, et al. Television viewing and fatty liver in early midlife. The cardiovascular risk in Young Finns study. Ann Med. (2015) 47:519–26. doi: 10.3109/07853890.2015.1077989
8. Meng, G, Liu, F, Fang, L, Li, C, Zhang, Q, Liu, L, et al. The overall computer/mobile devices usage time is related to newly diagnosed non-alcoholic fatty liver disease: a population-based study. Ann Med. (2016) 48:568–76. doi: 10.1080/07853890.2016.1219454
9. Rector, RS, and Thyfault, JP. Does physical inactivity cause nonalcoholic fatty liver disease? J Appl Physiol. (1985) 111:1828–35. doi: 10.1152/japplphysiol.00384.2011
10. Davey Smith, G, and Hemani, G. Mendelian randomization: genetic anchors for causal inference in epidemiological studies. Hum Mol Genet. (2014) 23:R89–98. doi: 10.1093/hmg/ddu328
11. Emdin, CA, Khera, AV, and Kathiresan, S. Mendelian Randomization. JAMA. (2017) 318:1925–6. doi: 10.1001/jama.2017.17219
12. Burgess, S, Scott, RA, Timpson, NJ, Davey Smith, G, and Thompson, SG, EPIC- InterAct Consortium. Using published data in Mendelian randomization: a blueprint for efficient identification of causal risk factors. Eur J Epidemiol. (2015) 30:543–52. doi: 10.1007/s10654-015-0011-z
13. van de Vegte, YJ, Said, MA, Rienstra, M, van der Harst, P, and Verweij, N. Genome-wide association studies and Mendelian randomization analyses for leisure sedentary behaviours. Nat Commun. (2020) 11:1770. doi: 10.1038/s41467-020-15553-w
14. Klimentidis, YC, Raichlen, DA, Bea, J, Garcia, DO, Wineinger, NE, Mandarino, LJ, et al. Genome-wide association study of habitual physical activity in over 377,000 UK biobank participants identifies multiple variants including CADM2 and APOE. Int J Obes. (2018) 42:1161–76. doi: 10.1038/s41366-018-0120-3
15. Bassett, DR Jr. International physical activity questionnaire: 12-country reliability and validity. Med Sci Sports Exerc. (2003) 35:1396. doi: 10.1249/01.MSS.0000078923.96621.1D
16. Suhre, K, Arnold, M, Bhagwat, AM, Cotton, RJ, Engelke, R, Raffler, J, et al. Connecting genetic risk to disease end points through the human blood plasma proteome. Nat Commun. (2017) 8:14357. doi: 10.1038/ncomms14357
17. 1000 Genomes Project ConsortiumAbecasis, GR, Altshuler, D, Auton, A, Brooks, LD, Durbin, RM, et al. A map of human genome variation from population-scale sequencing. Nature. (2010) 467:1061–73. doi: 10.1038/nature09534
18. Shim, H, Chasman, DI, Smith, JD, Mora, S, Ridker, PM, Nickerson, DA, et al. A multivariate genome-wide association analysis of 10 LDL subfractions, and their response to statin treatment, in 1868 Caucasians. PLoS One. (2015) 10:e0120758. doi: 10.1371/journal.pone.0120758
19. Papadimitriou, N, Dimou, N, Tsilidis, KK, Banbury, B, Martin, RM, Lewis, SJ, et al. Physical activity and risks of breast and colorectal cancer: a mendelianrandomisation analysis. Nat Commun. (2020) 11:597. doi: 10.1038/s41467-020-14389-8
20. Kamat, MA, Blackshaw, JA, Young, R, Surendran, P, Burgess, S, Danesh, J, et al. PhenoScanner V2: an expanded tool for searching human genotype-phenotype associations. Bioinformatics. (2019) 35:4851–3. doi: 10.1093/bioinformatics/btz469
21. Hemani, G, Tilling, K, and Davey, SG. Orienting the causal relationship between imprecisely measured traits using GWAS summary data. PLoS Genet. (2017) 13:e1007081. doi: 10.1371/journal.pgen.1007081
22. Anstee, QM, Darlay, R, Cockell, S, Meroni, M, Govaere, O, Tiniakos, D, et al. EPoS consortium investigators. Genome-wide association study of non-alcoholic fatty liver and steatohepatitis in a histologically characterised cohort☆. J Hepatol. (2020) 73:505–15. doi: 10.1016/j.jhep.2020.04.003
23. Richardson, TG, Sanderson, E, Palmer, TM, Ala-Korpela, M, Ference, BA, Davey Smith, G, et al. Evaluating the relationship between circulating lipoprotein lipids and apolipoproteins with risk of coronary heart disease: a multivariable Mendelian randomisation analysis. PLoS Med. (2020) 17:e1003062. doi: 10.1371/journal.pmed.1003062
24. Morris, AP, Voight, BF, Teslovich, TM, Ferreira, T, Segrè, AV, Steinthorsdottir, V, et al. DIAbetes genetics replication and Meta-analysis (DIAGRAM) consortium. Large-scale association analysis provides insights into the genetic architecture and pathophysiology of type 2 diabetes. Nat Genet. (2012) 44:981–90. doi: 10.1038/ng.2383
25. Burgess, S, Butterworth, A, and Thompson, SG. Mendelian randomization analysis with multiple genetic variants using summarized data. Genet Epidemiol. (2013) 37:658–65. doi: 10.1002/gepi.21758
26. Bowden, J, Davey Smith, G, Haycock, PC, and Burgess, S. Consistent estimation in Mendelian randomization with some invalid instruments using a weighted median estimator. Genet Epidemiol. (2016) 40:304–14. doi: 10.1002/gepi.21965
27. Burgess, S, and Thompson, SG. Interpreting findings from Mendelian randomization using the MR-egger method. Eur J Epidemiol. (2017) 32:377–89. doi: 10.1007/s10654-017-0255-x
28. Chen, L, Sun, X, He, Y, Lu, Y, and Zheng, L. Obstructive sleep apnea and atrial fibrillation: insights from a bidirectional Mendelian randomization study. BMC Med Genet. (2022) 15:28. doi: 10.1186/s12920-022-01180-5
29. Verbanck, M, Chen, CY, Neale, B, and Do, R. Detection of widespread horizontal pleiotropy in causal relationships inferred from Mendelian randomization between complex traits and diseases. Nat Genet. (2018) 50:693–8. doi: 10.1038/s41588-018-0099-7
30. Bowden, J, Del Greco, MF, Minelli, C, Davey Smith, G, Sheehan, N, and Thompson, J. A framework for the investigation of pleiotropy in two-sample summary data Mendelian randomization. Stat Med. (2017) 36:1783–802. doi: 10.1002/sim.7221
31. R_Core_Team. R: A language and environment for statistical computing. R Foundation for Statistical Computing, Vienna, Austria. Available at: https://www.R-project.org/ (accessed June 30, 2022).
32. Brion, MJ, Shakhbazov, K, and Visscher, PM. Calculating statistical power in Mendelian randomization studies. Int J Epidemiol. (2013) 42:1497–501. doi: 10.1093/ije/dyt179
33. Hemani, G, Zheng, J, Elsworth, B, Wade, KH, Haberland, V, Baird, D, et al. The MR-base platform supports systematic causal inference across the human phenome. elife. (2018) 7:e34408. doi: 10.7554/eLife.34408
34. Greco, MFD, Minelli, C, Sheehan, NA, and Thompson, JR. Detecting pleiotropy in Mendelian randomisation studies with summary data and a continuous outcome. Stat Med. (2015) 34:2926–40. doi: 10.1002/sim.6522
35. Lu, Y, Xu, Z, Georgakis, MK, Wang, Z, Lin, H, and Zheng, L. Smoking and heart failure: a Mendelian randomization and mediation analysis. ESC Heart Fail. (2021) 8:1954–65. doi: 10.1002/ehf2.13248
36. Bowden, J, Davey Smith, G, and Burgess, S. Mendelian randomization with invalid instruments: effect estimation and bias detection through egger regression. Int J Epidemiol. (2015) 44:512–25. doi: 10.1093/ije/dyv080
37. Levine, JA, Lanningham-Foster, LM, McCrady, SK, Krizan, AC, Olson, LR, Kane, PH, et al. Interindividual variation in posture allocation: possible role in human obesity. Science. (2005) 307:584–6. doi: 10.1126/science.1106561
38. Deng, MG, Cui, HT, Lan, YB, Nie, JQ, Liang, YH, and Chai, C. Physical activity, sedentary behavior, and the risk of type 2 diabetes: a two-sample Mendelian randomization analysis in the European population. Front Endocrinol (Lausanne). (2022) 13:964132. doi: 10.3389/fendo.2022.964132
39. Rector, RS, Thyfault, JP, Morris, RT, Laye, MJ, Borengasser, SJ, Booth, FW, et al. Daily exercise increases hepatic fatty acid oxidation and prevents steatosis in Otsuka long-Evans Tokushima fatty rats. Am J Physiol Gastrointest Liver Physiol. (2008) 294:G619–26. doi: 10.1152/ajpgi.00428.2007
40. Bowden Davies, KA, Sprung, VS, Norman, JA, Thompson, A, Mitchell, KL, Harrold, JA, et al. Physical activity and sedentary time: association with metabolic health and liver fat. Med Sci Sports Exerc. (2019) 51:1169–77. doi: 10.1249/MSS.0000000000001901
41. Lyons, EJ, Tate, DF, Ward, DS, and Wang, X. Energy intake and expenditure during sedentary screen time and motion-controlled video gaming. Am J Clin Nutr. (2012) 96:234–9. doi: 10.3945/ajcn.111.028423
42. Hu, FB, Li, TY, Colditz, GA, Willett, WC, and Manson, JE. Television watching and other sedentary behaviors in relation to risk of obesity and type 2 diabetes mellitus in women. JAMA. (2003) 289:1785–91. doi: 10.1001/jama.289.14.1785
43. Lonardo, A, Nascimbeni, F, Mantovani, A, and Targher, G. Hypertension, diabetes, atherosclerosis and NASH: cause or consequence? J Hepatol. (2018) 68:335–52. doi: 10.1016/j.jhep.2017.09.021
44. Singh, S, Allen, AM, Wang, Z, Prokop, LJ, Murad, MH, and Loomba, R. Fibrosis progression in nonalcoholic fatty liver vs nonalcoholic steatohepatitis: a systematic review and meta-analysis of paired-biopsy studies. Clin Gastroenterol Hepatol. (2015) 13:643–54.e1-9. doi: 10.1016/j.cgh.2014.04.014
Keywords: NAFLD, Mendelian randomization study, sedentary behavior, physical activity, causality
Citation: Zhang X, Chen K, Yin S, Qian M and Liu C (2023) Association of leisure sedentary behavior and physical activity with the risk of nonalcoholic fatty liver disease: a two-sample Mendelian randomization study. Front. Nutr. 10:1158810. doi: 10.3389/fnut.2023.1158810
Edited by:
Sechang Oh, R Professional University of Rehabilitation, JapanReviewed by:
Leila Khorraminezhad, McGill University, CanadaYu Guo, Harbin Institute of Technology, China
Copyright © 2023 Zhang, Chen, Yin, Qian and Liu. This is an open-access article distributed under the terms of the Creative Commons Attribution License (CC BY). The use, distribution or reproduction in other forums is permitted, provided the original author(s) and the copyright owner(s) are credited and that the original publication in this journal is cited, in accordance with accepted academic practice. No use, distribution or reproduction is permitted which does not comply with these terms.
*Correspondence: Changbao Liu, bGl1Y2hhbmdiYW8yMDA4QGFsaXl1bi5jb20=
 Xicheng Zhang
 Keke Chen†
 Shangyu Yin