
94% of researchers rate our articles as excellent or good
Learn more about the work of our research integrity team to safeguard the quality of each article we publish.
Find out more
ORIGINAL RESEARCH article
Front. Nutr., 30 March 2023
Sec. Nutritional Immunology
Volume 10 - 2023 | https://doi.org/10.3389/fnut.2023.1141655
This article is part of the Research TopicDietary Habits, Microbiota and Autoimmune DiseasesView all 7 articles
 Renato Elias Moreira-Júnior1
 Mauro Andrade de Freitas Guimarães2Miguel Etcheverria da Silva1
 Tatiani Uceli Maioli2Ana Maria Caetano Faria2
 Ana Lúcia Brunialti-Godard1*
Introduction: Mechanisms that dictate the preference for ethanol and its addiction are not only restricted to the central nervous system (CNS). An increasing body of evidence has suggested that abusive ethanol consumption directly affects the immune system, which in turn interacts with the CNS, triggering neuronal responses and changes, resulting in dependence on the drug. It is known that neuroinflammation and greater immune system reactivity are observed in behavioral disorders and that these can regulate gene transcription. However, there is little information about these findings of the transcriptional profile of reward system genes in high consumption and alcohol preference. In this regard, there is a belief that, in the striatum, an integrating region of the brain reward system, the interaction of the immune response and the transcriptional profile of the Lrrk2 gene that is associated with loss of control and addiction to ethanol may influence the alcohol consumption and preference. Given this information, this study aimed to assess whether problematic alcohol consumption affects the transcriptional profile of the Lrrk2 gene, neuroinflammation, and behavior and whether these changes are interconnected.
Methods: An animal model developed by our research group has been used in which male C57BL/6 mice and knockouts for the Il6 and Nfat genes were subjected to a protocol of high fat and sugar diet intake and free choice of ethanol in the following stages: Stage 1 (T1)—Dietary treatment, for 8 weeks, in which the animals receive high-calorie diet, High Sugar and Butter (HSB group), or standard diet, American Institute of Nutrition 93-Growth (AIN93G group); and Stage 2 (T2)—Ethanol consumption, in which the animals are submitted, for 4 weeks, to alcohol within the free choice paradigm, being each of them divided into 10 groups, four groups continued with the same diet and in the other six the HSB diet is substituted by the AIN93G diet. Five groups had access to only water, while the five others had a free choice between water and a 10% ethanol solution. The weight of the animals was evaluated weekly and the consumption of water and ethanol daily. At the end of the 12-week experiment, anxiety-like behavior was evaluated by the light/dark box test; compulsive-like behavior by Marble burying, transcriptional regulation of genes Lrrk2, Tlr4, Nfat, Drd1, Drd2, Il6, Il1β, Il10, and iNOS by RT-qPCR; and inflammatory markers by flow cytometry. Animals that the diet was replaced had an ethanol high preference and consumption.
Results and discussion: We observed that high consumption and preference for ethanol resulted in (1) elevation of inflammatory cells in the brain, (2) upregulation of genes associated with cytokines (Il6 and Il1β) and pro-inflammatory signals (iNOS and Nfat), downregulation of anti-inflammatory cytokine (Il10), dopamine receptor (Drd2), and the Lrrk2 gene in the striatum, and (3) behavioral changes such as decreased anxiety-like behavior, and increased compulsive-like behavior. Our findings suggest that interactions between the immune system, behavior, and transcriptional profile of the Lrrk2 gene influence the ethanol preferential and abusive consumption.
Alcohol Use Disorder (AUD) is a multifactorial condition characterized by compulsive consumption, in which the genetic component is an important risk factor, with heritability estimated at around 55% (1–3). The problematic use of this drug is responsible for approximately 3.3 million deaths per year and is associated with disease development such as gastritis, hepatitis, cirrhosis, heart disease, anorexia, infections, cancer, Parkinson’s, anxiety disorders, and dementia (4–9). Studies on neurobiology and AUD causes play a key role in the investigation of explanations and therapies for this pathology.
A typical characteristic of alcohol use is behavioral alterations (9–12). Alcohol is associated with many risk behaviors, such as violent acts, self-harm, mood instability, decision-making difficulties, attention, and memory problems. Furthermore, its abstinence results in tachycardia, insomnia, hallucinations, depression, and anxiety (13–15). Indeed, Pascual et al. (16) found that in an animal model that underwent self-administration of ethanol for 5 months, just 1 day of drug withdrawal was enough to induce anxiety in the animals. Moreover, in this study, it was demonstrated that the activation of the innate immune system can influence ethanol seeking behavior (16).
There is growing evidence to suggest the activation of the immune response and inflammation in behavior disorders, as well as in the problematic use of ethanol and associated brain damage (17–21). In this scenario, it is known that beyond contributing to neurodegeneration, inflammatory signaling is also associated with alcohol dependence, since after drinking alcohol use, infiltrating macrophages and microglia become activated and induce the release of pro-inflammatory cytokines such as IL-6 and IL1β that result in neuroinflammation and blood–brain barrier breakdown (22–25). Additionally, toll-like innate immune receptor 4 (TLR4) activation in the brain during chronic ethanol abuse also triggers the production of cytokines and various inflammatory mediators (18, 26). TLR4 KO mice do not show induction of cytokines and chemokines due to ethanol use, or behavioral differences observed during abstinence (16, 27). Notably, the inflammatory process is observed in the striatum, changing its function and stimulating the drug compulsive use, even in the presence of negative consequences (16). Changes in the striatum are associated with compulsion as this brain region plays a central role in goal-directed behaviors and it is part of the Mesolimbic Dopaminergic System, popularly known as the reward system (28–30).
In this context, our research group investigated the relationship between gene transcription in the striatum and ethanol inflexible intake, defined by high preference even after adulteration of the substance (31–33). In our results, we observed several genes differentially transcribed in the LRRK2 pathway, including the main one in this pathway, Lrrk2. In our results, we observed several genes differentially transcribed in the LRRK2 pathway, including Lrrk2 the main one in this pathway (31, 34–38). This gene produces an kinase anchoring protein (AKAP) that modulates the activity of protein kinase A (PKA), which is involved in the regulation of dopamine receptors (Drd1 and Drd2) transcripts in neurons that project to the striatum in the reward system leading to ethanol preference (31, 34–38). In addition, it is known that the Lrrk2 gene is related to the immune system and is biochemically associated with molecular pathways that regulate inflammation, autophagy, and phagocytosis. In this sense, Lrrk2 polymorphisms have already been associated with inflammatory diseases such as inflammatory bowel disease, tuberculosis, and leprosy (39, 40).
LRRK2 knockdown animal models or the inhibition of its kinase activity in microglia have already been shown to decrease the production of pro-inflammatory cytokines and the hyperexpression of LRRK2 protein seems to exacerbate brain neuroinflammation by increasing its kinase activity (41–44). Additionally, the Lrrk2 gene has a special relationship with TLR4, which, when activated by lipopolysaccharides (LPS), signals through the adapter protein MyD88 (Myeloid differentiation primary response 88) (45, 46). This may influence, in a still unknown way, its subcellular localization, overexpression, and production of inflammatory cytokines (45, 46). On the other hand, Lrrk2 is also associated with the nuclear factor of activated T-cells (NFAT), responsible to produce inflammatory cytokines via calcium signaling, thus being an important mediator of the immune response (46–48). NFAT signaling is inhibited by NFAT repressor non-coding RNA (NRON), a complex composed of 11 proteins, five of which are associated with LRRK2 (48, 49). LRRK2 is reported to be a negative regulator of NFAT that can inactivate its function and block its response (45, 47, 50). It is known that the LRRK2 protein is widely expressed in the brain, and that data suggests that it may play distinct roles according to its cellular sublocation and the process in which it is acting (39). Therefore, the importance of the Lrrk2 gene in the cerebral immune system cannot be denied. However, in the AUD context, more studies are needed to understand its action on the striatum concerning the immune system and reward system.
Although ethanol has important effects on the organism, most of the studies conducted so far have focused on the neurobiology of alcoholism, showing the influence of ethanol consumption on brain circuits related to decision-making and reward processing (1, 51). Few studies are performed on the molecular regulation of control-related genes of the reward system in alcohol consumption and its association with the immune system and inflammation, such as cytokines IL-6, IL1β, and IL-10, and signals such as iNOS and NFAT. It is then hypothesized that there is an interaction between ethanol preference, the Lrrk2 gene, and the innate immune response in the striatum. In an animal model with a sugar and butter-rich diet and ethanol intake developed by our research group, we observed that when withdrawing the HSB diet and exposing the mice to the paradigm of free choice of ethanol, there is an increased intake and preference for a drink (52, 53). In the study, we raised the possibility that this increase is being directed via transcriptional regulation of dopamine receptors (52). Considering the relationship between these receptors and the Lrrk2 gene and the latter with the immune response, it is plausible to consider the possibility that this interaction is associated with high ethanol consumption and preference in this model. Thus, the present study aims to evaluate the relationship between Lrrk2 and the immune system and how this is associated with alcohol intake and preference in a model of consumption of a HSB diet and free choice of ethanol. In this context, for a better understanding of the role of the immune system in ethanol intake, we applied the model described above, also in animal knockout (KO) for the cytokine IL6 and the transcription factor NFAT.
Sixty male C57BL/6 mice, specific pathogen-free (SPF), were provided by the Animal facility of Universidade Federal de Minas Gerais (UFMG) at 6 weeks of age. Another 40, 20 C57BL/6 Il6 KO and 20 C57CLBL/6 Nfat KO males were provided by the Laboratory of Immunology of Infectious Diseases at UFMG. Only male mice were used to avoid interference from the hormonal fluctuation present in females and behavioral changes of males in their presence. During the 12-week experiment, the animals were individualized in mini-isolators housed in a ventilated rack (ALESCO, São Paulo, Brazil) with a 12-h light/dark cycle. They had free access to diet, water, and/or a 10% ethanol (EtOH) solution, according to the experimental design. This study was approved by the ethics committee of the university (CEUA-UFMG; protocol number: 73/2021). Every effort was made to ensure animal welfare.
The experiment was performed in two steps, according to the protocol described in detail in (52, 53). The first stage (T1) lasted 8 weeks, in which the mice were randomly divided into two groups: those fed the American Institute of Nutrition 93-Growth (AIN93G) control diet (n = 20) and those fed the High Sugar and Butter (HSB) diet (n = 80) (54, 55). The groups were named according to the diet consumed: AIN93G and HSB. The second stage (T2) lasted 4 weeks, in which the animals were subdivided into 10 groups, named according to their specific treatment and genetic status: AIN93G + H2O (n = 10), AIN93G + EtOH (n = 10), HSB + H2O (n = 10), HSB + EtOH (n = 10), Switch + H2O (n = 10), Switch + EtOH (n = 10), Switch Il6 KO + H2O (n = 10), Switch Il6 KO + EtOH (n = 10), Switch Nfat KO + H2O (n = 10), and e Switch Nfat KO + EtOH (n = 10). During this period, five groups (+H2O) had access to water only, while the other five (+EtOH) had free choice between water and a 10% ethanol solution. In the Switch groups the HSB diet was switched to the AIN93G diet when starting T2. Figure 1 illustrates the experimental design.
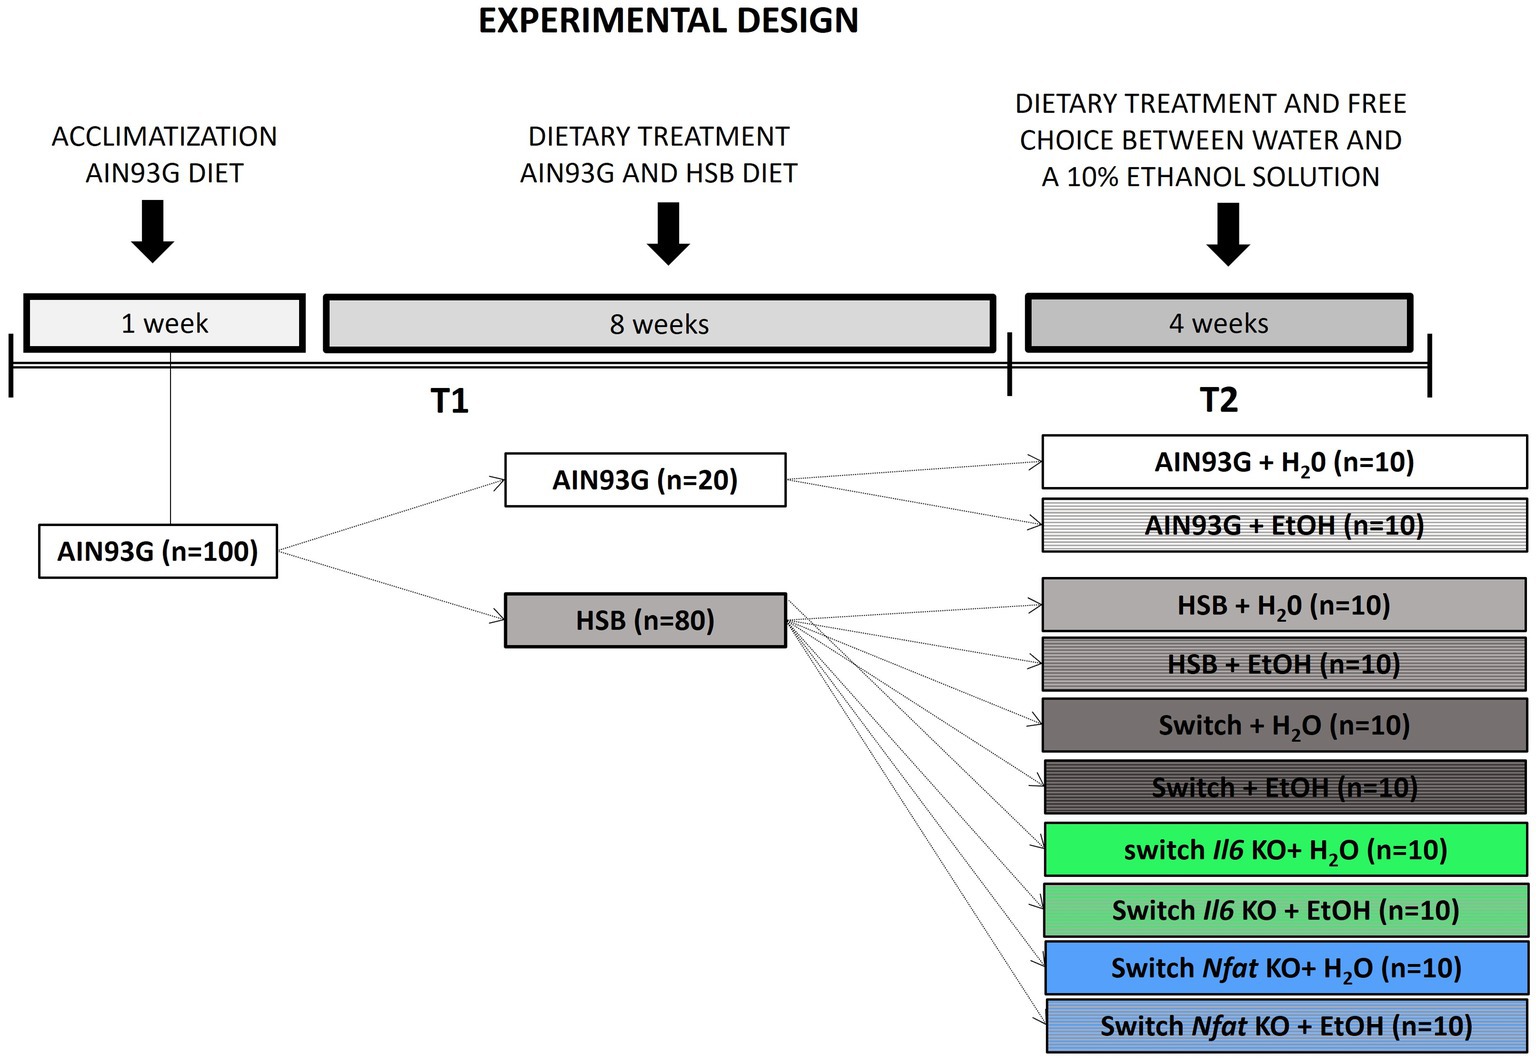
Figure 1. Experimental design. First, the animals underwent a one-week acclimation period and were fed the standard American Institute of Nutrition 93-Growth (AIN93G) diet. At the next 8 weeks (stage T1) the mice were divided into two groups: one group was fed the standard AIN93G diet (n = 20) and the other was fed a high sugar and high fat (HSB) diet (n = 80). In stage T2, lasting a total of 4 weeks, the animals were subdivided into 10 groups, named according to their particular treatments: AIN93G + H2O (n = 10), AIN93G + EtOH (n = 10), HSB + H2O (n = 10), HSB + EtOH (n = 10), Switch + EtOH (n = 10), Switch + H2O (n = 10), Switch Il6 KO + H2O (n = 10), Switch Il6 KO + EtOH (n = 10), Switch Nfat KO + H2O (n = 10) e Switch Nfat KO + EtOH (n = 10). During the 4-week T2 period, five groups (+H2O) had access to water only, while the remaining five (+EtOH) had free choice between water and a 10% ethanol solution. During T2, in the Switch groups, the HSB diet was replaced by the AIN93G diet.
Throughout the experimental protocol, the body weight of the mice was measured weekly. During T2, ethanol and water intake was observed daily. Specimens were euthanized 1 day after the end of T2 during the light cycle. At euthanasia, perigonadal adipose tissue and spleen were collected from all mice. The perigonadal adipose tissue was washed with saline solution and weighed for determination of the adiposity index, according to (56). In addition, the brains of 40 animals (four from each group) were collected for flow cytometry, and, from the other 60 ones, the striatum was extracted and used for molecular analyses.
Measurements were made according to (52, 53). The daily consumption of water and alcohol was established by subtracting the initial weight by the final weight of the bottles (in grams) and then divided by the weight of the animal for the week. The bottles with 10% ethanol had their liquids changed after each measurement to counteract the loss of the substance by evaporation. Preference was determined when the percentage of alcohol ingested in relation to the total liquid consumed constituted a value statistically greater than the hypothetical threshold of 50.1% (52).
The behavior of the animals was observed from the Marble burying and the light/dark box tests. On the penultimate day of T2, the specimens were subjected to the Marble burying test, which is classically used for the purpose of investigating impulsive and obsessive–compulsive like behaviors (57–59). The test and its analysis were performed according to (52, 60). In this process, each mouse was placed individually in a standard cage lined with five centimeters of sawdust. Eighteen marbles were arranged in three rows of six, evenly distributed. The animals were assessed for their burrowing behavior after 10 min, when the number of marbles with at least 2/3 of their size covered by sawdust were counted. This counting was conducted by two independent researchers, and an average number of balls buried was then established, which was used to measure the obsessive–compulsive behavior of each animal (57).
The light/dark box test was performed as described by (61). This test, based on mice natural aversion to open, brightly lit places and the spontaneous exploratory behavior of rodents in response to mild stressors, is intended to study anxiety-like behavior (62). Initially, on the last day of T2, each specimen was allocated to the dark compartment of the box, which has passages to allow free transit between this area and the light one. The mice were filmed for 5 min while they explored these sections and the videos were observed in EthoVision® XT version 12 software (Noldus Information Technology, Utrecht, The Netherlands) (63). The time spent in the clear compartment, latency, number of transitions, and the distance moved in the clear part were recorded. In this scenario, shorter time in the light compartment and longer latency is associated with anxiety-like behavior in animals (62, 64).
The extraction of leukocytes from the brain was adapted from (65). Once collected, the brains were macerated and kept in Falcon tubes (50 mL) with 4 mL of DMEM medium supplemented with collagenase D at 250 μg/mL in a CO2 stove at 37°C for 45 min. Then 10 mL of DMEM with EDTA (2 Mm) was added and the samples were centrifuged for 5 min at 450 g, 4°C. The supernatant was discarded, and the cells were resuspended in 37% Percoll. This suspension was added to another Falcon tube (15 mL) containing 3 mL of 60% Percoll and centrifuged at 950 g at 24°C for 20 min. After centrifugation, the ring of mononuclear cells was collected, transferred to Falcon tubes (15 mL) with 10 mL of complete DMEM and centrifuged again at 450 g for 5 min. Finally, the samples were resuspended in 200 μL of PBS with 0.2% fetal bovine serum. In spleen extraction, the cell suspensions were homogenized and centrifuged for 10 min at 1,200 rpm, 4°C. Lysis of red blood cells from the spleen was performed with 10X PBS diluted 1:10 in water. Subsequently, the cells were centrifuged again and resuspended in RPMI 1640 (GIBCO BRL) plus 10% fetal bovine serum, 2 mM L-glutamine, 20 μg/mL gentamicin sulfate, 25 mM HEPES (Sigma, St. Louis, Missouri), and 50 μM β-mercaptoethanol (Amersham Pharmacia Biotech), pH 7.2. For both organs, the cells were counted using an optical microscope with a Neubauer chamber (66).
Cells isolated from the brain and spleen were plated in an approximate amount of 1 × 10⁶. Then 10 μL per well of the cocktail of monoclonal anti-phenotypic marker antibodies conjugated with the fluorochromes FITC, PercP-cy5.5, PE-Cy7, APC, AmCyan, and biotin (the latter was bound to streptavidin Pacific Blue later) were added. The cells were incubated at 4°C for 30 min in the dark, washed with 100 μL per well of PBS-BSA-NaN3, and centrifuged at 1,200 rpm for 10 min. The supernatant was discarded and then the washing procedure was repeated. Subsequently, the biotin-labeled cells were incubated again (for 30 min) with streptavidin-Pacific Blue and washed another two times as described. Finally, they were resuspended in 200 μL of fixative solution (0.5% formaldehyde in PBS1X) and kept at 4°C in the dark until the next day. The antibodies used were anti-CD11b (FITC); anti-F4/80 (PE-Cy7), anti-CD45.2 (biotin + streptavidin Pacific Blue), and cell viability markers (AmCyan). Reading was performed using the FACS Fortessa (Beckton Dickinson, Mountain View, California), and analyses conducted using the FlowJo program (Tree Star Inc).
Primer design was performed as described by (52), when necessary. Table 1 describes the sequences (5′ → 3′) of the target genes used in this study (52, 67–71). For RT-qPCR analyses, total striatum RNA was extracted as described by (52). RNA concentration and purity were investigated with a DeNovix DS-11 spectrophotometer (Delaware, United States). RNA integrity was visualized on a 1% agarose gel, stained with GelRed (Biotium, California, United States). Reverse transcription was performed with oligo primers (Dt20; Prodimol Biotecnologia, Belo Horizonte, Brazil), dNTP mix (10 mM), Reaction Buffer 5X (Thermo Fisher Scientific, São Paulo, Brazil), and M-MLV Reverse Transcriptase (Promega Wisconsin, United States), according to the manufacturer’s guidelines. Levels of gene transcription were measured using the CFX 96TM Real-Time system thermocycler (BioRad, California, United States). The RT-qPCR reactions for each gene were performed using 10 μL GoTaq® RT-qPCR Sybr (Promega, Wisconsin, United States), 1 μL cDNA (10 ng/μL), 0.4 μL of sense and antisense primer solution (10 pM), and 8.2 μL Invitrogen RT-PCR Grade Water (Thermo Fisher Scientific, Massachusetts, United States) (52). In all reactions, a negative control without cDNA template (NTC) was used, and the final reaction volume was kept at 20 μL. qPCR amplification was performed without the extension step (95°C for 3 min, followed by 40 cycles of 95°C for 3 s and 60°C for 20 s). Fluorescence levels were measured at the end of each cycle (56). The relative quantifications were calculated by the delta–delta Ct method (72). The normalizing genes used were Glyceraldehyde-3-Phosphate Dehydrogenase (Gapdh) and Peptidylprolyl isomerase A (Ppia) (71, 73). The stability of these reference genes was confirmed using the geNorm software used to evaluate multiple internal control genes (73).
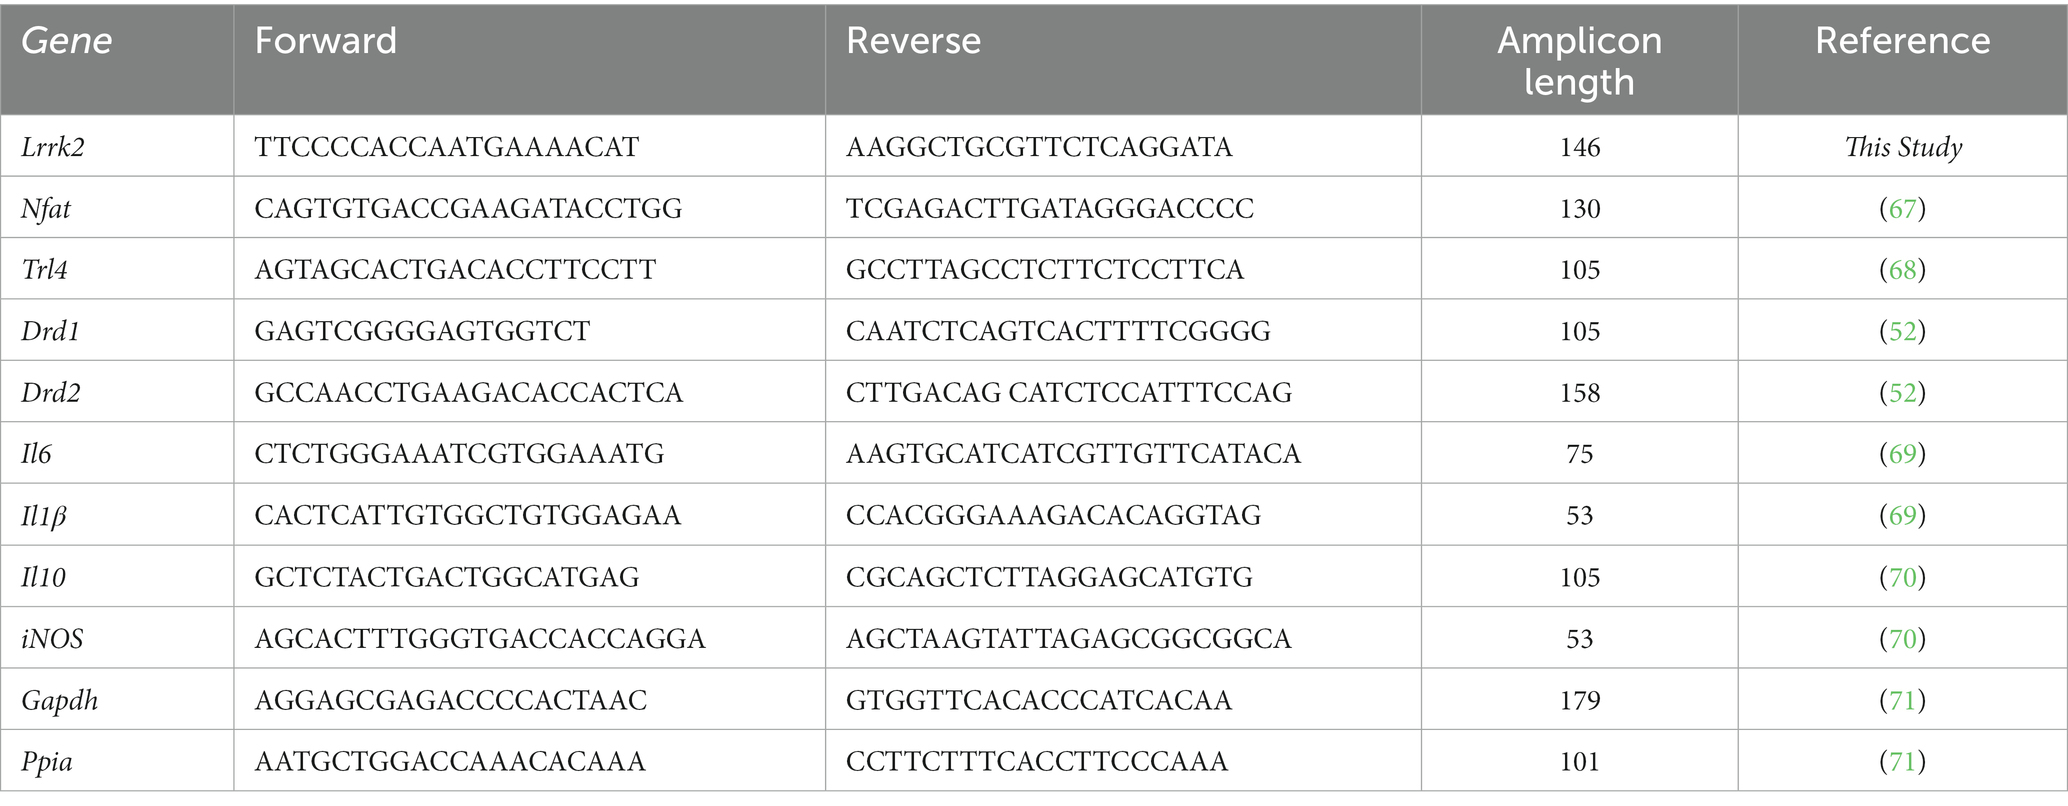
Table 1. RT-qPCR Primers sequences (5′ → 3′).
The data were evaluated for distribution with the Shapiro–Wilk normality test. They were expressed as mean ± SEM. Two-way ANOVA, followed by the post hoc Tukey test, was employed in the analysis of body weight at T1 and T2, adiposity index, ethanol consumption, behavioral tests, percentage of labeled cells in flow cytometry, and relative quantification of transcripts of selected genes in the striatum. The ANOVA data are represented as [F (between-group df, within-group df) = F-statistic, value of p]. The Mann–Whitney Test was used to compare the preference for ethanol with the hypothetical value of 50.1%. Spearman correlation with simple linear regression was used to study the relationship between the transcriptional levels of Nfat and Lrrk2. All analyses were conducted in the GraphPad Prism statistical package, version 9.0.2 (GraphPad Software, Inc. San Diego, United States). The significance level was p < 0.05 and it was indicated with an asterisk (*).
Two-way ANOVA showed that body weight at T1 was significantly affected by diet [F (1, 89) = 9.087, p = 0.0034], by period of ingestion [F (2,338,208.1) = 228.9, p < 0.0001] and by the interaction of these factors [F (8, 712) = 9.110, p < 0.0001]. At the end of T2, the treatment carried out [F (9, 81) = 20.73, p < 0.0001], the duration of the experiment [F (1,901, 154.0) = 13.44, p < 0.0001] and the interaction between these aspects [F (24, 243) = 11.03, p < 0.0001] impacted on the weight gain of mice. The post hoc test revealed that the animals that ingested the HSB diet throughout the experiment had significantly higher body weight (p < 0.05) contrasted to the other groups, that ingested only the AIN93G diet or that at T2 the HSB diet was switched to the AIN93G formulation (Figures 2A,B). Also, at T2, the animals in the Switch + H2O group had higher body weight (p < 0.05) compared to those in the Switch Nfat KO + H2O group (Figure 2B).
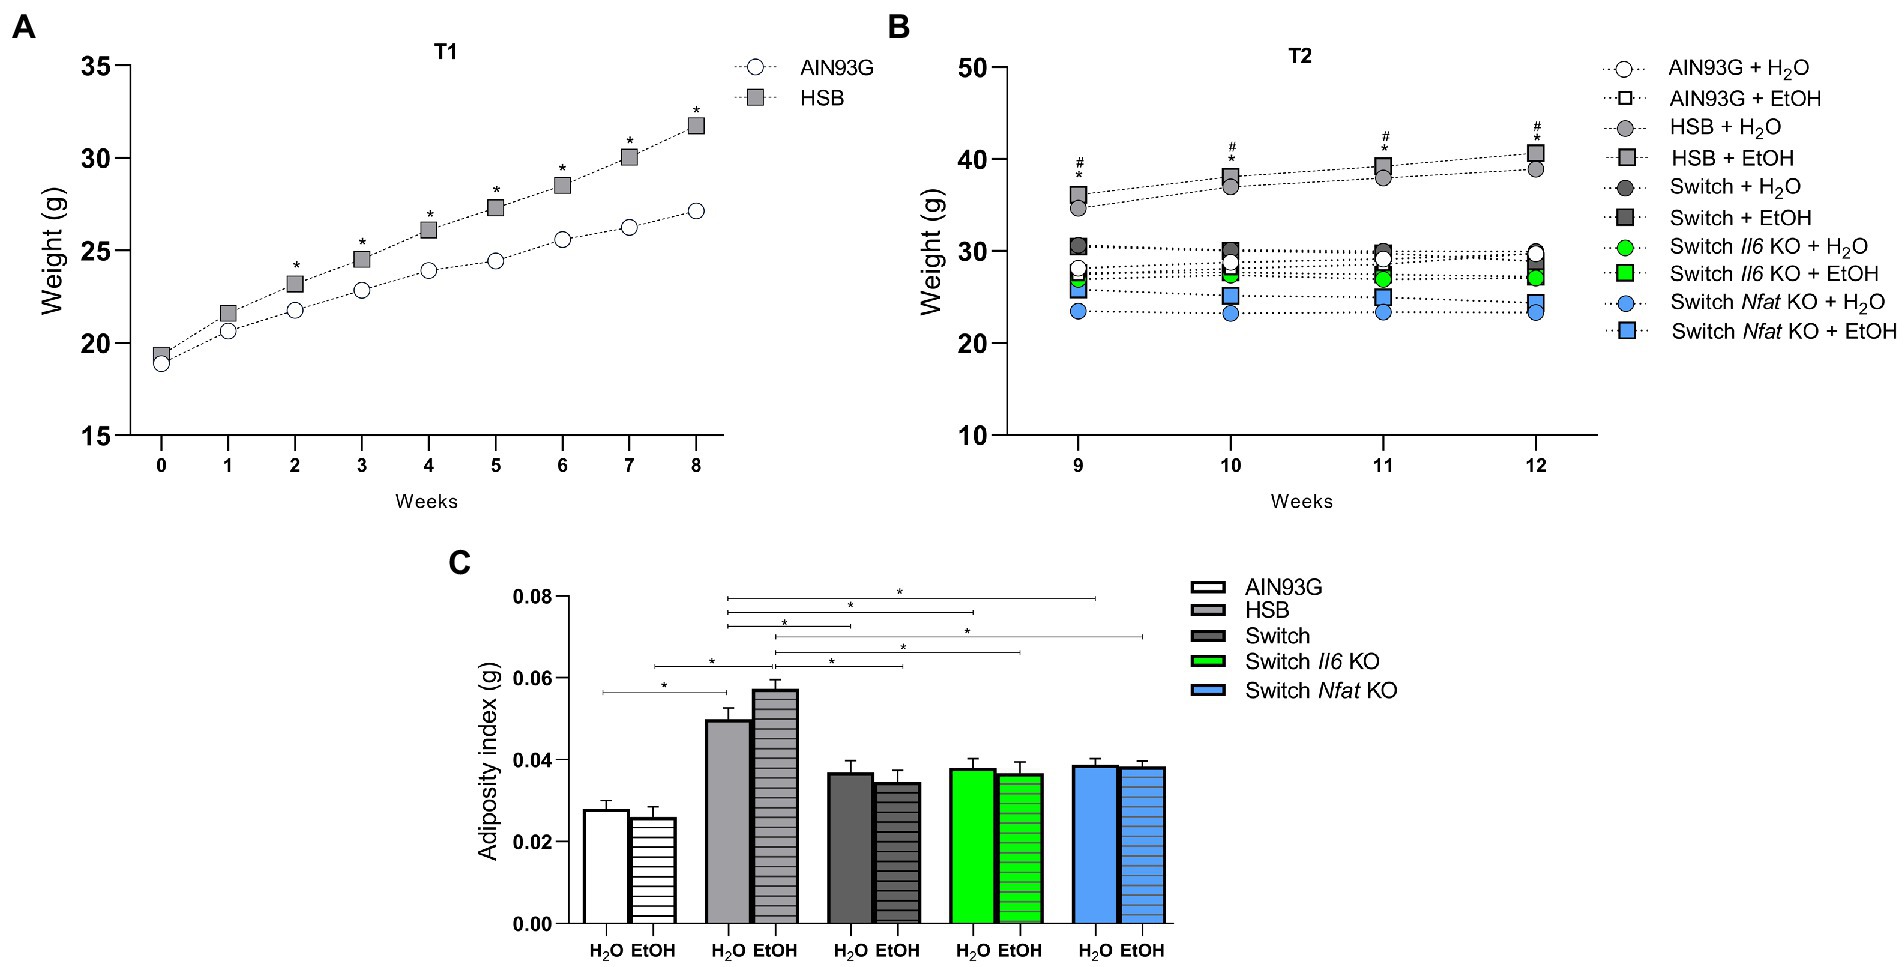
Figure 2. Body weight and adiposity index. (A) T1 body weight (g). (B) T2 body weight (g). (C) Adiposity index (g). Results are expressed as mean ± SEM. Analyses were performed with two-way ANOVA followed by post hoc Tukey. In (A) *p < 0.05 for AIN93G vs. HSB. In (B), *p < 0.05 for HSB + H2O and HSB + EtOH vs. AIN93G + H2O, AIN93G + EtOH, Switch + H2O, Switch + EtOH, Switch II6 KO + H2O, Switch Il6 KO + EtOH, Switch Nfat KO + H2O and Switch Nfat KO and #p < 0.05 for Switch + H2O vs. Switch Nfat KO+ H2O. Asterisks (*) and (#) represent post hoc test differences between groups.
In addition, the two-way ANOVA showed that the adiposity index, which shows the perigonadal fat accumulation in the animals, was influenced by diet [F (4, 81) = 30.40, p < 0.0001] and not by ethanol [F (1, 81) = 0.02760, p = 0.8685], and the post hoc test indicated that specimens from the HSB group (HSB + H2O and HSB + EtOH) had a higher adiposity index (p < 0.05) contrasted to animals from the groups AIN93G and Switch (AIN93G + H2O, AIN93G + EtOH, Switch + H2O, Switch + EtOH, Switch Il6 KO + H2O, Switch Il6 KO + EtOH, Switch Nfat KO + H2O, and Switch Nfat KO + EtOH; Figure 2C).
Regarding the daily consumption of ethanol, the two-way ANOVA showed that the type of diet [F (4, 41) = 69.56, p < 0.0001] and the period of consumption of the drink [F (12.18, 499.5) = 3.559, p < 0.0001] significantly affected the animals. After switching from the HSB diet to the AIN93G diet at the end of T1, the post hoc test indicated that specimens from the Switch + EtOH, Switch Il6 + EtOH, and Switch Nfat KO + EtOH groups consumed alcohol similarly (p > 0.05), except on days 11, 17, 20, 25, 27, and 28, in which the mice in the Switch Nfat KO + EtOH group ingested a greater amount of the drug than the animals in the Switch Il6 KO + EtOH group. All groups with diet change (Switch + EtOH, Switch Il6 + EtOH and Switch Nfat KO + EtOH) consumed significantly higher amounts of the substance (p < 0.05) compared to the animals in the AIN93G + EtOH and HSB + EtOH, which did not differ from each other (Figure 3A). The preference for ethanol over water was also greater (p < 0.0001) among specimens from the Switch + EtOH, Switch II6 + EtOH and Switch Nfat KO + EtOH groups. Meanwhile, mice from the AIN93G + EtOH group showed no preference for the beverage (p < 0.0001) and those from the HSB + EtOH group did not express a significant result (p = 0.1138) in relation to the hypothetical value of 50.1% (Figure 3B).
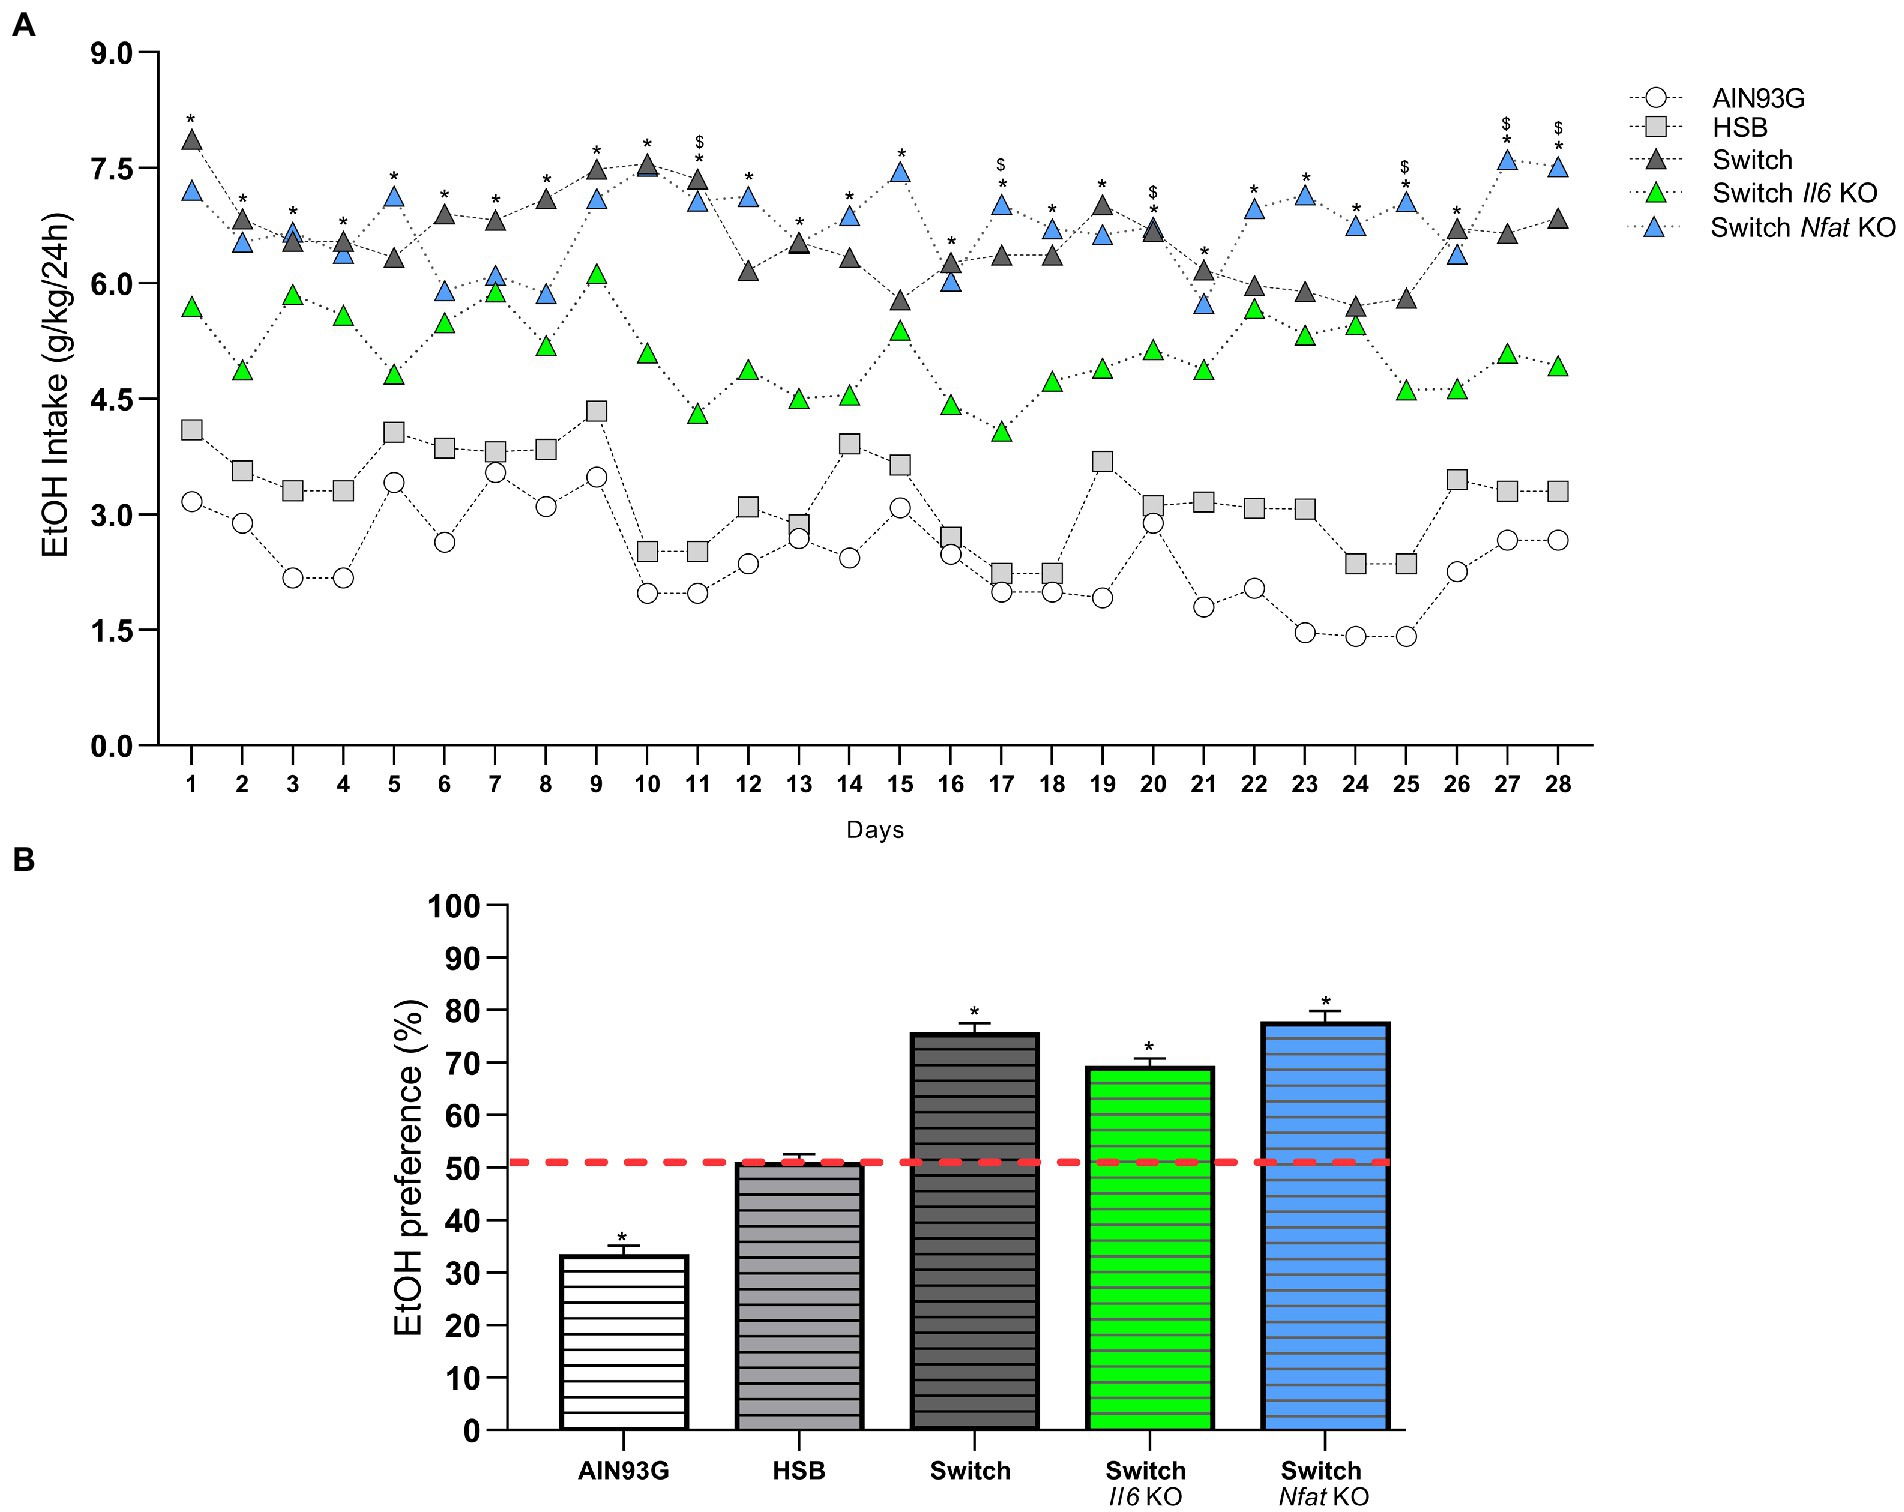
Figure 3. Daily intake and ethanol preference. (A) Ethanol intake is expressed as the ratio between daily consumption and body weight (g/Kg/24 h). (B) Ethanol preference is determined by (%) consumed in relation to total fluid intake. Results are expressed as mean ± SEM. Analyses were performed with two-way ANOVA followed by post hoc Tukey test in (A) and by Mann–Whitney test versus the hypothetical value of 50.1% in (B). In (A) *p < 0.05 for Switch + EtOH, Switch Il6 KO + EtOH and Switch Nfat KO + EtOH vs. HSB + EtOH and AIN93G vs. EtOH and for Switch Nfat KO + EtOH vs. Switch Il6 KO + EtOH on days 11, 17, 20, 25, 27, and 28. In (B) *p < 0.05 for the hypothetical value of 50.1% vs. AIN93G + EtOH, Switch + EtOH, Switch Il6 KO + EtOH and Switch Nfat KO + EtOH. Asterisks (*) represent post hoc test differences between groups.
Two-way ANOVA [F (3, 50) = 8.513, p = 0.0001] showed that the Marble Burying test was influenced mainly by the interaction between dietary treatment and beverage consumption. This test is used to assess impulsivity, typical characteristic of obsessive–compulsive and anxious behavior in mice (56, 57). In this sense, the post hoc test indicated that the animals in the AIN93G group (AIN93G + H2O and AIN93G + EtOH) expressed low impulsivity compared to those in the HSB groups (HSB + H2O and HSB + EtOH), Switch (Switch + H2O and Switch + EtOH), Switch Il6 KO + EtOH and Switch Nfat KO (Switch Nfat KO + H2O and Switch Nfat KO + EtOH; Figure 4A). Interestingly, mice from the Switch Il6 KO + H2O group showed low impulsivity contrasted to those from the Switch Il6 KO + EtOH group, while no differences were observed in relation to the specimens from the Switch Nfat KO group (Figure 4A).
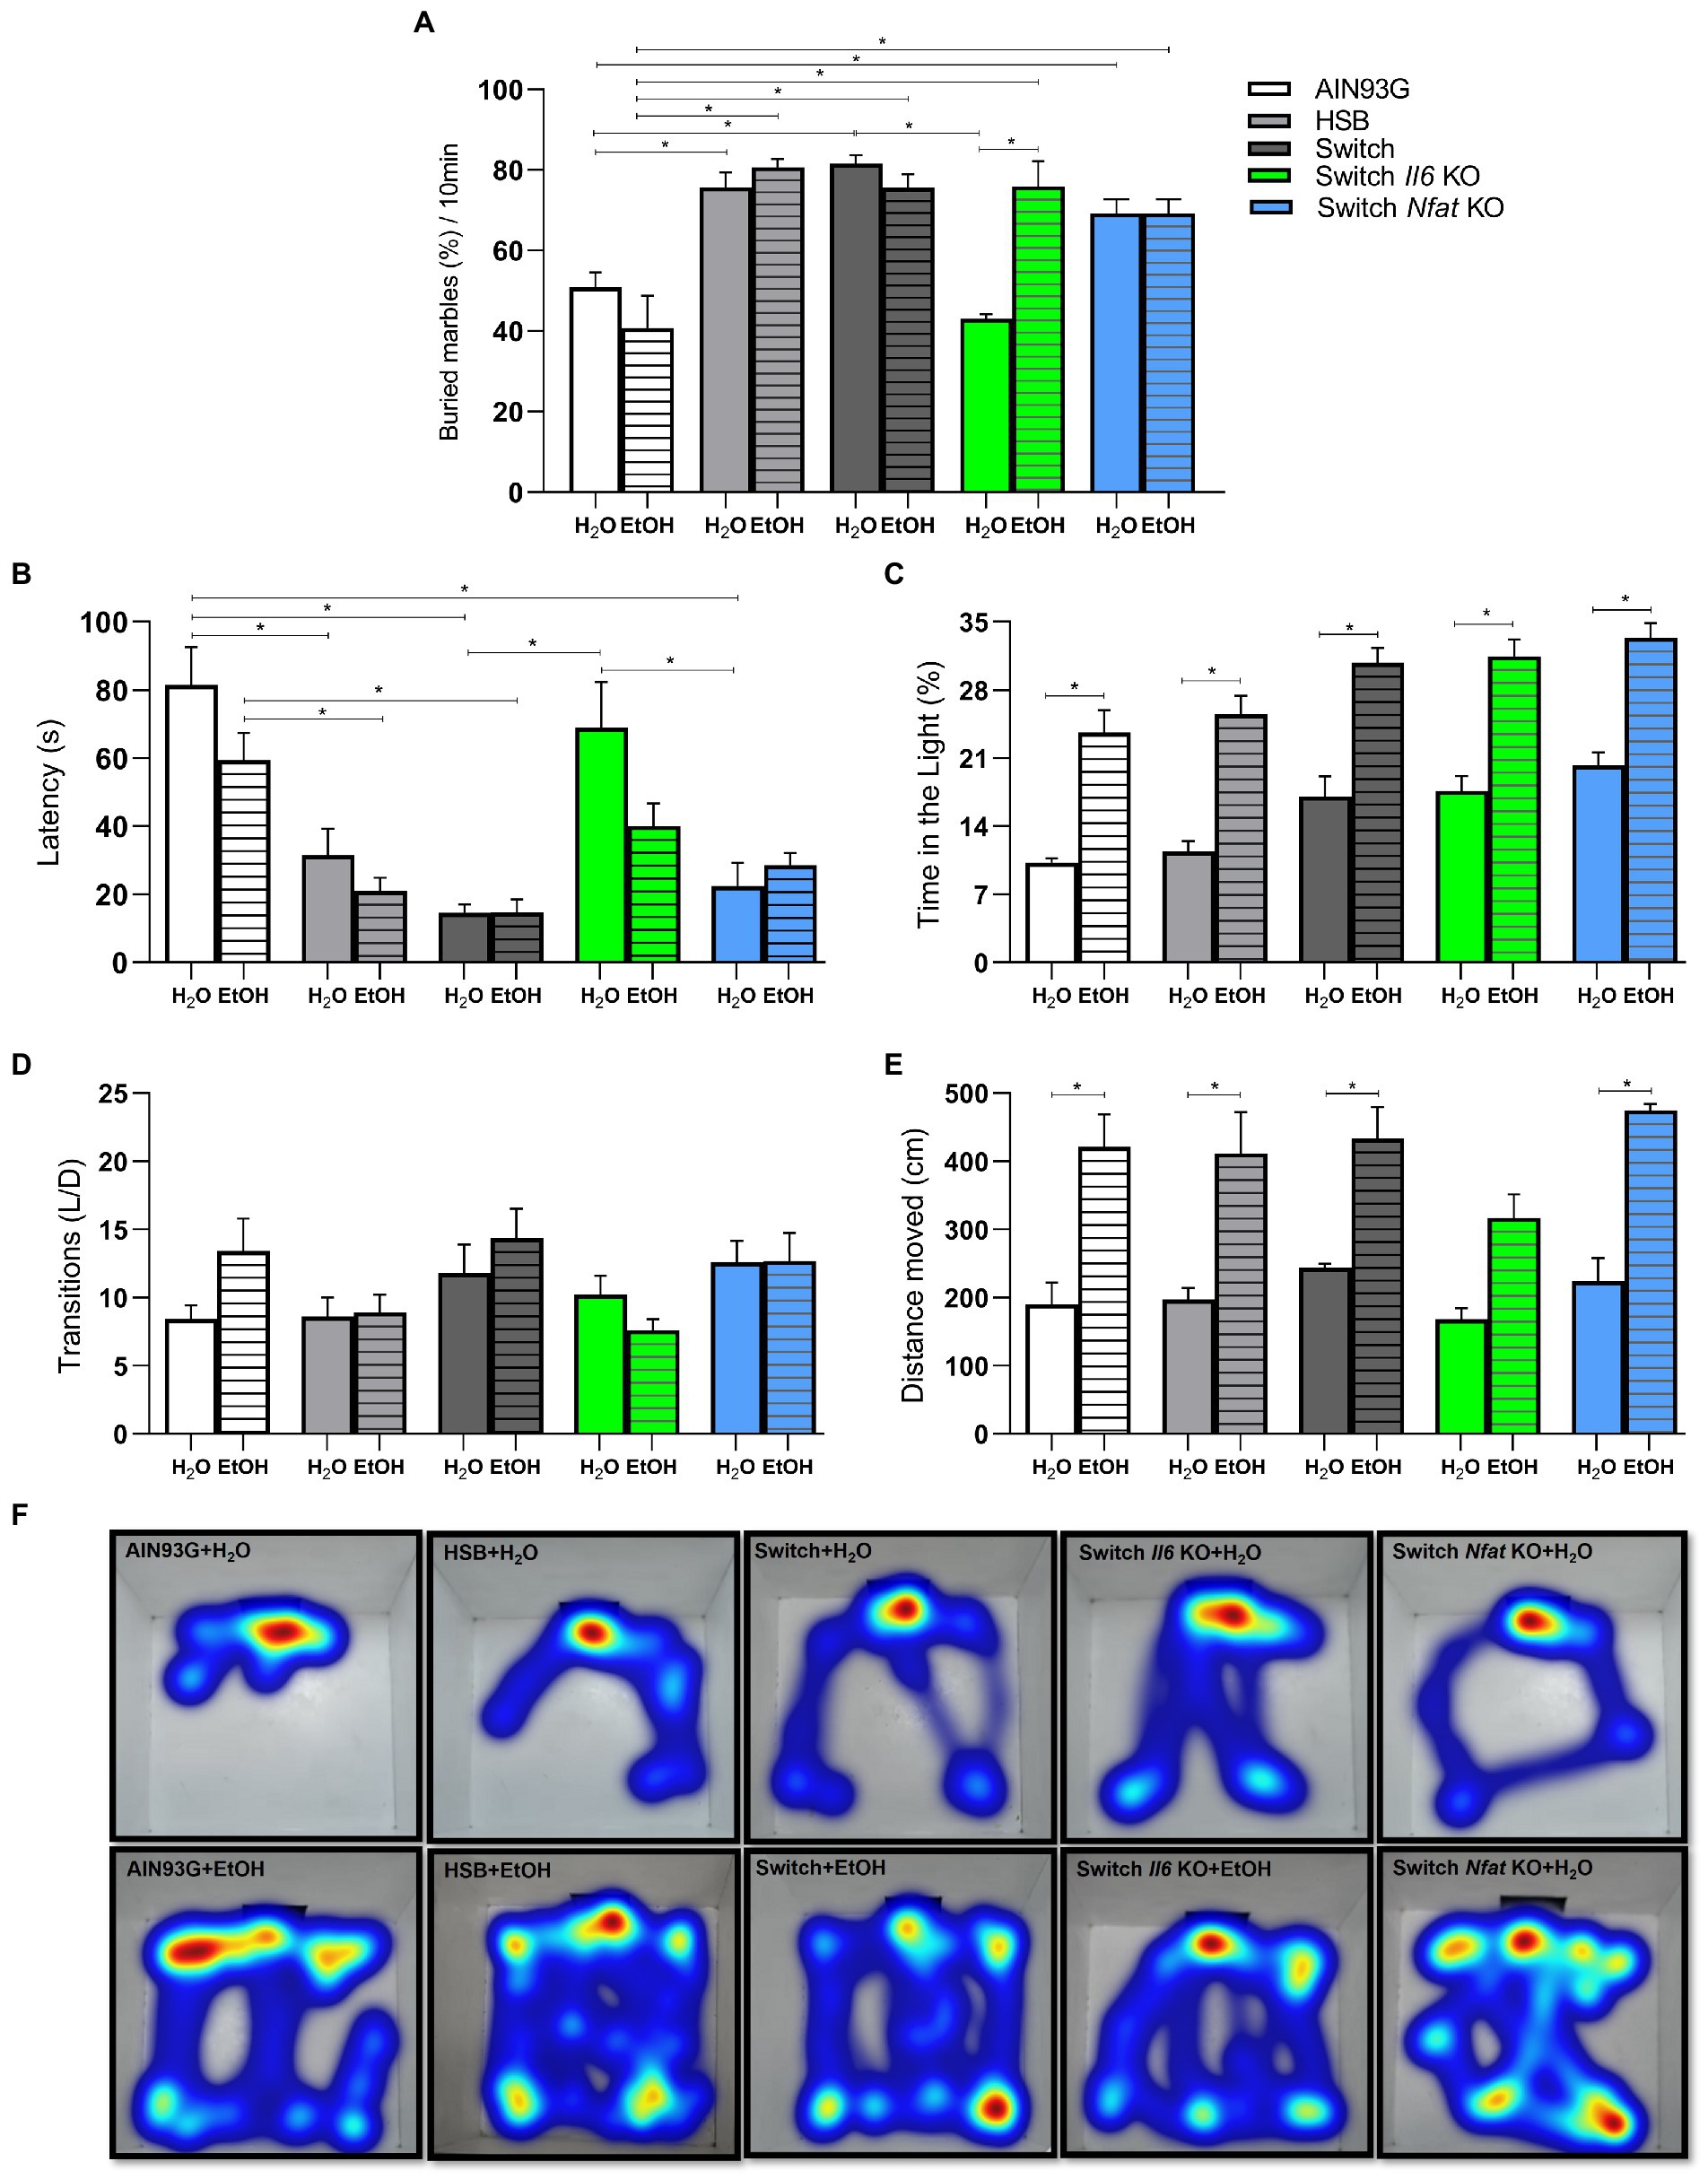
Figure 4. Behavioral analyses. Impulsive-like behavior was evaluated in the Marble burying test by (A) % of buried marbles. Anxiety-like behavior was evaluated in the light/dark box test by (B) Latency (s), (C) Time on the light (%), (D) Transitions number, (E,F) Distance moved (CM). Results are expressed as mean ± SEM. Analyses were performed with two-way ANOVA followed by post hoc Tukey test. In (A) *p < 0.05 for AIN93G + H2O vs. HSB + H2O and Switch + H2O, for AIN93G + EtOH vs. HSB + EtOH, Switch + EtOH and Switch Il6 KO + EtOH and for Switch Il6 KO + H2O vs. Switch + EtOH and Switch Il6 KO + EtOH. In (B) *p < 0.05 for AIN93 + H2O vs. HSB + H2O, Switch + H2O, and Switch Nfat KO + H2O, for AIN93G + EtOH vs. HSB + EtOH and Switch + EtOH and for Switch Il6 + H2O vs. Switch + H2O and Switch Nfat + H2O. In (C,E) *p < 0.05 for AIN93 + H2O vs. AIN93G + EtOH, for HSB + H2O vs. HSB + EtOH, for Switch + H2O vs. Switch + EtOH, for Switch II6 KO + H2O vs. Switch Il6 KO + EtOH and for Switch Nfat KO + H2O vs. Switch Nfat KO+ EtOH. Asterisks (*) represent post hoc test differences between groups.
The light/dark box test is traditionally applied in assessing anxious-like behavior in animal models, using metrics such as latency, time spent in the light compartment, number of transitions, and distance traveled within the box (46, 56). In this context, two-way ANOVA revealed that diet and ethanol affected both latency [diet: F (4, 67) = 20.68, p < 0.0001; ethanol: F (1, 67) = 5.065, p = 0.0277] and time spent in the light compartment [diet: F (4, 73) = 9.551, p < 0.0001; ethanol: F (1, 73) = 94.23, p < 0.0001], while alcohol alone [F (1, 1, 64) = 75.28, p < 0.0001] influenced the results related to the distance traveled inside the bright part of the box.
For latency, the post hoc test indicated that animals from the HSB (HSB + H2O and HSB + EtOH), Switch (Switch + H2O and Switch + EtOH) and Switch Nfat KO (Switch Nfat KO + H2O and Switch Nfat KO + EtOH) started exploring the bright part of the compartment in a shorter time (p < 0.05) than specimens from the AIN93G group (AIN93G + H2O and AIN93G + EtOH), demonstrating an anxiolytic effect of the treatment for these animals (Figure 4A). Meanwhile, those in the Switch Il6 KO + H2O group exhibited a longer latency time contrasted to those in the Switch + H2O and Switch Nfat KO + H2O groups (Figure 4B). No differences were observed in relation to the Switch Il6 KO + EtOH group (Figure 4B). Mice from the +EtOH groups (AIN93G + EtOH, HSB + EtOH, Switch + EtOH, Switch Il6 KO + EtOH, and Switch Nfat KO + EtOH) spent more time (p < 0.05) in the light compartment of the box than those of +H2O groups (AIN93G + H2O, AIN93G + H2O, Switch + H2O, Switch Il6 KO + H2O, and Switch Nfat KO + H2O; Figure 4C). These data again confirm the anxiolytic effect of the experimental treatments. No significant differences were noticed regarding the number of light/dark transitions (Figure 4D).
Regarding the distance covered in the bright part of the box, the post hoc test showed that the animals in the +EtOH groups (AIN93G + EtOH, HSB + EtOH, Switch + EtOH, Switch Il6 KO + EtOH, and Switch Nfat KO + EtOH) covered a greater distance (p < 0.05) and hence explored the environment more than the +H2O groups (AIN93G + H2O, AIN93G + H2O, Switch + H2O, Switch Il6 KO + H2O, and Switch Nfat KO + H2O; Figure 4E). This result is pictured by the Heatmaps presented in Figure 4F, in which the greater exploitation of the area by the animals of the +EtOH groups becomes evident.
In the brain, two-way ANOVA revealed that diet is the main factor for changes in the percentages of CD45 + F4/80 + CD11b + cells [F (4, 27) = 36.43, p < 0.0001]. The post hoc test showed that the animals in the Switch Il6 KO + EtOH group had a higher (p < 0.05) percentage of CD45 + F4/80 + CD11b + cells than the animals in the AIN93G + EtOH, HSB + EtOH, and Switch + EtOH groups. Likewise, it was indicated that the animals in the Switch + EtOH group have a higher percentage of this marker in their cells than those in the AIN93G + EtOH and HSB + EtOH groups (Figure 5A). The Switch Nfat KO + EtOH group has a higher percentage when compared to the AIN93G + EtOH group (Figure 5A). For the same marker, the Switch Nfat KO + H2O group has higher amounts than the AIN93G + H2O, HSB + H2O, Switch + H2O groups (Figure 5A). In the spleen, diet [F (4, 27) = 108.0, p < 0.0001] was responsible for the differences in cells labeled with CD45 + F4/80 + CD11b. The post hoc test confirmed that the AIN93G, HSB, and Switch (AIN93G + H2O, AIN93G + EtOH, HSB + H2O, HSB + EtOH, Switch + H2O, and Switch + EtOH) groups have higher percentages (p < 0.05) of CD45 + F4/80 + CD11b + cells when compared to Il6 and Nfat KO animals (Switch Il6 + H2O, Switch Il6 + EtOH, Switch Nfat + H2O, and Switch Nfat + EtOH; Figure 5B).
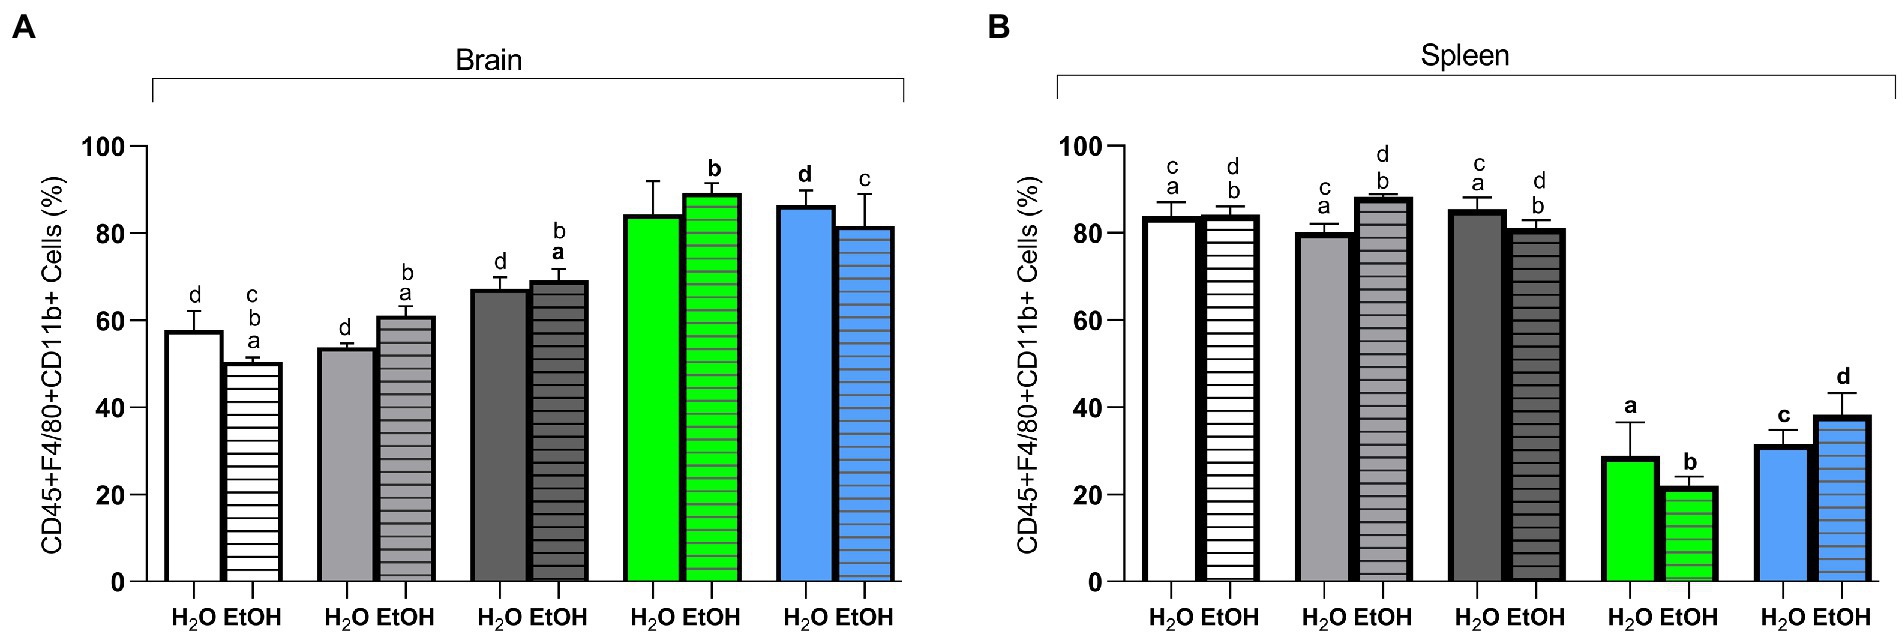
Figure 5. Flow cytometry of brain and spleen cells. (A) CD45 + F4/80 + CD11b + (%) in the brain. (B) CD45 + F4/80 + CD11b + (%) in the spleen. Results are expressed as mean ± SEM. Analyses were performed with two-way ANOVA followed by post hoc Tukey test. In (A) p < 0.05 for (a) AIN93G + EtOH vs. HSB + EtOH and Switch + EtOH, for (b) HSB + EtOH vs. Switch + EtOH and Switch Il6 KO + EtOH, for (c) AIN93G + EtOH vs. Switch + EtOH and (d) for AIN93G + H2O vs. HSB + H2O, Switch + H2O and Switch Nfat KO + H2O. In (B) p < 0.05 for (a) Switch II6 + H2O vs. AIN93G + H2O, HSB + H2O and Switch + H2O, for (b) Switch II6 + EtOH vs. AIN93G + EtOH, HSB + EtOH, and Switch + EtOH, (c) for Switch Nfat + H2O vs. AIN93G + H2O, HSB + H2O, and Switch + H2O and (d) for Switch Nfat + EtOH vs. AIN93G + EtOH, HSB + EtOH, and Switch + EtOH.
Transcriptional regulation of key genes and cytokines related to ethanol consumption and dependence were affected in the different experimental groups of the present study (57). Two-way ANOVA showed that alcohol is the only factor responsible for differences in the transcriptional regulation of genes Nfat [F (1, 47) = 11.67, p = 0.0013], Il1β [F (1, 46) = 42.02, p < 0.0001], Il10 [F (1,44) = 13.40, p = 0.0007], and iNOS [F (1,46) = 35.00, p < 0.0001]. Whereas Drd1 [F (4, 44) = 5.476, p = 0.0011], Drd2 [F (4, 42) = 2. 642, p = 0.0469], Il6 [F (2, 27) = 3.788, p = 0.0355], Tlr4 [F (4, 39) = 1.141, p = 0.3516], and Lrrk2 [F (4, 46) = 11.68, p < 0.0001] were responsible for the observed differences in the interaction between diet and ethanol consumption. We evaluated the transcription of dopamine receptors Drd1 and Drd2 in the striatum. Post hoc analysis concluded that Drd1 was upregulated in HSB + H2O when compared to AIN93G + H2O, HSB + EtOH, and Switch + EtOH, while it was downregulated on Switch Nfat KO + H2O and + EtOH compared to Switch II6 KO + H2O and + EtOH, and Switch + H2O and + EtOH, respectively (Figure 6A). Drd2 was upregulated in Switch + H2O when compared to AIN93G + H2O, HSB + H2O and Switch + EtOH; Switch + EtOH versus HSB + EtOH, Switch Il6 KO + H2O versus Switch Il6 KO + EtOH, and Switch Nfat KO + H2O versus Switch Nfat KO + EtOH (Figure 6B).
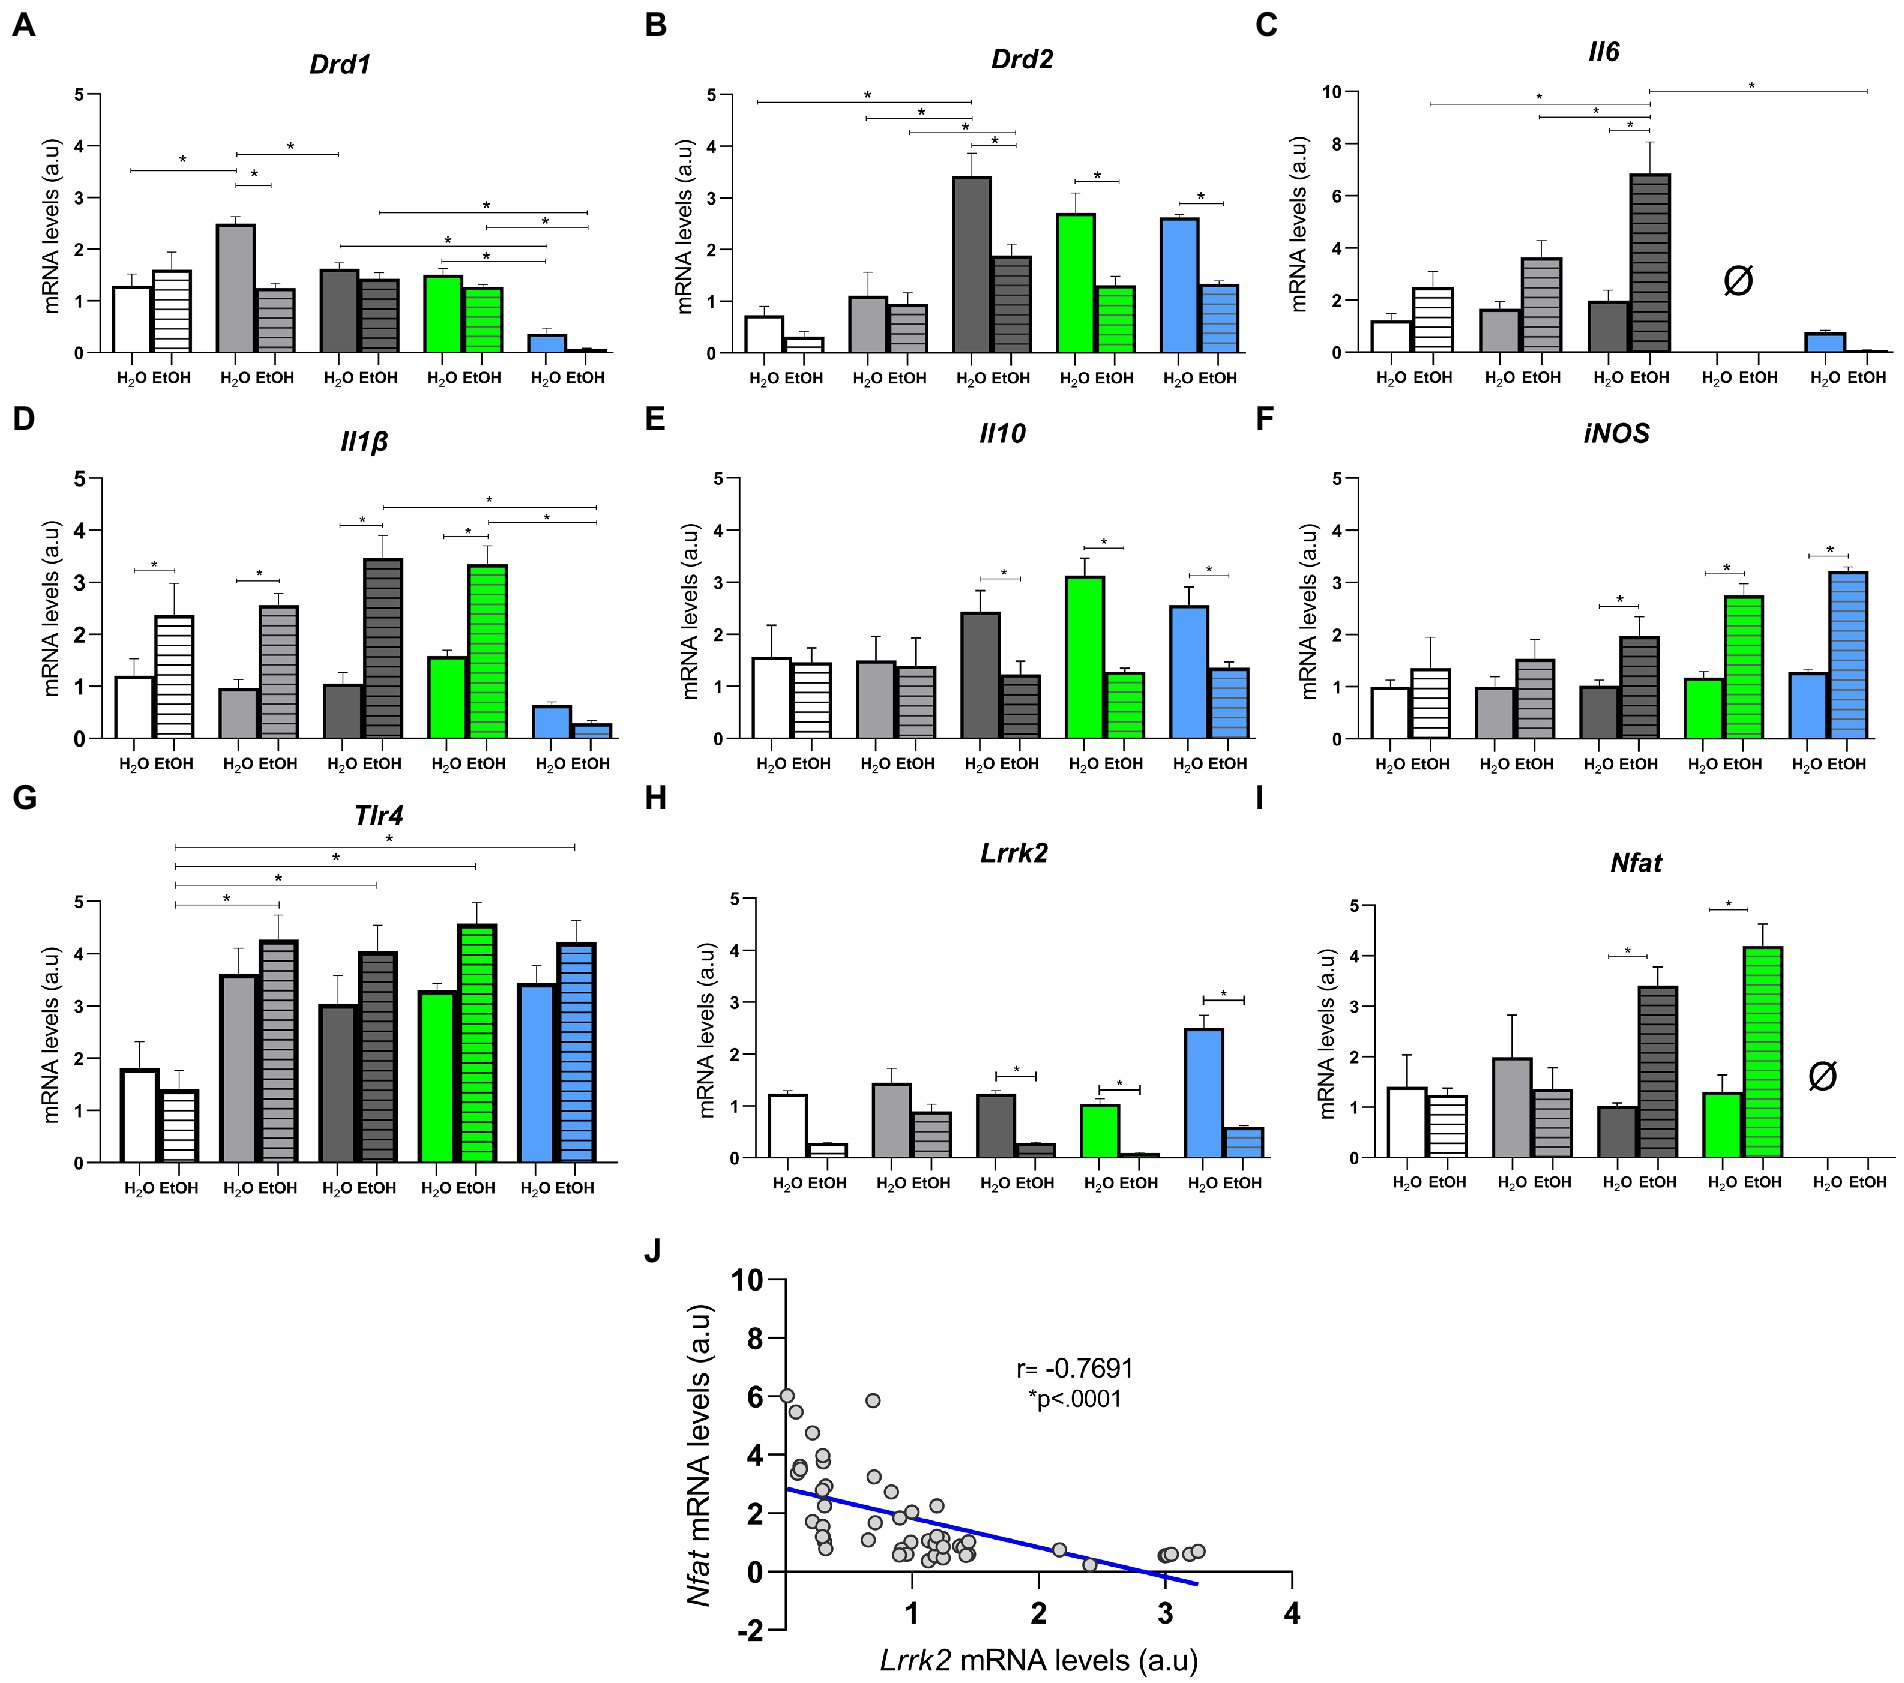
Figure 6. Relative mRNA quantification in the striatum. Relative mRNA levels in (A) Drd1, (B) Drd2, (C) Il6, (D) Il1β, (E) Il10, (F) iNOS, (G) Tlr4, (H) Lrrk2, and (I) Nfat. Results are expressed as mean ± SEM. Analyses were performed with two-way ANOVA followed by post hoc Tukey test. (J) Spearman correlation between mRNA levels of the Lrrk2 and Nfat genes. In (A) *p < 0.05 for AIN93G + H2O vs. HSB + H2O, for HSB + H2O vs. HSB + EtOH and Switch + H2O, for Switch + H2O vs. Switch Nfat KO + H2O, for Switch + EtOH vs. Switch Nfat KO + EtOH, for Switch Il6 KO + H2O vs. Switch Nfat KO + H2O and for Switch Il6 KO + EtOH vs. Switch Nfat KO + EtOH. In (B) *p < 0.05 for Switch + H2O vs. AIN93G + H2O, HSB + H2O and Switch + EtOH, for Switch Il6 KO + H2O vs. Switch Il6 KO + EtOH and for Switch Nfat KO + H2O vs. Switch Nfat KO + EtOH. In (C) *p < 0.05 for Switch + EtOH vs. AIN93G + EtOH, HSB + EtOH, Switch + H2O and Switch Nfat KO + EtOH. In (D) *p < 0.05 for AIN93G + H2O vs. AIN93G + EtOH, for HSB + H2O vs. HSB + EtOH, for Switch + EtOH vs. Switch + H2O and for Switch Nfat KO + EtOH, for Switch Il6 KO + EtOH vs. Switch Il6 KO + H2O and Switch Nfat KO + EtOH. In (E,F,H) *p < 0.05 for Switch + H2O vs. Switch + EtOH, for Switch Il6 KO + H2O vs. Switch Il6 KO + EtOH and for Switch Nfat KO + H2O vs. Switch Nfat KO + EtOH. In G *p < 0.05 for AIN93G + EtOH vs. HSB + EtOH, Switch + EtOH, Switch II6 KO + EtOH and Switch Nfat KO + EtOH. In (I) *p < 0.05 for Switch + H2O vs. Switch + EtOH and for Switch Il6 KO + H2O vs. Switch Il6 KO + EtOH.
As for inflammatory cytokines (Il6 and Il1β) and anti-inflammatory (Il10), post hoc analysis revealed that Il-6 was upregulated (p < 0.05) in the Switch + EtOH group contrasted to animals in the HSB + EtOH, AIN93G + EtOH, and Switch Nfat KO + EtOH groups (Figure 6C). Il-1β was downregulated in HSB + H2O, Switch + H2O and Switch Il6 KO + H2O animals compared to HSB + EtOH, Switch + EtOH, and Switch Il6 KO + EtOH animals, respectively, and Switch Nfat KO + EtOH compared to Switch + ETOH and Switch Il6 KO + EtOH (Figure 6D). Il-10 was upregulated in animals from the Switch + H2O, Switch Il6 KO + H2O, and Switch Nfat KO + H2O groups compared to animals from the Switch + EtOH, Switch Il6 KO + EtOH, and Switch Nfat KO + EtOH (Figure 6E). The iNOS gene showed downregulation in the Switch + H2O, Switch Il6 KO + H2O, and Switch Nfat KO + H2O groups contrasted to the Switch + EtOH, Switch Il6 KO + EtOH, and Switch Nfat KO + EtOH groups, respectively (Figure 6F). The Tlr4 gene was downregulated in the AIN93G + EtOH group when compared to other groups that had access to alcohol (Figure 6G). The Lrrk2 gene, which was recently associated with loss of control and preference for ethanol by our research group, showed downregulation in groups that consumed high ethanol (Switch + EtOH, Switch Il6 KO + EtOH, and Switch Nfat KO + EtOH; Figure 6H). Conversely, the Nfat gene was upregulated in these groups (Figure 6I). Interestingly, Spearman’s correlation demonstrated a negative relationship between the Lrrk2 and Nfat genes (r = 0.7691, regression equation −1.007*X + 2.840, p < 0.0001; Figure 6J).
Intending to evaluate the transcriptional regulation of the Lrrk2 gene in association with genes related to the immune system and its implications on the behavior and ethanol preference in C57BL/6 mice, we reproduced a model of chronic consumption of HSB diet and free choice of alcohol, as detailed by (52, 53). Here, we also conducted the model on two KO animals’ lines, Il6 and Nfat. In this previously mentioned model, it was observed that, after feeding the mice for 8 weeks with the HSB diet and its subsequent switch to the AIN93G diet, it was verified in the animal’s high ethanol consumption and preference (52, 53). Additionally, animals that consumed only the HSB diet developed obesity-like characteristics (54, 56). We reproduced these results as seen in Figures 2, 3 and observed that the absence of Il6 and Nfat genes does not significantly alter the ethanol preference and consumption in animals over time. Indeed, we had already demonstrated that the results observed in this model are linked to instability in the mesocorticolimbic dopaminergic pathway due to alterations in the transcriptional regulation of dopamine receptors (Drd1/Drd2) and here, in addition to reproducing these results, we demonstrate that in the absence of Il6 or Nfat, the transcription profile of these genes remains in high consumption and preference for ethanol (52, 53).
Concerning behavior, the Marble Burying test showed greater impulsivity in animals that had access to the HSB diet in T1, being comparable to the obsessive–compulsive disorder seen in humans (59, 74, 75). This result is consistent with studies in which hypercaloric diets were associated with binge eating (56, 76, 77). Thus, this allows us to suggest that the HSB diet consumption can trigger an obsessive–compulsive-like disorder in mice and that our model can be applied in studies related to bariatric surgery in humans, mainly regarding the relationship of this procedure with alcohol consumption. Studies show that in the 2-year postoperative follow-up to bariatric surgery, about 8.3% of patients develop disorders related to alcohol use (78–80). In general, it is believed that there is a transfer from compulsive eating to ethanol high consumption and loss of inhibitory control in individuals after bariatric surgery, which potentiates preference for the substance, as observed in the Switch groups (Switch + EtOH, Switch Il6 KO + EtOH, and Switch Nfat KO + EtOH) (81–83).
Ethanol use is associated with many other behavioral changes (84). In the present study, we observed an anxiolytic effect associated with ethanol chronic consumption, evidenced by low latency, high permanence time, greater distance moved, and exploration of the light compartment in the light/dark box test in animals that were in groups associated with the paradigm free choice for ethanol, and it is important to highlight that this behavior was observed regardless of the amount ingested. This finding is corroborated by several animal model studies that show the anxiolytic effect of the consumption of this drug (10, 61, 85, 86). Considering that anxiety is a defense strategy in mice, as it is associated with an aversion to open and lit places that make them more visible to potential predators, the reduction in that behavior harms them (62, 87). In this context, this effect is also deleterious for humans since it is a positive reinforcement in situations of high anxiety and depressive symptoms, which may be one of the key factors for the development and maintenance of drug dependence (88, 89). Therefore, several strategies are investigated to block the ethanol anxiolytic effects; for example, Correia et al. (90) used catalase activity-blocking drugs that inhibited ethanol metabolism in the brain and they succeeded in mitigating the alcohol anxiolytic effects on animals (90). Thus, the authors concluded that psychopharmacological strategies that block the ethanol action in the brain can be used to reduce the dependence effects of this drug (90). Given this, the model developed here can be efficient in the study of ethanol-related neurobiological and behavioral changes, especially for studies aimed at blocking the alcohol anxiolytic effects in animal models.
Considering yet the behavioral tests, we observed that changing the HSB to AIN93G diet had a different impact on the behavior of the animals in the Switch Il6 KO + EtOH group. These animals showed higher impulsivity compared to the H2O animals, which in turn had a lower latency in the light/dark box than the animals in the Switch + H2O and Switch Nfat KO + H2O groups. Although these results do not have direct implications concerning ethanol consumption in Il6 KO animals, they should be considered in relation to immune response and inflammatory molecules importance in behavioral changes, since the immune system is implicated in several psychiatric diseases development, such as depression, bipolar disorder, schizophrenia, autism, anxiety, and AUD (19, 91–93).
In general, it is known that ethanol exposure activates neuroimmune signaling, causing a highly inflammatory environment in the brain, in which microglial cells, macrophages and monocytes infiltrates increase pro-inflammatory markers transcription (IL1β, IL6), reduce anti-inflammatory markers (IL10) and increase levels of nitric oxide synthase (iNOS) (25, 94–97). In this context, in an extensive review of the topic, Montesinos et al. describe ways in which ethanol regulates the transcription of neuroimmune and microglial genes and, in particular, mention the activation of toll-like receptors four present in immune cells and neurons by bacterial components that activate the inflammatory response (18). In fact, in previous studies, our research group described changes in the abundance and structure of gut microbiota and proposed that the increase in bacterial translocation to the bloodstream would allow those bacterial components to activate the cerebral inflammatory response (53, 96). In the present study, in addition to demonstrating a possible change in Tlr4 transcription in animals that intaken alcohol, we also observed an increase in macrophages (CD45 + F4/80 + CD11b+) in the brain of animals in the Switch group (Switch + EtOH, Switch Il6 KO + EtOH, and Switch Nfat KO + EtOH) (98, 99). Functionally, CD11b regulates the adhesion and migration of leukocytes for the mediation of the inflammatory response (100–102). Therefore, the potential for neuroinflammation to be induced by the gut microbiota in these animals should not be overlooked. In the spleen, there was a decrease in macrophages (CD45 + F4/80 + CD11b+) of the Il6 KO and Nfat KO animals, showing that these genes are important for the maintenance of these cells in the organ in view of the treatments given to the animals be capable of affecting and modifying pathways associated with systemic inflammation processes in their organisms (103, 104). Specifically in the striatum, brain region sensitive to ethanol, activation of neuroimmune signaling is observed with drug consumption. By exposing mice to ethanol for 8 weeks, Asatryan et al. observed increased neurodegeneration and transcription of pro-inflammatory mediators in striatum (94). This supports our findings since we observed in the striatum an upregulation of genes related to pro-inflammatory cytokines Il6 and Il1β and a downregulation of Il10 in mice with ethanol high consumption (Switch + EtOH). Interestingly, we observed iNOS upregulation in animals from the Switch + EtOH, Switch Il6 KO + EtOH, and Switch Nfat KO + EtOH groups, which is logical because of the inverse relationship with the transcript of Il10 since this interleukin is known to suppress iNOS induction (105). Thus, the Il10 low levels in animals with ethanol high intake and preference may be contributing to the iNOS increase whose expression is the result of a localized or diffuse inflammatory response (106, 107). In parallel with the results described, we found a Lrrk2 downregulation and a Nfat upregulation in these groups, which makes sense, considering its NFAT inhibitory role (45, 48). So, with a lower Lrrk2 transcription, there are higher levels of NFAT, which can trigger an increase in inflammatory cytokines depending on that molecule and which play a key role in the inflammation process. In fact, we found a negative correlation between these genes that suggests the possibility that low Lrrk2 transcription could increase neuroinflammation and drive in part the ethanol dependence phenotype cannot be disregarded. This is confirmed without the Nfat gene, where there are inflammatory cytokines with low transcription, showing its importance in inducing these in the striatum in the face of ethanol intake and a close relationship with Lrrk2.
In this context, our research group identified relations of the Lrrk2 gene, until then associated with Parkinson’s and inflammatory bowel diseases, in preference behavior and loss of control by alcohol in mice, Zebrafish, and humans (31, 32, 36, 108–110). This gene is involved in neural processes, such as the reuptake of synaptic components and synaptic plasticity, and in several signaling pathways by performing GTPase and kinase functions, which influence processes such as cell proliferation and differentiation, apoptosis, inflammation, and immune response (50, 111–116). Evidence in humans and mice corroborates with the results of this study regarding the differential regulation with Lrrk2 downregulation to alcohol intake. In this scenario, in humans, Lrrk2 downregulation was observed in the post-mortem brain of patients with AUD, and mice, it was observed that alcohol decreases the activity of LRRK2 kinase in the striatum and that deletion of the gene in striatal neurons that express D1 promotes the binge drinking by D1 receptor signaling and function (31, 36). Despite this, some studies have shown the opposite results. In a model of loss of control by ethanol in mice, a Lrrk2 hyperregulation was observed in the striatum of animals that showed a preference for the substance even after the adverse stimulus and the inhibition of the kinase function of this gene in Zebrafish reduced the ethanol preference (31, 109). The conflicting results found in these studies are difficult to compare concerning this study, because of the existing differences regarding the treatments used, experimental models, ethanol time of exposure, and concentration. Hence, even with discrepant findings, our results allow us to propose that alterations in the transcriptional regulation profile of this gene play a key role in ethanol high consumption and preference and with the immune response in the striatum.
In summary, the results of the present study demonstrate how the animal model of HSB diet consumption and ethanol ingestion developed by our group is reproducible and can be efficient in the study of alterations related to AUD. With this model, we also showed that ethanol consumption affected (I) the behavior of the animals, (II) neuroinflammation, and (III) the regulation of the transcription of genes Tlr4, Lrrk2, Nfat, and cytokines in the striatum, where there is an increase of inflammatory and reduction of anti-inflammatory cytokines. Thus, the data obtained in the study contribute to a better understanding of the factors associated with the neurobiology of AUD and, consequently, to the elucidation of new therapeutic targets for this disease.
The original contributions presented in the study are included in the article/supplementary material, further inquiries can be directed to the corresponding author.
The animal study was reviewed and approved by the ethics committee of the university (CEUA-UFMG; protocol number: 73/2021). Every effort was made to ensure animal welfare.
RM conducted the animal model, performed the molecular and behavioral analyses, contributed to Leukocyte extraction, and wrote the paper. MG performed the Leukocyte extraction and flow cytometry. ME contributed to the experiments and statistical analysis. TM and AF developed the HSB diet and helped to discuss the results. AB contributed to the project development and supervised all the study steps. All authors contributed to the article and approved the submitted version.
RM received a doctoral fellowship from the Coordenação de Aperfeiçoamento de Pessoal de Nível Superior—Brazil (CAPES, Ministry of Education, Brazil) and a pos-doctoral grand by the Fundação de Amparo à Pesquisa do Estado de Minas Gerais (FAPEMIG), APQ-04517-22. This work was supported by the Fundação de Amparo à Pesquisa do Estado de Minas Gerais (FAPEMIG), APQ-01213-21 and APQ-04517-22, Pró-Reitoria de Pesquisa (PRPq), and Pós-Graduação em Genética from the Universidade Federal de Minas Gerais (UFMG), Brazil.
The authors declare that the research was conducted in the absence of any commercial or financial relationships that could be construed as a potential conflict of interest.
All claims expressed in this article are solely those of the authors and do not necessarily represent those of their affiliated organizations, or those of the publisher, the editors and the reviewers. Any product that may be evaluated in this article, or claim that may be made by its manufacturer, is not guaranteed or endorsed by the publisher.
1. Ducci, F, and Goldman, D. Genetic approaches to addiction: genes and alcohol. Addiction. (2008) 103:1414–28. doi: 10.1111/j.1360-0443.2008.02203.x
2. Deak, JD, Miller, AP, and Gizer, IR. Genetics of alcohol use disorder: a review. Curr Opin Psychol. (2019) 27:56–61. doi: 10.1016/j.copsyc.2018.07.012
3. Siomek-Gorecka, A, Dlugosz, A, and Czarnecki, D. The molecular basis of alcohol use disorder (AUD). Genetics, epigenetics, and nutrition in AUD: an amazing triangle. Int J Mol Sci. (2021) 22:4262. doi: 10.3390/ijms22084262
4. Shield, KD, Parry, C, and Rehm, J. Chronic diseases and conditions related to alcohol use. Alcohol Res. (2013) 35:155–73.
5. Morojele, NK, Shenoi, SV, Shuper, PA, Braithwaite, RS, and Rehm, J. Alcohol use and the risk of communicable diseases. Nutrients. (2021) 13:3317. doi: 10.3390/nu13103317
6. Seitz, HK, and Scherübl, H. Alcohol use and gastrointestinal diseases. Visc Med. (2020) 36:157–9. doi: 10.1159/000507643
7. Liu, X, Vigorito, M, Huang, W, Khan, MAS, and Chang, SL. The impact of alcohol-induced Dysbiosis on diseases and disorders of the central nervous system. J NeuroImmune Pharmacol. (2022) 17:131–51. doi: 10.1007/s11481-021-10033-4
8. Peng, B, Yang, Q, B Joshi, R, Liu, Y, Akbar, M, Song, BJ, et al. Role of alcohol drinking in Alzheimer's disease, Parkinson's disease, and amyotrophic lateral sclerosis. Int J Mol Sci. (2020) 21:2316. doi: 10.3390/ijms21072316
9. Blumenthal, H, Taylor, DJ, Cloutier, RM, Baxley, C, and Lasslett, H. The links between social anxiety disorder, insomnia symptoms, and alcohol use disorders: findings from a large sample of adolescents in the United States. Behav Ther. (2019) 50:50–9. doi: 10.1016/j.beth.2018.03.010
10. Boerngen-Lacerda, R, and Souza-Formigoni, ML. Does the increase in locomotion induced by ethanol indicate its stimulant or anxiolytic properties? Pharmacol Biochem Behav. (2000) 67:225–32. doi: 10.1016/S0091-3057(00)00360-9
11. Lees, B, Meredith, LR, Kirkland, AE, Bryant, BE, and Squeglia, LM. Effect of alcohol use on the adolescent brain and behavior. Pharmacol Biochem Behav. (2020) 192:172906. doi: 10.1016/j.pbb.2020.172906
12. Hillemacher, T, Bachmann, O, Kahl, KG, and Frieling, H. Alcohol, microbiome, and their effect on psychiatric disorders. Prog Neuro-Psychopharmacol Biol Psychiatry. (2018) 85:105–15. doi: 10.1016/j.pnpbp.2018.04.015
13. Wise, RA, and Bozarth, MA. A psychomotor stimulant theory of addiction. Psychol Rev. (1987) 94:469–92. doi: 10.1037/0033-295X.94.4.469
14. Schreckenberger, M, Amberg, R, Scheurich, A, Lochmann, M, Tichy, W, Klega, A, et al. Acute alcohol effects on neuronal and attentional processing: striatal reward system and inhibitory sensory interactions under acute ethanol challenge. Neuropsychopharmacology. (2004) 29:1527–37. doi: 10.1038/sj.npp.1300453
15. Korlakunta, A, and Reddy, CMP. High-risk behavior in patients with alcohol dependence. Indian J Psychiatry. (2019) 61:125–30. doi: 10.4103/psychiatry.IndianJPsychiatry_395_17
16. Pascual, M, Baliño, P, Aragón, CMG, and Guerri, C. Cytokines and chemokines as biomarkers of ethanol-induced neuroinflammation and anxiety-related behavior: role of TLR4 and TLR2. Neuropharmacology. (2015) 89:352–9. doi: 10.1016/j.neuropharm.2014.10.014
17. Harris, RA, Bajo, M, Bell, RL, Blednov, YA, Varodayan, FP, Truitt, JM, et al. Genetic and pharmacologic manipulation of TLR4 has minimal impact on ethanol consumption in rodents. J Neurosci. (2017) 37:1139–55. doi: 10.1523/JNEUROSCI.2002-16.2016
18. Montesinos, J, Alfonso-Loeches, S, and Guerri, C. Impact of the innate immune response in the actions of ethanol on the central nervous system. Alcohol Clin Exp Res. (2016) 40:2260–70. doi: 10.1111/acer.13208
19. Coppens, V, Morrens, M, Destoop, M, and Dom, G. The interplay of inflammatory processes and cognition in alcohol use disorders-a systematic review. Front Psychol. (2019) 10:632. doi: 10.3389/fpsyt.2019.00632
20. Coleman, LG, and Crews, FT. Innate immune signaling and alcohol use disorders. Handb Exp Pharmacol. (2018) 248:369–96. doi: 10.1007/164_2018_92
21. Devlin, BA, Smith, CJ, and Bilbo, SD. Sickness and the social brain: how the immune system regulates behavior across species. Brain Behav Evol. (2022) 97:197–210. doi: 10.1159/000521476
22. Kelley, KW, and Dantzer, R. Alcoholism and inflammation: neuroimmunology of behavioral and mood disorders. Brain Behav Immun. (2011) 25:S13–20. doi: 10.1016/j.bbi.2010.12.013
23. Vetreno, RP, Qin, L, and Crews, FT. Increased receptor for advanced glycation end product expression in the human alcoholic prefrontal cortex is linked to adolescent drinking. Neurobiol Dis. (2013) 59:52–62. doi: 10.1016/j.nbd.2013.07.002
24. Rubio-Araiz, A, Porcu, F, Pérez-Hernández, M, García-Gutiérrez, MS, Aracil-Fernández, MA, Gutierrez-López, MD, et al. Disruption of blood-brain barrier integrity in postmortem alcoholic brain: preclinical evidence of TLR4 involvement from a binge-like drinking model. Addict Biol. (2017) 22:1103–16. doi: 10.1111/adb.12376
25. Lowe, PP, Morel, C, Ambade, A, Iracheta-Vellve, A, Kwiatkowski, E, Satishchandran, A, et al. Chronic alcohol-induced neuroinflammation involves CCR2/5-dependent peripheral macrophage infiltration and microglia alterations. J Neuroinflammation. (2020) 17:296. doi: 10.1186/s12974-020-01972-5
26. Alfonso-Loeches, S, Pascual-Lucas, M, Blanco, AM, Sanchez-Vera, I, and Guerri, C. Pivotal role of TLR4 receptors in alcohol-induced neuroinflammation and brain damage. J Neurosci. (2010) 30:8285–95. doi: 10.1523/JNEUROSCI.0976-10.2010
27. Fernandez-Lizarbe, S, Montesinos, J, and Guerri, C. Ethanol induces TLR4/TLR2 association, triggering an inflammatory response in microglial cells. J Neurochem. (2013) 126:261–73. doi: 10.1111/jnc.12276
28. Vaghi, MM, Vértes, PE, Kitzbichler, MG, Apergis-Schoute, AM, van der Flier, FE, Fineberg, NA, et al. Specific Frontostriatal circuits for impaired cognitive flexibility and goal-directed planning in obsessive-compulsive disorder: evidence from resting-state functional connectivity. Biol Psychiatry. (2017) 81:708–17. doi: 10.1016/j.biopsych.2016.08.009
29. Nishimura, M, Yoshii, Y, Watanabe, J, and Ishiuchi, S. Paralimbic system and striatum are involved in motivational behavior. Neuroreport. (2009) 20:1407–13. doi: 10.1097/WNR.0b013e328330a883
30. Di Chiara, G, and Bassareo, V. Reward system and addiction: what dopamine does and doesn't do. Curr Opin Pharmacol. (2007) 7:69–76. doi: 10.1016/j.coph.2006.11.003
31. da Silva e Silva, DA, Frozino Ribeiro, A, Damasceno, S, Rocha, CS, Berenguer de Matos, AH, Boerngen-Lacerda, R, et al. Inflexible ethanol intake: a putative link with the Lrrk2 pathway. Behav Brain Res. (2016) 313:30–7. doi: 10.1016/j.bbr.2016.07.001
32. Martins de Carvalho, L, Fonseca, PAS, Paiva, IM, Damasceno, S, Pedersen, ASB, Silva e Silva, D, et al. Identifying functionally relevant candidate genes for inflexible ethanol intake in mice and humans using a guilt-by-association approach. Brain Behav. (2020) 10:e01879. doi: 10.1002/brb3.1879
33. Paiva, IM, Sartori, BM, Castro, TFD, Lunkes, LC, Virote, BCR, Murgas, LDS, et al. Behavioral plasticity and gene regulation in the brain during an intermittent ethanol exposure in adult zebrafish population. Pharmacol Biochem Behav. (2020) 192:172909. doi: 10.1016/j.pbb.2020.172909
34. Yapo, C, Nair, AG, Clement, L, Castro, LR, Hellgren Kotaleski, J, and Vincent, P. Detection of phasic dopamine by D1 and D2 striatal medium spiny neurons. J Physiol. (2017) 595:7451–75. doi: 10.1113/JP274475
35. Parisiadou, L, Yu, J, Sgobio, C, Xie, C, Liu, G, Sun, L, et al. LRRK2 regulates synaptogenesis and dopamine receptor activation through modulation of PKA activity. Nat Neurosci. (2014) 17:367–76. doi: 10.1038/nn.3636
36. da Silva e Silva, D, Matsui, A, Mamais, A, Murray, EM, Ron, D, Cookson, MR, et al. Loss of LrrK2 function potentiates dopamine signaling in the striatum to promote compulsive alcohol use. Cell Rep. (2020). doi: 10.2139/ssrn.3725008
37. Bocarsly, ME, da Silva e Silva, D, Kolb, V, Luderman, KD, Shashikiran, S, Rubinstein, M, et al. A mechanism linking two known vulnerability factors for alcohol abuse: heightened alcohol stimulation and low striatal dopamine D2 receptors. Cell Rep. (2019) 29:1147–1163.e5. doi: 10.1016/j.celrep.2019.09.059
38. de Silva, D.D.S., Matsui, A., Murray, E.M., Mamais, A., Shaw, M., Ron, D., et al. Leucine-rich repeat kinase 2 limits dopamine D1 receptor signaling in striatum and biases against heavy persistent alcohol drinking. bioRxiv [Preprint]. (2022) doi: 10.1101/2022.05.26.493614
39. Wallings, RL, and Tansey, MG. LRRK2 regulation of immune-pathways and inflammatory disease. Biochem Soc Trans. (2019) 47:1581–95. doi: 10.1042/BST20180463
40. Dzamko, NL. LRRK2 and the immune system. Adv Neurobiol. (2017) 14:123–43. doi: 10.1007/978-3-319-49969-7_7
41. Kozina, E, Sadasivan, S, Jiao, Y, Dou, Y, Ma, Z, Tan, H, et al. Mutant LRRK2 mediates peripheral and central immune responses leading to neurodegeneration in vivo. Brain. (2018) 141:1753–69. doi: 10.1093/brain/awy077
42. Dzamko, N, Rowe, DB, and Halliday, GM. Increased peripheral inflammation in asymptomatic leucine-rich repeat kinase 2 mutation carriers. Mov Disord. (2016) 31:889–97. doi: 10.1002/mds.26529
43. Moehle, MS, Webber, PJ, Tse, T, Sukar, N, Standaert, DG, DeSilva, TM, et al. LRRK2 inhibition attenuates microglial inflammatory responses. J Neurosci. (2012) 32:1602–11. doi: 10.1523/JNEUROSCI.5601-11.2012
44. Russo, I, Berti, G, Plotegher, N, Bernardo, G, Filograna, R, Bubacco, L, et al. Leucine-rich repeat kinase 2 positively regulates inflammation and down-regulates NF-κB p50 signaling in cultured microglia cells. J Neuroinflammation. (2015) 12:230. doi: 10.1186/s12974-015-0449-7
45. Dzamko, N, and Halliday, GM. An emerging role for LRRK2 in the immune system. Biochem Soc Trans. (2012) 40:1134–9. doi: 10.1042/BST20120119
46. Rao, A, Luo, C, and Hogan, PG. Transcription factors of the NFAT family: regulation and function. Annu Rev Immunol. (1997) 15:707–47. doi: 10.1146/annurev.immunol.15.1.707
47. Harvey, K, and Outeiro, TF. The role of LRRK2 in cell signalling. Biochem Soc Trans. (2019) 47:197–207. doi: 10.1042/BST20180464
48. Wang, Y, Zhang, X, Chen, F, Chen, L, Wang, J, and Xie, J. LRRK2-NFATc2 pathway associated with Neuroinflammation may be a potential therapeutic target for Parkinson's disease. J Inflamm Res. (2021) 14:2583–6. doi: 10.2147/JIR.S301531
49. Liu, Z, Lee, J, Krummey, S, Lu, W, Cai, H, and Lenardo, MJ. The kinase LRRK2 is a regulator of the transcription factor NFAT that modulates the severity of inflammatory bowel disease. Nat Immunol. (2011) 12:1063–70. doi: 10.1038/ni.2113
50. Wallings, R, Manzoni, C, and Bandopadhyay, R. Cellular processes associated with LRRK2 function and dysfunction. FEBS J. (2015) 282:2806–26. doi: 10.1111/febs.13305
51. Reilly, MT, Noronha, A, Goldman, D, and Koob, GF. Genetic studies of alcohol dependence in the context of the addiction cycle. Neuropharmacology. (2017) 122:3–21. doi: 10.1016/j.neuropharm.2017.01.017
52. Martins de Carvalho, L, Lauar Gonçalves, J, Sondertoft Braga Pedersen, A, Damasceno, S, Elias Moreira Júnior, R, Uceli Maioli, T, et al. High-fat diet withdrawal modifies alcohol preference and transcription of dopaminergic and GABAergic receptors. J Neurogenet. (2018) 33:10–20. doi: 10.1080/01677063.2018.1526934
53. Moreira Júnior, RE, de Carvalho, LM, Pedersen, ASB, Damasceno, S, Maioli, TU, de Faria, AMC, et al. Interaction between high-fat diet and ethanol intake leads to changes on the fecal microbiome. J Nutr Biochem. (2019) 72:108215. doi: 10.1016/j.jnutbio.2019.07.006
54. Maioli, TU, Gonçalves, JL, Miranda, MCG, Martins, VD, Horta, LS, Moreira, TG, et al. High sugar and butter (HSB) diet induces obesity and metabolic syndrome with decrease in regulatory T cells in adipose tissue of mice. Inflamm Res. (2016) 65:169–78. doi: 10.1007/s00011-015-0902-1
55. Reeves, PG, Nielsen, FH, and Fahey, GC. AIN-93 purified diets for laboratory rodents: final report of the American Institute of Nutrition ad hoc writing committee on the reformulation of the AIN-76A rodent diet. J Nutr. (1993) 123:1939–51. doi: 10.1093/jn/123.11.1939
56. Moreira Júnior, RE, de Carvalho, LM, dos Reis, DC, Cassali, GD, Faria, AMC, Maioli, TU, et al. Diet-induced obesity leads to alterations in behavior and gut microbiota composition in mice. J Nutr Biochem. (2021) 92:108622. doi: 10.1016/j.jnutbio.2021.108622
57. Joel, D. Current animal models of obsessive compulsive disorder: a critical review. Prog Neuro-Psychopharmacol Biol Psychiatry. (2006) 30:374–88. doi: 10.1016/j.pnpbp.2005.11.006
58. Dixit, PV, Sahu, R, and Mishra, DK. Marble-burying behavior test as a murine model of compulsive-like behavior. J Pharmacol Toxicol Methods. (2020) 102:106676. doi: 10.1016/j.vascn.2020.106676
59. Angoa-Pérez, M, Kane, MJ, Briggs, DI, Francescutti, DM, and Kuhn, DM. Marble burying and nestlet shredding as tests of repetitive, compulsive-like behaviors in mice. J Vis Exp. (2013) 82:50978. doi: 10.3791/50978-v
60. Deacon, RM. Digging and marble burying in mice: simple methods for in vivo identification of biological impacts. Nat Protoc. (2006) 1:122–4. doi: 10.1038/nprot.2006.20
61. de Almeida Magalhães, T, Correia, D, de Carvalho, LM, Damasceno, S, and Brunialti Godard, AL. Maternal separation affects expression of stress response genes and increases vulnerability to ethanol consumption. Brain Behav. (2018) 8:e00841. doi: 10.1002/brb3.841
62. Bourin, M, and Hascoët, M. The mouse light/dark box test. Eur J Pharmacol. (2003) 463:55–65. doi: 10.1016/S0014-2999(03)01274-3
63. Noldus, LP, Spink, AJ, and Tegelenbosch, RA. EthoVision: a versatile video tracking system for automation of behavioral experiments. Behav Res Methods Instrum Comput. (2001) 33:398–414. doi: 10.3758/BF03195394
64. Costall, B, Jones, BJ, Kelly, ME, Naylor, RJ, and Tomkins, DM. Exploration of mice in a black and white test box: validation as a model of anxiety. Pharmacol Biochem Behav. (1989) 32:777–85. doi: 10.1016/0091-3057(89)90033-6
65. de Oliveira, DM, de Oliveira, EML, Ferrari, MFR, Semedo, P, Hiyane, MI, Cenedeze, MA, et al. Simvastatin ameliorates experimental autoimmune encephalomyelitis by inhibiting Th1/Th17 response and cellular infiltration. Inflammopharmacology. (2015) 23:343–54. doi: 10.1007/s10787-015-0252-1
66. Cramer, A, de Lima Oliveira, BC, Leite, PG, Rodrigues, DH, Brant, F, Esper, L, et al. Role of SOCS2 in the regulation of immune response and development of the experimental autoimmune encephalomyelitis. Mediat Inflamm. (2019) 2019:1872593. doi: 10.1155/2019/1872593
67. Rao, SS, Hu, Y, Xie, PL, Cao, J, Wang, ZX, Liu, JH, et al. Omentin-1 prevents inflammation-induced osteoporosis by downregulating the pro-inflammatory cytokines. Bone Res. (2018) 6:9. doi: 10.1038/s41413-018-0012-0
68. Islam, T, Koboziev, I, Albracht-Schulte, K, Mistretta, B, Scoggin, S, Yosofvand, M, et al. Curcumin reduces adipose tissue inflammation and alters gut microbiota in diet-induced obese male mice. Mol Nutr Food Res. (2021) 65:e2100274. doi: 10.1002/mnfr.202100274
69. Wang, MY, Grayburn, P, Chen, S, Ravazzola, M, Orci, L, and Unger, RH. Adipogenic capacity and the susceptibility to type 2 diabetes and metabolic syndrome. Proc Natl Acad Sci U S A. (2008) 105:6139–44. doi: 10.1073/pnas.0801981105
70. Mao, Y, Wang, B, Xu, X, Du, W, Li, W, Wang, Y, et al. Glycyrrhizic acid promotes M1 macrophage polarization in murine bone marrow-derived macrophages associated with the activation of JNK and NF-κB. Mediat Inflamm. (2015) 2015:372931. doi: 10.1155/2015/372931
71. Bibancos, T, Jardim, DL, Aneas, I, and Chiavegatto, S. Social isolation and expression of serotonergic neurotransmission-related genes in several brain areas of male mice. Genes Brain Behav. (2007) 6:529–39. doi: 10.1111/j.1601-183X.2006.00280.x
72. Pfaffl, MW. A new mathematical model for relative quantification in real-time RT-PCR. Nucleic Acids Res. (2001) 29:e45. doi: 10.1093/nar/29.9.e45
73. Vandesompele, J, De Preter, K, Pattyn, F, Poppe, B, Van Roy, N, De Paepe, A, et al. Accurate normalization of real-time quantitative RT-PCR data by geometric averaging of multiple internal control genes. Genome Biol. (2002) 3:RESEARCH0034. doi: 10.1186/gb-2002-3-7-research0034
74. Thomas, A, Burant, A, Bui, N, Graham, D, Yuva-Paylor, LA, and Paylor, R. Marble burying reflects a repetitive and perseverative behavior more than novelty-induced anxiety. Psychopharmacology. (2009) 204:361–73. doi: 10.1007/s00213-009-1466-y
75. Taylor, GT, Lerch, S, and Chourbaji, S. Marble burying as compulsive behaviors in male and female mice. Acta Neurobiol Exp. (2017) 77:254–60. doi: 10.21307/ane-2017-059
76. Krishna, S, Keralapurath, MM, Lin, Z, Wagner, JJ, de la Serre, CB, Harn, DA, et al. Neurochemical and electrophysiological deficits in the ventral hippocampus and selective behavioral alterations caused by high-fat diet in female C57BL/6 mice. Neuroscience. (2015) 297:170–81. doi: 10.1016/j.neuroscience.2015.03.068
77. White, KA, Hutton, SR, Weimer, JM, and Sheridan, PA. Diet-induced obesity prolongs neuroinflammation and recruits CCR2(+) monocytes to the brain following herpes simplex virus (HSV)-1 latency in mice. Brain Behav Immun. (2016) 57:68–78. doi: 10.1016/j.bbi.2016.06.007
78. Gregorio, VD, Lucchese, R, Vera, I, Silva, GC, Silva, A, and Moraes, RCC. The alcohol consumption is amended after bariatric surgery? An integrative review. Arq Bras Cir Dig. (2018) 31:e1378. doi: 10.1590/0102-672020180001e1378
79. Saules, KK, Wiedemann, A, Ivezaj, V, Hopper, JA, Foster-Hartsfield, J, and Schwarz, D. Bariatric surgery history among substance abuse treatment patients: prevalence and associated features. Surg Obes Relat Dis. (2010) 6:615–21. doi: 10.1016/j.soard.2009.12.008
80. Siikaluoma, L, Stenberg, E, and Raoof, M. Prevalence of and risk factors associated with alcohol overconsumption at 2 years after bariatric surgery. Obes Surg. (2022) 32:1–6. doi: 10.1007/s11695-022-06060-6
81. Östlund, MP, Backman, O, Marsk, R, Stockeld, D, Lagergren, J, Rasmussen, F, et al. Increased admission for alcohol dependence after gastric bypass surgery compared with restrictive bariatric surgery. JAMA Surg. (2013) 148:374–7. doi: 10.1001/jamasurg.2013.700
82. Murray, SM, Tweardy, S, Geliebter, A, and Avena, NM. A longitudinal preliminary study of addiction-like responses to food and alcohol consumption among individuals undergoing weight loss surgery. Obes Surg. (2019) 29:2700–3. doi: 10.1007/s11695-019-03915-3
83. Kerver, GA, Engel, SG, Gunstad, J, Crosby, RD, and Steffen, KJ. Deficits in cognitive control during alcohol consumption after bariatric surgery. Surg Obes Relat Dis. (2022) 22:S1550–7289. doi: 10.1016/j.soard.2022.10.014
84. Kliethermes, CL. Anxiety-like behaviors following chronic ethanol exposure. Neurosci Biobehav Rev. (2005) 28:837–50. doi: 10.1016/j.neubiorev.2004.11.001
85. Gilpin, NW, Karanikas, CA, and Richardson, HN. Adolescent binge drinking leads to changes in alcohol drinking, anxiety, and amygdalar corticotropin releasing factor cells in adulthood in male rats. PLoS One. (2012) 7:e31466. doi: 10.1371/journal.pone.0031466
86. Bendre, M, Comasco, E, Nylander, I, and Nilsson, KW. Effect of voluntary alcohol consumption on Maoa expression in the mesocorticolimbic brain of adult male rats previously exposed to prolonged maternal separation. Transl Psychiatry. (2015) 5:e690. doi: 10.1038/tp.2015.186
87. Van Meer, P, and Raber, J. Mouse behavioural analysis in systems biology. Biochem J. (2005) 389:593–610. doi: 10.1042/BJ20042023
88. Gimeno, C, Dorado, ML, Roncero, C, Szerman, N, Vega, P, Balanzá-Martínez, V, et al. Treatment of comorbid alcohol dependence and anxiety disorder: review of the scientific evidence and recommendations for treatment. Front Psychol. (2017) 8:173. doi: 10.3389/fpsyt.2017.00173
89. Anker, JJ, Kushner, MG, Thuras, P, Menk, J, and Unruh, AS. Drinking to cope with negative emotions moderates alcohol use disorder treatment response in patients with co-occurring anxiety disorder. Drug Alcohol Depend. (2016) 159:93–100. doi: 10.1016/j.drugalcdep.2015.11.031
90. Correa, M, Manrique, HM, Font, L, Escrig, MA, and Aragon, CMG. Reduction in the anxiolytic effects of ethanol by centrally formed acetaldehyde: the role of catalase inhibitors and acetaldehyde-sequestering agents. Psychopharmacology. (2008) 200:455–64. doi: 10.1007/s00213-008-1219-3
91. Jones, KA, and Thomsen, C. The role of the innate immune system in psychiatric disorders. Mol Cell Neurosci. (2013) 53:52–62. doi: 10.1016/j.mcn.2012.10.002
92. Bennett, FC, and Molofsky, AV. The immune system and psychiatric disease: a basic science perspective. Clin Exp Immunol. (2019) 197:294–307. doi: 10.1111/cei.13334
93. Erickson, EK, Grantham, EK, Warden, AS, and Harris, RA. Neuroimmune signaling in alcohol use disorder. Pharmacol Biochem Behav. (2019) 177:34–60. doi: 10.1016/j.pbb.2018.12.007
94. Asatryan, L, Khoja, S, Rodgers, KE, Alkana, RL, Tsukamoto, H, and Davies, DL. Chronic ethanol exposure combined with high fat diet up-regulates P2X7 receptors that parallels neuroinflammation and neuronal loss in C57BL/6J mice. J Neuroimmunol. (2015) 285:169–79. doi: 10.1016/j.jneuroim.2015.06.007
95. Collins, MA, and Neafsey, EJ. Ethanol and adult CNS neurodamage: oxidative stress, but possibly not excitotoxicity. Front Biosci. (2012) 4:1358–67. doi: 10.2741/e465
96. Canesso, MCC, Lacerda, NL, Ferreira, CM, Gonçalves, JL, Almeida, D, Gamba, C, et al. Comparing the effects of acute alcohol consumption in germ-free and conventional mice: the role of the gut microbiota. BMC Microbiol. (2014) 14:240. doi: 10.1186/s12866-014-0240-4
97. Guerri, C, and Pascual, M. Impact of neuroimmune activation induced by alcohol or drug abuse on adolescent brain development. Int J Dev Neurosci. (2019) 77:89–98. doi: 10.1016/j.ijdevneu.2018.11.006
98. Greter, M, Lelios, I, and Croxford, AL. Microglia versus myeloid cell nomenclature during brain inflammation. Front Immunol. (2015) 6:249. doi: 10.3389/fimmu.2015.00249
99. Culmsee, C, Michels, S, Scheu, S, Arolt, V, Dannlowski, U, and Alferink, J. Mitochondria, microglia, and the immune system-how are they linked in affective disorders? Front Psychol. (2018) 9:739. doi: 10.3389/fpsyt.2018.00739
100. Stirling, DP, and Yong, VW. Dynamics of the inflammatory response after murine spinal cord injury revealed by flow cytometry. J Neurosci Res. (2008) 86:1944–58. doi: 10.1002/jnr.21659
101. Khan, SQ, Khan, I, and Gupta, V. CD11b activity modulates pathogenesis of lupus nephritis. Front Med. (2018) 5:52. doi: 10.3389/fmed.2018.00052
102. Xu, X, Yu, Z, Qian, J, Shi, X, and Chen, S. Expression of leukocyte adhesion molecules CD11b, L-selectin and CD45 during hemodialysis. Chin Med J. (1999) 112:1073–6.
103. Bronte, V, and Pittet, MJ. The spleen in local and systemic regulation of immunity. Immunity. (2013) 39:806–18. doi: 10.1016/j.immuni.2013.10.010
104. Barrea, L, di Somma, C, Muscogiuri, G, Tarantino, G, Tenore, GC, Orio, F, et al. Nutrition, inflammation and liver-spleen axis. Crit Rev Food Sci Nutr. (2018) 58:3141–58. doi: 10.1080/10408398.2017.1353479
105. Huang, CJ, Stevens, BR, Nielsen, RB, Slovin, PN, Fang, X, Nelson, DR, et al. Interleukin-10 inhibition of nitric oxide biosynthesis involves suppression of CAT-2 transcription. Nitric Oxide. (2002) 6:79–84. doi: 10.1006/niox.2001.0402
106. Speyer, CL, Neff, TA, Warner, RL, Guo, RF, Sarma, JV, Riedemann, NC, et al. Regulatory effects of iNOS on acute lung inflammatory responses in mice. Am J Pathol. (2003) 163:2319–28. doi: 10.1016/S0002-9440(10)63588-2
107. Günther, M, al Nimer, F, Gahm, C, Piehl, F, and Mathiesen, T. iNOS-mediated secondary inflammatory response differs between rat strains following experimental brain contusion. Acta Neurochir. (2012) 154:689–97. doi: 10.1007/s00701-012-1297-1
108. Oliveira, PRS, de Matos, LO, Araujo, NM, Sant Anna, HP, da Silva e Silva, DA, Damasceno, AKA, et al. Gene variants associated with a higher risk for alcohol dependence in multiethnic populations. Front Psychol. (2021) 12:665257. doi: 10.3389/fpsyt.2021.665257
109. Paiva, IM, de Carvalho, LM, di Chiaccio, IM, Lima Assis, I, Naranjo, ES, Bernabé, MG, et al. Inhibition of Lrrk2 reduces ethanol preference in a model of acute exposure in zebrafish. Prog Neuro-Psychopharmacol Biol Psychiatry. (2020) 100:109885. doi: 10.1016/j.pnpbp.2020.109885
110. Bae, JR, and Lee, BD. Function and dysfunction of leucine-rich repeat kinase 2 (LRRK2): Parkinson's disease and beyond. BMB Rep. (2015) 48:243–8. doi: 10.5483/BMBRep.2015.48.5.032
111. Shin, N, Jeong, H, Kwon, J, Heo, HY, Kwon, JJ, Yun, HJ, et al. LRRK2 regulates synaptic vesicle endocytosis. Exp Cell Res. (2008) 314:2055–65. doi: 10.1016/j.yexcr.2008.02.015
112. Milosevic, I, Giovedi, S, Lou, X, Raimondi, A, Collesi, C, Shen, H, et al. Recruitment of endophilin to clathrin-coated pit necks is required for efficient vesicle uncoating after fission. Neuron. (2011) 72:587–601. doi: 10.1016/j.neuron.2011.08.029
113. Cirnaru, MD, Marte, A, Belluzzi, E, Russo, I, Gabrielli, M, Longo, F, et al. LRRK2 kinase activity regulates synaptic vesicle trafficking and neurotransmitter release through modulation of LRRK2 macro-molecular complex. Front Mol Neurosci. (2014) 7:49. doi: 10.3389/fnmol.2014.00049
114. Schapansky, J, Nardozzi, JD, Felizia, F, and LaVoie, MJ. Membrane recruitment of endogenous LRRK2 precedes its potent regulation of autophagy. Hum Mol Genet. (2014) 23:4201–14. doi: 10.1093/hmg/ddu138
115. Bonet-Ponce, L, and Cookson, MR. LRRK2 recruitment, activity, and function in organelles. FEBS J. (2022) 289:6871–90. doi: 10.1111/febs.16099
Keywords: alcohol preference, reward system genes, neuroinflammation, behavior, high sugar and butter diet
Citation: Moreira-Júnior RE, Guimarães MAF, Etcheverria da Silva M, Maioli TU, Faria AMC and Brunialti-Godard AL (2023) Animal model for high consumption and preference of ethanol and its interplay with high sugar and butter diet, behavior, and neuroimmune system. Front. Nutr. 10:1141655. doi: 10.3389/fnut.2023.1141655
Edited by:
Julio Villena, CONICET Centro de Referencia para Lactobacilos (CERELA), ArgentinaReviewed by:
Mariano Elean, CONICET Centro de Referencia para Lactobacilos (CERELA), ArgentinaCopyright © 2023 Moreira-Júnior, Guimarães, Etcheverria, da Silva, Maioli, Faria and Brunialti-Godard. This is an open-access article distributed under the terms of the Creative Commons Attribution License (CC BY). The use, distribution or reproduction in other forums is permitted, provided the original author(s) and the copyright owner(s) are credited and that the original publication in this journal is cited, in accordance with accepted academic practice. No use, distribution or reproduction is permitted which does not comply with these terms.
*Correspondence: Ana Lúcia Brunialti Godard, YnJ1bmlhbHRAdWZtZy5icg==
Disclaimer: All claims expressed in this article are solely those of the authors and do not necessarily represent those of their affiliated organizations, or those of the publisher, the editors and the reviewers. Any product that may be evaluated in this article or claim that may be made by its manufacturer is not guaranteed or endorsed by the publisher.
Research integrity at Frontiers
Learn more about the work of our research integrity team to safeguard the quality of each article we publish.