 Dong-Bao Hu
 Sheng-Li Shi
94% of researchers rate our articles as excellent or good
Learn more about the work of our research integrity team to safeguard the quality of each article we publish.
Find out more
ORIGINAL RESEARCH article
Front. Nutr. , 29 March 2023
Sec. Food Chemistry
Volume 10 - 2023 | https://doi.org/10.3389/fnut.2023.1135712
This article is part of the Research Topic Edible Fungi: Nutritional and Biological Functionality View all 9 articles
Introduction: Boletus bicolor (B. bicolor) mushrooms are widely consumed as a valuable medicinal and dietary ingredient in China, but the active ingredients of this mushroom and their extraction methods were not extensively studied.
Methods: In this paper, we propose an optimized ultrasound-assisted extraction (UAE) method to detect natural antioxidant substances in B. bicolor. The antioxidants were quantitatively and quantitatively determined using UPLC-MS, the polyphenols were evaluated based on response surface methodology (RSM), and density functional theory (DFT) calculations were performed.
Results: The results showed that the optimal extraction was obtained under the following conditions: ethanol concentration 42%; solvent to solid ratio 34:1 mL/g; ultrasonic time 41 min; and temperature 40°C. The optimized experimental polyphenol value obtained under these conditions was (13.69 ± 0.13) mg/g, consistent with the predicted value of 13.72 mg/g. Eight phenolic compounds in the extract were identiffed by UPLC-MS: syringic acid, chlorogenic acid, gallic acid, rosmarinic acid, protocatechuic acid, catechin, caffeic acid, and quercetin. Chlorogenic acid exhibits the highest HOMO energy (−0.02744 eV) and the lowest energy difference (−0.23450 eV) among the studied compounds, suggesting that the compound might be the strongest antioxidant molecule. Eight phenolic compounds from the B. bicolor signiffcantly inhibited intracellular reactive oxygen species (ROS) generation, reduced oxidative stress damage in H2O2-induced HepG-2 cells.
Discussion: Therefore, it was confirmed that the UAE technique is an efficient, rapid, and simple approach for extracting polyphenols with antioxidant activity from B. bicolor.
The human organism produces many kinds of free radicals during life, and they have strong oxidative capacity. If these active free radicals are not removed in time, various enzymes in the body may be impaired, causing metabolic disorders and leading to diseases (1–3). Reactive oxygen species (ROS) are among the most vital endogenous free radicals, produced by oxidative respiration in the normal cellular metabolism (4). If ROS levels exceed the body’s internal antioxidant threshold and are not cleared quickly, and they attack body tissues, organs and cells, causing chronic diseases such as in inflammation, aging, and cancer (5). The phenolic compounds are an important group of secondary plant metabolites which can scavenge free radicals in the body, including phenolic acids, flavonoids, distyrenes, and lignans. They are recognized as natural antioxidants for preventing various diseases, such as cardiovascular, anti-inflammatory (6). Phenolic compounds recognized as natural antioxidants in mushrooms can maintain normal metabolic activities by regulating the level of free radicals and reducing the damage in the organism occurring at molecular and cellular levels (6–8). These compounds are mainly attributed to phenolic acids, lignans, stilbenes, and oxidized polyphenols (9). As a good source of polyphenols, mushroom extracts have been found to complement industrialized products to replace synthetic antioxidants (10). For centuries, they were consumed for food or medicine as part of the human diet (11–13). Over the past 2 decades, the health-promoting effect of mushrooms has attracted increasing attention due to the wide range of secondary metabolites in fruiting bodies.
Boletus bicolor is a basidiomycete mushroom species widely used as delicacy food, and its extract is traditionally used to treat several human ailments (14, 15). As a kind of delicious wild mushroom, B. bicolor contains various beneficial components, including steroids, terpenoids, alkaloids, phenols, and proteins, and has many beneficial properties, such as enhancing human immunity, anti-tumor, antioxidant, and antibacterial (16, 17). To the best of our knowledge, the antioxidant activities obtained from wild edible fungal B. bicolor extracts were rarely explored, so effective extraction of polyphenols from B. bicolor should be helpful for its utilization. Common polyphenol extraction methods include soxhlet extraction, room temperature extraction, ultrasound-assisted extraction, microwave-assisted extraction, and enzymatic-assisted extraction (17). Conventional extraction procedures, such as percolation, maceration, and reflux, often utilize organic solvents and need a significant volume and a long extraction period. Previous studies demonstrated that conventional methods for extracting bioactive compounds are time-consuming, resulting in low yields with low amounts of bioactive compounds. Novel and environmentally friendly extraction technologies have been suggested to overcome these problems. Ultrasound-assisted extraction (UAE) is appropriate for the extraction of thermolabile and unstable compounds and for the extraction of various natural plant metabolites. The UAE has attracted significant research interest due to many advantages over conventional methods, including shorter extraction time, lower volume of organic solvents, and higher extraction yields of target components (18, 19).
The present study aims to shed more light on the UAE extraction of poorly understood B. bicolor mushrooms using response surface methodology (RSM). The main phenolic compounds in the mushroom were identified by UPLC-MS. Then, the mechanism of antioxidant activities was explained based on the results of the DFT computational method, cytoprotective activities assay of eight main phenolic compounds extracted from B. bicolor were used for validation of DFT calculations. Next, the antioxidant activities were evaluated by five methods, including DPPH scavenging activity, ABTS scavenging activity, OH scavenging activity, NO2− scavenging activity, and ferric-reducing antioxidant power.
Boletus bicolor was collected from Yuxi City, Yunnan Province, China. The mushroom material was dried under ventilation until reaching a constant weight. The sample was powdered and stored in an air-tight container for further use.
2, 2-diphenyl-1-picrylhydrazyl (DPPH), ABTS [2, 2′–azinobis (3-ethylbenothiazoline-6-sulphonic acid)], and polyphenolic standards (protocatechuic acid; catechin; syringic acid; rosmarinic acid; gallic acid; chlorogenic acid; caffeic acid; and quercetin) were purchased from Sigma–Aldrich. Analytical grade ethanol, Folin–Ciocalteu reagent, and methanol were purchased from J. T. Baker (Phillipsburg, United States). Other analytical grade chemicals were supplied from Xilong Chemical Factory (Sichuan, China).
To evaluate the effect of each factor on the antioxidant activity of the extract of B. bicolor, we investigated different ethanol amounts (10, 20, 30, 40, 50, 60, 70, and 80%), liquid-to-solid ratios (10,1, 15:1, 20:1, 25:1, 30:1, 35:1, 40:1, and 45:1), ultrasonic times (20, 25, 30, 35, 40, and 45 min), and ultrasonic temperatures (30, 35, 40, 45, 50, and 55°C) as single-factor variables in the experimental design (20).
Based on single-factor experiments, a four factor-three-level response surface analysis method was used to optimize the extraction process of polyphenols from B. bicolor. The RSM was applied with a Box–Behnken Design (BBD), and the optimized conditions are shown in Table 1.

Table 1. Factors and levels of response surface analysis.
3.0000 g of B. bicolor powder sample was weighed accurately and put into a sorption extractor wrapped with qualitative filter paper. The extraction was carried out with 120 mL of 40% ethanol at 95°C for 4 h to obtain polyphenols.
3.0000 g of B. bicolor powder sample was mixed with a 40% ethanol solution (200 mL). The extraction was conducted in a dark place, sealed with plastic wrap, and reacted for 24 h. The mixture was centrifuged for 20 min to obtain polyphenols.
Phenolic compounds in the extract were characterized by UPLC-MS analysis. Syringic acid, chlorogenic acid, gallic acid, rosmarinic acid, protocatechuic acid, catechin, caffeic acid, and quercetin were used as standards. The standard solutions of the phenolic compounds were prepared by dissolving them in methanol at concentrations of 0.505, 0.510, 0.515, 0.520, 0.515, 0.520, 0.525, and 0.530 mg/mL, respectively. The standard curves were plotted with the concentration as the horizontal coordinate and the peak area as the vertical coordinate, showing good linearity for all eight phenolic compounds (r > 0.99) (21). The polyphenolic extracts were analyzed and determined using a 4500 QTRAP triple quadrupole liquid chromatograph (AB SCIEX).
Gaussian 09 software was used to calculate the energies of HOMO and LUMO orbitals for the eight phenolic compounds of the B. bicolor mushroom. The eight phenolic compounds were calculated by the DFT at the M062X/6–311++G** level. Firstly, optimization was carried out; then, the frequencies were also implemented at the same level, which has no imaginary frequencies. Finally, the HOMO and LUMO orbitals were depicted, and the orbital energies were calculated.
Human hepatocellular carcinoma (HepG2) cells were obtained from Kunming Cell Bank and cultured in DMEM complete culture medium (supplemented with 10% FBS and 1% penicillin/streptomycin) at 37°C in 5% CO2. Further assays were processed once the cells reached 80–90% confluence. The cytotoxicity of eight polyphenolic compounds (1.88, 3.75, 7.5, 15, and 30 μM) was assessed (22). First, HepG2 cells were inoculated into 96-well culture plates at 5 × 10³ cells/well and cultured for 24 h. Second, the cell medium was changed with eight polyphenolic compounds (0, 1.88, 3.75, 7.5, 15, and 30 μM) and cultivated for 20 h. Next, remove the cell culture medium and add 200 μL of MTT solution (0.5 mg/mL, dissolved in PBS) and incubate for 4 h. Then, 150 μL of dimethyl sulfoxide (DMSO) was added and absorbance was measured at 490 nm using a micrometer plate reader. Cell viability results demonstrated that the eight polyphenolic compounds were not toxic to HepG2 cells at all tested concentrations of 1.88, 3.75, 7.5, 15, and 30 μM.
Reactive oxygen species (ROS) production in H2O2-induced HepG2 cells was assessed with reference to previous studies (23). First, cells (2.5 × 10⁵ cells/well) were placed in 2.0 ml of six-well plates for 24 h. Then, 2.0 mL of phenolic compounds (1–8, 0, and 30 μM) were replaced with cell culture medium and incubated once again for 24 h. After treating HepG2 cells with H2O2 (1.0 mM) for 8 h, the cell culture medium was removed and the cells were obtained. After that, cells were washed three times with chilled PBS and 1.0 mL DCFH-DA (10 μM, dissolved in pre-chilled PBS) was added and incubated for 20 min at 37°C in dark conditions. Upon incubation, cells were assessed by flow cytometry (Guava® easyCyte 6–2 L, Millipore, Billerica, United States).
The scavenging effect of the polyphenol extract was slightly modified according to the previously described procedure (24). The polyphenol extract was prepared at different mass concentrations. A 100 μmol/L DPPH working solution was obtained by accurately weighing 0.0050 g of DPPH with absolute ethanol. Then, 3 mL of the DPPH working solution and 1 mL of the sample extract at different concentrations were added to a 10 mL colorimetric tube and reacted in the dark for 30 min. The absorbance value, A0, was measured at a wavelength of 540 nm. The A1 absorbance value was measured by reacting with 3 mL of DPPH instead of the sample solvent. The scavenging capacity was compared with that of ascorbic acid. The DPPH radical scavenging activity was calculated according to the following formula:
Where A0 is the absorbance of the DPPH, and A1 is the absorbance of the sample and the positive control.
The ABTS radical scavenging capacity assay was performed using the previous method with slight modification (24). A 7 mmol/L ABTS solution and a 4.9 mmol/L potassium persulfate solution were prepared. Then, the two solutions were mixed and placed in the dark for the reaction for 14 h. The ABTS working solution was diluted at 734 nm. 3 mL of the ABTS working solution and 0.2 mL of the sample solution were added to a 10 mL colorimetric tube, and the absorbance A1 was measured at 734 nm after 6 min in the dark. Next, using the sample solvent instead of the sample and 3 mL of the ABTS working solution, the absorbance value A0 was determined. The ABTS radical scavenging activity was calculated according to the following formula:
Where A0 is the absorbance of ABTS, and A1 is the absorbance of the sample and the positive control.
According to the reported method (24), 1 mL of a sample solution at different concentrations, 1 mL of a 9 mmol/L ferrous sulfate solution, and 1 mL of a 9 mmol/L salicylic acid-ethanol solution were mixed. Next, 1 mL of an 8.8 mmol/L H2O2 solution was added, and the reaction was thoroughly mixed for 30 min. Then, the absorbance value (As) was measured at 510 nm. The absorbance A0 was measured with the sample solvent instead of the sample solution, the absorbance Ax was determined with the sample solvent instead of the H2O2 solution. The clearances were calculated according to the following equation.
According to the previous method (24), 2 mL of a 5 mg/L NaNO2 solution and 2 mL of sample solutions at different concentrations were added to a 25 mL colorimetric tube. Then, 1 mL of a 4 g/L p-aminobenesulfonic acid solution was added to a water bath at 25°C and kept for 30 min. After thoroughly mixing, the solution was placed in the water bath at 25°C for 5 min. Next, 1 mL of a 2 g/L naphthalene ethylenediamine hydrochloride solution was added, and the volume was fixed to the scale with distilled water. After fully shaking, the absorbance was measured after 15 min in the water bath at 25°C. The absorbance Aj was measured at a wavelength of 538 nm. A0 is the control absorbance and Ai is the sample absorbance. The clearance rate was calculated according to the following formula:
According to the previous method (25), 2 mL of the sample solution at different concentrations, 2 mL of a phosphate buffer solution (pH = 6.6), and 2 mL of a 1% potassium ferricyanide solution were mixed and reacted for 20 min. After cooling with flowing water, 2 mL of a 10% trichloroacetic acid solution was added. Then, 2 mL of the above solution was taken and reacted with 0.2 mL of a 0.1% ferric chloride solution in the dark for 10 min. Next, the absorbance of the mixture was measured at a wavelength of 700 nm in three parallel experiments.
All the experiments were performed in triplicate, and the results are shown as mean ± SD. The statistical analysis of the model was performed with SPSS 22.0 and plotted with Origin 2018 software. The response surface map was obtained using Design-Expert 11.1.1. In the antioxidant experiments, IC50 represents the sample concentration when the scavenging rate reaches 50%, and EC50 represents the sample concentration when the absorbance value is 0.5 in the relative reducing power.
As shown in Figure 1A, the effects of different ethanol concentrations (10, 20, 30, 40, 50, 60, 70, and 80%) on the extraction rate of polyphenols from B. bicolor were investigated at a fixed liquid-to-solid ratio of 35:1, an ultrasonic time of 40 min, and an ultrasonic temperature of 40°C. Figure 1A shows that the extraction rate of polyphenols first increases and then decreases with the ethanol concentration, reaching the maximum value at an ethanol concentration of 40%. It may be explained that the solubility of polyphenols is not high at lower ethanol concentrations; however, after the ethanol concentration increases to 40%, the dissolution ability of polyphenols may be hindered by certain competition effects, gradually reducing the solubility of polyphenols (21). Therefore, the optimal ethanol extraction concentration was determined to be 40%.
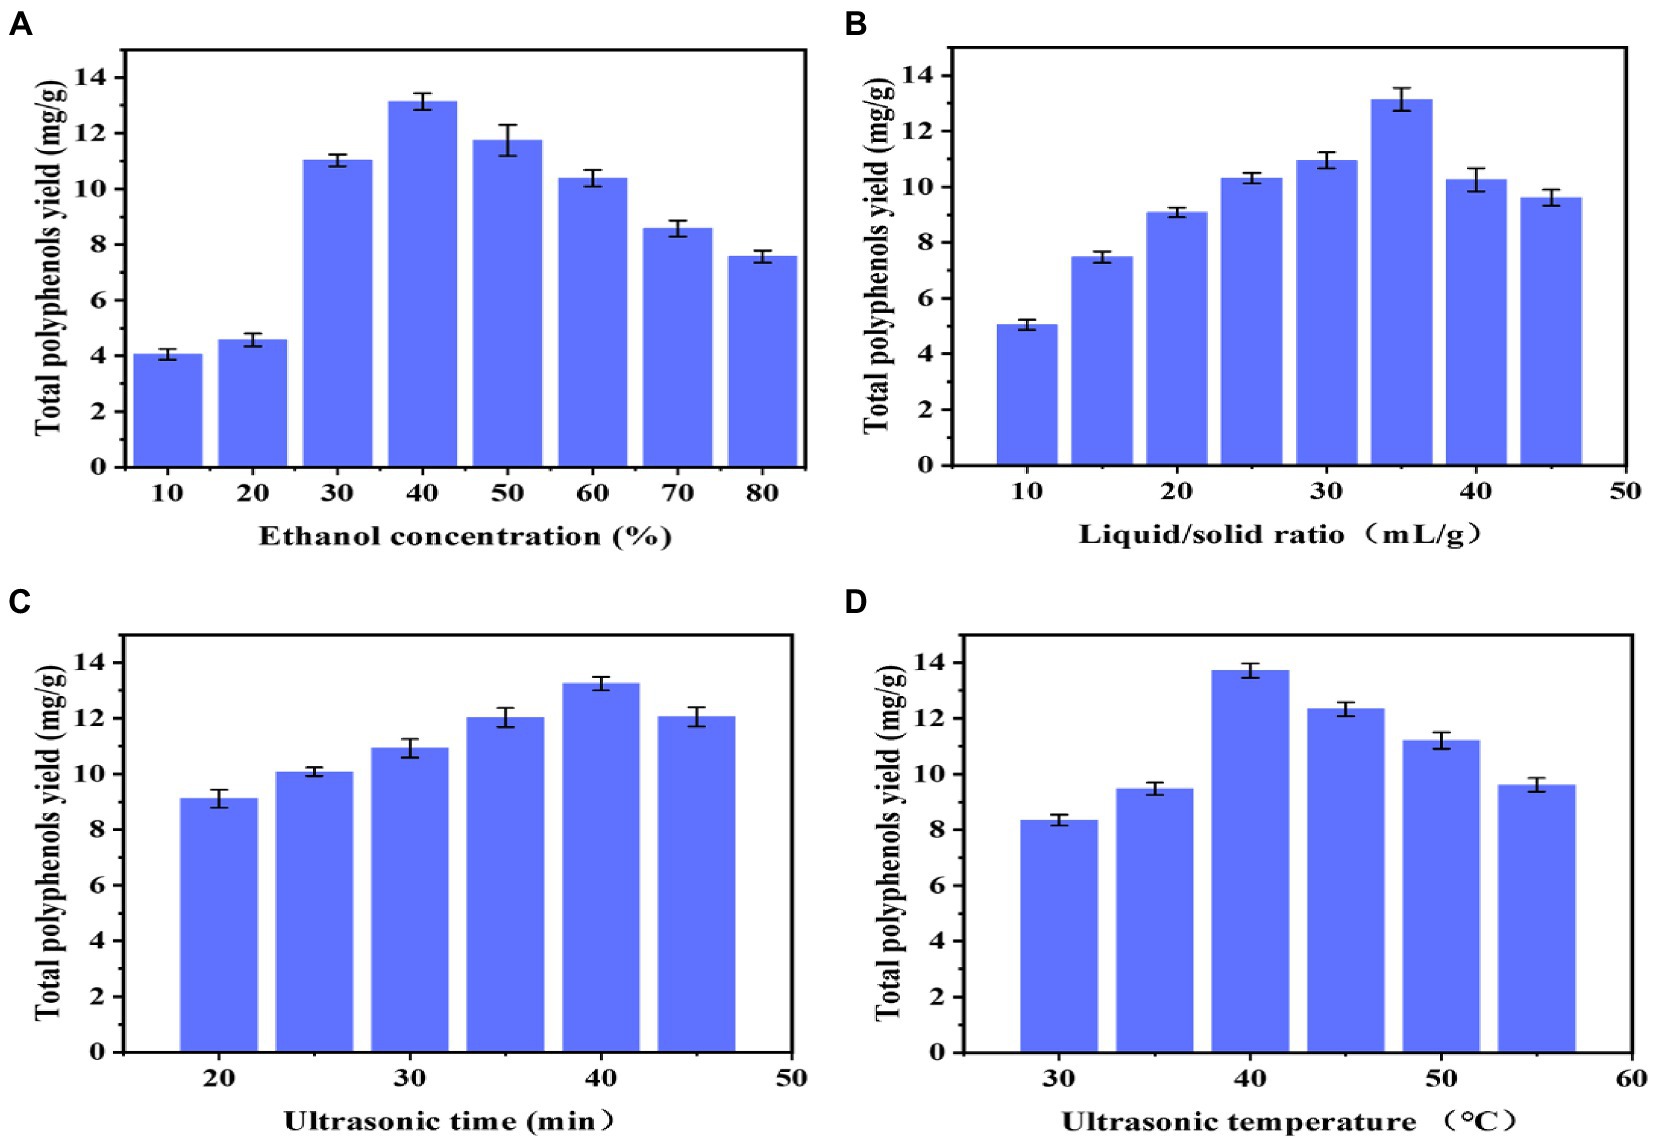
Figure 1. Single-factor experiments results: (A) Ethanol concentration; (B) Liquid/solid ratio; (C) Ultrasonication extraction time; and (D) Ultrasonication extraction temperature.
As shown in Figure 1B, the polyphenol extraction rate first increases and then decreases with the liquid-to-solid ratio, reaching the maximum value when the liquid-to-solid ratio is 35:1. The sample may not be completely immersed in the solution when the liquid-to-solid ratio is small. As the liquid-to-solid ratio increases, the contact area between the sample and the solution gradually rises until the sample is completely immersed, and the extraction rate of polyphenols dissolved in the solution gradually increases (26). After reaching a liquid-to-solid ratio of 35:1, the impurities dissolved in the solution gradually increase to inhibit the dissolution of polyphenols in the sample, so the extraction rate decreases (25). This indicates that when the solid-to-liquid ratio is too low, the excessive solvent absorbs more ultrasonic energy, reducing the energy absorbed by the mushroom material and, consequently, reducing the dissolution of the extract (27). Therefore, the optimal liquid–solid ratio was determined to be 35:1.
As shown in Figure 1C, when the ultrasonic time is 40 min, the polyphenol extraction rate reaches the maximum. It could be that the interaction of the sample and solution is insufficient at short ultrasonic times, so the extraction rate of polyphenols is not high; as the ultrasonic time increases, the extraction rate of polyphenols gradually increases. However, too long ultrasonication may damage the structure of polyphenols, reducing the extraction rate. Some polyphenols are sensitive to sonochemical reactions, such as oxidation, addition, degradation, and polymerization (27). Therefore, the optimal ultrasonic time is determined as 40 min.
The extraction yield of polyphenols exhibits a similar tendency to the ultrasonic temperature, Figure 1D. As the temperature increases above 40°C, the ethanol solvent evaporates, which may reduce the interaction between the sample and solution, suggesting that temperature is critical in the extraction rate of polyphenols (28). The temperature of the UAE process plays an important role in the extraction of bioactive compounds. These results might be related to the decrease in the surface tension and viscosity of the solvent, which induces an increase in vapor pressure. With the temperature increase, the sonochemical influence caused by the collapse of cavitation bubbles decreases, and polyphenols might degrade at higher temperatures. Therefore, keeping the temperature in an appropriate range is necessary during the extraction process of bioactive compounds. Therefore, the optimal ultrasonic temperature is determined to be 40°C.
A Box–Behnken experimental design was performed to determine the optimal extraction conditions using Design-Expert 11.1.1 software (29–32). The results are shown in Table 2. The quadratic regression model for the polyphenol extraction rate is obtained by fitting the regression to the data in Table 3 as follows:
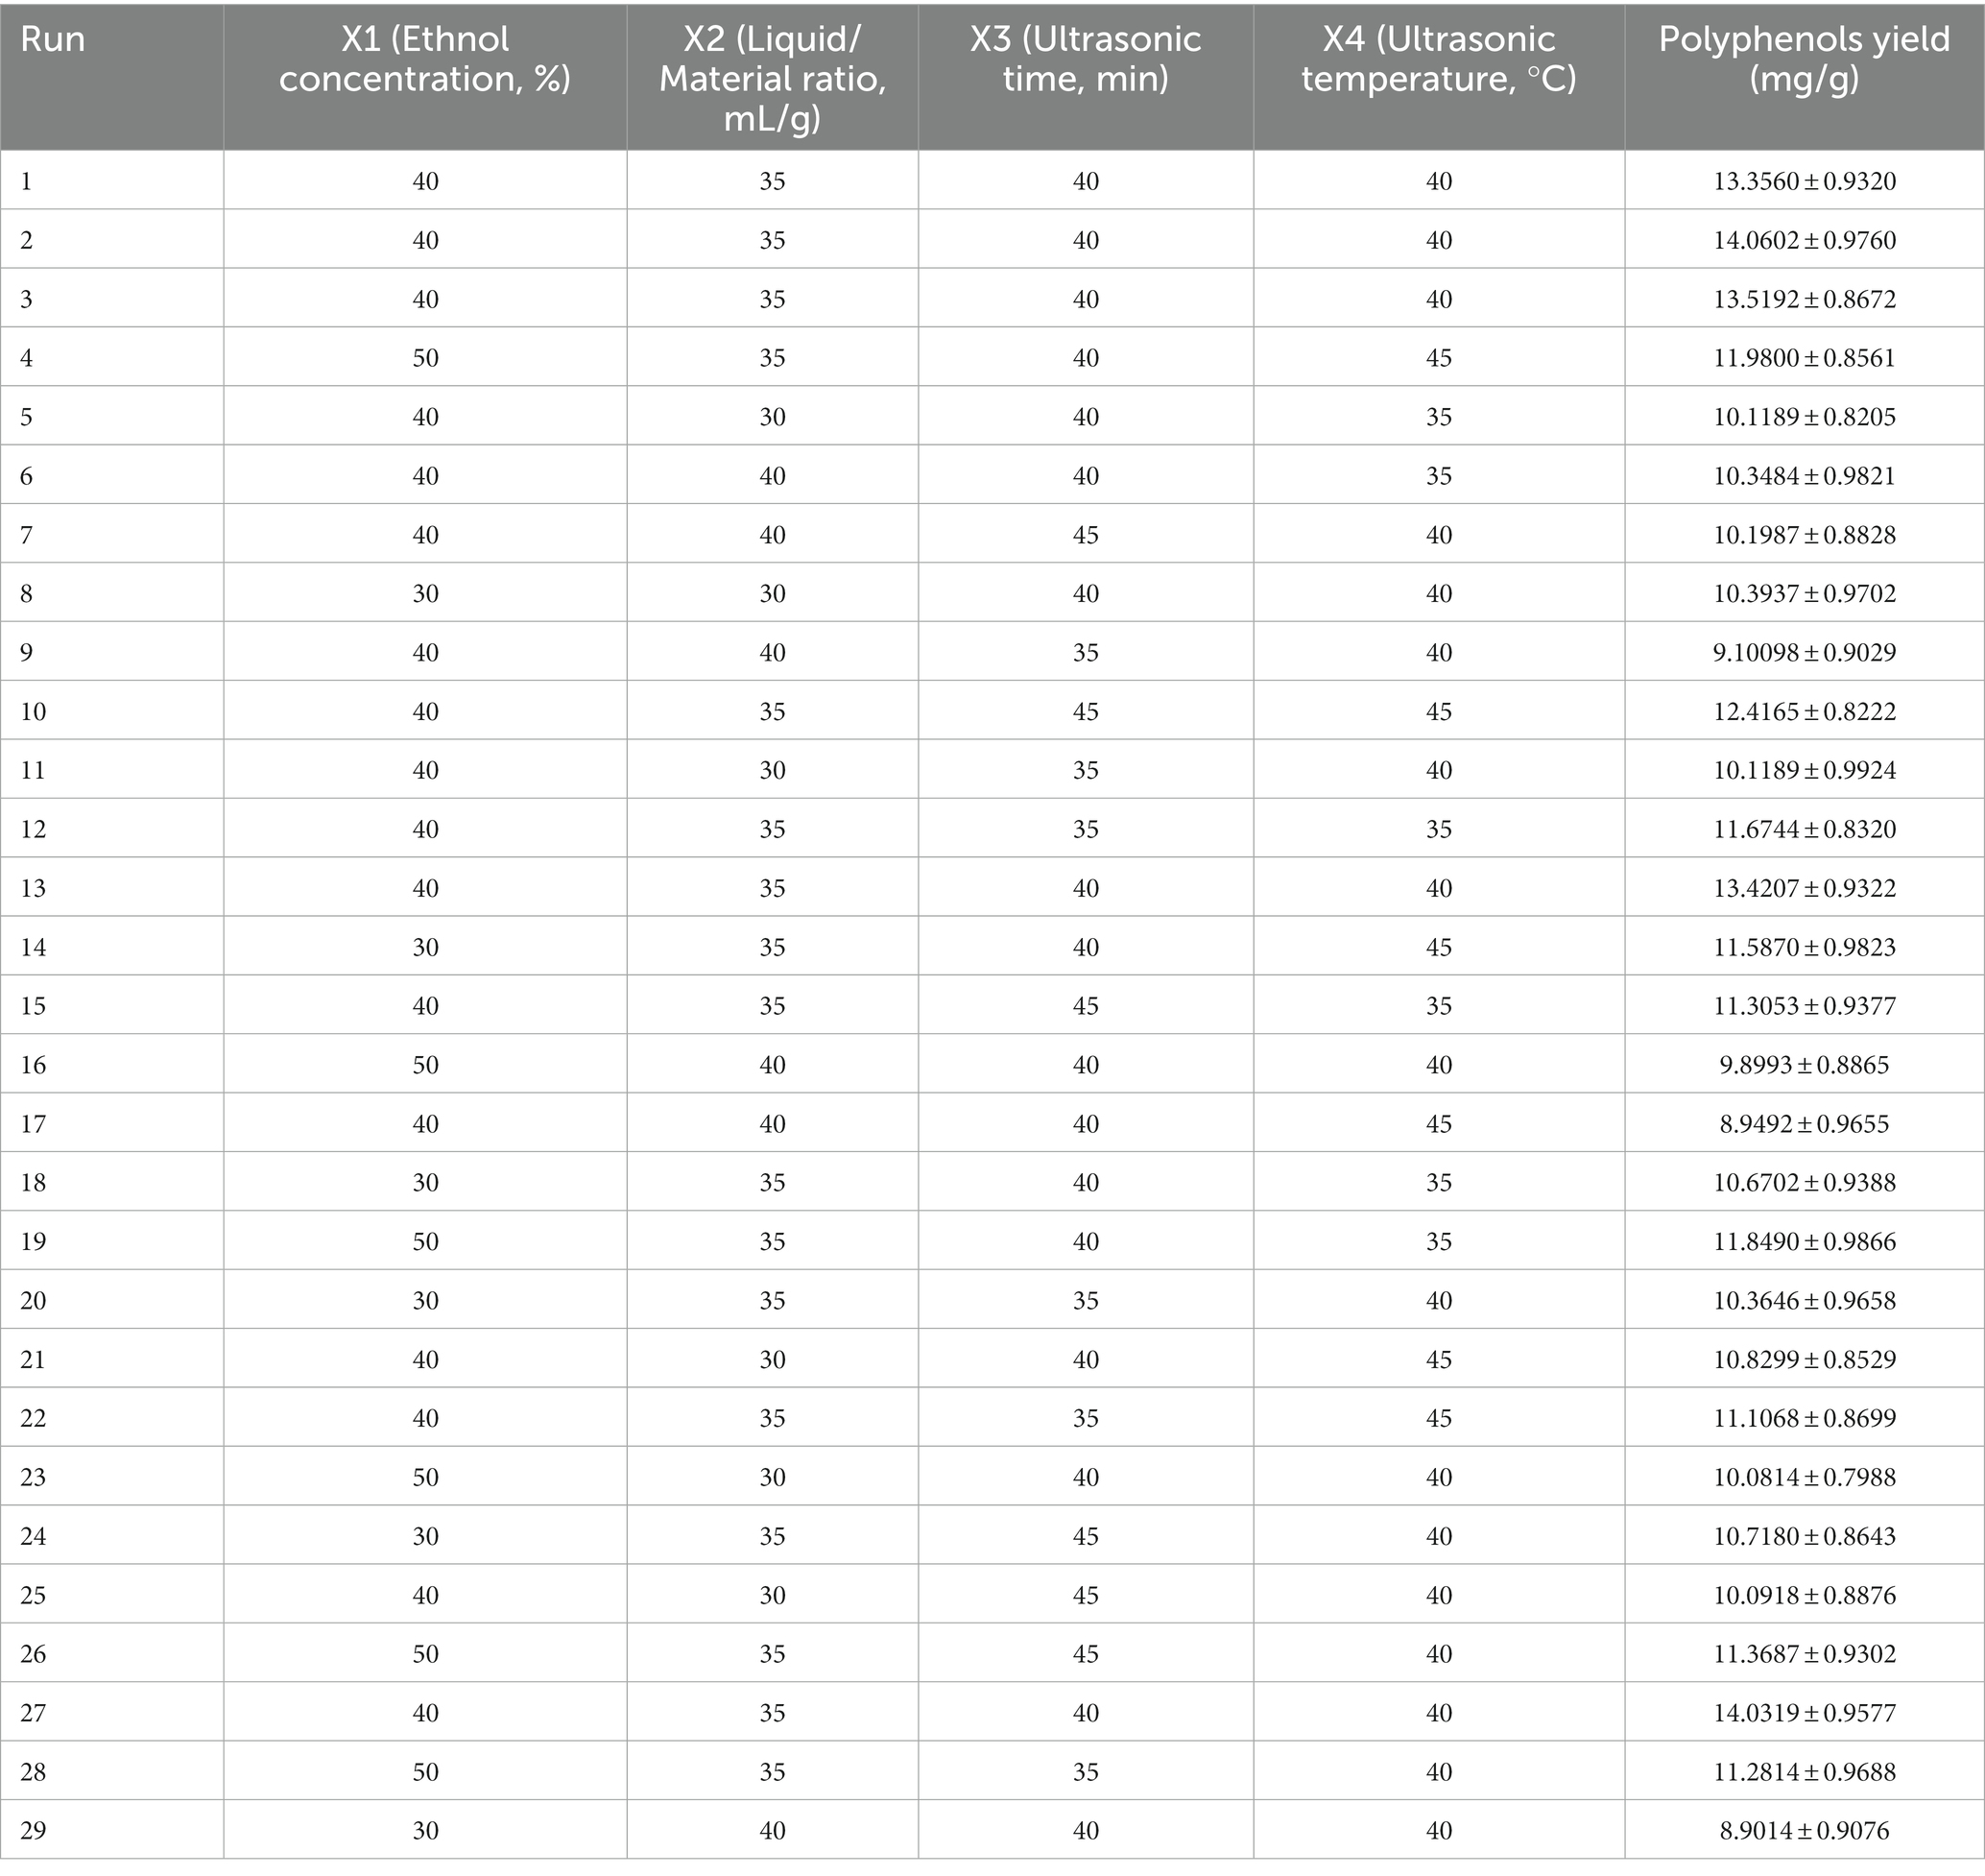
Table 2. The experimental parameters and results of response surface analysis for extraction of polyphenol from B. bicolor.
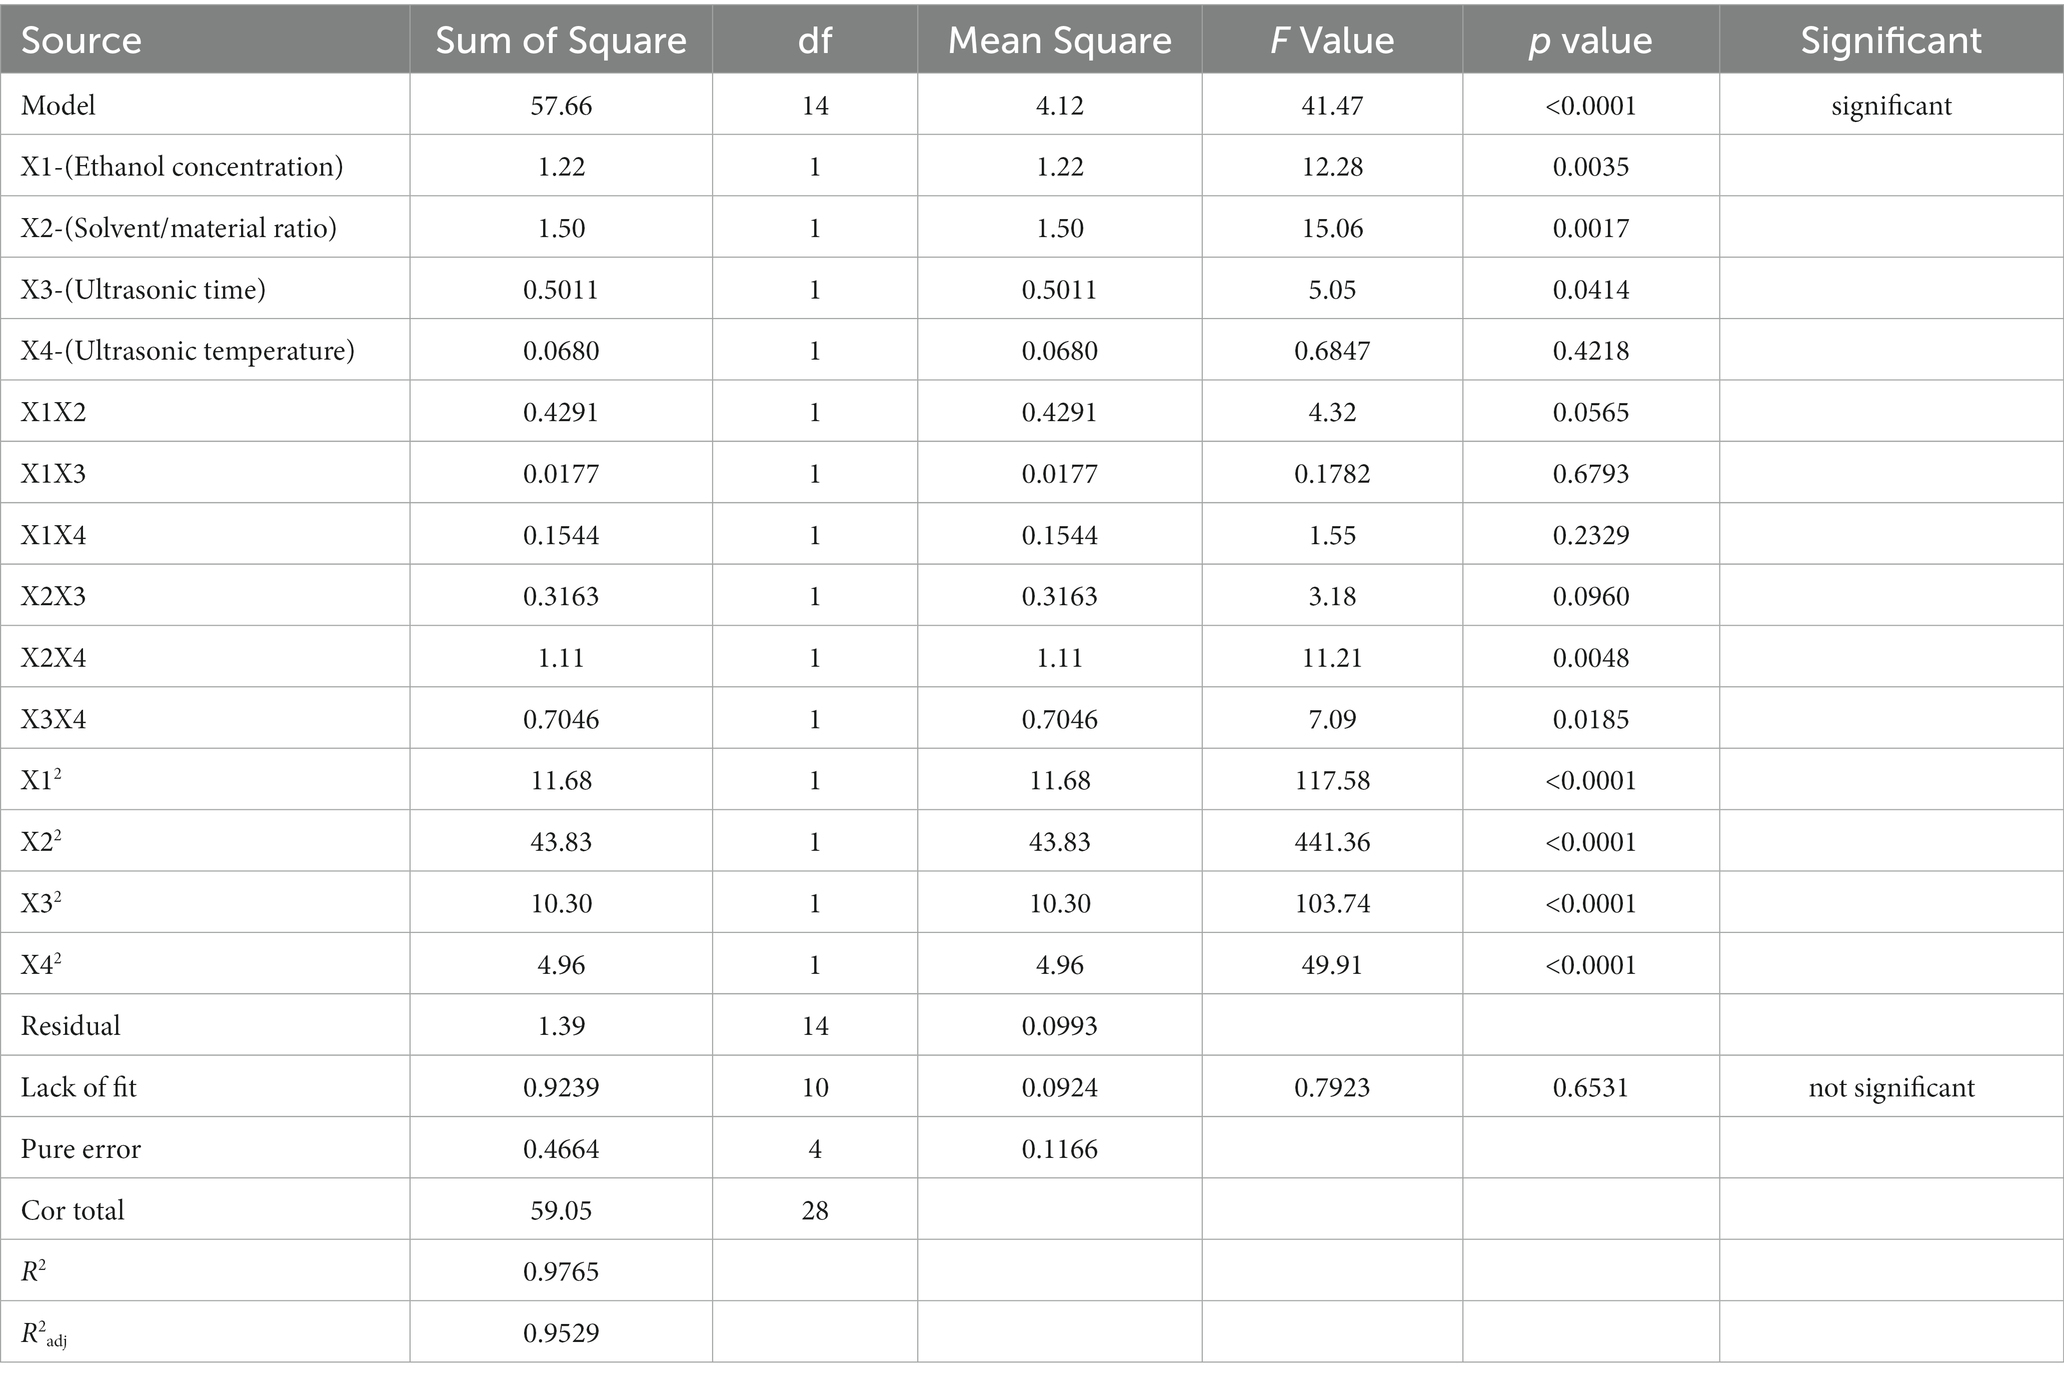
Table 3. ANOVA of the regression model.
Where Y denotes the corresponding value indicating the polyphenol extraction rate (mg/g). The model validity was confirmed using ANOVA and presented in Table 3. The F-value is 41.47 (p < 0.0001), indicating that the model is highly significant. The determination coefficient R2 is 0.9765, indicating a high correlation between the experimental and predicted values (33–37). The adjusted determination coefficient R2adj is 0.9529, implying that the model can explain 95.29% of the variation in response values. Therefore, the model can be used to predict and analyze the polyphenol extraction from B. bicolor. All correlation coefficients indicate that the responses are in very good agreement with the predicted extraction yields.
The three-dimensional response surfaces illustrate the relationship between independent and dependent variables. Figure 2 shows the graphs representing the effects of different ethanol concentrations, liquid-to-solid ratios, ultrasonic times, and ultrasonic temperatures. The value of p shows that the interaction is highly significant for X2X4 (liquid-to-solid ratio and ultrasonic temperature factors) and significant for X3X4 (ultrasonic time and ultrasonic temperature). In other words, there is a significant interaction between the liquid-to-solid ratio and ultrasonic temperature factors. The surface plot between ultrasonic time and ultrasonic temperature factors is also steep, indicating that the two variables exhibit significant interaction. Furthermore, the order of the interaction is X2X4 > X3X4 > X1X2 > X2X3 > X1X4 > X1X3.
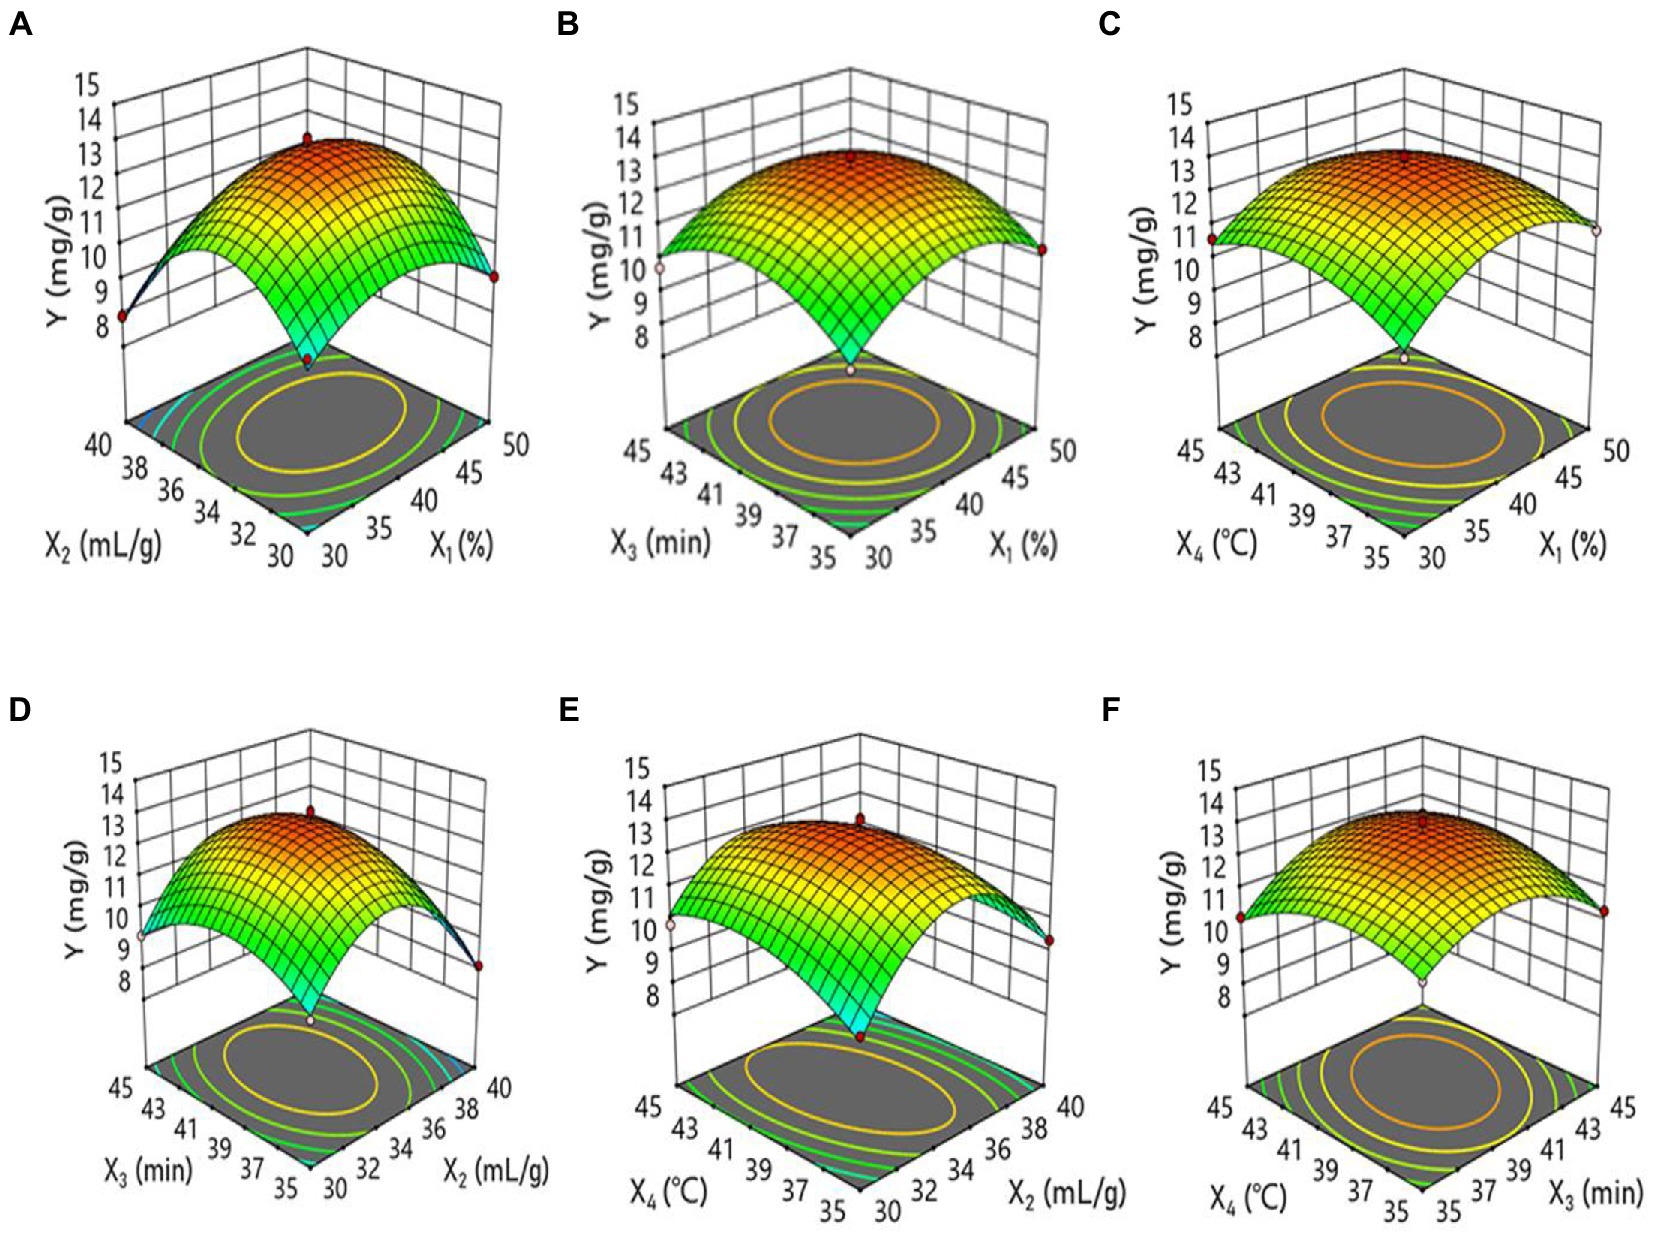
Figure 2. Response surface plots of the effects of (A); ethanol concentration and extraction time (min) (B); and solvent/material ratio and extraction time.
To estimate and validate the efficiency of ultrasound on polyphenol extraction from B. bicolor, we compared it with conventional extraction methods (soxhlet and maceration). As seen from Table 4, the extraction rate of polyphenols by the ultrasound-assisted method is significantly higher than for the other two traditional methods, i.e., the extraction rate is 1.7 times higher than that of soxhlet extraction and 2.1 times higher than that of maceration extraction. Thus, the UAE requires less time to achieve better efficiency. The UAE method can be a potential alternative to conventional extraction methods since it improves the yield and quality of the extract.
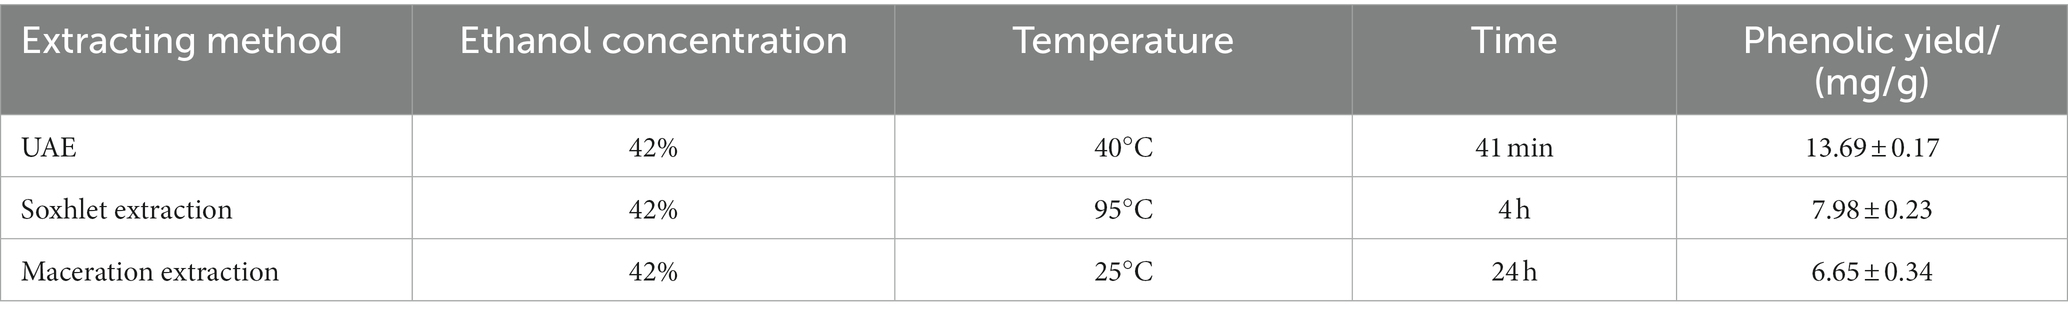
Table 4. The comparison of UAE with maceration and soxhlet extraction.
In this study, eight polyphenols were identified using UPLC-MS. As shown in Figures 3, 4 and Tables 5–7, the eight polyphenols identified are protocatechuic acid, catechin, syringic acid, rosmarinic acid, chlorogenic acid, gallic acid, caffeic acid, and quercetin. In Table 7, the content of syringic acid is the highest, followed by chlorogenic acid, caffeic acid, protocatechuic acid, gallic acid, rosmarinic acid, catechin, and quercetin in the polyphenolic extract of B. bicolor, which may be the main substances with antioxidant activity in the polyphenolic extract of this mushroom. In other words, the strong antioxidant activity of the extract may be related to these polyphenolic ingredients that act as free radical scavengers (Figure 5).
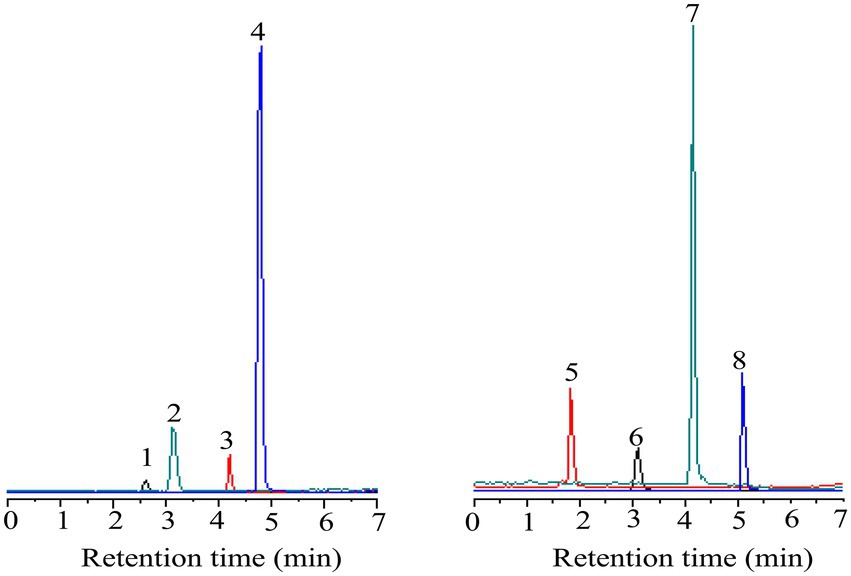
Figure 3. The diagram of eight standard phenolic compounds (1- protocatechuic acid; 2-Catechin 3-Syringic acid; 4-Rosmarinic acid; 5-Gallic acid; 6-Chlorogenic acid; 7-Caffeic acid; and 8-Quercetin).
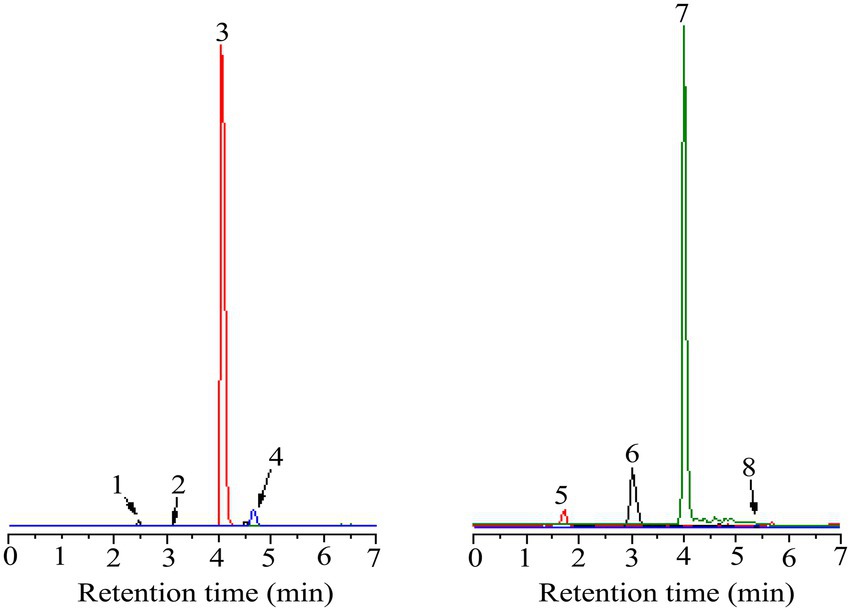
Figure 4. The diagram of eight kinds of phenolic compounds from Boletus bicolor.
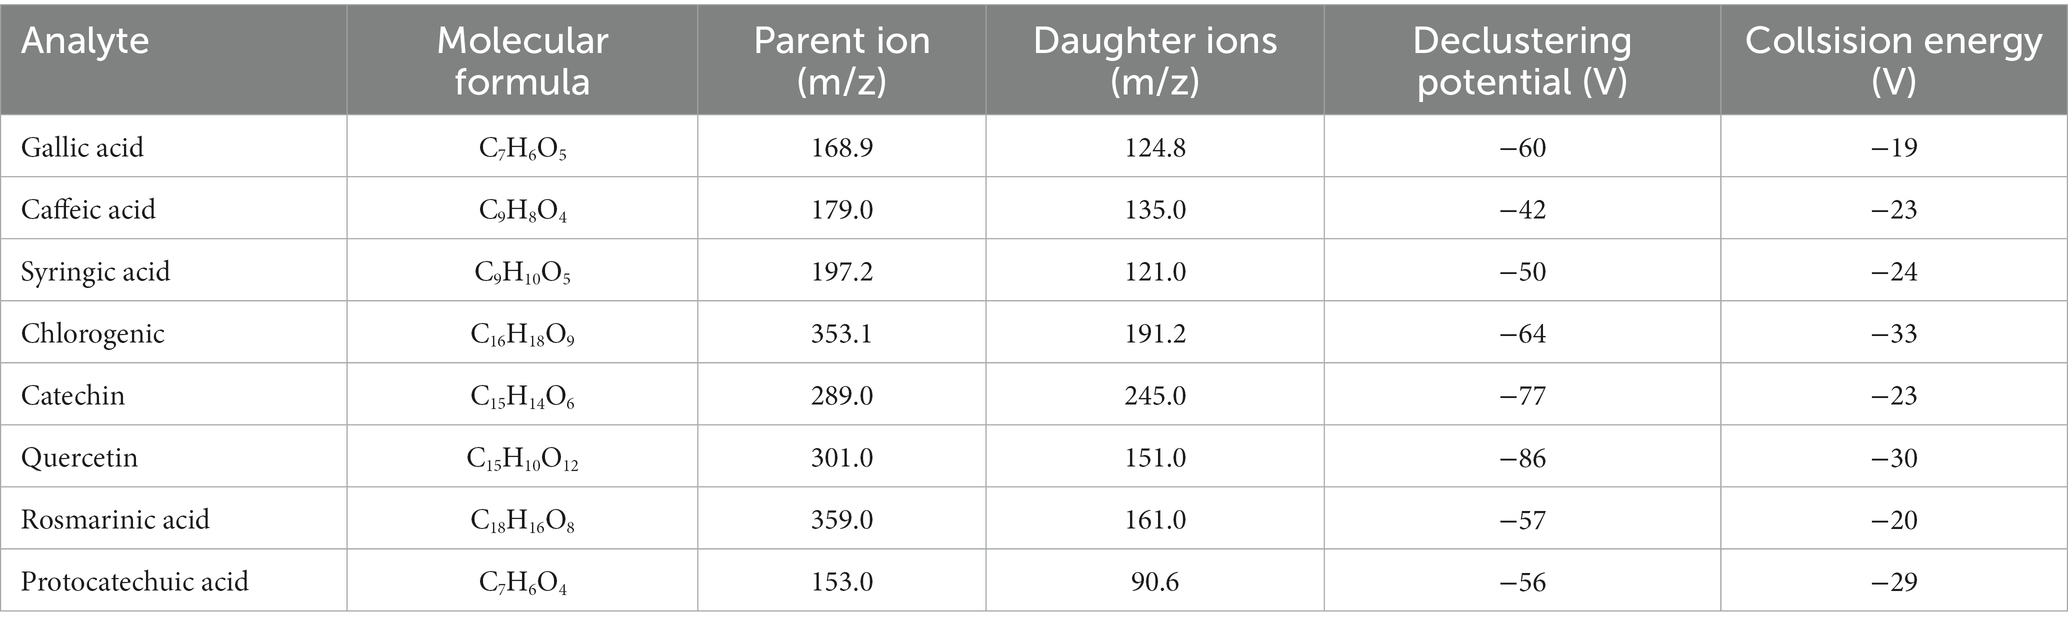
Table 5. The parent ion and daughter ions of the eight moleculars.
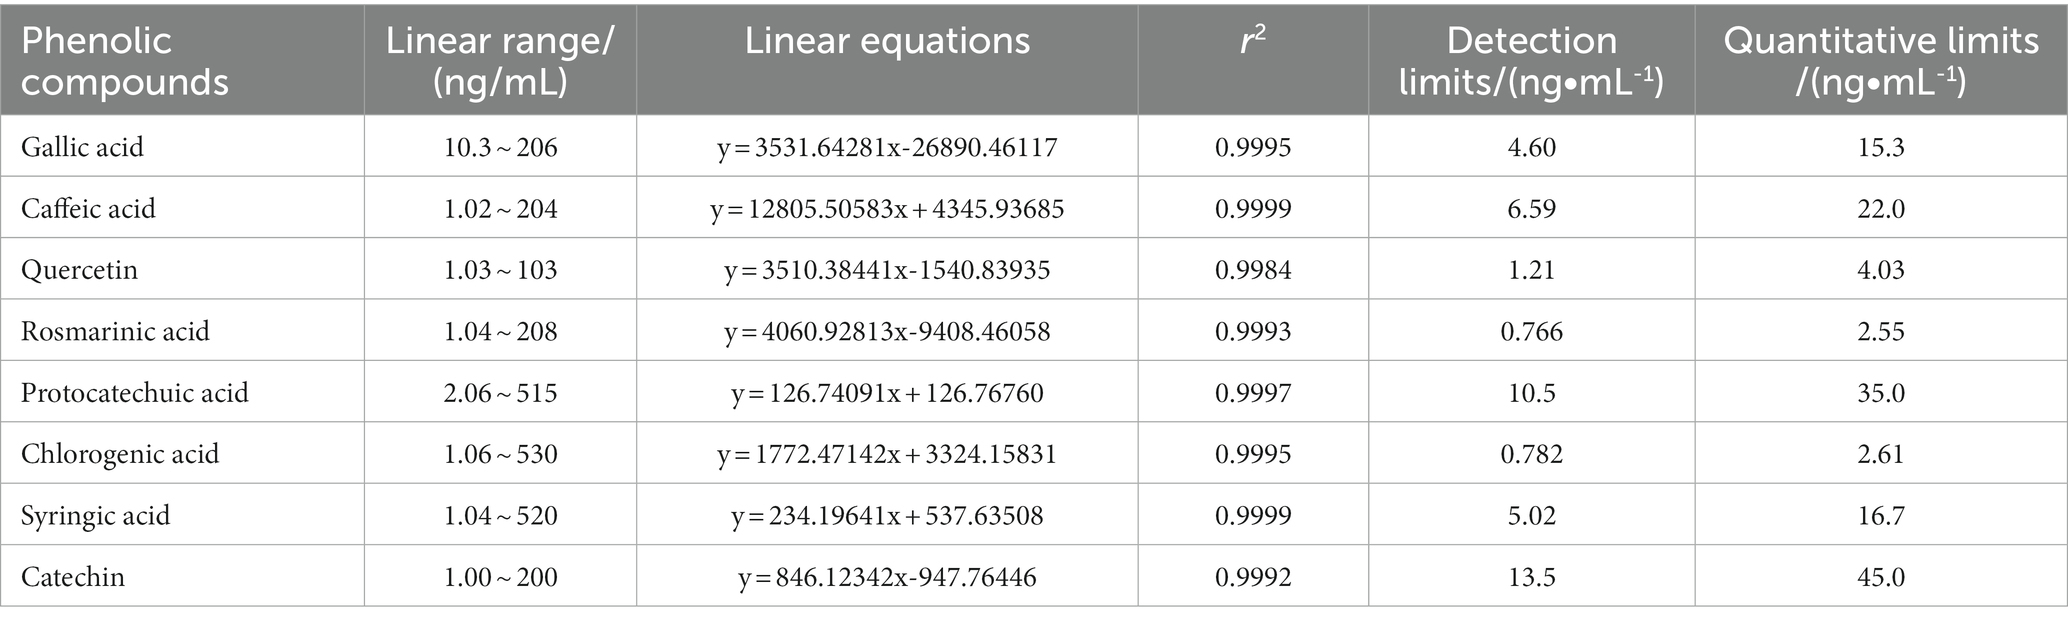
Table 6. The linearity and range, detection limits, and quantification limits of the standard curves for the eight phenolic compounds from B. bicolor.
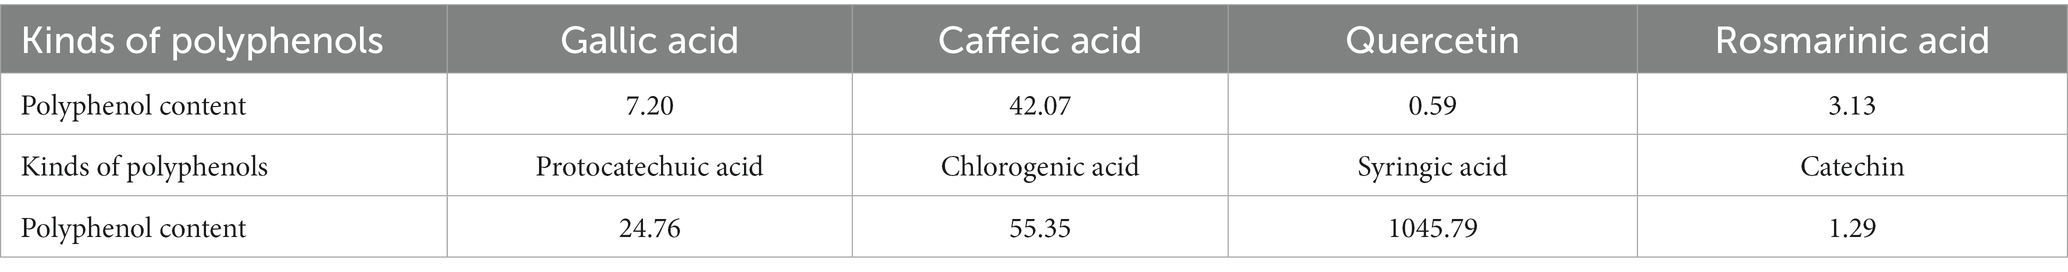
Table 7. Polyphenols content in B. bicolor (μg·g −1).
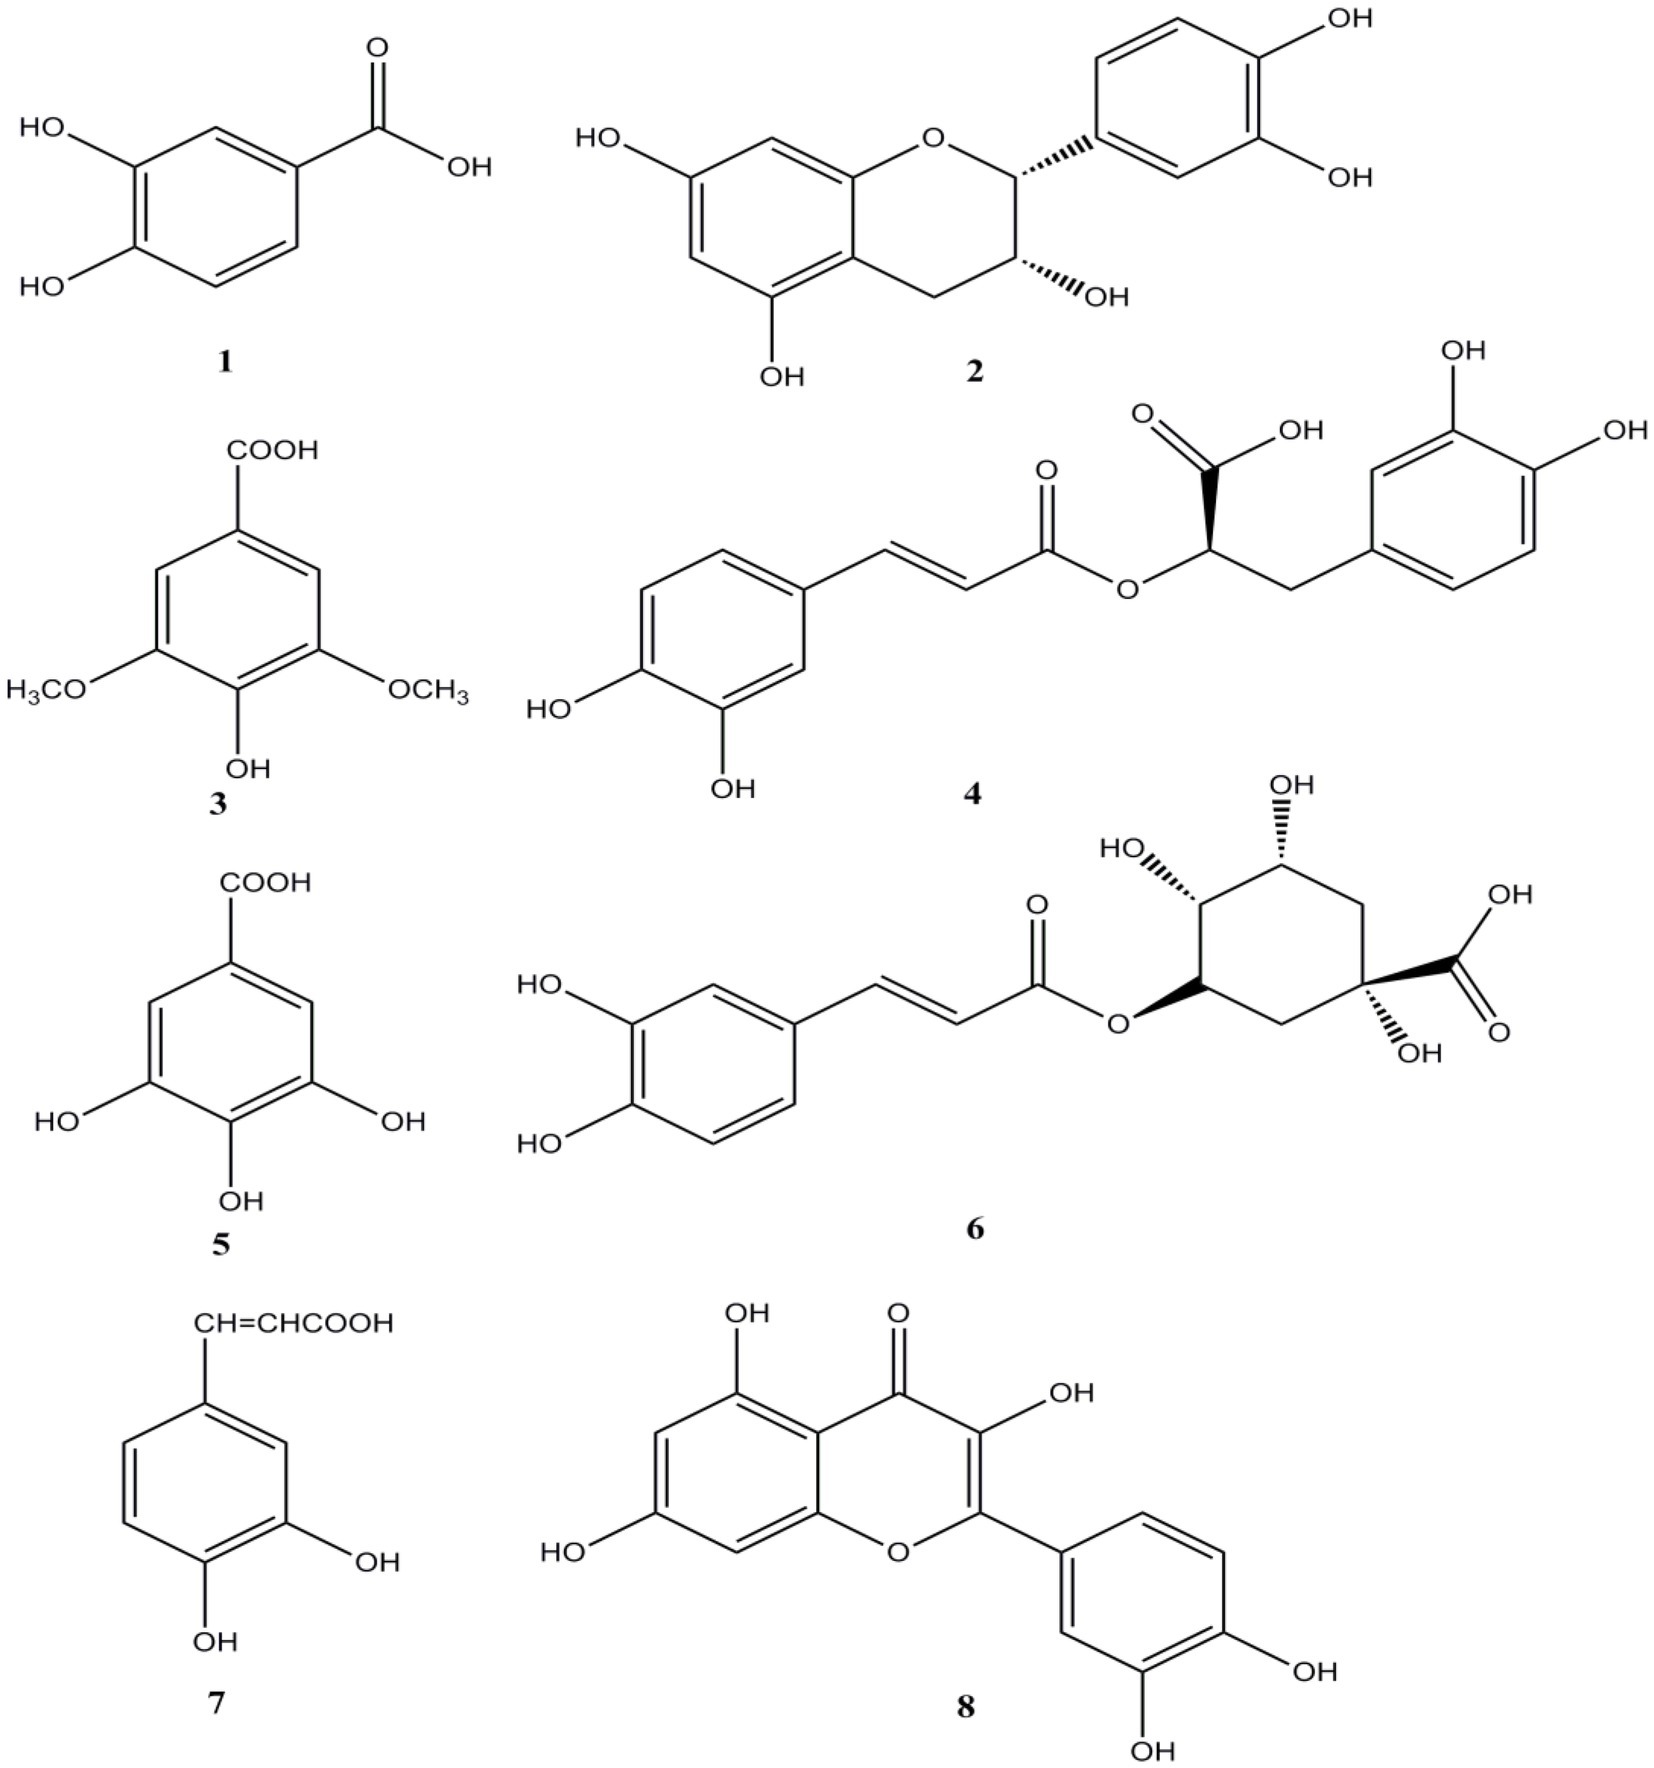
Figure 5. The eight compound structures of from Boletus bicolor.
The energies and distribution of molecular frontier orbitals could provide useful information for evaluating antioxidant activities. The molecular orbital theory in quantum chemistry considers that the distribution of the highest occupied molecular orbital (HOMO) and the lowest unoccupied molecular orbital (LUMO) can visualize the main action sites of antioxidants in scavenging-free activity (37). The energy level difference of frontline molecular orbitals is an important theoretical parameter to characterize molecular activity. The higher the HOMO energy, the stronger the electron-donating ability (37). The smaller the LUMO energy, the stronger the electron-withdrawing ability. The energy and distribution of frontier orbitals are useful descriptors in evaluating the antioxidant properties of phenolic compounds. The energy gap can accurately characterize the order of antioxidant activities of molecules. The smaller the HOMO-LUMO energy gap is, the more readily the electron promotion occurs. A molecule with a higher HOMO energy exhibits a stronger electron-donating ability, indicating high antioxidant activity. Figure 6 shows the HOMO and LUMO energies distribution for the eight polyphenolic compounds. We can see that the order of the HOMO-LUMO energy gap is chlorogenic acid < quercetin < caffeic acid < rosmarinic acid < syringic acid < gallic acid < protocatechuic acid < catechin. On the other hand, the orbital energy difference (ΔE) for the studied polyphenolic compounds is also given in Figure 6. Chlorogenic acid exhibits the highest HOMO energy (−0.02744 eV) and the lowest energy difference (−0.23450 eV) among the studied compounds, suggesting that the compound might be the strongest antioxidant molecule. The highest energy difference is found for catechin (ΔE = 0.29506 eV). Indicating that catechin might be the weakest electron-donating ability, respectively.
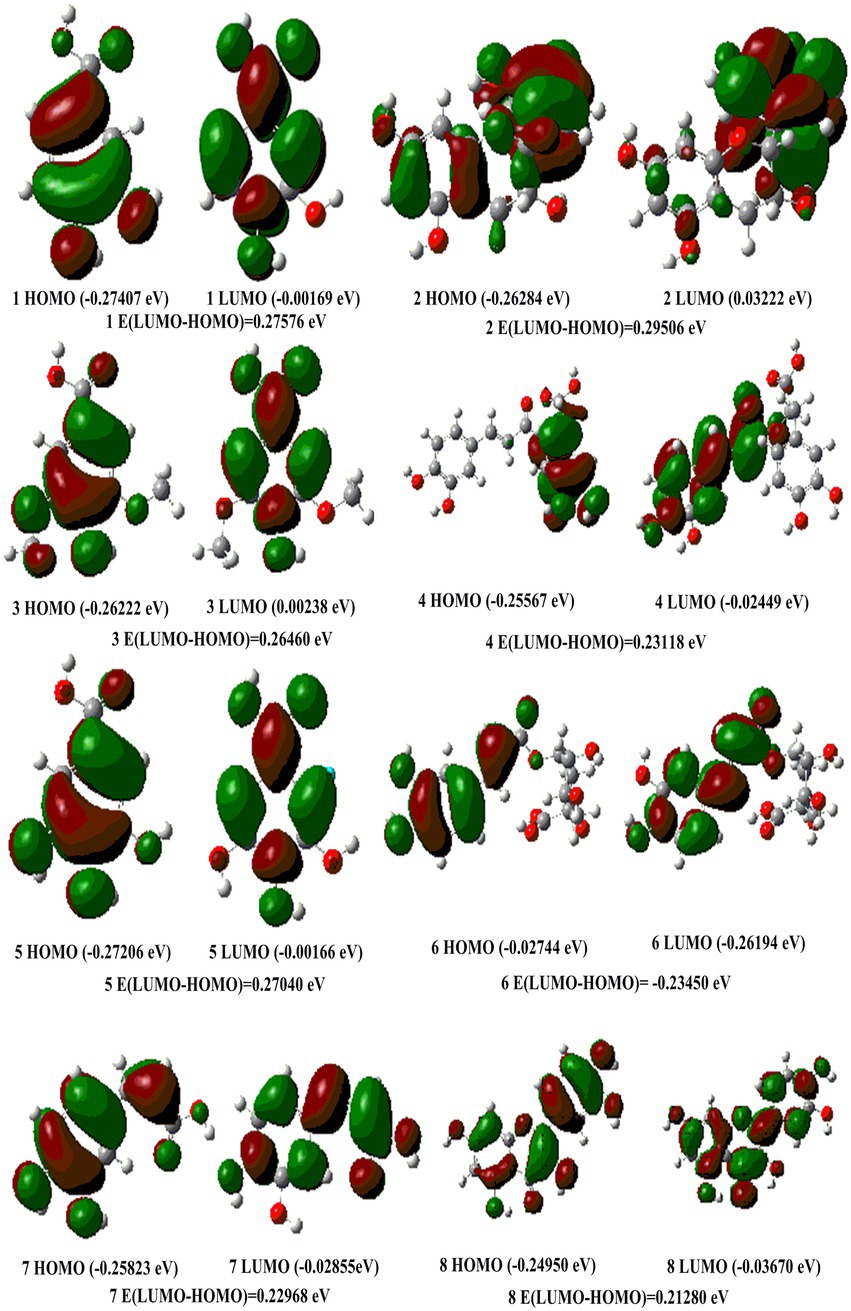
Figure 6. The HOMO and LUMO orbits of eight compound structures in Boletus bicolor.
To further explore the antioxidant capacity of eight polyphenolic compounds, intracellular ROS production was measured in H2O2-induced HepG2 cells. The H2O2-induced HepG2 cell model has been reported to be a classical model for assessing the antioxidant capacity of compounds (38) ROS play an important role in normal physiological functions and human diseases; the accumulation of high levels of ROS in vivo leads to protein and lipid oxidation, cellular damage, cellular aging, and even apoptosis (39). As shown in Figure 7, Compared with the control group, H2O2 administration significantly induced intracellular ROS production (p < 0.05). However, the intervention of eight polyphenolic compounds greatly reduced the H2O2-induced intracellular ROS production in HepG2 cells compared to the H2O2 group (p < 0.05). Moreover, the antioxidant capacity of the eight polyphenolic compounds were ranked as chlorogenic acid > quercetin > caffeic acid > rosmarinic acid > gallic acid > protocatechuic acid > catechin. The above results once again proved DFT analysis of the eight polyphenolic compounds.
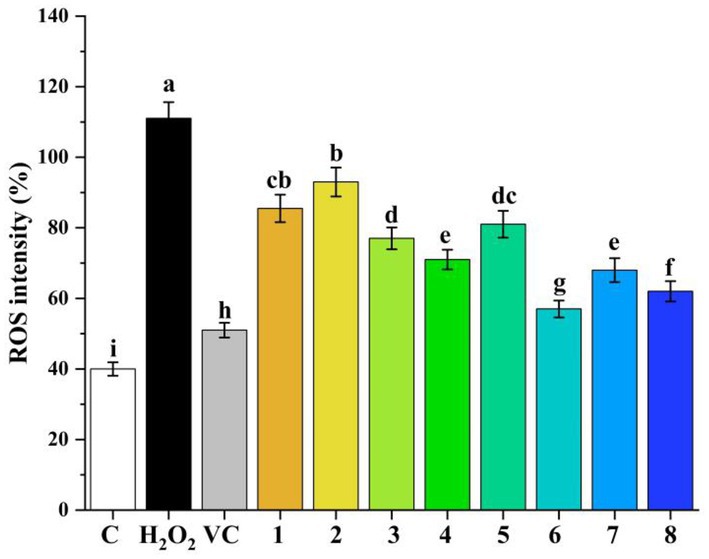
Figure 7. Cellular ROS inhibitory effects of phenolic compounds (1–8) in H2O2-induced HepG2 cells (1-protocatechuic acid; 2-Catechin 3-Syringic acid; 4-Rosmarinic acid; 5-Gallic acid; 6-Chlorogenic acid; 7-Caffeic acid; and 8-Quercetin). (A) DPPH scavenging capacity. (B) ABTS scavenging capacity. (C) OH scavenging activity. (D) NO2− scavenging capacity.
It was reported that the antioxidant activity of phenolic compounds in biological systems is the most important component of their bioactivity, where they act as free radical inhibitors (40–42). Eight mushrooms, including Agaricus bisporus, Boletus edulis, Calocybe gambosa, Cantharellus cibarius, Craterellus cornucopioides, Hygrophorus marzuolus, Lactarius deliciosus, and Pleurotus ostreatus were evaluated, and the phenolic compounds have shown a significant inhibition effect against lipid oxidation (40). Yahia et al. analyzed the phenolic compounds of 17 species of wild mushrooms and detected their antioxidant activities by FRAP and DPPH assays, suggesting an effective nutritional and health value of different mushroom species (41). Hu et al. investigated the neuroprotection of six components from Flammulina velutipes, which were mainly phenolic compounds, on H2O2−induced oxidative damage in PC12 cells and demonstrated that most of the components exhibit neuroprotective effects along with their antioxidant activities (42). To evaluate the antioxidant activities of B. bicolor, we performed five antioxidant activities experiments as follows:
As seen from Figure 8, the DPPH scavenging activities of the sample and ascorbic acid increase with the mass concentration, and the scavenging ability of the sample is slightly lower than that of ascorbic acid. The sample and ascorbic acid clearances reach 83.07 and 93.10%, respectively. The IC50 of the sample is 98.17 μg/mL, and the IC50 of ascorbic acid is 19.50 μg/mL. The DPPH scavenging rate of polyphenols may be due to different types of phenolic acids contained in the samples (43–45).
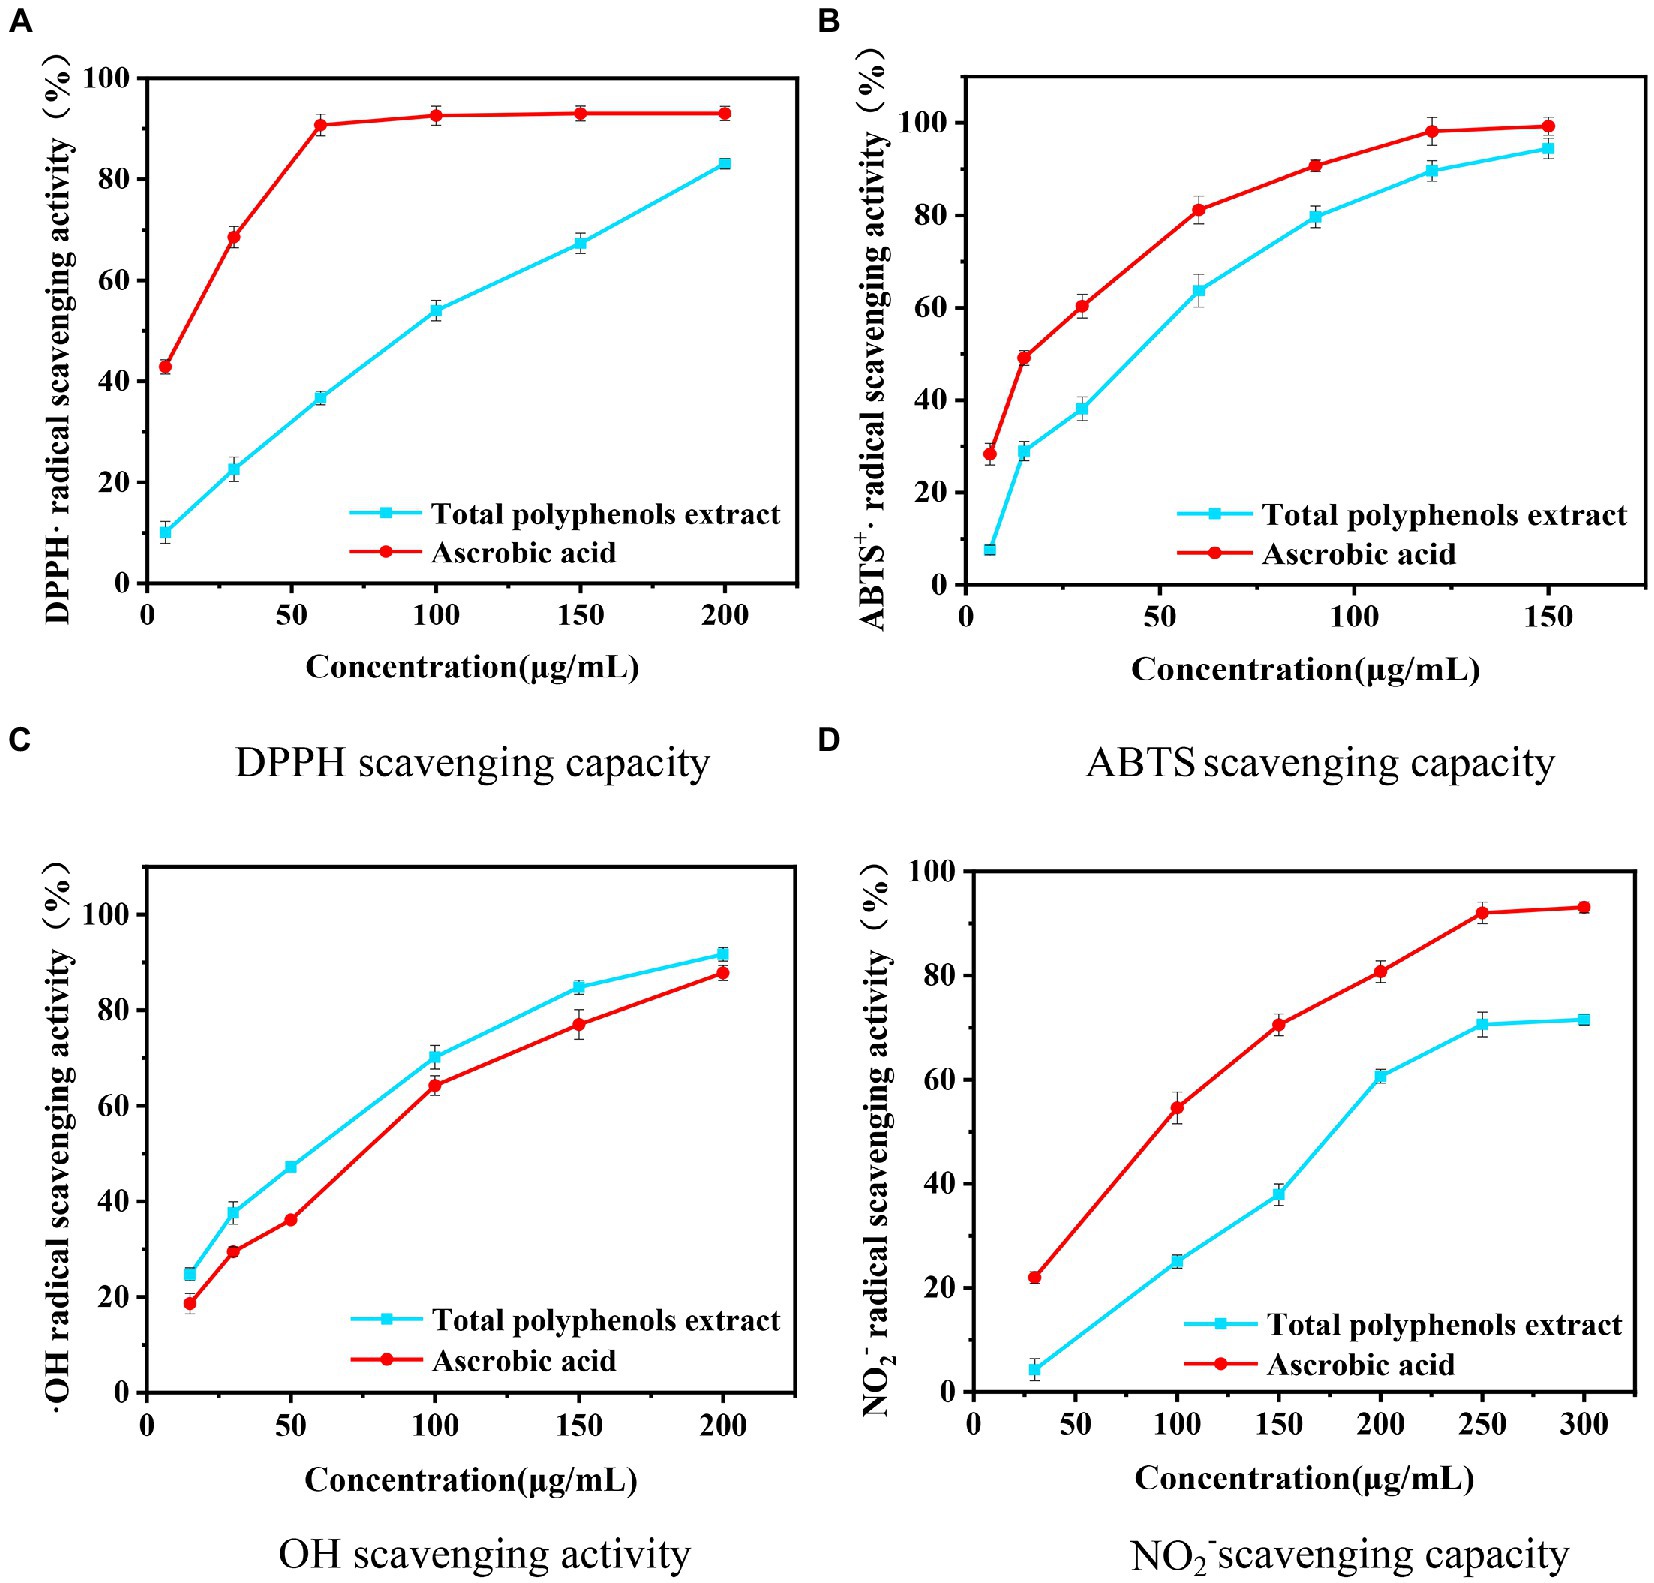
Figure 8. Evaluation of the effect of five methods on different concentrations of Boletus bicolor polyphenols.
The results of ABTS scavenging ability are shown in Figure 8. The scavenging ability of the sample is weaker compared to ascorbic acid (40–42, 46–48). At a concentration of 150 μg/mL, the B. bicolor extract exhibits 94.45% inhibition, while it is 99.53% for ascorbic acid. The IC50 value of the B. bicolor extract is 49.80 μg/mL, while it is 21.93 μg/mL for ascorbic acid. Compared to the DPPH scavenging ability, it is improved twice, indicating that polyphenol substances in the B. bicolor extract are great ABTS scavengers.
Salicylic acid can capture hydrogen peroxide (H2O2), and Fe2+ can generate an OH radical reaction to produce colored substances with a characteristic absorption at a wavelength of 510 nm. Phenolic antioxidants exhibit the effect of scavenging OH radicals, reducing the generation of colored substances and lowering the absorbance value, so the antioxidant capacity can be estimated based on the absorbance to determine the level of antioxidant activity (49). Figure 8 showed that the B. bicolor extract exhibits better OH radical scavenging activity than ascorbic acid at different concentrations. In particular, at a concentration of 350 μg/mL, the B. bicolor extract exhibits the maximum scavenging of 93.76%, comparable to the ascorbic acid scavenging of 88.83%. The IC50 value of the B. bicolor extract is 44.23 μg/mL, and for the ascorbic acid, it is 60.79 μg/mL. The ability of the B. bicolor extract to scavenge OH radicals is 1.37 times higher than that of ascorbic acid, indicating the great performance of the B. bicolor extract polyphenols on scavenging OH radicals.
Nitrosamines are the most potent carcinogenic chemicals in humans. Nitrites are the source of nitrosamines, so removing nitrites may effectively prevent cancer in humans (50–52). Nitrites react with p-aminobenzenesulfonic acid and then couple with naphthylenediamine hydrochloride to form a red complex. When antioxidants are present in the system, they remove nitrites, making the system less colored. Figure 8 shows that the ability of the sample and ascorbic acid to scavenge NO2− increases with the mass concentration, and the scavenging ability of the sample is weaker than that of ascorbic acid. Especially, the B. bicolor extract exhibits the maximum scavenging of 76.2%, comparable to the NO2− scavenging activity of ascorbic acid. The IC50 value of ascorbic acid is 94.77 μg/mL, and that of the B. bicolor extract is 174.46 μg/mL, indicating that the polyphenols in the B. bicolor extract exhibit a certain scavenging effect on NO2−.
The reducing ability is used as an indicator to convert Fe3+ to Fe2+. The presence of antioxidants in the system might cause the conversion of Fe3+ to Fe2+ in potassium ferricyanide to form a blue-green complex, and the stronger the reducing ability of the antioxidants, the greater their absorbance values (51, 52). From Figure 9 can be seen that the ability of the sample and ascorbic acid to reduce ferrous ions increases with the mass concentration. The sample behavior becomes weaker relative to ascorbic acid when the mass concentration reaches 180 μg/mL. When the mass concentration reaches 250 μg/mL, the absorbance value of the sample is 1.218. At a mass concentration of 400 μg/mL, the absorbance values of ascorbic acid and the sample are 1.525 and 1.999, respectively. Thus, the EC50 of the sample and ascorbic acid are 123 and 48 μg/mL, respectively, and the reducing power of the sample is 0.39 times that of ascorbic acid.
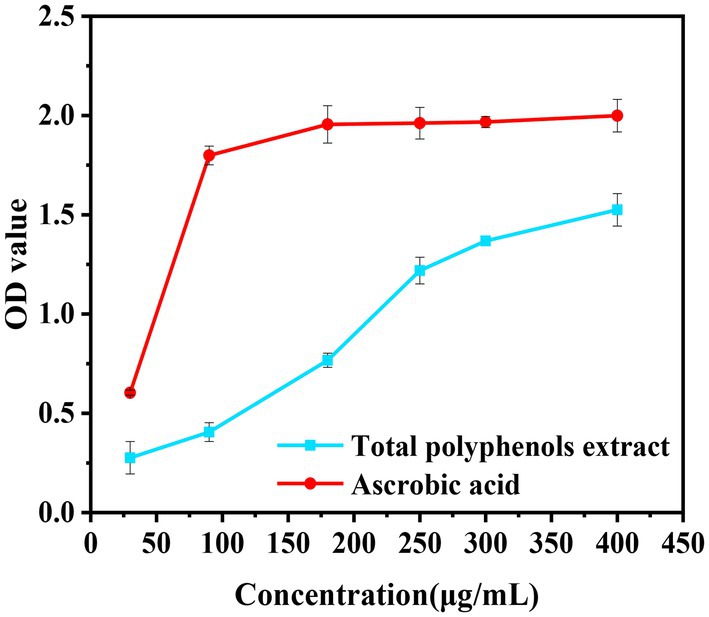
Figure 9. Reduction ability of polyphenols from Boletus bicolor to iron ion.
This paper optimized the extraction process of polyphenols from B. bicolor using the RSM method. Based on the response surface analysis, the optimum extraction conditions were determined: an ethanol concentration of 42%, a solvent-to-solid ratio of 34:1 mL/g, a temperature of 40°C, and an ultrasonic time of 41 min. The polyphenol extraction rate was 13.69 ± 0.13 mg/g with a relative deviation of 0.2%. The advantages of the method in terms of time-saving and high efficiency were compared with the traditional soxhlet extraction. Besides, the antioxidants activities of mushroom extracts exhibited good 2, 2-dipheny-1-picrylhydrazyl radical (DPPH·), 2, 2-azino-bis (3-ethylbenzothiaziline-6-sulfonic acid) radical (ABTS+·), hydroxyl radical (OḤ), and nitric radical (NO2−) scavenging activities, as well as the ferric reducing antioxidant power. Eight main phenolic compounds found in the extract of B. bicolor were identified and quantified by the UPLC-MS method: protocatechuic acid, catechin, syringic acid, rosmarinic acid, gallic acid, chlorogenic acid, caffeic acid, and quercetin. Additionally, the DFT calculations showed that chlorogenic acid exhibited the highest HOMO energy and the lowest energy difference among the studied compounds, while the lowest HOMO energy and the highest energy difference were found for quercetin. The intervention of eight polyphenolic compounds greatly reduced the H2O2-induced intracellular ROS production in HepG2 cells as compared to the H2O2 group, and showed strong cell protective effects. The antioxidant capacity of the eight polyphenolic compounds proved the DFT analysis. The results provide theoretical guidance for developing natural antioxidants based on B. bicolor resources. This study might be useful for future developments and pharmaceutical applications of polyphenols in B. bicolor mushrooms.
The original contributions presented in the study are included in the article/supplementary material, further inquiries can be directed to the corresponding authors.
S-LS and X-SZ conceived and designed the experiment and contributed to valuable discussion and revising manuscript. D-BH and RX performed the experiments. X-CZ analyzed the data. D-BH wrote the paper. All authors contributed to the article and approved the submitted version.
This work was supported by the National Natural Science Foundation of China (No. 31960480) and Regional Universities Joint Special Project Surface Project (202101BA070001-193).
The authors declare that the research was conducted in the absence of any commercial or financial relationships that could be construed as a potential conflict of interest.
All claims expressed in this article are solely those of the authors and do not necessarily represent those of their affiliated organizations, or those of the publisher, the editors and the reviewers. Any product that may be evaluated in this article, or claim that may be made by its manufacturer, is not guaranteed or endorsed by the publisher.
1. Mohammed, MT, Kadhim, SM, Jassimand, AM, and Sarah, IA. Free radicals and human health. IJIS. (2015) 4:218–23.
2. Majaz, AQ, and Khurshid, IM. Free radicals and their management. Am J Pharm Health Res. (2018) 6:2321–3647.
3. Ifeanyi, OE. A review on free radicals and antioxidants. Int J Curr Res Med Sci. (2018) 4:123–33. doi: 10.22192/ijcrms.2018.04.02.019
4. Chen, G, Fan, M, Wu, J, Li, N, and Guo, M. Antioxidant and antiinflammatory properties of flavonoids from lotus plumule. Food Chem. (2019) 277:706–12. doi: 10.1016/j.foodchem.2018.11.040
5. Brown, ES, Allsopp, PJ, Magee, PJ, Gill, CI, Nitecki, S, Strain, CR, et al. Seaweed and human health. Nutr Rev. (2014) 72:205–16. doi: 10.1111/nure.12091
6. Nowacka, N, Nowak, R, Drozd, M, Olech, M, Los, R, and Malm, A. Analysis of phenolic constituents, antiradical and antimicrobial activity of edible mushrooms growing wild in Poland. Lebensm Wiss Technol. (2014) 59:689–94. doi: 10.1016/j.lwt.2014.05.041
7. Kumar, S, and Abhay, KP. Free radicals: health implications and their mitigation by herbals. BJMMR. (2015) 7:438–57. doi: 10.9734/BJMMR/2015/16284
8. Kumar, H, Choudhary, N, Varsha, KN, and Suman, SR. Phenolic compounds and their health benefits: a review. J Food Res Technol. (2014) 2:46–59. Available at: https://www.researchgate.net/publication/350966390
9. Ma, G, Yang, W, Zhao, L, Pei, F, Fang, D, and Hu, Q. A critical review on the health promoting effects of mushrooms nutraceuticals. Food Sci Human Wellness. (2018) 7:125–33. doi: 10.1016/j.fshw.2018.05.002
10. Islam, T, Yao, F, Kang, W, Lu, L, and Xu, B. A systematic study on mycochemical profiles, antioxidant, and anti-inflammatory activities of 30 varieties of Jew’s ear (Auricularia auricula-judae). Food Sci Human Wellness. (2022) 11:781–94. doi: 10.1016/j.fshw.2022.03.005
11. Montes, A, Rangel-Vargas, E, Lorenzo, J, Romero, L, and Santos, E. Edible mushrooms as a novel trend in the development of healthier meat products. Curr Opin Food Sci. (2021) 37:118–24. doi: 10.1016/j.cofs.2020.10.004
12. Aida, F, Shuhaimi, M, Yazid, M, and Maaruf, A. Mushroom as a potential source of prebiotics: a review. Trends Food Sci Technol. (2009) 20:567–75. doi: 10.1016/j.tifs.2009.07.007
13. Yan, Q, Huan, M, Sun, P, Cheng, S, Zhang, Q, and Dai, H. Steroids, fatty acids and ceramide from the mushroom Stropharia rugosoannulata Farlow apud Murrill. Biochem Syst Ecol. (2020) 88:103963. doi: 10.1016/j.bse.2019.103963
14. Cui, Y, Feng, B, Wu, G, Xu, J, and Yang, Z. Porcini mushrooms (boletus sect. Boletus) from China. Fungal Divers. (2016) 81:189–212. doi: 10.1007/s13225-015-0336-7
15. Tibuhwa, D. Cytotoxicity, antimicrobial and antioxidant activities of boletus bicolor. Tanz J Sci. (2017) 43:157–63. Available at: https://www.ajol.info/index.php/tjs/article/download/170911/160324/0
16. Zhang, M, Zhou, R, Liu, F, and Ng, T. Purification of a novel protein with cytotoxicity against non-small-cell lung cancer cells from boletus bicolor. Arch Pharm. (2021) 354:2100135–10. doi: 10.1002/ardp.202100135
17. Du, B, Peng, F, Xie, Y, Wang, H, Wu, J, Liu, C, et al. Optimization extraction and antioxidant activity of crude polysaccharide from chestnut mushroom (Agrocybe aegerita) by accelerated solvent extraction combined with response surface methodology (ASE-RSM). Molecules. (2022) 27:2380–94. doi: 10.3390/molecules27082380
18. Xu, D, Zhou, Y, Zheng, J, Li, S, Li, A, and Li, H. Optimization of ultrasound-assisted extraction of natural antioxidants from the flower of Jatropha integerrima by response surface methodology. Molecules. (2015) 21:18–30. doi: 10.3390/molecules21010018
19. Xu, D, Zheng, J, Zhou, Y, Li, Y, Li, S, and Li, H. Ultrasound-assisted extraction of natural antioxidants from the flower of Limonium sinuatum: optimization and comparison with conventional methods. Food Chem. (2017) 217:552–9. doi: 10.1016/j.foodchem.2016.09.013
20. Zhou, Y, Zheng, J, Gan, R, Zhou, T, Xu, D, and Li, H. Optimization of ultrasound-assisted extraction of antioxidants from the mung bean coat. Molecules. (2017) 22:638–51. doi: 10.3390/molecules22040638
21. Abu-Reidah, I, Ali-Shtayeh, M, Jamous, R, and Arráez-Román, D. Segura-CarreteroA. HPLC–DAD–ESI-MS/MS screening of bioactive components from Rhus coriaria L. (sumac) fruits. Food Chem. (2015) 166:179–91. doi: 10.1016/j.foodchem.2014.06.011
22. Wang, Y, Wang, Y, Liu, Y, Cao, J, Yang, M, Wang, Y, et al. 6′-O-Caffeoylarbutin from que Zui tea ameliorates acetaminophen-induced liver injury via enhancing antioxidant ability and regulating the PI3K signaling pathway. Food Funct. (2022) 13:5299–316. doi: 10.1039/D2FO00507G
23. Wang, Y, Wang, Z, Xue, Q, Zhen, L, Wang, Y, Cao, J, et al. Effect of ultra-high pressure pretreatment on the phenolic profiles, antioxidative activity and cytoprotective capacity of different phenolic fractions from que Zui tea. Food Chem. (2023) 409:135271. doi: 10.1016/j.foodchem.2022.135271
24. Hou, M, Hu, W, Wang, A, Xiu, Z, Shi, Y, Hao, K, et al. Ultrasound-assisted extraction of total flavonoids from Pteris cretica L.: process optimization, HPLC analysis, and evaluation of antioxidant activity. Antioxidants. (2019) 8:425–41. doi: 10.3390/antiox8100425
25. Vlau, M, Soare, L, Sutan, N, Ducu, C, Moga, S, Hritcu, L, et al. Optimization of ultrasonic extraction to obtain erinacine a and polyphenols with antioxidant activity from the fungal biomass of Hericium erinaceus. Foods. (2020) 9:1889–906. doi: 10.3390/foods9121889
26. Myo, H, and Khat-udomkiri, N. Optimization of ultrasound-assisted extraction of bioactive compounds from coffee pulp using propylene glycol as a solvent and their antioxidants activities. Ultrason Sonochem. (2022) 89:106127–7. doi: 10.1016/j.ultsonch.2022.106127
27. Wu, W, Xiang, F, and He, F. Polyphenols from Artemisia argyi leaves: environmentally friendly extraction under high hydrostatic pressure and biological activities. Ind Crop Prod. (2021) 171:113951–60. doi: 10.1016/j.indcrop.2021.113951
28. Ashfaq, A, Muhammad, K, Zhuang, Y, Imran, T, Taj, M, Mohammad, S, et al. Chemical composition and cntioxidant properties of eight wild edible boletaceae mushrooms growing in Yunnan Province of China. Jökull. (2015) 12:146–67. Available at: https://www.researchgate.net/publication/320075796
29. Clarke, G, Ting, K, Wiart, C, and Fry, J. High correlation of 2, 2-diphenyl-1-picrylhydrazyl (DPPH) radical scavenging, ferric reducing activity potential and total phenolics content indicates redundancy in use of all three assays to screen for antioxidant activity of extracts of plants from the Malaysian rainforest. Antioxidants. (2013) 2:1–10. doi: 10.3390/antiox2010001
30. Silva, A, Pinto, D, Moreira, M, Costa, P, Delerue-Matos, C, and Rodrigues, F. Valorization of Kiwiberry leaves recovered by ultrasound-assisted extraction for skin application: a response surface methodology approach. Antioxidants. (2022) 11:763–78. doi: 10.3390/antiox11040763
31. Dai, K, Wei, Y, Jiang, S, Xu, F, Wang, H, Zhang, X, et al. Lab scale extracted conditions of polyphenols from thinned peach fruit have antioxidant, hypoglycemic, and hypolipidemic properties. Foods. (2022) 11:99–116. doi: 10.3390/foods11010099
32. Clodoveo, M, Crupi, P, Annunziato, A, and Corbo, F. Innovative extraction technologies for development of functional ingredients based on polyphenols from olive leaves. Foods. (2022) 11:103–29. doi: 10.3390/foods11010103
33. Garcia-Villalba, R, Larrosa, M, Possemiers, S, Tomas-Barberan, F, and Espin, J. Bioavailability of phenolics from an oleuro peinrich olive (Olea europaea) leaf extract and its acute effect on plasma antioxidant status: comparison between pre- and postmenopausal women. Eur J Nutr. (2014) 53:1015–27. doi: 10.1007/s00394-013-0604-9
34. Vuong, Q, Goldsmith, C, Dang, T, Nguyen, V, Bhuyan, D, Sadeqzadeh, E, et al. Optimisation of ultra sound-assisted extraction conditions for phenolic content and antioxidant capacity from Euphorbia tirucalli using response surface methodology. Antioxidants. (2014) 3:604–17. doi: 10.3390/antiox3030604
35. Xu, Y, Zhang, L, Yang, Y, Song, X, and Yu, Z. Optimization of ultrasound-assisted compound enzymatic extraction and characterization of polysaccharides from blackcurrant. Carbohydr Polym. (2015) 117:895–902. doi: 10.1016/j.carbpol.2014.10.032
36. Li, Y, Guo, C, Yang, J, Wei, J, Xu, J, and Cheng, S. Evaluation of antioxidant properties of pomegranate peel extract in comparison with pomegranate pulp extract. Food Chem. (2006) 96:254–60. doi: 10.1016/j.foodchem.2005.02.033
37. Prior, R, Wu, X, and Schaich, K. Standardized methods for the determination of antioxidant capacity and phenolics in foods and dietary supplements. J Agric Food Chem. (2005) 53:4290–302. doi: 10.1021/jf0502698
38. Fan, Z, Wang, Y, Yang, M, Cao, J, Khan, A, and Cheng, G. UHPLC-ESI-HRMS/MS analysis onphenolic compositions of different E se tea extracts and their antioxidant and cytoprotective activities. Food Chem. (2020) 318:126512–14. doi: 10.1016/j.foodchem.2020.126512
39. Yang, M, Ma, Y, Wang, Z, Khan, A, Zhou, W, Zhao, T, et al. Phenolic constituents, antioxidant and cytoprotective activities of crude extract and fractions from cultivated artichoke inflorescence. Ind Crop Prod. (2020) 143:111433–11. doi: 10.1016/j.indcrop.2019.05.082
40. Palacios, I, Lozano, M, Moro, C, D’Arrigo, M, Rostagno, M, Martínez, J, et al. Antioxidant properties of phenolic compounds occurring in edible mushrooms. Food Chem. (2011) 128:674–8. doi: 10.1016/j.foodchem.2011.03.085
41. Yahia, E, Gutiérrez-Orozco, F, and Moreno-Pérez, M. Identification of phenolic compounds by liquid chromatography-mass spectrometry in seventeen species of wild mushrooms in Central Mexico and determination of their antioxidant activity and bioactive compounds. Food Chem. (2017) 226:14–22. doi: 10.1016/j.foodchem.2017.01.044
42. Hu, Q, Wang, D, Yu, J, Ma, G, Pei, F, and Yang, W. Neuroprotective effects of six components from Flammulina velutipes on H2O2-induced oxidative damage in PC12 cells. J Funct Foods. (2017) 37:586–93. doi: 10.1016/j.jff.2017.07.043
43. Madsen, H, Andersen, C, Jørgensen, L, and Skibsted, L. Radical scavenging by dietary flavonoids. A kinetic study of antioxidant efficiencies. Eur Food Res Technol. (2000) 211:240–6. doi: 10.1007/s002170000189
44. Feng, S, Luo, Z, Tao, B, and Chen, C. Ultrasonic-assisted extraction and purification of phenolic compounds from sugarcane (Saccharum officinarum L.) rinds. LWT Food Sci Technol. (2015) 60:970–6. doi: 10.1016/j.lwt.2014.09.066
45. Dahmoune, F, Spigno, G, Moussi, K, Remin, H, Cherbal, A, and Madani, K. Pistacia lentiscus leaves as a source of phenolic compounds: microwave-assisted extraction optimized and compared with ultrasound-assisted and conventional solvent extraction. Ind Crop Prod. (2014) 61:31–40. doi: 10.1016/j.indcrop.2014.06.035
46. Wang, W, Li, Q, Liu, Y, and Chen, B. Ionic liquid-aqueous solution ultrasonic-assisted extraction of three kinds of alkaloids from Phellodendron amurense Rupr and optimize conditions use response surface. Ultrason Sonochem. (2015) 24:13–8. doi: 10.1016/j.ultsonch.2014.10.009
47. Luo, Q, Zhang, J, Li, H, Wu, D, Geng, F, Corke, H, et al. Green extraction of antioxidant polyphenols from green tea (Camellia sinensis). Antioxidants. (2020) 9:785–800. doi: 10.3390/antiox9090785
48. Du, B, Peng, F, Cheng, C, Chen, Y, Wu, J, Zhu, F, et al. Phenolic profiles and antioxidant activities of exocarp, endocarp, and hypanthium of three pear cultivars grown in China. J Food Bioact. (2021) 14:1–6. doi: 10.31665/JFB.2021.14269
49. Dorta, M, Lobo, M, and González, M. Optimization of factors affecting extraction of antioxidants from mango seed. Food Bioprocess Technol. (2013) 6:1067–81. doi: 10.1007/s11947-011-0750-0
50. Kumar, M, Dahuja, A, Tiwari, S, Punia, S, Tak, Y, Amarowicz, R, et al. Recent trends in extraction of plant bioactives using green technologies: a review. Food Chem. (2021) 353:129431–50. doi: 10.1016/j.foodchem.2021.129431
51. Romani, A, Coinu, R, Carta, S, Pinelli, P, Galardi, C, Vincieri, F, et al. Evaluation of antioxidant effect of different extracts of Myrtus communis L. Free Radic Res. (2004) 38:97–103. doi: 10.1080/10715760310001625609
Keywords: ultrasound-assisted extraction, Boletus bicolor, polyphenols, UPLC-MS analysis, DFT, antioxidant activity
Citation: Hu D-B, Xue R, Zhuang X-C, Zhang X-S and Shi S-L (2023) Ultrasound-assisted extraction optimization of polyphenols from Boletus bicolor and evaluation of its antioxidant activity. Front. Nutr. 10:1135712. doi: 10.3389/fnut.2023.1135712
Edited by:
Yajie Zou, Institute of Agricultural Resources and Regional Planning (CAAS), ChinaReviewed by:
Ang Ren, Nanjing Agricultural University, ChinaCopyright © 2023 Hu, Xue, Zhuang, Zhang and Shi. This is an open-access article distributed under the terms of the Creative Commons Attribution License (CC BY). The use, distribution or reproduction in other forums is permitted, provided the original author(s) and the copyright owner(s) are credited and that the original publication in this journal is cited, in accordance with accepted academic practice. No use, distribution or reproduction is permitted which does not comply with these terms.
*Correspondence: Sheng-Li Shi, c2hpc2hlbmdsaUB5eG51LmVkdS5jbg==; Xin-Sha Zhang, eHN6aGFuZ0B5eG51LmVkdS5jbg==
Disclaimer: All claims expressed in this article are solely those of the authors and do not necessarily represent those of their affiliated organizations, or those of the publisher, the editors and the reviewers. Any product that may be evaluated in this article or claim that may be made by its manufacturer is not guaranteed or endorsed by the publisher.
Research integrity at Frontiers
Learn more about the work of our research integrity team to safeguard the quality of each article we publish.