
94% of researchers rate our articles as excellent or good
Learn more about the work of our research integrity team to safeguard the quality of each article we publish.
Find out more
ORIGINAL RESEARCH article
Front. Nutr., 28 February 2023
Sec. Food Chemistry
Volume 10 - 2023 | https://doi.org/10.3389/fnut.2023.1132228
This article is part of the Research TopicEthnofood Chemistry: Bioactive Components in Unexploited Foods from Centres of BiodiversityView all 11 articles
 Lena Gálvez Ranilla1,2*
 Gastón Zolla3
 Ana Afaray-Carazas1
 Miguel Vera-Vega3
 Hugo Huanuqueño4Huber Begazo-Gutiérrez5
 Rosana Chirinos6
 Romina Pedreschi7,8
 Kalidas Shetty9
The high maize (Zea mays L.) diversity in Peru has been recognized worldwide, but the investigation focused on its integral health-relevant and bioactive characterization is limited. Therefore, this research aimed at studying the variability of the primary and the secondary (free and dietary fiber-bound phenolic, and carotenoid compounds) metabolites of three maize types (white, red, and orange) from the Peruvian Andean race Cabanita at different maturity stages (milk-S1, dough-S2, and mature-S3) using targeted and untargeted methods. In addition, their antioxidant potential, and α-amylase and α-glucosidase inhibitory activities relevant for hyperglycemia management were investigated using in vitro models. Results revealed a high effect of the maize type and the maturity stage. All maize types had hydroxybenzoic and hydroxycinnamic acids in their free phenolic fractions, whereas major bound phenolic compounds were ferulic acid, ferulic acid derivatives, and p-coumaric acid. Flavonoids such as luteolin derivatives and anthocyanins were specific in the orange and red maize, respectively. The orange and red groups showed higher phenolic ranges (free + bound) (223.9–274.4 mg/100 g DW, 193.4– 229.8 mg/100 g DW for the orange and red maize, respectively) than the white maize (162.2–225.0 mg/100 g DW). Xanthophylls (lutein, zeaxanthin, neoxanthin, and a lutein isomer) were detected in all maize types. However, the orange maize showed the highest total carotenoid contents (3.19–5.87 μg/g DW). Most phenolic and carotenoid compounds decreased with kernel maturity in all cases. In relation to the primary metabolites, all maize types had similar fatty acid contents (linoleic acid > oleic acid > palmitic acid > α-linolenic acid > stearic acid) which increased with kernel development. Simple sugars, alcohols, amino acids, free fatty acids, organic acids, amines, and phytosterols declined along with grain maturity and were overall more abundant in white maize at S1. The in vitro functionality was similar among Cabanita maize types, but it decreased with the grain development, and showed a high correlation with the hydrophilic free phenolic fraction. Current results suggest that the nutraceutical characteristics of orange and white Cabanita maize are better at S1 and S2 stages while the red maize would be more beneficial at S3.
Maize (Zea mays L. ssp. mays) originated about 9,000 years ago in Mexico, and Latin America is considered the center of its genetic diversity and primary domestication (1–3). This cereal is staple food in Mesoamerican and Latin American countries since it is the base of many traditional preparations. It has been reported that the conservation and sustainable use of Latin American maize landrace diversity is fundamental for worldwide food security (1). Hence, efforts at multiple levels should be focused on the characterization of the genetically heterogenous landrace material as the base for further breeding improvements relevant for food security and health among indigenous food systems (1, 4).
The diversity of maize landrace populations is represented in races, which are identified according to their common botanical characteristics, geographical distribution, ecological adaptation, and cultural importance (uses and customs) (5–7). Mexico and Peru have concentrated around 30 percent of the Latin American maize diversity including 59 and 52 races, respectively (7, 8). The Peruvian Andean region with its great variety of ecological features has the highest maize phenotypic diversity worldwide (7, 9, 10). However, limited scientific information exist about Andean maize diversity which is compromising its adequate conservation and essential health relevant uses.
Whole cereal grains are valuable sources of carbohydrates, proteins, dietary fiber, minerals, and vitamins along with other critical bioactive metabolites with known health-promoting benefits (11, 12). The regular intake of whole grains has been inversely correlated with lower incidence of several chronic non-communicable diseases including type 2 diabetes (13), cardiovascular disease (14), and some types of cancer (15, 16). Maize contains nutritionally relevant macro and micronutrients mainly carbohydrates, lipids (with mono and polyunsaturated fatty acids), vitamins, minerals, and resistant starch (17). In addition, biologically active functional compounds such as phenolic compounds, carotenoids, tocopherols, and phytosterols have been reported in maize (17). In fact, unique phenolic and carotenoid profiles have been reported in different maize landraces linked to variable nutraceutical properties (18). Accordingly, more studies are needed to fully characterize maize landraces, targeting those that are the base of needs of food security and economy in many geographical areas such as the Andean region.
The maize race Cabanita has been cultivated since the Pre-Inca period in the southern Andean region of Arequipa in Peru at around 3,000 meters of altitude (19). Ears of Cabanita race have a conic-cylindrical shape and exhibit variable kernel pigmentations with predominance of white and partially red colored-pericarps (19). In a previous study, some Peruvian maize races including Arequipeño, Cabanita, Kculli, Granada, and Coruca races were evaluated in relation to their phenolic composition, in vitro anti-hyperglycemia, and anti-obesity potential (20). Cabanita kernels showed the second highest total oxygen radical absorbance antioxidant capacity (ORAC) and hyperglycemia management-relevant α-amylase inhibition following the purple-colored maize group (Kculli race) (20). More recently, Cabanita maize from two different provinces in Arequipa (Peru) were evaluated in relation to their physical characteristics, bioactive (phenolic and carotenoid) composition and in vitro antioxidant capacity (19). Although Cabanita samples from both provinces showed a certain grade of similarity according to the multivariate PCA (Principal Component Analysis), in general maize cultivated under Andean environments with naturally higher ecological stress factors such as higher altitudes and lower temperatures showed higher phenolic and antioxidant capacity ranges (19).
The intake of this traditional Andean maize is mostly in the mature dried form. Andean farmers still maintain the postharvest traditional practices along the Cabanita maize production chain. Once the maize ears have reached their highest length and a certain moisture level which is subjectively measured based on the farmer’s experience, the plants are cut and dried in a piled form in the same land. Thereafter, dried plants are transported to the farmer’s warehouses where maize ears are unshelled and exposed directly to the sun until complete drying (19). Dried grains are then consumed roasted, or further milled and used as flour in different culinary preparations.
Several studies focused mostly on sweet and waxy maize improved varieties have shown that bioactive compounds such as phenolic antioxidants and carotenoids vary depending on the kernel maturation stage. Phenolic compounds such as anthocyanins from different Asian colored waxy maize genotypes increased along the kernel maturation from 20 to 35 days after pollination (DAP) (21). Similarly, Zhang et al. (22) observed an increase of the total phenolic contents (TPC) in mature kernels from a yellow maize variety (48 DAP). The increase of carotenoids such as lutein, zeaxanthin, α-cryptoxanthin, β-cryptoxanthin has also been reported during the kernel maturation of some sweet maize varieties from China (23). On the contrary, the total phenolic and total carotenoids contents decreased at the end of grain maturation in yellow maize bred in United States (116 DAS, days after seeding) (24). These discrepancies reveal that different factors including genetic factors (variety), the time of harvest, and the agroecological conditions of maize cultivation may influence the bioactive composition during the maize kernel maturation. Consequently, the research on this topic should be performed case by case, according to specific ecological environments.
As a second stage follow up studies of previous advances to characterize the Peruvian Andean maize Cabanita (19), the objective of current research was to study the primary (polar compounds and fatty acids) and secondary metabolite composition (free and bound phenolics and carotenoid compounds), and the in vitro health-relevant functional properties of three selected Cabanita types (white, red, and orange pigmented kernels) harvested at different maturity stages, using targeted and untargeted metabolomic platforms. The in vitro model based functionality of Cabanita maize was evaluated in relation to its antioxidant potential and inhibitory activity against key digestive enzymes (α-amylase and α-glucosidase) relevant for hyperglycemia modulation. Results from this study will contribute with important biochemical and metabolomic information for the characterization, and conservation of the maize race Cabanita. In addition, information from this research would be important to diversify the consumption options of this Andean maize beyond the traditional mature form. This would likely lead to potential beneficial effects of food crops at health and economical levels among indigenous communities in the future.
The germplasm of Cabanita maize (Zea mays L.) collected in a previous study was used (19). Maize with sample codes CAW, CCR, COM representing white, red, and orange kernels were selected for current study considering the pigmentation diversity found in Cabanita maize race (19). These maize samples were obtained from the province of Caylloma (Cabanaconde district) located in the southern Andean region of Arequipa in Peru and were stored under refrigeration (2–5°C) (19). The field experiment was performed in the nursery garden Santa Maria at the Universidad Catolica de Santa Maria located in the Sachaca district (S: 16° 41′ 93.9″; W: 071° 56′ 34.0″; 2,240 meters of altitude), province of Arequipa (Arequipa, Peru).
Cabanita maize was cultivated in 20 L pots under open air and sun light exposure from 25 November 2020 to 28 June 2021. Commercial prepared soil (containing humus, field soil, and manure) was used and its physico-chemical characteristics are shown in Supplementary Table S1. The meteorological conditions during the maize plant development until sample harvest are shown in Supplementary Table S2. Groups of 6 pots were sown in three consecutive weeks (total 18 pots per maize type) and 5 Cabanita seeds were sown in each pot (sowing dates: 25 November, 2 December, and 9 December 2020). This procedure was applied to ensure the number of biological replicates (four) at three maturity stages per type of maize (white, red, orange) for the current study. The group of ears harvested from a single pot was considered a biological replicate (from 1 to 4 ears were obtained per pot). Additional supplementation with commercial fertilizers (urea and NPK + micronutrients) was performed during the vegetative period of maize plants (from week 2 to 11 after sowing) and the phytosanitary control was undertaken using conventional practices for the cultivation of maize in combination with the use of ecological insect traps. Well water was used for the irrigation which was carried out under field capacity in a similar way as in field cultivation.
During the plant reproductive stage, the female inflorescences were promptly protected with a plastic bag until the emergence of the styles (silks). The pollination was manually developed using composite pollen collected from mature tassels (male inflorescence) of plants from the same maize type. Once pollinated, each ear was protected with paper bags until physiological maturity. This procedure avoided the cross-pollination among different maize types. Ears were collected at three different grain maturity stages according to the grain physical appearance and moisture contents (25, 26). The milky stage (S1) is characterized by the starch accumulation and the observation of a milky white fluid upon finger pressure (25). In the dough stage (S2), the grain is still soft and humid, with intermediate humidity, whereas the physiological mature stage (S3) corresponds to the completion of kernel development, and a black layer is formed at the base of the kernel (25, 26). In case of the white maize type, S1 corresponded to 28 DAP and 79% moisture, S2 to 39 DAP and 68% moisture, and S3 to 75 DAP and 45% moisture. For the red type maize, S1 was at 33 DAP and 74% moisture, S2 at 36 DAP and 68% moisture, and S3 was at 77 DAP and 45% moisture. In the orange type, S1 corresponded to 32 DAP and 75% moisture, S2 to 43 DAP and 64% moisture, and S3 to 76 DAP and 46% moisture.
After harvest, ear samples were immediately stored under refrigeration (5–8°C) and transported to the laboratory. Husks were eliminated, and samples (ear and kernels) were evaluated in relation to their physical characteristics as will be described in next section. Kernels were separated, pooled per biological replicate, and frozen (−20°C). This process was developed within the 24 h after harvest. Afterwards, samples were freeze-dried in a FreeZone benchtop freeze dryer (Labconco, Kansas, MO, United States) for 60 h, at –40°C, and 0.008 mbar of vacuum pressure. Then, dried kernels were milled in a A11 Basic analytical mill (IKA, Germany) with liquid nitrogen to a powdered flour, packed in 50 ml polypropylene tubes protected from light, and stored at –20°C until analysis.
Baker yeast α-glucosidase (EC 3.2.1.20), and porcine pancreas α-amylase (EC 3.2.1.1) were from Sigma-Aldrich (St. Louis, MO, United States). Phenolic standards (gallic acid, vanillic acid, caffeic acid, ferulic acid, p-coumaric acid, cyanidin chloride, and quercetin aglycone), carotenoid standards (lutein, zeaxanthin, β-cryptoxanthin), and the Folin–Ciocalteu reagent were from Sigma-Aldrich. The (±)-6-hydroxy-2,5,7,8-tetramethyl-chromane-2-carboxilic acid (Trolox), and the 2,2-diphenyl-1-picrylhydrazyl (DPPH˙), and 2–2′-azino-bis(3ethylbenothiazoline-6-sulfonic acid) (ABTS·+) radicals were purchased from Sigma-Aldrich. Pyridine, phenyl-β-D-glucopyranoside, methoxyamine hydrochloride, N,O-bis(trimethylsilyl)trifluoroacetamide (BSTFA), and methyl undecanoate were from Sigma-Aldrich.
Relevant physical descriptors were evaluated in fresh harvested ears and kernels (per maturity stage and maize type) per replicate according to the International Board for Plant Genetic Resources (27). The weight (g), length (cm), and central diameter (cm) were measured in ears whereas the length (mm), width (mm), and thickness (mm) were determined in kernels. The kernel moisture was monitored periodically to characterize the maturity stage for harvest and was determined by a gravimetric method at 105°C (28).
The extraction of phenolic compounds from the lyophilized maize samples were performed according to Ranilla et al. (29) with some modifications. An amount of 1 g of maize sample was mixed with 4 ml of 0.1% HCl methanol/acetone/water (45, 45, 10, v/v/v) for the extraction of the free phenolic fraction. The bound phenolic compounds were released from the insoluble free-phenolic residue by alkaline hydrolysis with 3 N NaOH following same procedure as Ranilla et al. (29). Final extracts were reconstituted in milliQ water and stored at-20°C until analysis.
The procedure of Fuentes-Cardenas et al. (19) was followed. A saponification process was first applied with 80% KOH (w/v) and methanol:ethyl acetate (6, 4, v/v) solvent was used for the carotenoid extraction until a clear final extract was obtained. Carotenoids were extracted under light and oxygen protection and analyzed by ultra high-performance liquid chromatography (UHPLC) after the extraction process the same day.
Free and bound phenolic extracts were filtered using a polyvinylidene difluoride filters (PVDF, 0.22 μm) and the separation was carried out in a Kinetex C18 reverse-phase analytical column (100 × 2.1 mm i.d., 1.7 μm) with a Kinetex C18 guard column (5 × 2.1 mm i.d., 1.7 μm) (Phenomenex Inc., Torrance, CA, United States). The injection volume was 5 μl and samples were injected at 0.2 ml/min flow rate in an Ultimate 3,000 RS UHPLC system (Thermo Fisher Scientific, Waltham, MA, United States) with a diode array detector, a quaternary pump, an autosampler, and column oven. Acetonitrile and 0.1% formic acid in water were used as mobile phases and the same gradient and chromatographic parameters reported by Ranilla et al. (29) and Vargas-Yana et al. (30) were applied. Eluates were monitored from 200 to 600 nm. The Chromeleon SR4 software version 7.2 (Thermo Fisher Scientific) was used for chromatograms and data processing. The identification of phenolic compounds was based on their retention times and ultraviolet–visible spectra characteristics compared with those of the library data and external standards. Calibration curves with external standards were used for the quantification of phenolic compounds (r2 ≥ 0.9990). Hydroxybenzoic phenolic acids (HBA) (unidentified 1 and 2) were quantified at 280 nm and expressed as vanillic acid. Vanillic acid derivatives (with similar UV–VIS spectra as that of vanillic acid but with different retention times) were expressed also as vanillic acid. Hydroxycinnamic phenolic acids (HCA) including ferulic, p-coumaric, and caffeic acid derivatives were quantified at 320 nm and expressed as ferulic, p-coumaric, and caffeic acids, respectively. Flavonoids such as luteolin derivatives (with similar UV–VIS spectra as that of luteolin, but with different retention times), and anthocyanins were detected at 360 and 525 nm, and quantified using quercetin aglycone and cyanidin chloride external standards, respectively. All results were expressed as mg per 100 g DW (dried weight).
The analysis of carotenoid compounds was performed with a YMC carotenoid C30 reverse-phase analytical column (150 × 4.6 mm i.d., 3 μm) coupled to a YMC C30 guard column (10 × 4.0 mm, 3 μm) (YMC CO., LTD, Japan) using the same UHPLC system as previously described for the phenolic compound analyses. Filtered carotenoid extracts (0.22 μl, PVDF filter) were injected at 1.7 ml/min flow rate and monitored at 450 nm. A ternary gradient elution was used (methanol, dichloromethane, acetonitrile) and same reverse-phase chromatographic conditions as those reported by Fuentes-Cardenas et al. (19) were applied. The retention time and UV–VIS spectra characteristics of external carotenoid standards and the library data were used for the identification of carotenoid compounds in evaluated samples. In addition, the information of carotenoid analyses in other maize samples from reported literature was also useful for the identification of carotenoid isomers. Calibration curves made with external standards were used for the quantification of carotenoids (r2 ≥ 0.9900) and results were presented as μg per g sample DW. Lutein and zeaxanthin compounds and their isomers were quantified as lutein and zeaxanthin, respectively. Unidentified carotenoid compounds, neoxanthin, and violaxanthin isomers were expressed as lutein. β-cryptoxanthin isomers were expressed as β-cryptoxanthin.
The TPC in the free and bound phenolic extracts were evaluated according to Singleton and Rossi (31) using the Folin–Ciocalteu method. Results were presented as mg of gallic acid equivalents (GAE) per 100 g DW.
The analysis was adapted from Uarrota et al. (32). The fatty acid methyl ester synthesis (FAME) was obtained by combining ~55 mg of lyophilized maize sample with 70 μl 10 N KOH (prepared in HPLC water) and 530 μl of HPLC grade methanol in a reaction tube. The mix was incubated in a water bath at 55–60°C for 1.5 h with periodic agitation every 30 min. Tubes were then cooled down to room temperature and drops of fuming H2SO4 (24 N) were carefully added. An incubation step was repeated as previously described. Samples were cooled, then 500 μl of hexane and 10 μl of internal standard (methyl undecanoate, 26.16 mg/ml) were added. The tubes were vortexed for 2 min and centrifuged at 17,000 g for 10 min at 4°C. The upper layer was transferred to a vial with an insert and 1 μl was injected in an Agilent 7890B gas chromatography system coupled to a flame ionization detector (FID) (Agilent Technologies, Santa Clara, CA, United States). A 2560 capillary gas-chromatography (GC) column (100 m × 250 μm × 0.2 μm) (Supelco, Bellefonte, PA, United States). The injector temperature was set at 220°C, the FID detector at 225°C, air flow (400 ml/min), hydrogen flow (35 ml/min), helium flow (1.6 ml/min), using an injection with a split ratio of 50:1. The chromatographic run was set up at 80°C (initial temperature) and increased to 225°C with a heating ramp at a rate of 25°C per min, and held for 25 min. The retention times of detected peaks from samples were compared with those of external standards for fatty acid identification. Calibration curves (r2 ≥ 0.9900) with palmitic, stearic, oleic, linoleic, and α-linolenic acids were used for the quantification of fatty acids in maize samples and results are presented as mg per g sample DW.
The extraction of polar metabolites from maize samples, the derivatization process, and the instrumental parameters for the gas chromatography mass spectrometry (GC–MS) analysis were the same as reported by Fuentealba et al. (33). An Agilent 7890B gas chromatography system equipped with a 5977A single quadrupole MS, a PAL3 autosampler, an electron impact ionization source was used (Agilent Technologies). A HP-5 ms Ultra Inert column (30 m × 0.25 mm × 0.25 μm) (Agilent) was used for the separation of polar compounds. The Mass Hunter Quantitative software (Agilent Technologies) was used for the deconvolution and data processing. For peak identification, their retention times and mass spectra were compared with data from NIST14 and a home library (obtained with commercial standards). Results are shown as the relative response of each compound calculated considering their respective sample weight, an internal standard (phenyl-β-D-glucopyranoside), and a quality control (QC) composite sample from all maize samples (33).
The soluble hydrophilic and lipophilic fractions from lyophilized maize samples were considered for the in vitro assays. The hydrophilic and lipophilic fractions were extracted with 80% methanol and dichloromethane; respectively, following same extraction parameters described by Fuentes-Cardenas et al. (19).
The method of Duarte-Almeida et al. (34) adapted to a microplate reader (Biotek Synergy HTX, Agilent Technologies) with modifications reported by Fuentes-Cardenas et al. (19) was applied. Results are shown as μmol Trolox equivalents per 100 g DW using Trolox calibration curves prepared in methanol (20–160 μM), and dichloromethane (10–120 μM) for the hydrophilic and lipophilic fractions, respectively.
The hydrophilic and lipophilic extracts were evaluated according to Fuentealba et al. (35) using a Biotek Synergy HTX microplate reader (Agilent Technologies). Results were expressed as μmol Trolox equivalents per 100 g DW based on calibration curves built with Trolox standard in methanol and dichloromethane for the evaluation of hydrophilic and lipophilic fractions, respectively. The Trolox concentration ranges used in calibration curves were the same as those shown for the DPPH method.
The hydrophilic and lipophilic fractions used for the determination of the α-amylase inhibitory activity were obtained similarly as Fuentes-Cardenas et al. (19) but using a different sample and solvent ratio for the extraction (0.5 g sample in 12.5 ml 80% methanol). Final extracts (hydrophilic and lipophilic) were vacuum-evaporated to dryness at 45°C and reconstituted in 2 ml 0.02 M NaPO4 buffer (pH 6.9) (35). In case of the α-glucosidase inhibition analysis, same extraction conditions were assayed as Fuentes-Cardenas et al. (19), and final hydrophilic and lipophilic extracts were also vacuum-evaporated to dryness but resuspended in 1 ml of 0.1 M KPO4 buffer (pH 6.9) (35). The inhibitory activity against α-amylase and α-glucosidase enzymes were determined with the same methodology reported by Gonzalez-Muñoz et al. (36). The percentage (%) of inhibition at different sample amounts was reported.
Results (from four independent biological replicates) were expressed as means ± standard deviation. A two-way analysis of variance (ANOVA) with the LSD test were carried out to determine significant differences between the means (p < 0.05) using the software Infostat1 (accessed from October to November, 2022). Pearson correlations among all data were explored using the Statgraphics Centurion XVI software (StatPoint Inc., Rockville, MD, United States). All data (from the targeted and untargeted metabolite analyses, the physical characteristics, and the functionality assays) were evaluated through the multivariate principal component analysis (PCA) using the Metaboanalyst software version 5.02 (accessed on 2 October, 2022). For the PCA, data were first mean-centered and divided by the standard deviation of each variable. Afterward, an ANOVA with the Tukey’s HSD post hoc analysis (p < 0.01) was carried out to identify significant variables. The heat map or cluster analysis was performed using the Euclidean distance and the Ward algorithm in Metaboanalyst with the top significant metabolites or variables (p < 0.01).
The maturity stages of Cabanita maize characterized by the DAP and moisture levels were similar among evaluated maize types. However, their vegetative periods (from the plant emergence stage to the end of the tasseling time) were somewhat different (26). This period occurred at around 9, 10, and 11 weeks after the sowing stage in case of the orange, white, and red maize types, respectively. Consequently, the start of the reproductive period (emergence of the silk or the female inflorescence) was earlier in the orange maize type (13 weeks after sowing), followed by the white (15 weeks after sowing), and the red maize (16 weeks after sowing). This may be important for the adequate planning of maize cultivation periods since Andean farmers traditionally sow maize mixing different Cabanita types in the same land.
The physical changes of ears and kernels from the three types of Cabanita maize along the maturity stages are shown in Figures 1–3. The development of all maize types was characterized by changes in the pericarp color. The white maize type varied from light-white to white-yellow at S3 which may be related to the accumulation of dry matter with maturity (Figure 1) (37). In case of the red type, the pigmentation appeared in the S2 stage as a small spot at the stigma-end of the kernel that then extended toward almost the half of the grain at S3 (Figure 2). Hong et al. (38) observed a similar trend in a purple-pericarp sweet corn; however, the purple pigment fully spread until the base of the kernel at the highest maturity phase (32 DAP). The orange maize varied from light-yellow at S1 to orange at S3 and this pigmentation only reached the middle of the kernels similarly as in the red case.
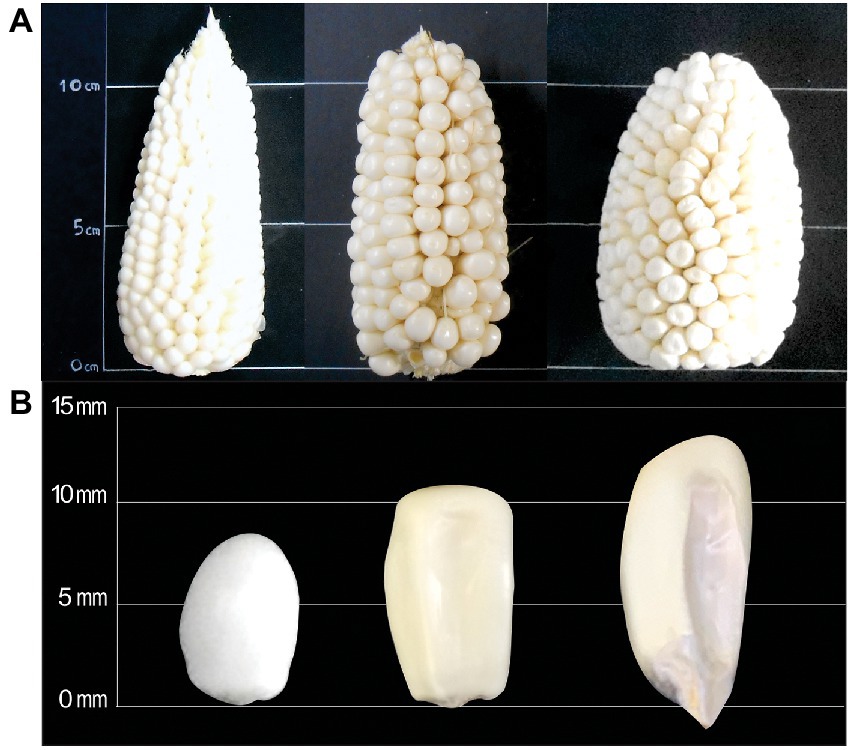
Figure 1. Changes of ear (A) and kernel (B) physical characteristics of white Cabanita maize at different maturity stages (S1, S2, S3, from left to right).
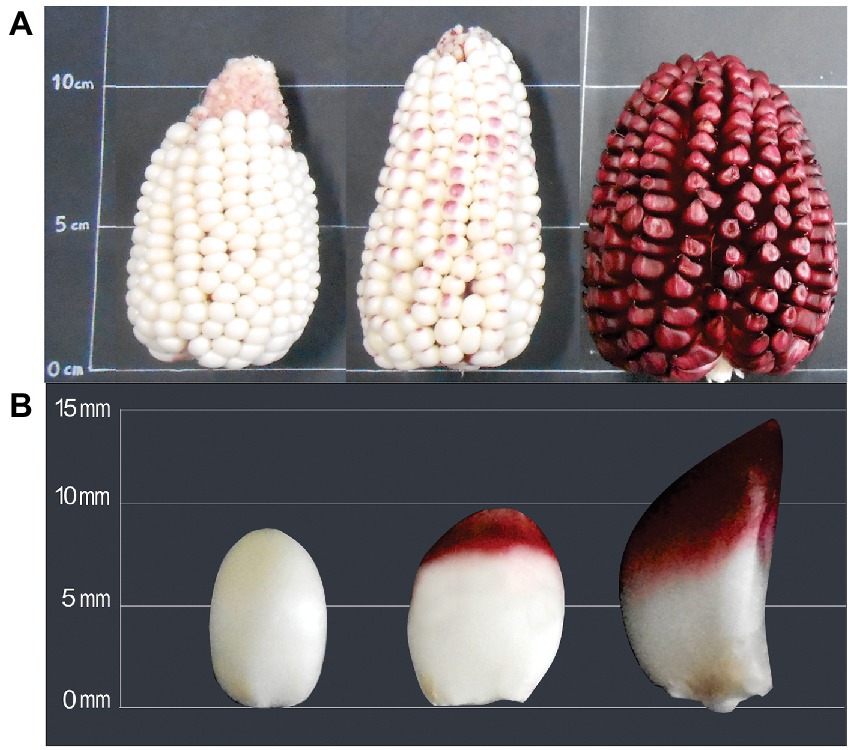
Figure 2. Changes of ear (A) and kernel (B) physical characteristics of red Cabanita maize at different maturity stages (S1, S2, S3, from left to right).
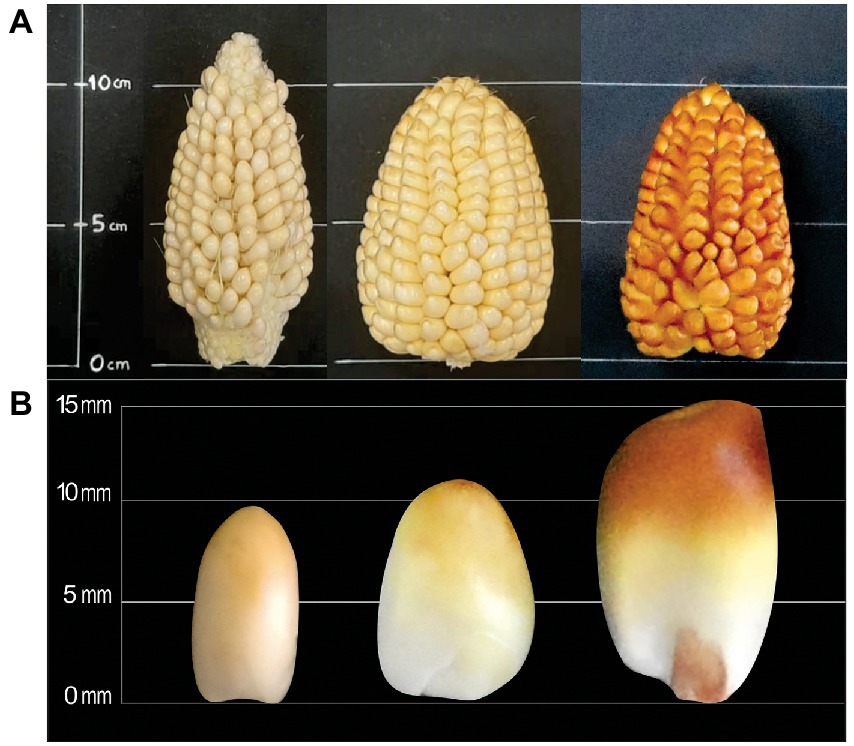
Figure 3. Changes of ear (A) and kernel (B) physical characteristics of orange Cabanita maize at different maturity stages (S1, S2, S3, from left to right).
Table 1 shows the physical characteristics evaluated in kernels sampled at different developmental stages. No significant interaction between the maize type (M) and the maturity stage (S) factors was found in any of the measured physical parameters. The variation of the ear weight and diameter, and the kernel width along the maturation period was similar in all maize types. Nevertheless, the ear length, kernel length, and thickness were influenced by the maize type. The ear length was higher in the white and red maize than in the orange type, but this latter showed higher kernel length ranges than the former. The maturity stage factor (S) was significant in all the physical characteristics except the ear length which remained almost similar during the maturation. The ear weight, and diameter along with the kernel length, width, and thickness increased with maturation. Overall, the yield-relevant physical parameter (ear weight) was similar among all maize classes; however, some morphological differences have been observed among the kernel types (Figures 1–3). Fuentes-Cardenas et al. (19) also studied the Peruvian maize race Cabanita and reported no differences in the quantitative physical characteristics between the CAW (white), CCR (red), and COM (orange) maize samples (which are the parental seeds of the white, red, and orange maize types evaluated in the current study). However, mature, and dried ears and kernels were evaluated in such study.
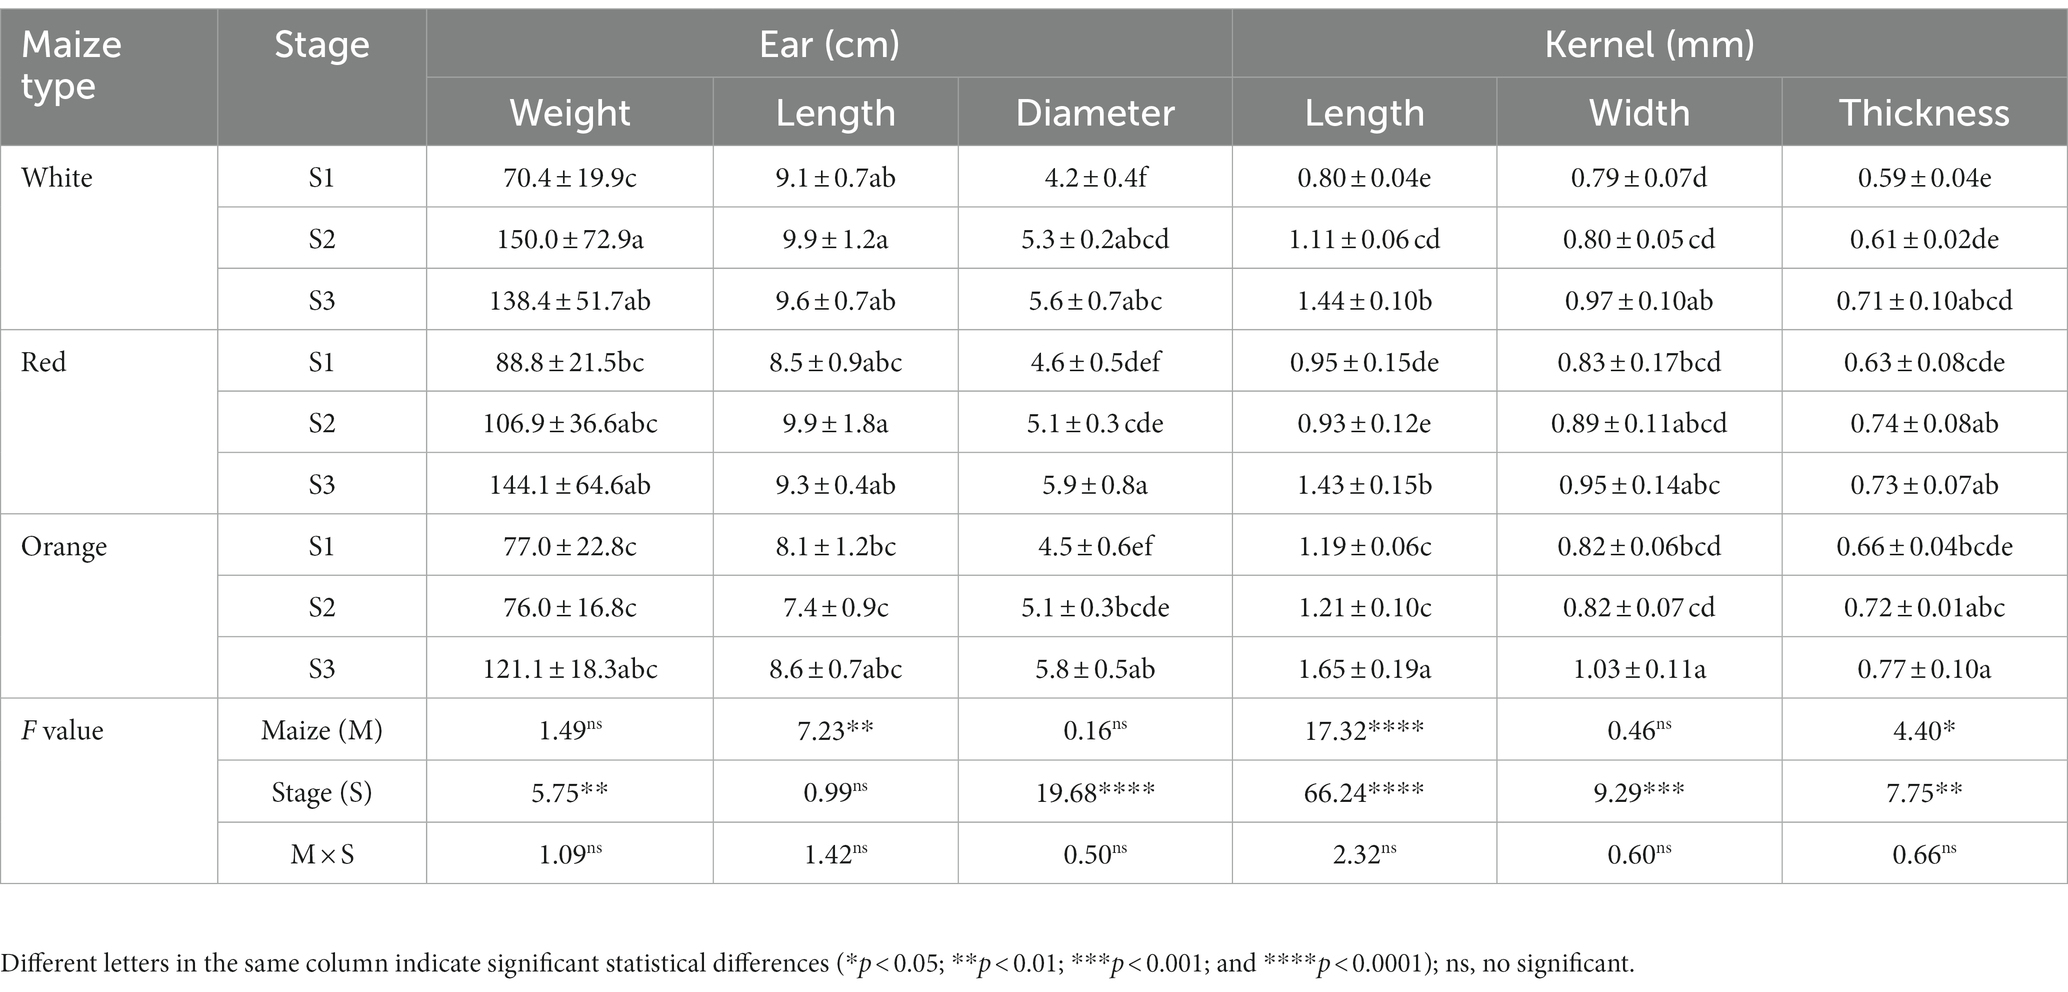
Table 1. Physical characteristics of Cabanita maize kernels at different pigmentations and maturity stages.
The phenolic profiles and contents determined in the free and bound phenolic fractions of Cabanita maize samples are shown in Table 2. In case of the free phenolic fraction, all maize samples contained phenolic acids such as hydroxybenzoic (HBA) and hydroxycinnamic acids (HCA), but specific flavonoid types such as anthocyanin and luteolin derivatives were detected only in red and orange maize types, respectively.
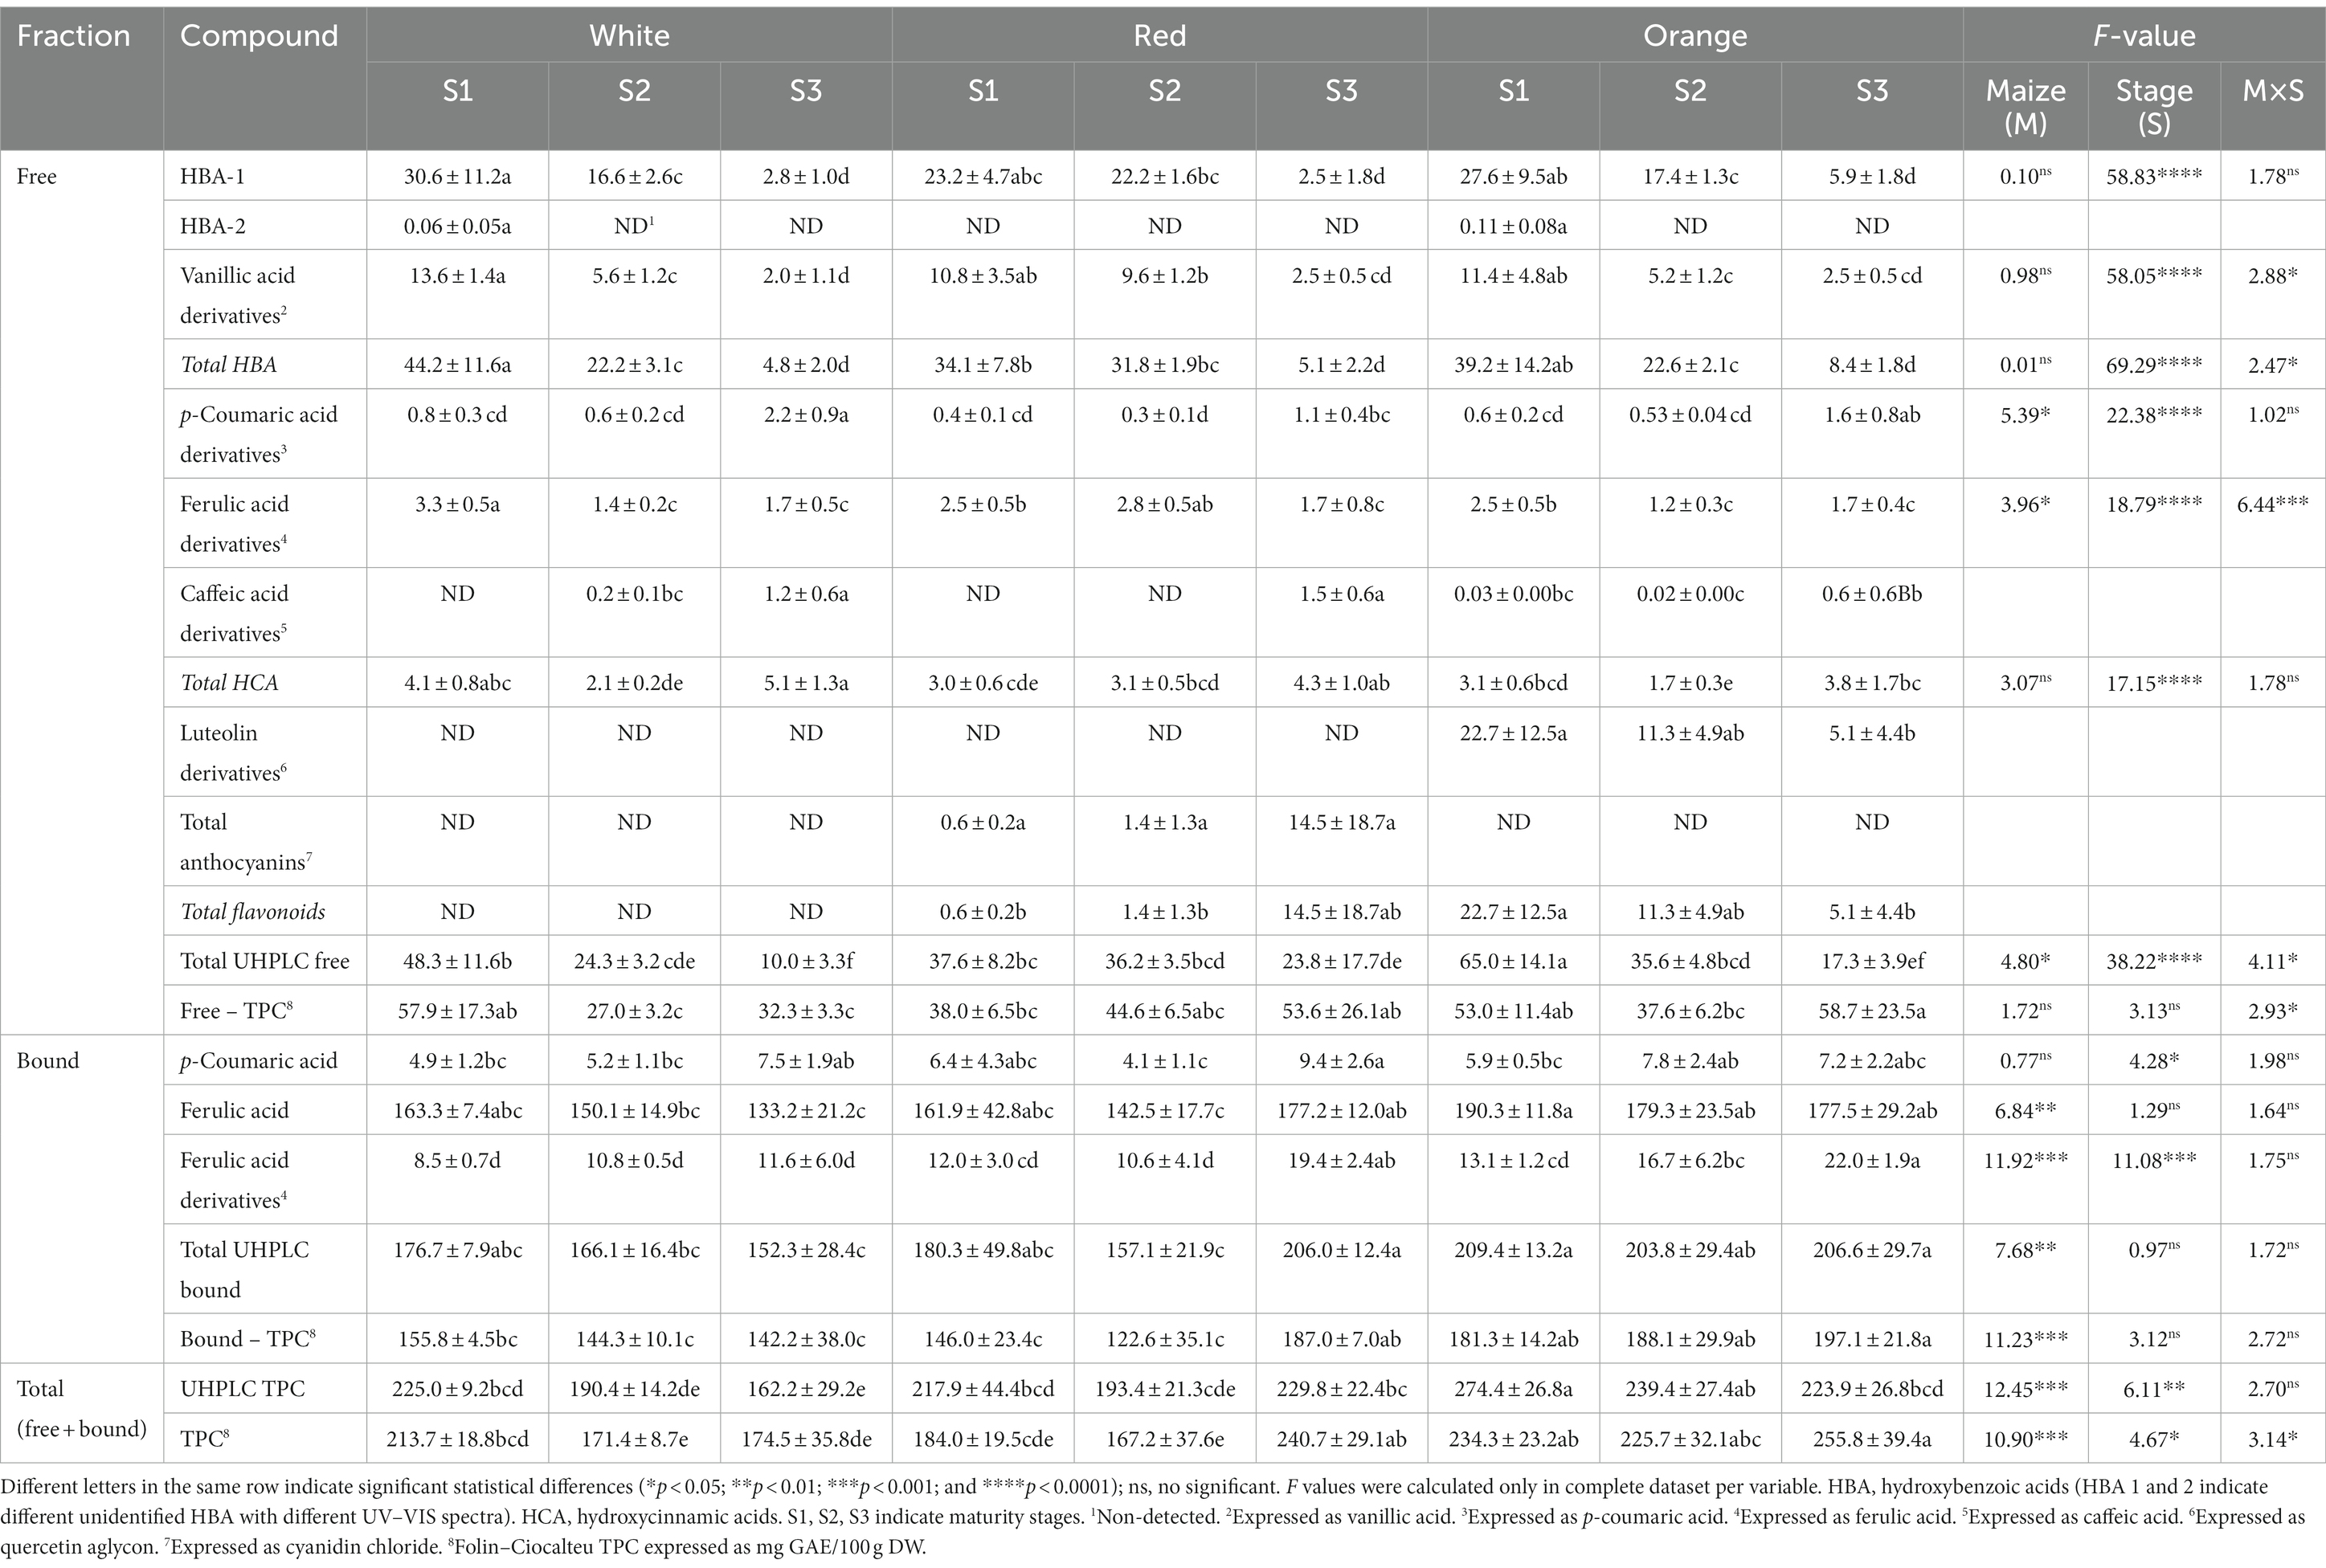
Table 2. Phenolic profiles and contents by UHPLC (mg/100 g DW) in Cabanita maize kernels of different pigmentations and maturity stages.
For the HBA group, the contents were more influenced by the maturity stage (S) than by the maize type (M). The interaction of both factors (M × S) was significant on the vanillic acid derivatives and the total HBA contents. The highest total HBA contents were observed at stage S1, and white and orange maize had higher levels than red maize (44.2, 39.2, and 34.1 mg/100 g DW, for the white, orange, and red maize, respectively). With the kernel maturation, the total HBA concentrations decreased around 80–90% in all cases (from S1 to S3). At least 3 classes of HBA have been detected in all Cabanita samples (Supplementary Figures S1–S3). Major HBA at S1 was HBA-1 (λmax = 279 nm), followed by vanillic acid derivatives (λmax = 249, 289 nm). Contents of both HBA then decreased with maturity to reach similar concentrations at S3. A minor HBA compound (HBA-2) was only found at S1 in white and orange maize types. Giordano et al. (39) reported that the free vanillic acid levels found in open-pollinated maize varieties from Italy with variable kernel pigmentations decreased from 1.8–15 to 0–0.08 mg/100 g DW when maturation stages varied from 5 to 76 DAS, respectively. Similarly, the contents of vanillic and protocatechuic acids significantly decreased or disappeared with the grain development of waxy maize from 86–109 to 110–138 DAS (37). Besides vanillic acid, syringic and p-hydroxybenzoic acids have been also reported in maize (40, 41). Total free HBA ranges from current study (4.8–44.2 mg/100 g DW) were comparable to levels found in US yellow and Indian specialty maize kernels (~33.7 and 2.7–38 mg/100 g DW, respectively) (40, 41). Other cereals such as barley, wheat, and oat have shown lower free HBA concentrations (~15.5, 12.5, and 4.6 mg/100 g, respectively) (40).
A variable trend was observed in case of the HCA group (Table 2 and Supplementary Figures S4–S6). All Cabanita maize types contained p-coumaric, and ferulic acid derivatives whereas caffeic acid derivatives were detected at some maturity stages. These HCA derivatives may be soluble conjugated phenolic acids such as hydroxycinnamic acid amides (HCAAs) as was previously reported in different cereals (42, 43). Several HCAAs derived mostly from p-coumaric, ferulic and caffeic acids (N,N-di-p-coumaroylspermine, N-p-coumaroyl-N-feruloylputrescine, caffeoylputrescine) have been previously reported in the free phenolic fraction of maize from different origins (44, 45). Hence, further studies are necessary to better identify the HCA derivatives found in current research. The maturity (S) and maize type (M) showed an important effect on p-coumaric and ferulic acid derivatives, but the interaction of both factors was significant only on the ferulic acid derivatives contents. p-Coumaric acid and caffeic acid derivatives increased with kernel development. The increase of p-coumaric acid derivatives levels from S1 to S3 was on average 2.6-fold, and white and orange maize types exhibited higher ranges than the red maize (0.8–2.2, 0.6–1.6, and 0.4–1.1 mg/100 g DW for white, orange, and red maize, respectively). Conversely, the concentrations of ferulic acid derivatives declined by 32–48% from S1 to S3 in all maize groups. Different studies have shown variable tendencies of the HCA compounds with kernel maturity. The free ferulic and chlorogenic acid contents reduced with kernel maturation in several Italian maize varieties, and the same trend was observed in Chinese waxy pigmented maize samples with ferulic and p-coumaric acids (37, 39). Recently, Hu et al. (46) observed an overall increment of ferulic and p-coumaric acids during kernel maturation of sweet maize from China, whereas chlorogenic acid declined (from 15 to 30 DAP) after an initial increase (from 10 to 15 DAP). In the current study, the total HCA contents first decreased from S1 to S2 in white and orange maize types, then increased at S3 in all cases. The origin, maize type (genetic factors), and the harvesting time may explain differences found in this study.
Anthocyanins were present only in red maize, showing an increase from 0.6 mg/100 g DW at S1 to 14.5 mg/100 g DW by the end of kernel maturity. Other flavonoids such as luteolin derivatives were specific for orange maize samples and significantly decreased by 80% from S1 to S3 (from 22.7 to 5.1 mg/100 g DW). No flavonoids were detected in white Cabanita. Hong et al. (38) observed a continuous anthocyanin accumulation from 105 mg/100 g DW at 20 DAP to 179 mg/100 g DW at 36 DAP in purple-pericarp “supersweet” sweet maize. The increase of the total monomeric anthocyanin contents with kernel ripening has been also confirmed by different studies (21, 37, 47). The flavone luteolin has been reported in Indian Himalayan pigmented maize accessions and some Chinese maize hybrids (48, 49). In addition, a C-glycosylflavone known as maysin (a luteolin derivative) has also been found in mature maize seeds (49). The luteolin derivatives found in the current study (λmax = 256, 270, 349 nm) may be maysin or similar compounds that should be confirmed in future studies. However, higher concentrations of these flavones were found in the orange Cabanita maize at all maturity stages compared to levels obtained by Zhang et al. (49) (1.13 ng/g DW of maysin in mature seeds). C-glycosylflavones have shown potential neuroprotective properties relevant for Alzheimer’s disease prevention (50, 51).
The total free phenolic fraction decreased from S1 to S3, and its composition was variable depending on the kernel stage and maize type. HBA were the most important compounds in white and red maize at S1 and S2. In case of the orange group, HBA and luteolin derivatives highly contributed to the total free phenolic fraction at S1 and S2. This maize showed the highest total free phenolic contents at S1 among all samples (65 mg/100 g DW). The red maize was rich in HBA at S1, and S2 whereas anthocyanins were the major contributors to the free phenolic fraction at S3.
Major compound in the bound phenolic fraction was ferulic acid, followed by ferulic acid derivatives, and p-coumaric acid (Supplementary Figures S7–S9). The M × S interaction was not significant for any of the bound phenolic compounds; however, the maize type showed an important effect on the ferulic acid, ferulic acid derivatives, and the total bound UHPLC phenolic contents (Table 2). Orange and red maize types had higher ranges of ferulic acid (177.5–190.3 mg/100 g DW, 142.5–177.0 mg/100 g DW, and 133.2–163.3 mg/100 g DW, for the orange, red, and white maize, respectively), and ferulic acid derivatives than the white group (13.1–22.0 mg/100 g DW, 10.6–19.4 mg/100 g DW, and 8.5–11.6 mg/100 g DW, for the orange, red, and white maize, respectively). Consequently, higher total bound phenolic levels determined by UHPLC were found in orange and red maize, specially at S3 than in the white type. Kernel maturity highly influenced the p-coumaric acid and ferulic acid derivatives contents. Both compounds showed an increase of around 1.2–1.7-fold from S1 to S3. Ferulic acid remained almost stable from S1 to S3 in white and orange maize samples, and a similar trend was observed in their total UHPLC bound phenolic contents. In case of the red maize, ferulic acid and the total bound phenolic compounds first decreased from S1 to S2, to further increase at S3. Similar results as those obtained for white and orange Cabanita maize have been reported by Zhang et al. (22) in yellow maize. In that study, the total bound phenolic contents were stable with kernel maturation from 15 to 48 DAP (22). Nonetheless, the levels of bound ferulic and p-coumaric acids significantly reduced with kernel development (from 5 to 76 DAS) in several Italian maize samples whereas in other research same bound HCA showed a variable tendency depending on the genotype (39, 46).
On the whole, these results suggest differences in the metabolism of phenolic compounds during kernel development among the three types of Cabanita maize. A possible metabolic flux of precursors of hydroxybenzoic acids such as some intermediates of the shikimate or the phenylpropanoid pathways toward the biosynthesis of HCA derivatives may occur in case of the white and orange grains (52). HCA may be used as precursors for the biosynthesis of anthocyanins in case of the red maize. Enzymes involved in the biosynthesis of cell wall-relevant phenolic compounds may have been upregulated toward the flavone pathway in the orange maize explaining its overall higher ranges of bound phenolic compounds through the kernel growing process (53, 54).
Ultra high-performance liquid chromatography total phenolic contents (free+bound) declined with kernel maturity in white and orange grains whereas in red maize the contents first decreased from S1 to S2, and then increased at S3. Concentrations at the physiological maturity stage were higher in the case of the orange and red maize type (223.9 and 229.8 mg/100 g DW, for the orange and red maize, respectively) than results obtained by Fuentes-Cardenas et al. (19) in Cabanita race (134.3 and 190.9 mg/100 g DW, for the orange and red maize, respectively). However, above authors reported higher total phenolic contents in the white maize type (206 mg/100 g DW) than in the current research (162.2 mg/100 g DW). Differences in the postharvest treatments and the agroecological conditions for the growth of Cabanita maize may explain such variations. Generally, phenolic contents measured with the Folin–Ciocalteu method showed the same trend as those analyzed with the UHPLC method. However, the lack of specificity of the Folin–Ciocalteu method may be associated with differences observed specially in results from the free phenolic fraction (55).
Cabanita maize types at different maturity stages were also evaluated in terms of their carotenoid composition (Table 3, Supplementary Figures S10–S12). In contrast to the variable effect of studied factors (M and S) on phenolic compounds, carotenoid contents were highly influenced by the maize type. Only xanthophylls were found in all Cabanita samples while no carotenes were detected. Moreover, different profiles were observed among studied Cabanita maize groups. White and red maize had similar profiles and all-trans-neoxanthin, neoxanthin isomer (~13-cis-neoxanthin), all-trans-zeaxanthin, and a lutein isomer (~13-cis-lutein) were the major carotenoids. All-trans-lutein and all-trans-zeaxanthin were the main compounds in the orange maize, followed by ~13-cis-lutein, and neoxanthin compounds. β-cryptoxanthin isomers along with some unidentified carotenoids (2, 3) were only detected in this maize type. The concentrations of all mentioned carotenoids in orange maize were higher than values found in white and red types. A violaxanthin isomer (~9-cis-violaxanthin) was detected in white and orange maize at all maturity stages, and only at S3 in the red grain. These xanthophylls diversity may be based on the fact that β-cryptoxanthin is the metabolic precursor of zeaxanthin which is further metabolized to violaxanthin and then to neoxanthin (56). Several studies have confirmed that predominant carotenoid compounds in maize are generally lutein, zeaxanthin, β-cryptoxanthin along with other minor xanthophylls such as zeinoxanthin, antheraxanthin, violaxanthin, neoxanthin, and their isomers (23, 57–59). However, carotene compounds such as α-carotene and β-carotene have been also reported in comparable concentrations in yellow maize varieties (44, 60). Liu et al. (23) reported that two genotypes of Chinese sweet maize showed variable carotenoid profiles and contents during the grain maturation from 10 to 30 DAP. This indicates an important influence of genetic factors and the kernel maturity stage (61).
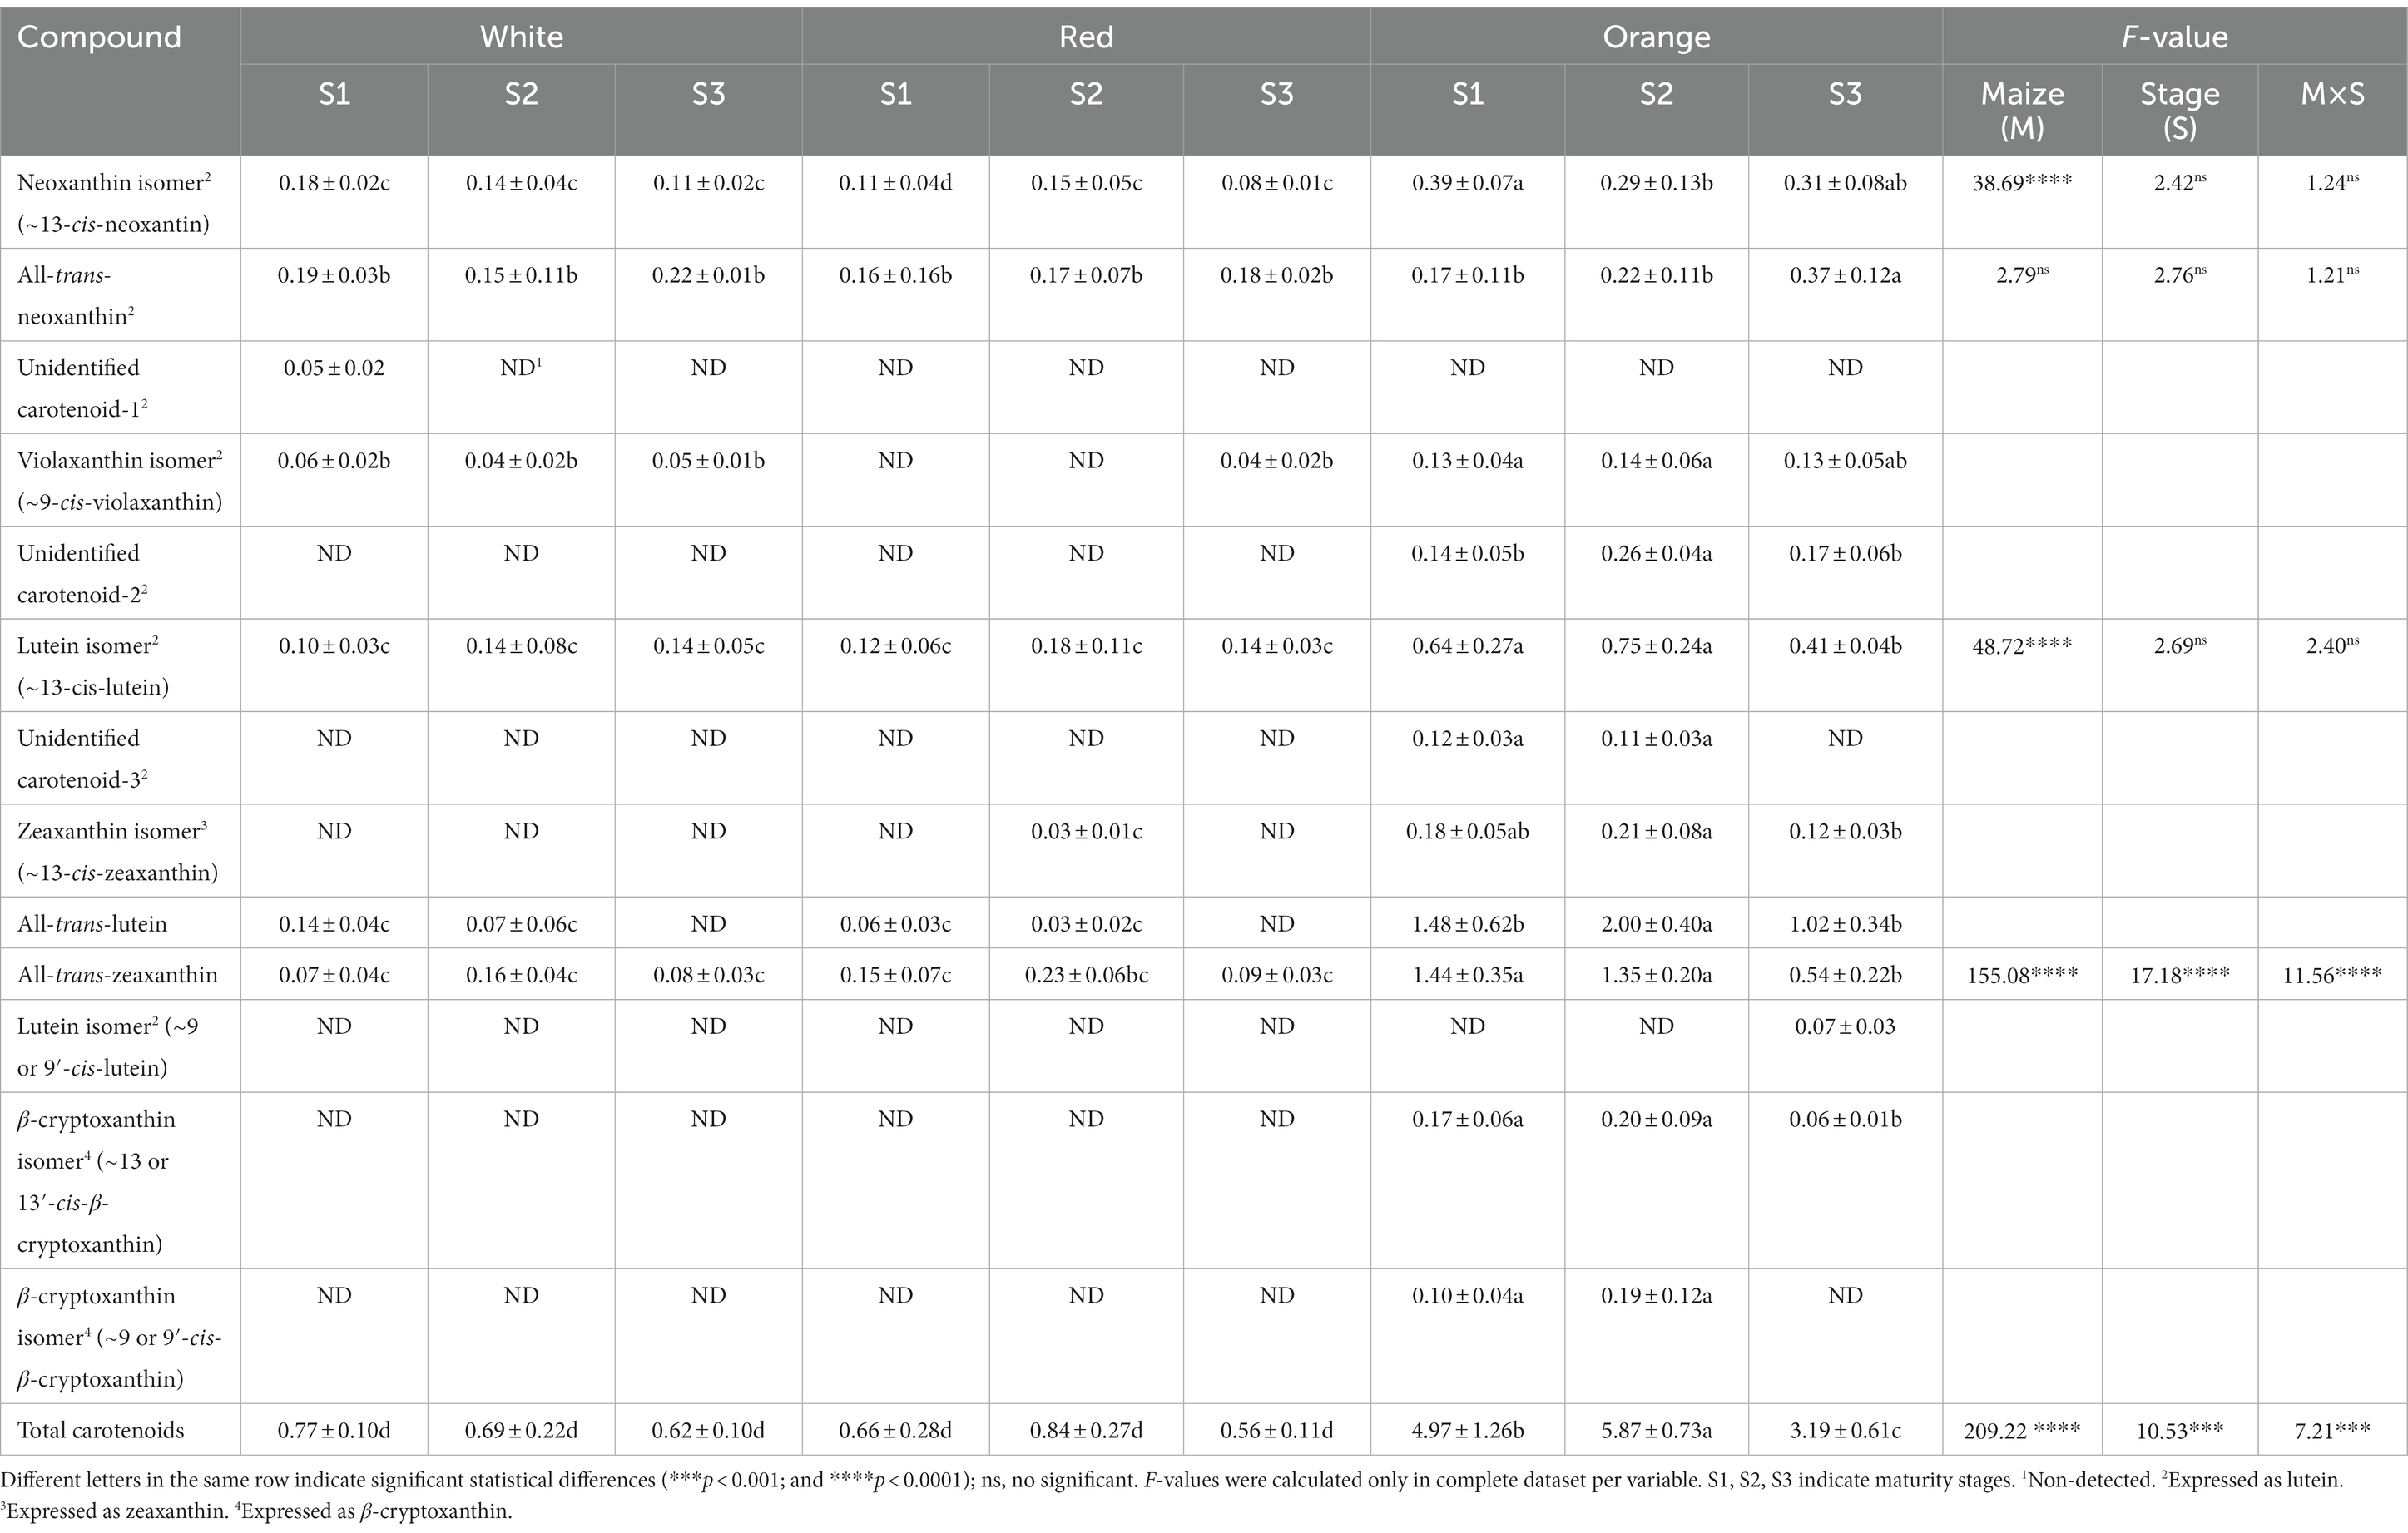
Table 3. Carotenoid profiles and contents (μg/g DW) determined by UHPLC in Cabanita maize kernels of different pigmentations and maturity stages.
The maturity stage and the interaction of both factors (M × S) significantly influenced the all-trans-zeaxanthin, and the total carotenoid contents. Neoxanthin isomer, all-trans-neoxanthin, violaxanthin isomer, and ~13-cis-lutein did not show significant changes with kernel development in white and red maize types, but all-trans-lutein was not detected at S3. Overall, both maize types showed similar total carotenoid concentrations which were somewhat stable along the kernel growth (ranges of 0.77–0.62 μg/g DW and 0.84–0.56 μg/g DW, for the white and red maize, respectively). In the orange Cabanita, all-trans-lutein increased by ~35% from S1 to S2 (1.48 and 2.0 μg/g DW at S1 and S2, respectively), but then decreased by 50% at S3 (1.02 μg/g DW). All-trans-zeaxanthin remained almost constant from S1 to S2 (1.44 and 1.35 μg/g DW, respectively). However, it declined by 60% at S3 (0.54 μg/g DW). Similar carotenoid reductions at S3 were observed in case of the 13-cis-lutein, 13-cis-zeaxanthin, β-cryptoxanthin isomers, and the other unidentified compounds. All-trans-neoxanthin and its isomers showed a certain increase at S3 which indicates the downstream metabolic conversion of β-cryptoxanthin, and zeaxanthin (56). The contents of lutein, zeaxanthin, α-cryptoxanthin, and β-cryptoxanthin have shown to steadily increase with kernel development from 10 to 30 DAP in sweet corn (23). The increase of zeaxanthin and lutein with kernel maturation from 16 to 24 DAP has been also reported in other sweet maize hybrids (62). Variable zeaxanthin and lutein patterns were observed in some zeaxanthin-biofortified sweet maize depending on the genotype and the kernel position on the cob (61). However, an overall lutein and zeaxanthin accumulation was reported in same study (61). In the current research, higher maturity stages were evaluated (from 28–32 to 75–77 DAP) which likely explains contrasting results compared with previous studies. Xu et al. (24) evaluated a yellow maize variety during maturation from 74 to 116 DAS and found that the contents of zeaxanthin decreased at the end of kernel maturity, whereas lutein increased from 74 to 98 DAS to finally decrease at 116 DAS.
The orange maize exhibited higher total carotenoid contents (3.19–5.87 μg/g DW) than white and red maize (0.77–0.62 μg/g DW and 0.84–0.56 μg/g DW, for the white and red maize, respectively). Nevertheless, carotenoids significantly decreased by ~50% at S3 (from 5.87 to 3.19, at S2 and S3, respectively). Fuentes-Cardenas et al. (19) found lower total carotenoid values in the orange Cabanita maize type at physiological maturity (1.95 μg/g DW, COM code) than in the present study. In addition, no carotenoids were detected in the corresponding red and white parental seeds (CCR, CAW) (19). Carotenoids are highly sensitive to light, heat, and oxygen, therefore postharvest practices applied by Andean farmers such as the sun-drying of Cabanita ears first in the plant and later on the field for undetermined time may lead to the degradation of carotenoid compounds.
Higher total carotenoid amounts than those from current research have been reported mostly in yellow and sweet maize varieties. Xu et al. (24) found concentrations of 22.78–28.76 μg/g DW at different maturity stages in yellow maize. Ranges of 0.55–43.23 μg/g DW and 11.4–24.0 μg/g DW have been shown in sweet maize harvested at maturity stages from 10 to 32 DAP (23, 63). Floury maize types generally show lower carotenoid contents than hard maize classes such as pop, dent, or flint (64). Therefore, it is expected to find lower carotenoid levels in the amylaceous floury Cabanita maize (19).
The fatty acid composition of Cabanita maize is shown in Table 4. No significant effect was found by the maize type indicating similar fatty acid profiles and contents among all samples. Polyunsaturated fatty acids (PUFA) including linoleic and α-linolenic acids represented the major fatty acid fraction in all Cabanita maize types (55–59% of the total fatty acid content). The monounsaturated oleic acid contributed with 21–28% of the total fatty acids, followed by saturated acids (palmitic and stearic acids, 18–21%). Among all detected fatty acids, linoleic and oleic acids were the most abundant compounds in maize kernels (50–54%, and 21–28% for linoleic and oleic acids, respectively).
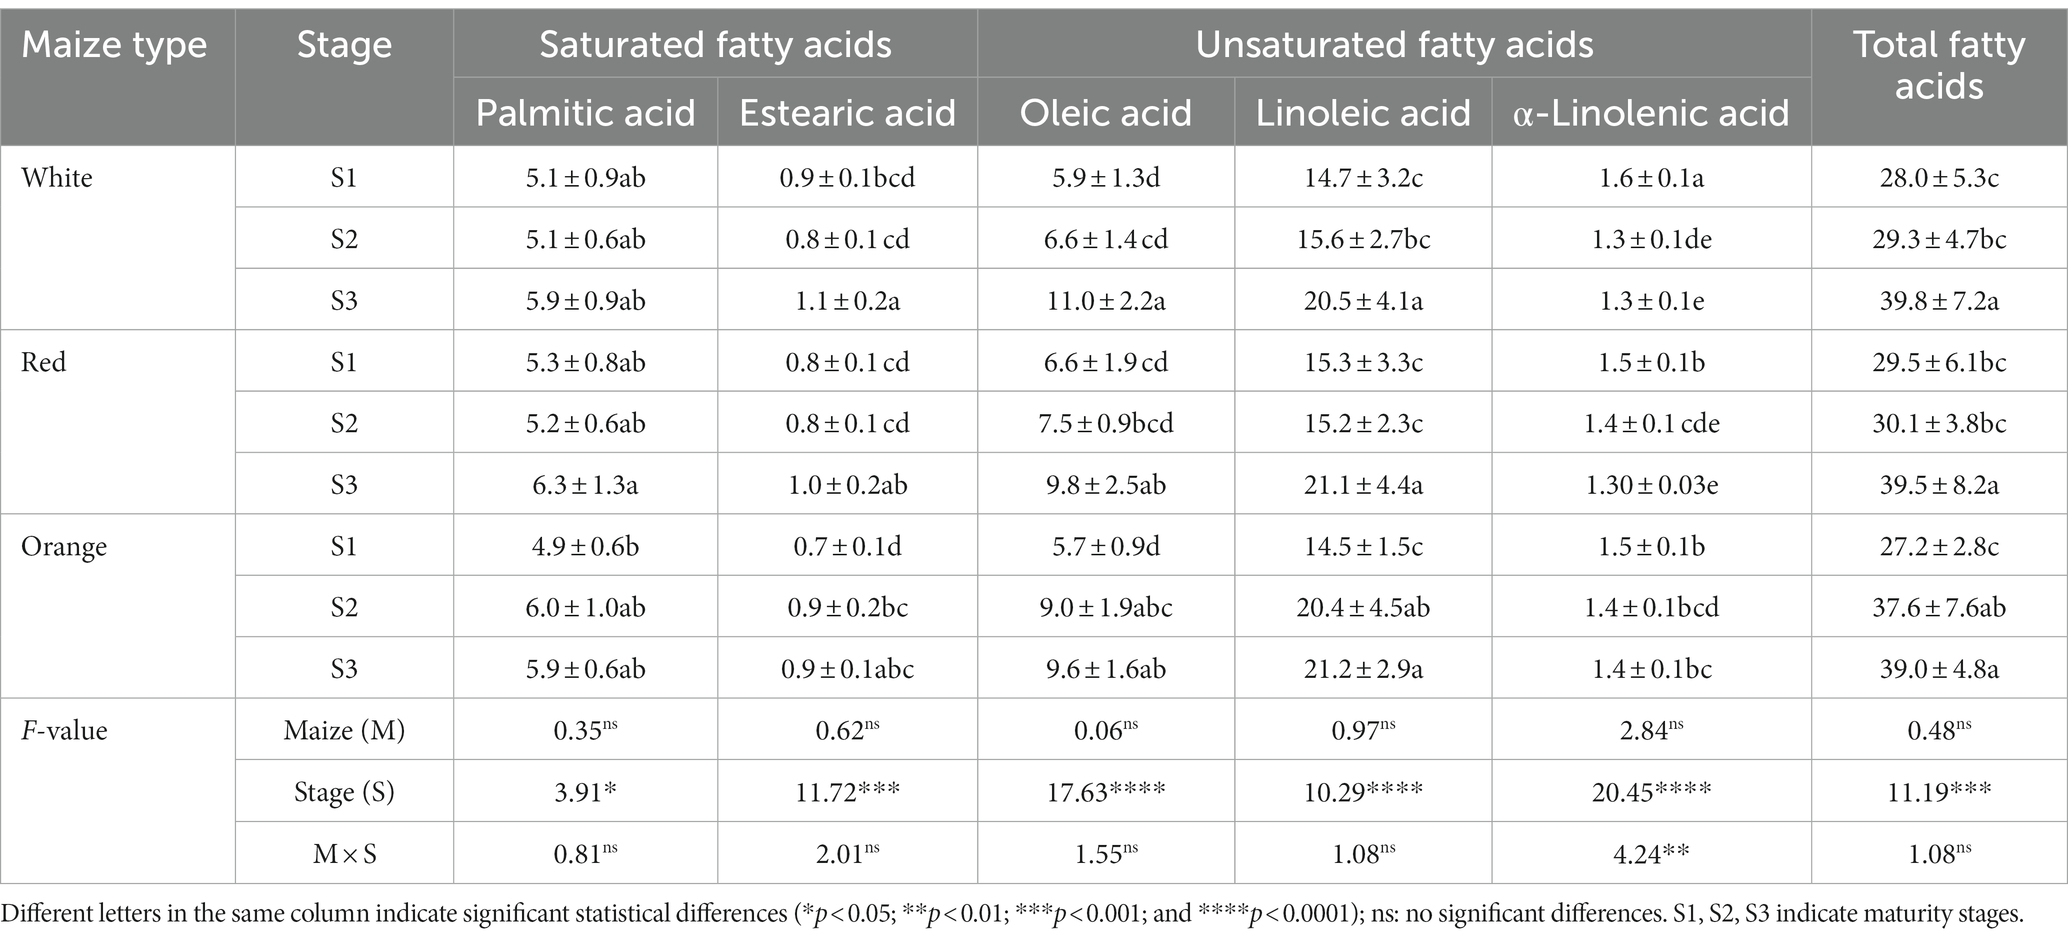
Table 4. Contents and profiles of fatty acids (mg/g DW) in Cabanita maize kernels of different pigmentations and maturity stages.
Comparable percentages of linoleic acid have been also reported in Mexican subtropical maize populations (41–51%), sweet maize from the United States (50–63%), and maize varieties from Turkey (50–53%) (65–67). In the case of other Peruvian germplasm, similar fatty acids profiles and concentrations were observed in mature native varieties such as Chullpi, Piscorunto, Giant Cuzco, Sacsa, and purple, with ranges of 18.3–25.2 mg/g DW and 9.8–14.6 mg/g DW for linoleic and oleic acids, respectively (68). However, α-linolenic acid concentrations were almost 2 to 3.5-fold higher in Cabanita samples (1.3–1.4 mg/g DW, at S3 maturity stage) than in the other Peruvian varieties (0.4–0.7 mg/g DW) (68). Lower α-linolenic acid percentages have been also reported in sweet maize (1.7–2.1%) compared with Cabanita maize (3.2–3.7%) (66). Furthermore, this fatty acid was not even detected in several Korean maize hybrids (69). The increase of α-linolenic acid from 0.61 to 4.93% along with the oil contents have been obtained after a long-term breeding process of Mexican maize (65). The contribution of this fatty acid in relation to the total fatty acid content was higher at early maturity stages in Cabanita samples (5.1–5.8%).
Linoleic (ω-6) and α-linolenic acids (ω-3) are essential fatty acids that cannot be synthesized by humans (70). After the ingestion, α-linolenic acid is transformed into long-chain ω-3 PUFAs such as docosahexaenoic and eicosapentaenoic acids which play important roles within the organism (71). Dietary α-linolenic acid, and its ω-3 metabolic derivatives have been reported to show antioxidant and anti-inflammatory properties with potential for the prevention of brain malfunction, and cardiovascular disease (72–74). Moreover, diets with ω-6:ω-3 ratios close to 1:1 have been associated with less incidence of chronic diseases including diabetes and cardiovascular diseases (70). Higher ω-6:ω-3 ratios have been found in unbred maize cultivars from Mexico (59–80:1), sweet maize from US (29–33:1), and Peruvian germplasm from other races (36–50:1) in comparison with ratios found in evaluated Cabanita maize at physiological maturity stage (15–16:1) (65, 66, 68). Genetic factors may play a role on observed differences. In addition, differences in the agroecological and post-harvest management conditions may also be involved. Based on the current results, Cabanita maize shows potential as a dietary source of health relevant PUFAs.
The maturity stage had a strong influence on fatty acid variability in all Cabanita types (Table 4). Saturated acids slightly increased at S3, but their proportions with respect to the total fatty acid contents decreased in all cases from 18 to 15% on average. Contents and percentages of stearic acid almost remained constant with maturation. Oleic acid increased from 21 to 22% at S1 to 25–28% at S3. Linoleic acid concentrations also increased and were high at S3, but their percentages in relation to the total fatty acid contents showed almost no variation with kernel growth (from 52 to 51%, from 52 to 53%, and from 53 to 54% for white, red and orange maize, respectively). The α-linolenic acid concentrations and percentages decreased from S1 to S3 (5.1–5.8% to 3.2–3.7%). Palmitoyl-CoA is a metabolic precursor of palmitic acid, and of stearoyl-CoA which in turn serves as a precursor of oleic, linoleic, and linolenic acids biosynthesis via several desaturase enzymes (56). A possible metabolic change toward the biosynthesis of oleic and linoleic acids instead of palmitic acid may explain its percentage decrease with maturity. It is noteworthy that ω-6:ω-3 ratios are lower at S1 stage (9.2–10.4:1) than at S3 (15–16:1) indicating better PUFAs balance when Cabanita maize is at milk stage.
The antioxidant capacity was evaluated with two different in vitro methods and only in the bioavailable-relevant soluble hydrophilic and lipophilic fractions of Cabanita maize samples (Table 5). The interaction of maize type (M) and the maturity stage (S) was not significant in all cases; however, all variables were influenced by S. The DPPH hydrophilic antioxidant capacity (DPPH-HF) declined with grain growth and there were differences depending on the maize type (M significant). Orange Cabanita showed higher values (422.3–821.7 μmol TE/100 g DW) than white and red types (310.7–490.6 and 308.9–520.2 μmol TE/100 g DW, for the white and red maize, respectively). The DPPH-HF decreased from S1 to S3 by 37, 41 and 49% in the white, red, and orange maize, respectively. The opposite trend was observed in case of the DPPH lipophilic antioxidant capacity (DPPH-LF). Values increased from S1 to S3 around 3.4 and 4.8-fold in the orange and red maize, respectively. In the white maize, the DPPH-LF was not detected at S1, but then it increased to 7.8 and 20.8 μmol TE/100 g DW with kernel development at S2 and S3, respectively.
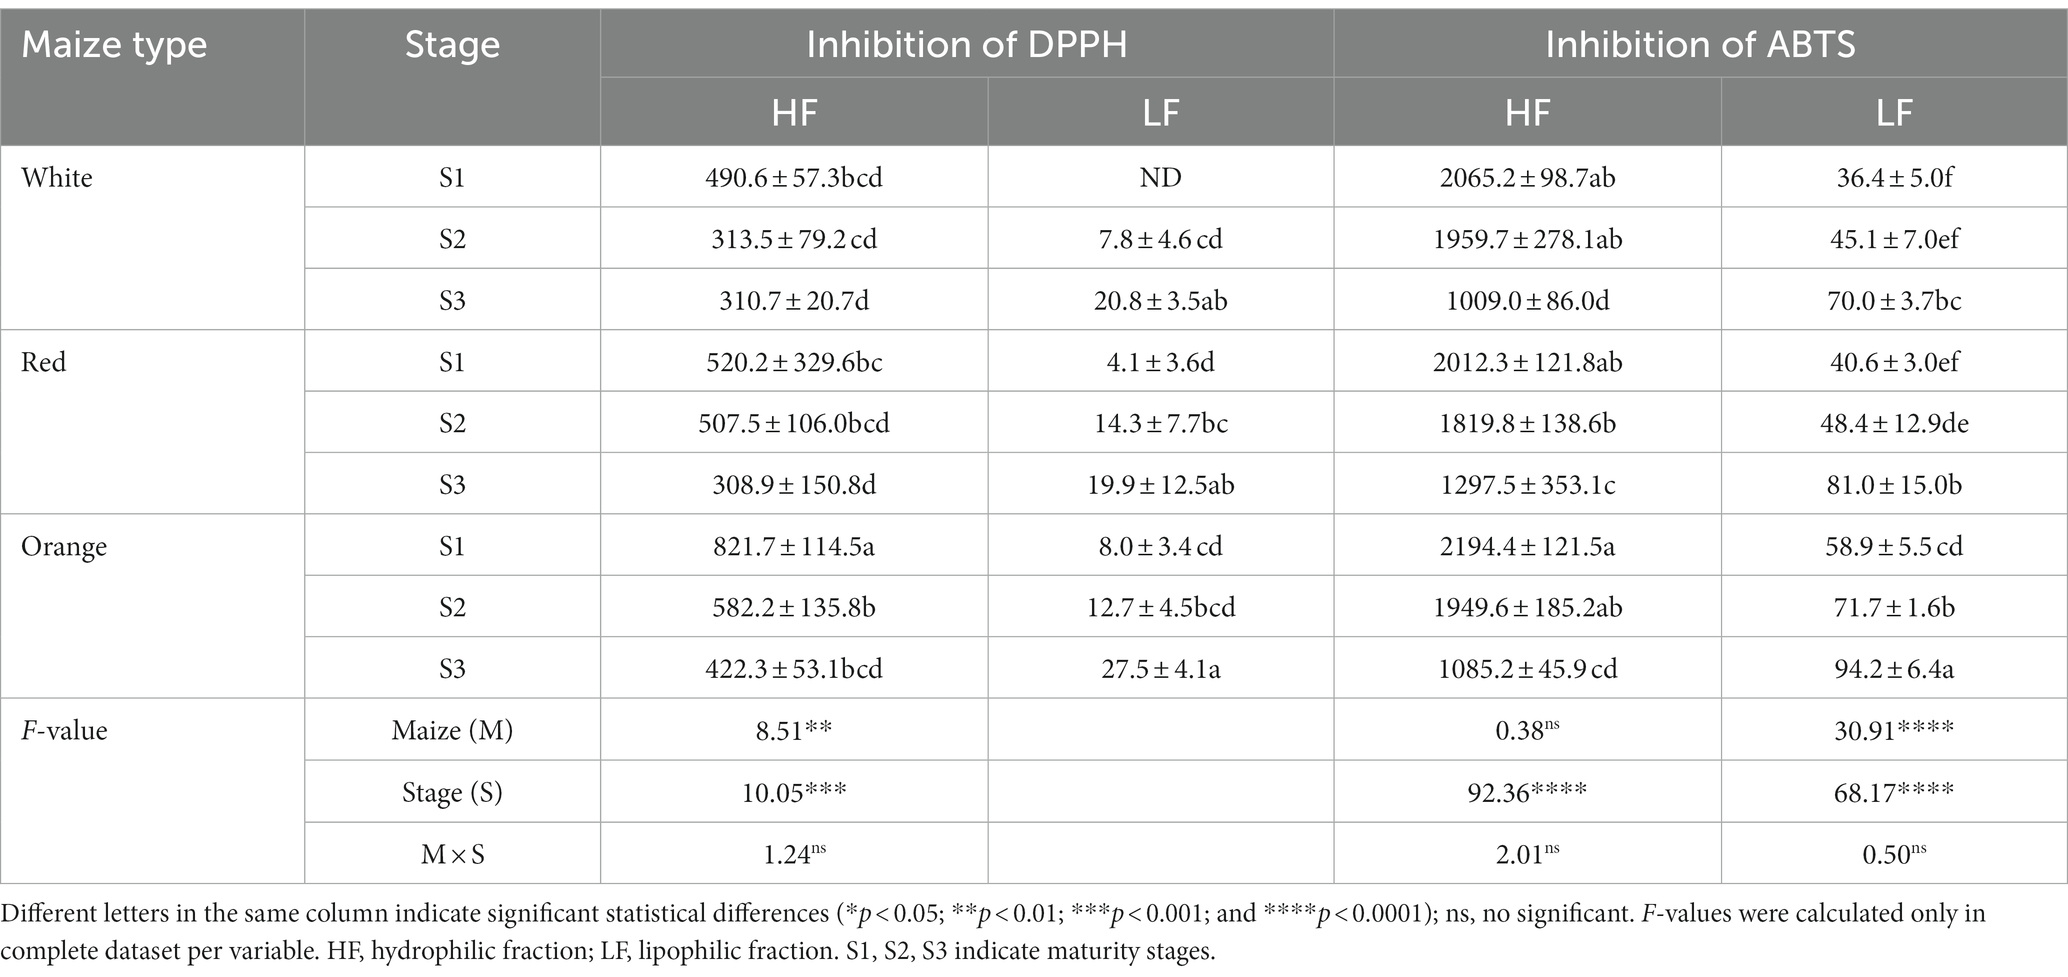
Table 5. In vitro antioxidant capacity (μmol TE/100 g DW) in Cabanita maize kernels of different pigmentations and maturity stages.
The ABTS hydrophilic antioxidant capacity (ABTS-HF) also decreased with kernel maturity in a range of 36–51%, similarly as in the case of the DPPH-HF. However, the maize type did not show an important effect. Ranges were almost comparable among all Cabanita types at all maturity stages (1009.0–2065.2 μmol TE/100 g DW, 1297.5–2012.3 μmol TE/100 g DW, and 1085.2–2194.4 μmol TE/100 g DW, for the white, red, and orange maize, respectively). In addition, the ABTS lipophilic antioxidant capacity (ABTS-LF) increased 1.6–2.0-fold from S1 to S3 as also was noticed in case of the DPPH-LF. The orange maize exhibited the highest value at S3 (94.2 μmol TE/100 g DW) among samples (M significant).
The hydrophilic extracts strongly inhibited both free radicals more than lipophilic fractions indicating higher contents of hydrophilic antioxidants such as soluble polyphenols. In fact, higher concentrations of total free phenolic compounds have been determined in this study in comparison with the total carotenoid contents (ranges of 10–65 mg/100 g DW and 0.56–5.87 μg/g DW, for the total free phenolic and total carotenoid contents, respectively). The UHPLC total free phenolic contents highly correlated with the antioxidant capacity (r = 0.7709 and r = 0.7863, p < 0.05 for the DPPH-HF and ABTS-HF, respectively). Hydroxybenzoic acid compounds such as vanillic acid derivatives showed a positive correlation with this property (r = 0.5740 and r = 0.7502, p < 0.05 for the DPPH-HF and ABTS-HF, respectively). Likewise, the HBA-1 compound, and the total HBA contents were correlated with the antioxidant capacity measured with both methods (r = 0.5790 and 0.7962, p < 0.05 for the DPPH-HF and ABTS-HF, respectively in case of the HBA-1; and r = 0.5900 and r = 0.7987, p < 0.05 for the DPPH-HF and ABTS-HF, respectively in case of the total HBA contents). Moreover, free luteolin derivatives also contributed to the antioxidant capacity in the orange maize group (r = 0.6246, p < 0.05 for the DPPH-HF). Consistent with the current study, soluble phenolic compounds were correlated with high antioxidant capacity evaluated with the ferric reducing antioxidant power (FRAP) and DPPH methods in several Italian maize landraces (75). Flavonoids including anthocyanins have shown to highly contribute to the free radical antioxidant capacity in Mexican red and purple-pigmented maize (76, 77). In the current study, no correlation was found between the total anthocyanin contents and the antioxidant capacity in Cabanita red maize which may be due to its lower anthocyanin ranges compared to HBA concentrations specially at S1 and S2 stages.
In case of the lipophilic antioxidant capacity, a moderate correlation was found between this functional quality and the total carotenoid contents (r = 0.5354, p < 0.05 with the DPPH method). Other lipophilic compounds such as tocopherols and tocotrienols common in the germ of maize grains but not analyzed in the current study may also play a role (17). Some tocopherol compounds from spelt grain (Triticum spelta) have shown significant correlation with the antioxidant capacity measured with the DPPH method (78).
A continuous decrease of the DPPH and FRAP antioxidant capacity was observed in the soluble phenolic fractions from yellow maize at different developmental stages (from 74 to 116 DAS) (24). Hu and Xu (37) and Giordano et al. (39) reported that the free radical inhibitory activity along the kernel growth stages was highly variable depending on the maize variety. An increase of the antioxidant response with kernel maturity were reported in sweet and yellow maize in maturity periods shorter (17–25 DAP and 15–48 DAP, respectively) than in the current research (28–77 DAP) (22, 79). Furthermore, Liu et al. (23) observed that the lipophilic oxygen radical absorbance antioxidant capacity (ORAC) increased with grain maturity (10–30 DAP) in sweet maize showing correlation with the total and individual carotenoids such as lutein and zeaxanthin. Differences in the current results from those of above studies indicates an important influence of genetic factors, the maturity stage, and the origin of maize.
In a previous study with Peruvian white, red, and orange Cabanita maize, Fuentes-Cardenas et al. (19) pointed out that hydrophilic compounds strongly contributed to the in vitro antioxidant capacity (DPPH and ABTS methods) than lipophilic fractions like this study. Nevertheless, lower ABTS-HF was reported by above authors (566.3–685.4 μmol TE/100 g DW) than in this research (1009.0–1297.5 μmol TE/100 g DW) at physiological maturity stage. This may suggest that postharvest management also plays a role in the observed bioactive variability and associated functional quality.
The intake of natural inhibitors of key intestinal carbohydrate-hydrolyzing enzymes such as α-amylase and α-glucosidase may represent an important dietary strategy for hyperglycemia management relevant for the type-2 diabetes prevention (80–82). Table 6 shows the potential in vitro inhibitory activity of the soluble hydrophilic and lipophilic fractions from Cabanita maize samples against α-amylase and α-glucosidase enzymes.
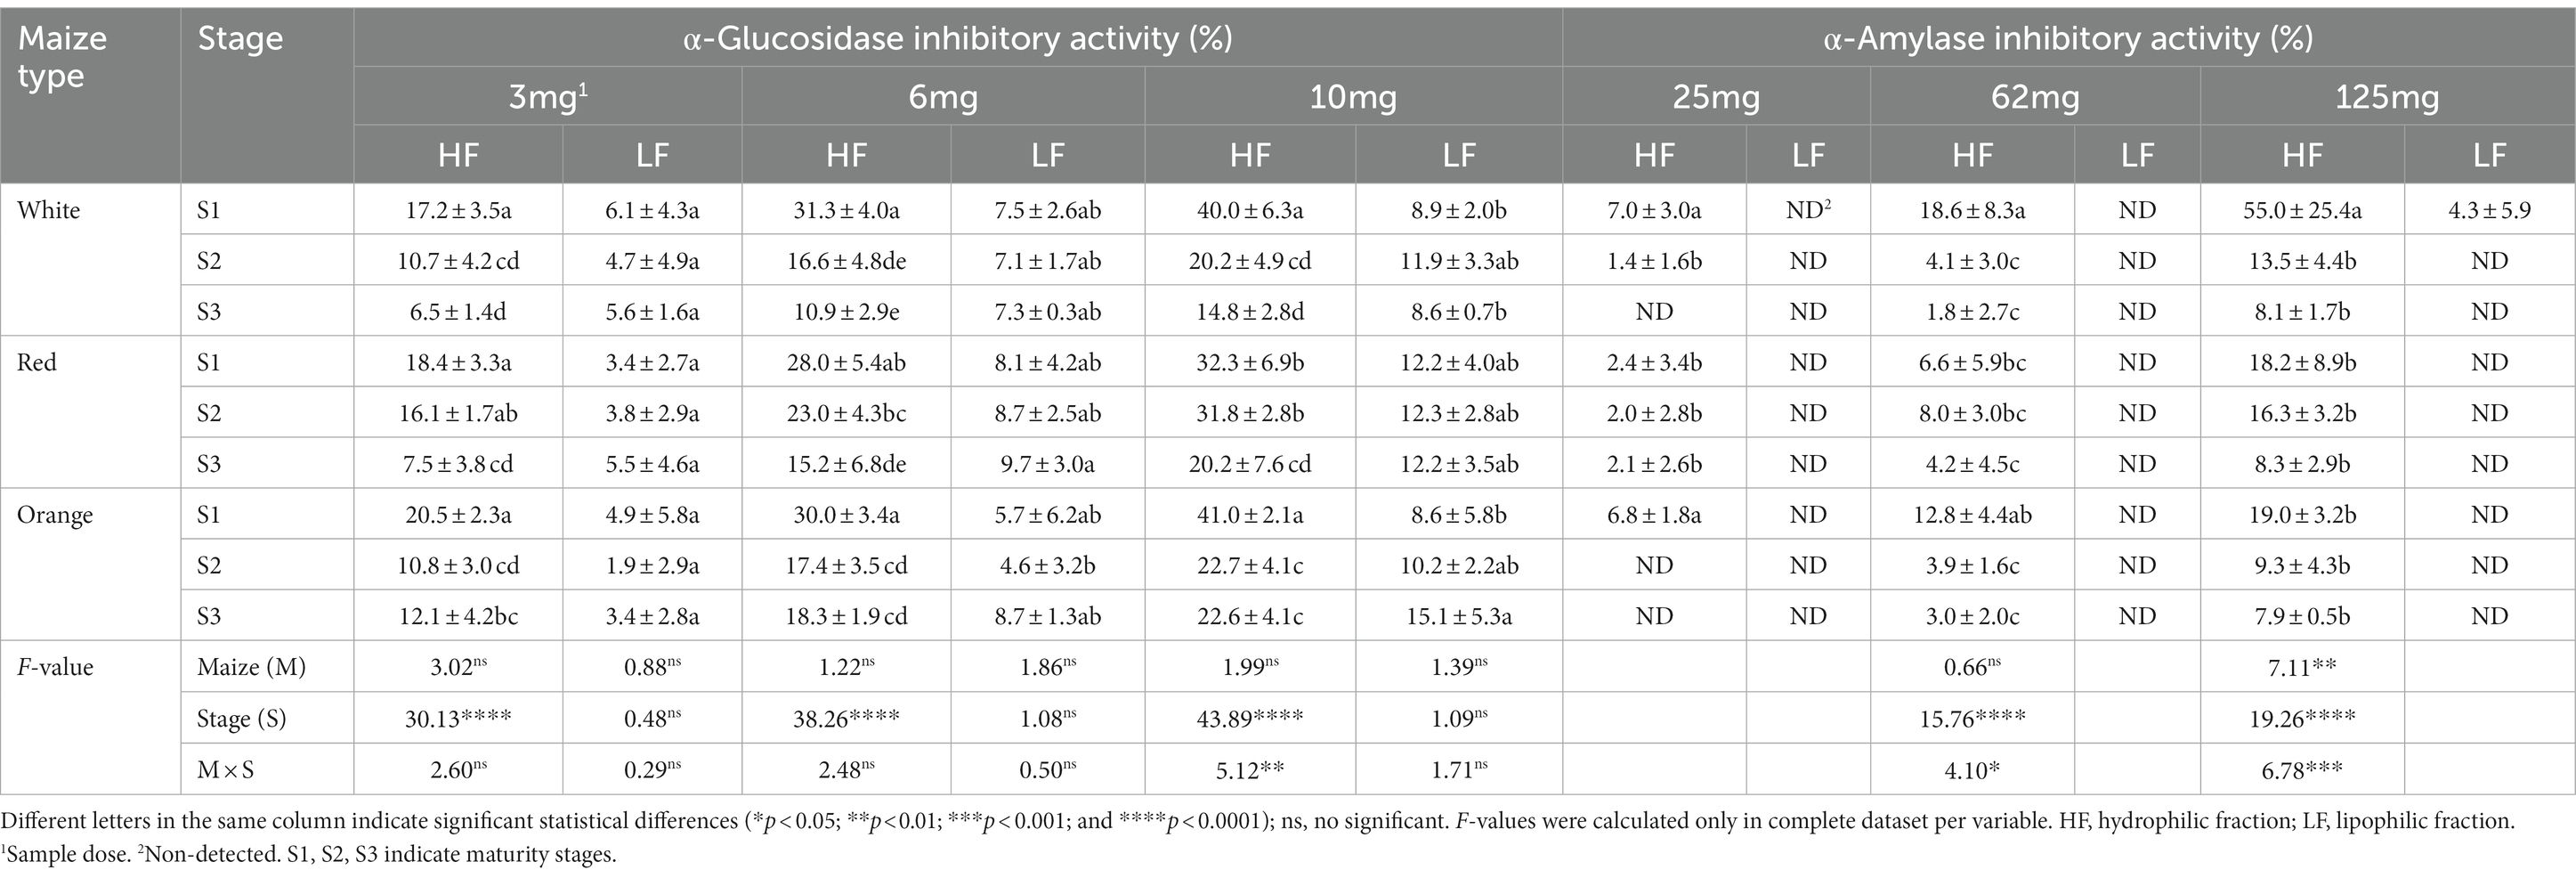
Table 6. In vitro inhibitory activity against α-amylase and α-glucosidase in Cabanita maize kernels of different pigmentations and maturity stages.
All hydrophilic (HF) and lipophilic (LF) maize extracts inhibited the α-glucosidase enzyme in a sample dose dependent manner (3–10 mg). However, HF extracts showed higher inhibition than LF fractions. The type of maize (M) was not significant on the α-glucosidase inhibitory activity of both HF and LF fractions at all evaluated sample doses. This indicates similar inhibitory potential among all Cabanita maize types. No effect of the M x S interaction was found on results from HF and LF fractions, except at 10 mg (HF). In this case, HF fractions from white and orange maize exhibited greater inhibition than red maize at S1 (40.0, 41.0, and 32.3%, for the white, orange, and red maize, respectively). Nonetheless, the inhibitory activity of red maize was higher than white and orange at S2 (31.8, 20.2, 22.7%, for the red, white, and orange samples, respectively), whereas results of all HF fractions were almost similar at S3.
The maturity stage (S) had a significant influence on the HF inhibitory activity at all sample doses. At 10 mg, this property decreased with kernel development (from 28–33 to 75–76 DAP) by 63, 37 and 45% in the white, red, and orange group, respectively. This reduction occurred at all sample doses, indicating that hydrophilic inhibitors may be related to the soluble phenolic fraction which also declined with kernel maturity as previously stated. This in vitro functional quality had high correlation with the free UHPLC soluble phenolic compounds at all sample doses (r = 0.7386, r = 0.8064, and r = 0.8545, p < 0.05 at 3, 6, and 10 mg sample dose, respectively). Specific phenolic compounds such as the vanillic acid derivatives, HBA-1, and the total HBA contents positively correlated with the inhibitory potential of Cabanita maize samples (r = 0.7962, r = 0.7728, and r = 0.7961, p < 0.05, respectively, 10 mg sample dose). Among free HCA compounds, ferulic acid derivatives also showed a significant correlation (r = 0.6597, p < 0.05, 10 mg sample dose). In case of LF fractions, results were not influenced by S, showing comparable α-glucosidase inhibition during the grain growth. However, a certain increase (from 5.7 to 8.7% and from 8.6 to 15.1% at 6, and 10 mg of sample dose, respectively) was observed in the orange maize. No significant correlations were found between the LF α-glucosidase inhibitory activity, and any metabolites measured in the current study.
The α-amylase enzyme, relevant for the hydrolysis of α-1,4-glucan polysaccharides into maltose and maltooligosaccharides (83), was inhibited only by HF maize fractions in a dose-dependent manner (Table 6). All values decreased with kernel maturity (S significant) similarly as in the case of the α-glucosidase inhibitory activity. When the maturity stage changed from S1 to S3, the white maize (125 mg dose) showed the highest loss of the inhibitory potential (around 85%), followed by the red, and orange maize (~54 and 58% in red and orange maize, respectively). Both M × S interaction and M factors greatly influenced the α-amylase inhibition. White maize samples had higher α-amylase inhibition at S1 among Cabanita maize types. The α-amylase inhibitory potential positively correlated with the free UHPLC total phenolic contents (r = 0.6358 and r = 0.6574, p < 0.05, at 62 and 125 mg of sample dose, respectively). Furthermore, all HBA compounds and free ferulic acid derivatives were correlated with this in vitro functional property (r = 0.5278–0.6471 at all sample doses, and r = 0.5340–0.5599 at 62–125 mg, respectively).
Different studies have highlighted the role of phenolic compounds for hyperglycemia prevention and countering associated oxidative complications through several mechanisms including the modulation of gastric enzymes at intestinal level (84–87). Cereal-derived phenolic acids including several HBA, and HCA compounds have shown inhibitory potential against the intestinal α-glucosidase enzyme which was highly dependent on the number of hydroxyl and methoxy groups in their structure (88). HBA derivatives such as methyl vanillate (a vanillic acid derivative), syringic acid, and vanillic acid from Thai colored rice showed higher inhibition of α-glucosidase than on α-amylase with a mixed-type inhibition mode against α-glucosidase (89). In same study, in silico analysis revealed that the inhibition involved the molecular interaction between HBA and the binding sites of digestive enzymes through 3–4 hydrogen bonds depending on the phenolic compound and the enzyme (89). Conjugated hydroxycinnamic acids amides (HCCA) identified in maize and in other grains from the Poaceae family grains such as N,N-di-feruloylputrescine, N-p-coumaroyl-N-feruloylputrescine have also been targeted as α-glucosidase inhibitors (90, 91). Recently, another ferulic acid derivative named 6’-O-feruloylsucrose isolated from black rice bran showed high α-glucosidase inhibition when in vitro and in silico studies were performed (92).
Based on above information, the free phenolic fraction including HBA, and some HCA derivatives likely involving ferulic acid derivatives detected in the current research may explain the in vitro anti-hyperglycemia potential of Cabanita maize HF extracts. However, other polar compounds may also be involved. Some compounds detected with the untargeted GC–MS analysis as will be discussed in next section, have shown direct correlation with results from both enzymatic assays. Alcohol sugars including D-sorbitol, meso-erythritol and phytosterols such as campesterol, and sitosterol positively correlated with the α-amylase (r = 0.7588, r = 0.6556, r = 0.6235, and r = 0.7850, p < 0.05, at 125 mg dose respectively) and α-glucosidase inhibitory activities (r = 0.7275, r = 0.7062, r = 0.6965, and r = 0.7218, p < 0.05, at 10 mg, respectively). Some studies have pointed out the role of erythritol and triterpenoid compounds for the management of postprandial blood glucose through the inhibition of α-glucosidase enzyme (93, 94). Stigmasterol among other phytochemicals identified in maize silk have been indicated as potential inhibitors of both α-glucosidase and α-amylase enzymes (95).
The observed LF α-glucosidase inhibitory activity may be ascribed to lipophilic compounds that increase in maize kernel with maturity time specially in case of the orange maize. The contents of α-tocopherol, β-tocotrienol, γ-tocotrienol, and δ-tocotrienol had increased with maturity in grains of Amaranthus cruentus (96). Lipophilic extracts from Vicia fava L. seeds containing α-tocopherol and γ-tocopherol compounds exhibited high α-glucosidase inhibition (97). It is possible that the inhibitory activity of Cabanita maize extracts against digestive enzymes may be due to the synergistic action of HL and LF compounds as also was reported by Parizad et al. (98) in several pigmented cereals. Future studies are necessary to reveal the identity of HF and LF compounds from Cabanita maize and their molecular mechanisms of inhibition against hyperglycemia-relevant enzymes.
α-Amylase inhibitory activity results from this study are comparable with those reported by Ranilla et al. (20) in mature Cabanita maize kernels from Peru (8.9–10.2%, at 125 mg sample dose). However, higher α-glucosidase inhibitory activities were obtained by above authors (34.9–40.8%, at 12.5 mg of sample dose) which may be linked to the higher sample doses evaluated. On the other hand, lower inhibitory activities against α-amylase and α-glucosidase were found in the free phenolic fraction from Chinese fresh waxy maize harvested at milk stage (~28–72% and ~32–48% for the α-amylase and α-glucosidase inhibitory activities, respectively, at 1,000 mg sample dose) than in current study at similar maturity stage (2.4–55.0% at 25–125 mg sample dose, and 17.2–41.0% at 3–10 mg sample dose for the α-amylase and α-glucosidase inhibitory activities, respectively) (99). Several studies have shown the anti-hyperglycemic potential of maize from different origins (36, 98, 100). Nevertheless, the impact of the maturity stage on this functional property in selected samples from the Peruvian Cabanita maize diversity is shown for the first time in this study.
The GC–MS analysis allowed to detect 63 polar metabolites including sugars, amino acids, other nitrogen-containing compounds, free fatty acids, organic acids, sugar alcohols, and phytosterols. A PCA analysis was performed considering all data from the targeted, untargeted metabolomic analyses, and the in vitro functional quality to reveal underlying relationships among all variables (Figure 4). The first two principal components from the PCA model explained 58.1% of the total dataset variability. Different groups were observed based on the maize type and maturity stage which were explained by 98 significant variables. The heat map considering the top 60 significant variables is shown in Figure 5. PC 1 (45.2% of explained variance) separated (from top to the bottom) all maize types at S3 (OIII, RIII, and WIII, for the orange, red, and white maize at S3, respectively) from samples at earlier maturity stages (I, II, for S1 and S2, respectively).
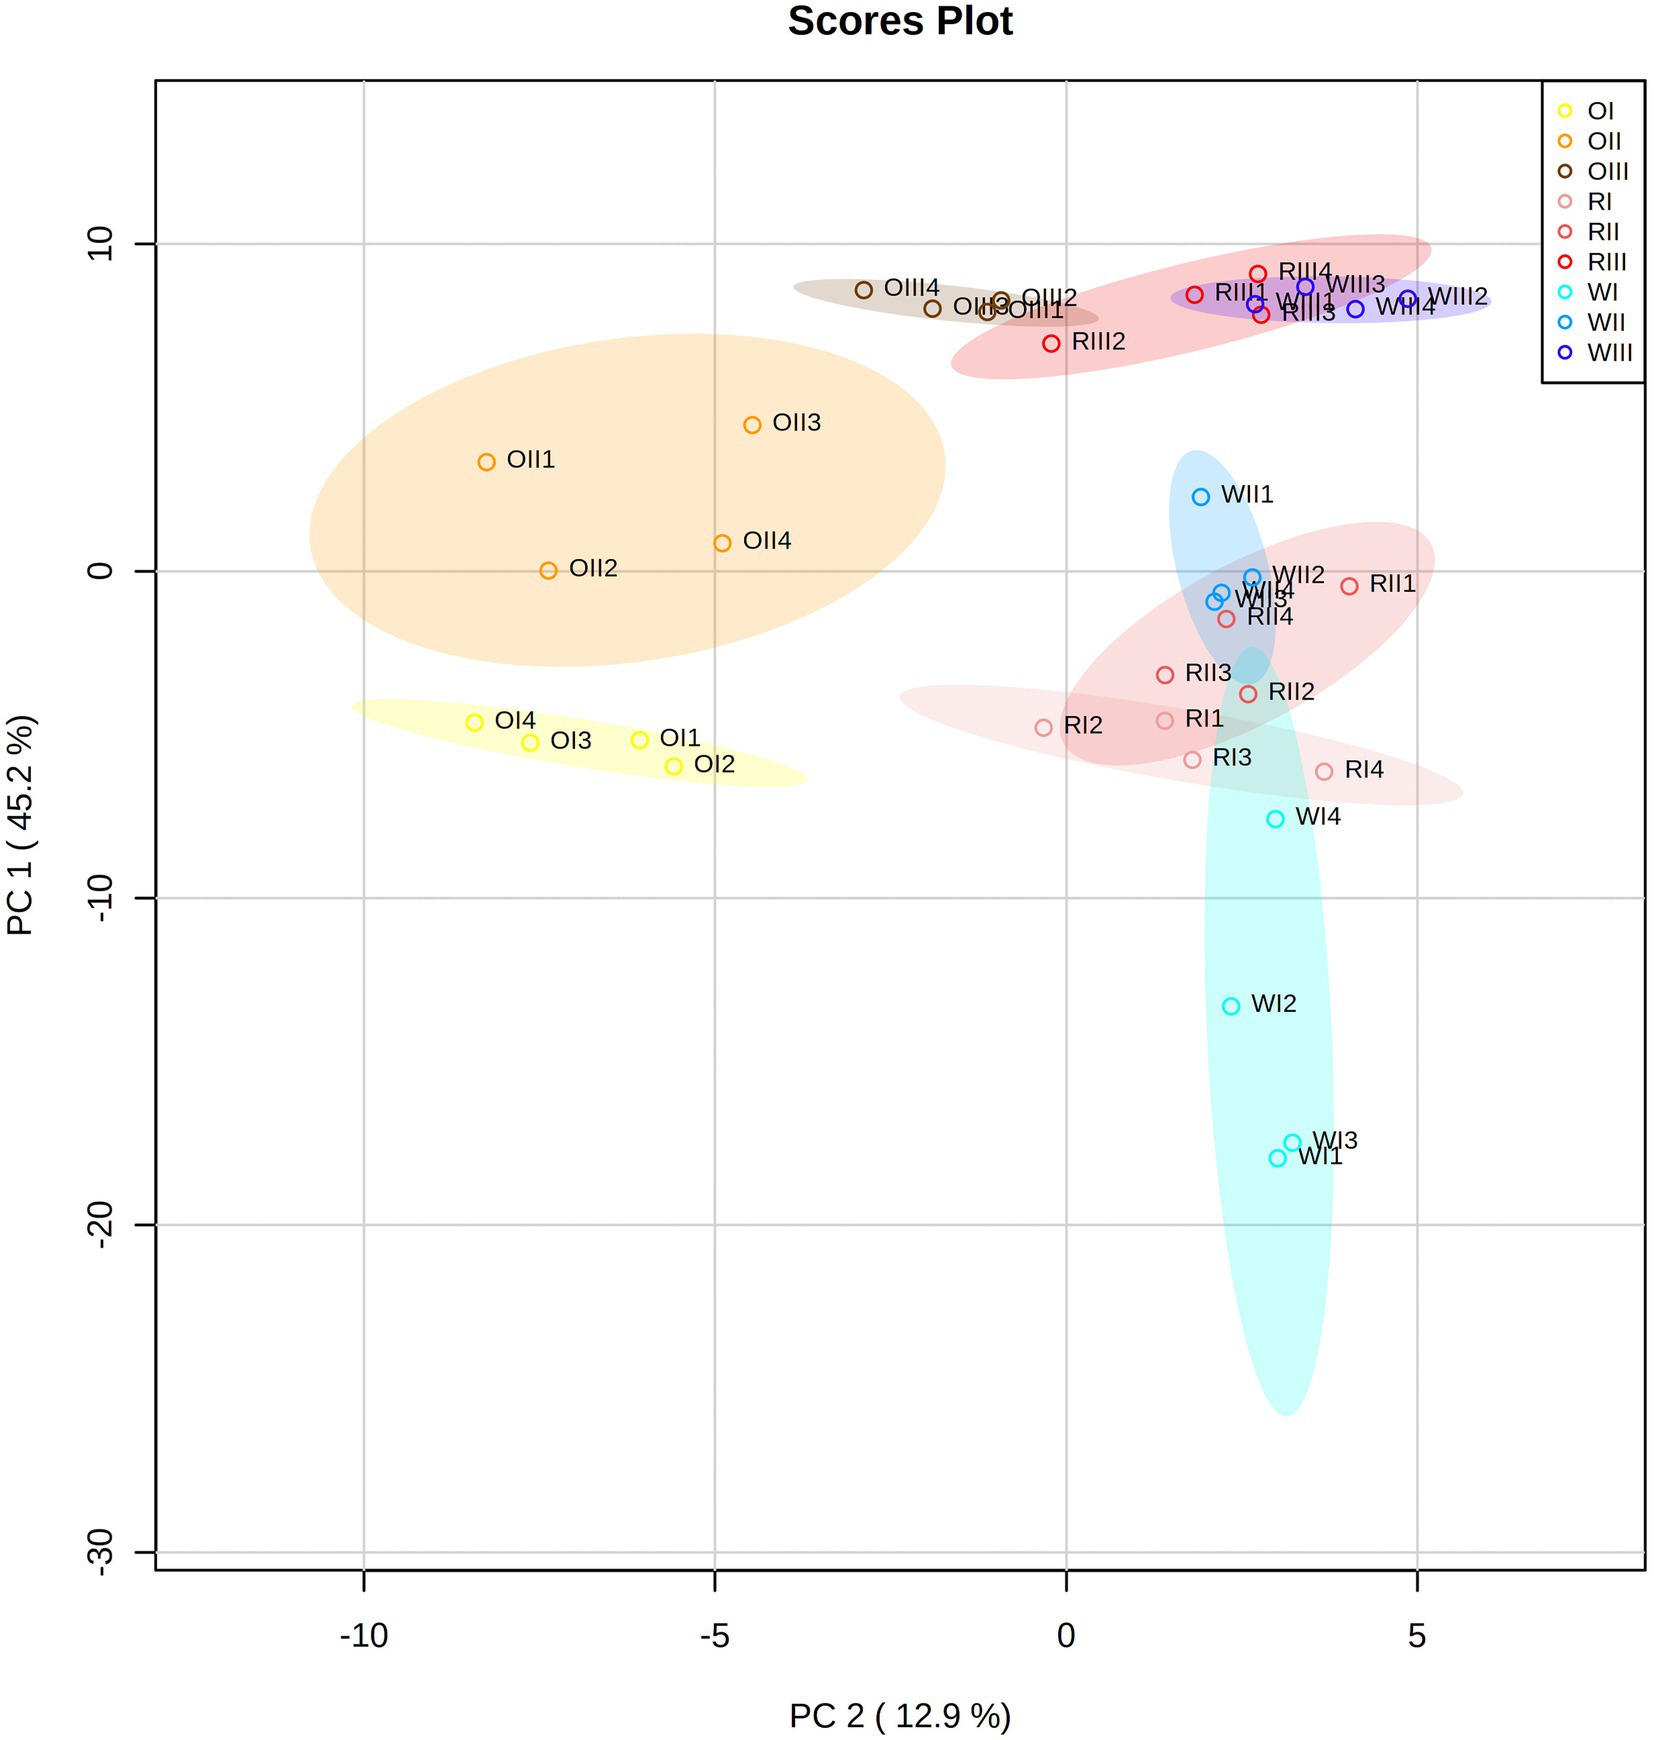
Figure 4. Principal component analysis (PCA) score plot of all data from white (W), red (R), and orange (O) Cabanita race at different maturity stages (I: S1, II: S2, III: S3).
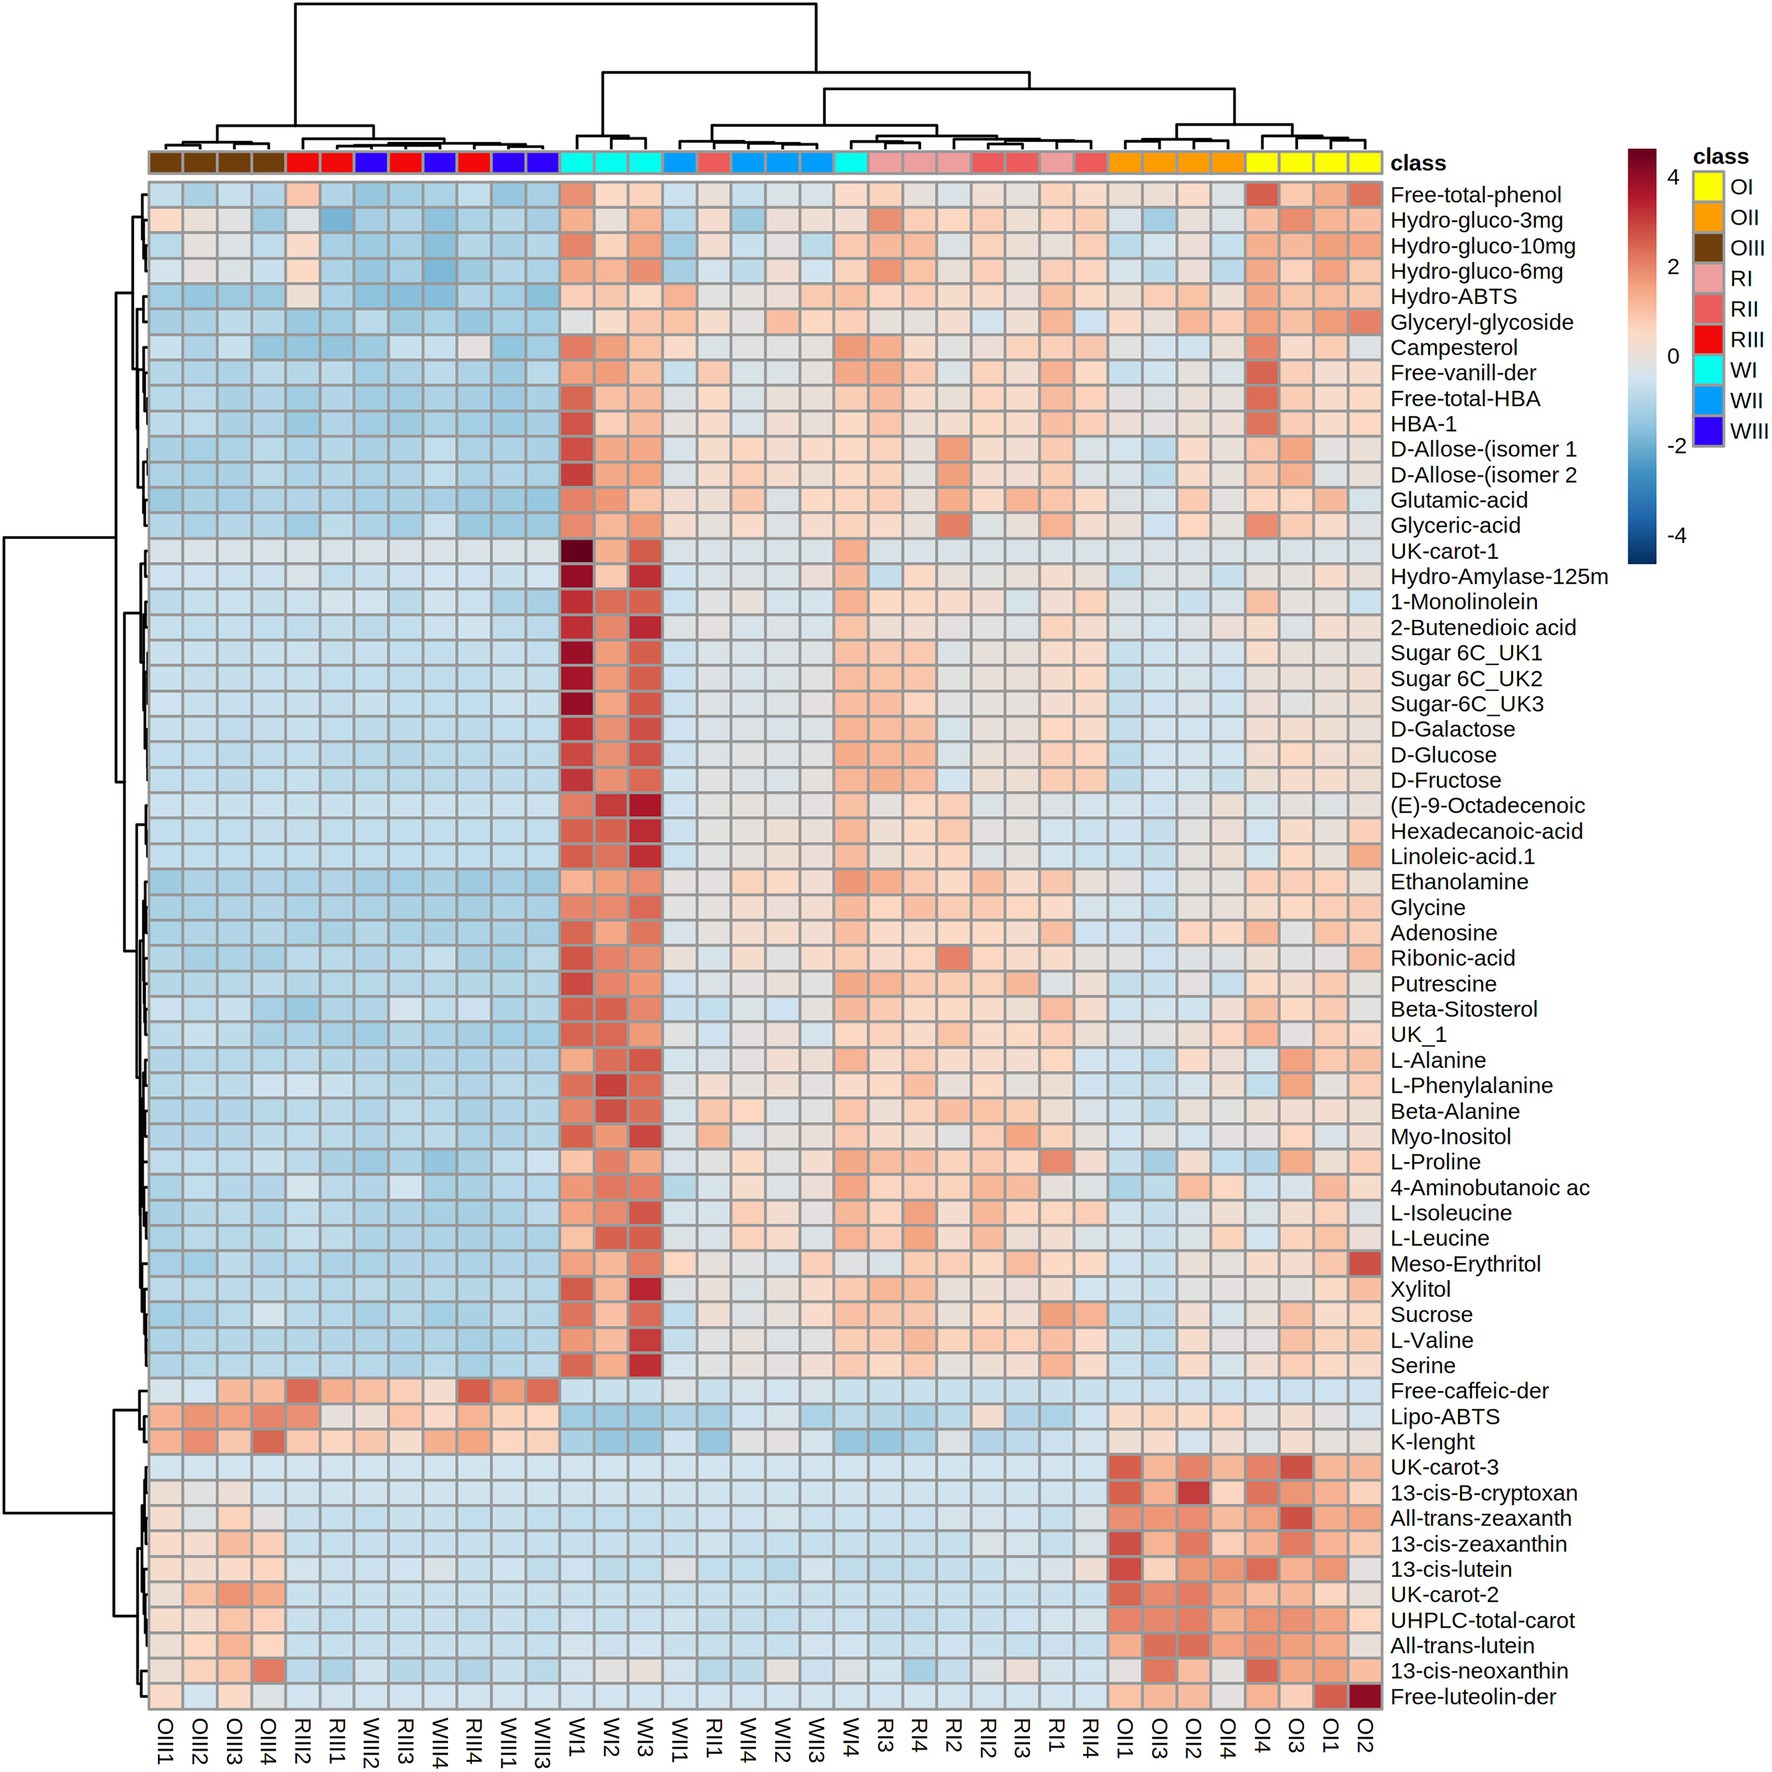
Figure 5. Heat map considering 60 significant variables from white (W), red (R), and orange (O) Cabanita race at different maturity stages (I: S1, II: S2, III: S3).
Maize samples at S3 were characterized by overall lower concentrations of secondary metabolites (phenolic and carotenoid compounds), along with reduced in vitro antioxidant and anti-hyperglycemia potential than maize at S1 and S2. In relation to the primary polar metabolites detected by GC–MS, free monosaccharides (glucose, fructose, galactose), disaccharides (sucrose) among other unidentified sugar molecules decreased with kernel maturity in all maize types (Figure 5). Furthermore, several amino acids (glutamic acid, glycine, alanine, phenylalanine, proline, isoleucine, leucine, valine, and serine) also declined with grain maturity. Simple sugars may have been used as carbon sources for cellular energy metabolism, and the biosynthesis of starch which is known to accumulate in mature cereal grains (101). The decrease of sugar contents with the concurrent increase of starch during grain development was observed by Xu et al. (24) and Saikaew et al. (101) in yellow and purple waxy maize, respectively. Amino acids may have been transformed into proteins or used as metabolic precursors for the synthesis of secondary metabolites (102). The increase of protein with kernel maturation has been reported in maize and rice kernels (101, 103). Among data from all maize types at S3, the orange maize clearly separated and stood out from the red and white groups, whereas some replicates from these last maize types overlapped. This difference was mainly correlated with the highest carotenoid contents in the orange group than in red and white maize.
PC 2 (12.9% of explained data variability) separated orange maize (at all maturity stages) from white and red types (from left to right). The orange maize showed unique flavonoids such as luteolin derivatives and had the highest carotenoid concentrations (especially at S1 and S2) as previously stated. Interestingly, the white maize was different from the other maize types specifically at the S1 stage (Figure 5). Primary metabolites including simple sugars (monosaccharides and sucrose), amino acids, free fatty acids (linoleic and palmitic acids), organic acids (4-aminobutanoic acid or GABA, fumaric acid), amines (putrescine, ethanolamine), myo-inositol and xylitol were more abundant in the white maize at milk stage than in the other maize groups at same maturity period.
Phytosterols such as campesterol and β-sitosterol were detected in all maize groups. The orange and red maize showed comparable campesterol contents, but the white maize exhibited the highest sitosterol abundance at S1. Phytosterols are bioactive compounds with potential for the prevention of cardiovascular diseases because of their cholesterol-lowering properties (104). Both detected phytosterols decreased with grain maturity in all Cabanita types. The reduction of β-sitosterol has been also observed during Camellia chekiangoleosa Hu. seeds development (105). β-sitosterol is the key precursor of sitosterol-β-glucoside which play a role on the biosynthesis of cellulose (106). The increase of dietary fibre, which is composed of cellulose, hemicellulose, lignin, among other polymers has been reported in Amaranthus cruentus with grain maturity (96). Furthermore, the cell wall feruloylation along with the lignin-cross links of the wheat grain outer layers increased during kernel development (107). This likely explains the decrease of free ferulic acid derivatives and the increase of some cell wall phenolics (bound ferulic acid derivatives) specially in the red and orange maize at S3 maturity stage.
Other detected primary metabolites such as free fatty acids (palmitic acid, linoleic acid), organic acids (glyceric acid, fumaric acid, ribonic acid, GABA), amines (ethanolamine, putrescine), myo-inositol, and alcohol sugars (erythritol, xylitol) were also reduced with grain maturity in all maize types. Free fatty acids may have been metabolized for the synthesis of triacylglycerols (TAG) since the total fatty acid contents (derived from the triacylglycerol saponification) increased with grain maturity in all Cabanita groups (Table 4). The increase of the total lipid contents during the grain development of yellow maize has been related to the late embryo formation (24). The reduction of ethanolamine and glyceric acid may have been targeted as precursors of glycerophospholids (components of the cell membranes) during grain growth. Some types of phosphatidilethanolamines esterified with variable fatty acids have increased during wheat kernel filling (108). The reduction of intermediate metabolites involved in the tricarboxylic acid cycle (TCA) such as fumaric acid and GABA-derived succinic acid might reflect a high mitochondrial activity for energy generation during the maize grain development (109). Polyamines including putrescine have essential roles in many biochemical and physiological processes, in particular stress and senescence responses during plant growth and development (110). Putrescine content also decreased with kernel maturity in Cabanita maize as observed in other polar metabolites. This polyamine may have been used for the biosynthesis of some HCAAs such as N-p-coumaroyl-N-feruloylputrescine and caffeoylputrescine which have been detected in mature maize (44). In the current study, p-coumaric and caffeic acid derivatives (possibly HCAAs) have increased with Cabanita kernel maturation.
Maize with different kernel pigmentations (white, red, and orange) and representing the diversity of the Peruvian Andean maize race Cabanita showed variable primary (polar metabolites), and secondary metabolite composition (phenolic and carotenoid compounds) and were greatly influenced by the grain maturity stage. All maize types showed free HBA and HCA phenolic compounds, but luteolin derivatives and anthocyanins were only detected in orange and red maize, respectively. Major bound phenolic compounds were ferulic acid, followed by ferulic acid derivatives, and p-coumaric acid in all Cabanita groups. However, orange, and red types had higher bound ferulic acid, and total phenolic contents (free + bound) (223.9–274.4 mg/100 g DW, 193.4–229.8 mg/100 g DW for the orange and red maize, respectively) than the white maize (162.2–225.0 mg/100 g DW). Xanthophylls including lutein, zeaxanthin, neoxanthin, lutein isomer (~13-cis-lutein) were detected in all maize types. The orange maize had the highest total carotenoid contents (3.19–5.87 μg/g DW) and contained specific carotenoids such as β-cryptoxanthin and zeaxanthin isomers. Most phenolic and carotenoid compounds decreased with kernel maturity in all Cabanita maize types. With respect to the primary metabolites, all maize types showed similar fatty acid contents (linoleic acid > oleic acid > palmitic acid > α-linolenic acid > stearic acid) which increased with kernel development. Other primary metabolites such as simple sugars, alcohols, amino acids, free fatty acids, organic acids, amines, and phytosterols declined with grain maturity and were overall more abundant in white maize at S1. The in vitro antioxidant potential and the inhibitory activity against digestive enzymes (α-amylase and α-glucosidase) were high in the hydrophilic fractions and correlated with the free phenolic fraction. In general, all Cabanita maize types had similar in vitro health-relevant functionality which significantly decreased with grain development. Based on above results, recommended harvesting periods for the consumption of the orange and white Cabanita would be at S1 and S2 stages due to their higher phenolic, carotenoid contents (in case of the orange type), in vitro functional qualities, phytosterol concentrations, and better ω-6:ω-3 PUFAs balance. The red Cabanita maize would be more valuable at S3 because of its higher total anthocyanin, and phenolic contents. Nevertheless, the potential changes on Cabanita technological and processing characteristics at lower maturity stages should be further evaluated. Current study provides relevant metabolomic and biochemical information that contribute to the characterization of the Andean Cabanita maize diversity. Insights from this research would be important for promoting its consumption beyond its mature form as it is currently applied, and for future improvements at postharvest level. Studies at transcriptomic level would help to reveal the mechanisms involved in the metabolic changes related to the secondary and primary metabolites during Cabanita maize maturation. Next level studies should focus on improving the nutraceutical and nutritional properties of Cabanita maize with its sustainability and consumer-relevant yield characteristics within the context of Andean food systems.
The raw data supporting the conclusions of this article will be made available by the authors, without undue reservation.
LR and GZ conceived and designed the study. LR directed the research and wrote the manuscript. AA-C performed the experiments. RC helped with the experimental work. HH contributed with the direction of crop management and pollination control. MV-V helped with the statistical analysis. HB-G coordinated and helped with the original sample collection. RP developed the untargeted metabolomic and free fatty acid analysis. GZ, RC, RP, HH, and KS critically reviewed the manuscript. All authors contributed to the article and approved the submitted version.
This research was supported by PROCIENCIA-CONCYTEC (Peru) under the Basic Research Program E041-2018-01, Contract N°114-2018-FONDECYT.
We thank Eng. Humberto Jose Stretz-Chavez, and Nestor Zeballos for the technical assistance during the preliminary experiments and the final Cabanita maize cultivation, respectively. We also thank to Abraham Mamani, and Excequel Ponce Guequen for their support during the UHPLC-DAD, and GC–MS/FID analysis, respectively. In addition, we thank Jose Villanueva for his support during the use of the freeze drier. Evaluated Cabanita maize samples are from Peru and have been accessed under the contract N° 002-2021-MIDAGRI-INIA/DGIA (Peru) with Resolución Directoral N°0006-2021-INIA-DGIA. Information about Cabanita maize is shown in Tables 1–6 and Figures 1–5 of current manuscript. Access and Benefit-Sharing Clearing-House (ABSCH) ABSCH-IRCC-PE-256874-1. Internationally recognized certificate of compliance constituted from information on the permit, or its equivalent made available to the Access and Benefit-sharing Clearing-House of the Convention on Biological Diversity (CBD) (https://absch.cbd.int/en/database/ABSCH-IRCC-PE-256874).
The authors declare that the research was conducted in the absence of any commercial or financial relationships that could be construed as a potential conflict of interest.
All claims expressed in this article are solely those of the authors and do not necessarily represent those of their affiliated organizations, or those of the publisher, the editors and the reviewers. Any product that may be evaluated in this article, or claim that may be made by its manufacturer, is not guaranteed or endorsed by the publisher.
The Supplementary material for this article can be found online at: https://www.frontiersin.org/articles/10.3389/fnut.2023.1132228/full#supplementary-material
1. Guzzon, F, Arandia Rios, LW, Caviedes Cepeda, GM, Céspedes Polo, M, Chavez Cabrera, A, Muriel Figueroa, J, et al. Conservation and use of Latin American maize diversity: pillar of nutrition security and cultural heritage of humanity. Agronomy (Basel). (2021) 11:172. doi: 10.3390/agronomy11010172
2. Grobman, A, Bonavia, D, Dillehay, TD, Piperno, DR, Iriarte, J, and Holst, I. Preceramic maize from paredones and huaca prieta, Peru. Proc Natl Acad Sci U S A. (2012) 109:1755–9. doi: 10.1073/pnas.1120270109
3. Matsuoka, Y, Vigouroux, Y, Goodman, MM, Sanchez, J, Buckler, E, and Doebley, J. A single domestication for maize shown by multilocus microsatellite genotyping. Proc Natl Acad Sci U S A. (2002) 99:6080–4. doi: 10.1073/pnas.052125199
4. Villa, TCC, Maxted, N, Scholten, M, and Ford-Lloyd, B. Defining and identifying crop landraces. Plant Genet Resour. (2005) 3:373–84. doi: 10.1079/PGR200591
5. Anderson, E, and Cutler, HC. Races of Zea mays: I. their recognition and classification. Ann Mo Bot Gard. (1942) 29:69–88. doi: 10.2307/2394331
6. Harlan, J, and De Wet, J. Toward a rational classification of cultivated plants. Taxon. (1971) 20:509–17. doi: 10.2307/1218252
7. Peruvian Ministry of Environment. Línea de Base de la Diversidad Genética del maíz Peruano con Fines de Bioseguridad (2018). Available at: https://bioseguridad.minam.gob.pe/wp-content/uploads/2019/01/Linea-de-base-ma%C3%ADz-LowRes.pdf (Accessed November 1, 2022)
8. CIMMYT (International Maize and Wheat Improvement Center). Latin American Maize Germplasm: Core Subset Development and Regeneration—Proceedings of a Workshop Held at CIMMYT June 1–5, 1998; CIMMYT: Mexico City, Mexico, (1999) 1–67. Available at: https://repository.cimmyt.org/bitstream/handle/10883/582/68531.pdf?sequence=1&isAllowed=y (Accessed November 4, 2022).
9. Peruvian Ministry of Environment. Peru, Megadiverse Country (2008). Available at: https://repositoriodigital.minam.gob.pe/bitstream/handle/123456789/169/BIV01165_en.pdf?sequence=2&isAllowed=y (Accessed November 2, 2022).
10. Espinoza, JC, Garreaud, R, Poveda, G, Arias, PA, Molina-Carpio, J, Masiokas, M, et al. Hydroclimate of the Andes part I: main climatic features. Front Earth Sci. (2020) 8:64. doi: 10.3389/feart.2020.00064
11. Zhu, Y, and Sang, S. Phytochemicals in whole grain wheat and their health-promoting effects. Mol Nutr Food Res. (2017) 61:1600852. doi: 10.1002/mnfr.201600852
12. Björck, I, Östman, E, Kristensen, M, Anson, NM, Price, RK, Haenen, GR, et al. Cereal grains for nutrition and health benefits: overview of results from in vitro, animal and human studies in the HEALTHGRAIN project. Trends Food Sci Technol. (2012) 25:87–100. doi: 10.1016/j.tifs.2011.11.005
13. Ghanbari-Gohari, F, Mousavi, SM, and Esmaillzadeh, A. Consumption of whole grains and risk of type 2 diabetes: a comprehensive systematic review and dose–response meta-analysis of prospective cohort studies. Food Sci Nutr. (2022) 10:1950–60. doi: 10.1002/fsn3.2811
14. Barrett, EM, Batterham, MJ, Ray, S, and Beck, EJ. Whole grain, bran and cereal fibre consumption and CVD: a systematic review. Br J Nutr. (2019) 121:914–37. doi: 10.1017/S000711451900031X
15. Zhang, XF, Wang, XK, Tang, YJ, Guan, XX, Guo, Y, Fan, JM, et al. Association of whole grains intake and the risk of digestive tract cancer: a systematic review and meta-analysis. Nutr J. (2020) 19:52–14. doi: 10.1186/s12937-020-00556-6
16. Xiao, Y, Ke, Y, Wu, S, Huang, S, Li, S, Lv, Z, et al. Association between whole grain intake and breast cancer risk: a systematic review and meta-analysis of observational studies. Nutr J. (2018) 17:87–12. doi: 10.1186/s12937-018-0394-2
17. Siyuan, S, Tong, L, and Liu, R. Corn phytochemicals and their health benefits. Food Sci Human Wellness. (2018) 7:185–95. doi: 10.1016/j.fshw.2018.09.003
18. Domínguez-Hernández, E, Gaytán-Martínez, M, Gutiérrez-Uribe, JA, and Domínguez-Hernández, ME. The nutraceutical value of maize (Zea mays L.) landraces and the determinants of its variability: a review. J Cereal Sci. (2022) 103:103399:103399. doi: 10.1016/j.jcs.2021.103399
19. Fuentes-Cardenas, IS, Cuba-Puma, R, Marcilla-Truyenque, S, Begazo-Gutiérrez, H, Zolla, G, Fuentealba, C, et al. Diversity of the Peruvian Andean maize (Zea mays L.) race Cabanita: polyphenols, carotenoids, in vitro antioxidant capacity, and physical characteristics. Front Nutr. (2022) 9:983208. doi: 10.3389/fnut.2022.983208
20. Ranilla, LG, Huamán-Alvino, C, Flores-Báez, O, Aquino-Méndez, EM, Chirinos, R, Campos, D, et al. Evaluation of phenolic antioxidant-linked in vitro bioactivity of Peruvian corn (Zea mays L.) diversity targeting for potential management of hyperglycemia and obesity. J Food Sci Technol. (2019) 56:2909–24. doi: 10.1007/s13197-019-03748-z
21. Harakotr, B, Suriharn, B, Tangwongchai, R, Scott, MP, and Lertrat, K. Anthocyanins and antioxidant activity in coloured waxy corn at different maturation stages. J Funct Foods. (2014) 9:109–18. doi: 10.1016/j.jff.2014.04.012
22. Zhang, S, Ji, J, Zhang, S, Xiao, W, Guan, C, Wang, G, et al. Changes in the phenolic compound content and antioxidant activity in developmental maize kernels and expression profiles of phenolic biosynthesis-related genes. J Cereal Sci. (2020) 96:103113. doi: 10.1016/j.jcs.2020.103113
23. Liu, H, Mao, J, Yan, S, Yu, Y, Xie, L, Hu, JG, et al. Evaluation of carotenoid biosynthesis, accumulation and antioxidant activities in sweetcorn (Zea mays L.) during kernel development. Int J Food Sci Technol. (2018) 53:381–8. doi: 10.1111/ijfs.13595
24. Xu, JG, Hu, QP, Wang, XD, Luo, JY, Liu, Y, and Tian, CR. Changes in the main nutrients, phytochemicals, and antioxidant activity in yellow corn grain during maturation. J Agric Food Chem. (2010) 58:5751–6. doi: 10.1021/jf100364k
25. Larson, E. Corn reproductive stages and their management implications. Mississippi crop situation. (2020). Available at: https://www.mississippi-crops.com/2020/06/27/corn-reproductive-stages-and-their-management-implications/ (Accessed October 13, 2022)
26. Nleya, T, Chungu, C, and Kleinjan, J. Chapter 5: corn growth and development In: DE Clay, CG Carlson, SA Clay, and E Byamukama, editors. iGrow corn: Best Management Practices. Brookings, SD: South Dakota State University (2016). 1–10.
27. International Maize and Wheat Improvement Center (CIMMYT). Mexico City/International Board for Plant Genetic Resources (IBPGR). Rome: Descriptores para Maíz (1991).
28. AOAC International. Official Methods of Analysis of AOAC International. 20th ed. Rockville, MD: Association of Official Analytical Chemists (2016). 3172 p.
29. Ranilla, LG, Rios-Gonzales, BA, Ramírez-Pinto, MF, Fuentealba, C, Pedreschi, R, and Shetty, K. Primary and phenolic metabolites analyses, in vitro health-relevant bioactivity and physical characteristics of purple corn (Zea mays L.) grown at two Andean geographical locations. Meta. (2021) 11:722. doi: 10.3390/metabo11110722
30. Vargas-Yana, D, Aguilar-Morón, B, Pezo-Torres, N, Shetty, K, and Ranilla, LG. Ancestral Peruvian ethnic fermented beverage “Chicha” based on purple corn (Zea mays L.): unraveling the health-relevant functional benefits. J Ethn Food. (2020) 7:1–12. doi: 10.1186/s42779-020-00063-3
31. Singleton, VL, and Rossi, JA. Colorimetry of total phenolics with phosphomolybdic-phosphotungstic acid reagents. Am J Enol Vitic. (1965) 16:144–58.
32. Uarrota, VG, Segatto, C, Voytena, APL, Maraschin, M, Avila, LV, and Kazama, DC. Metabolic fingerprinting of water-stressed soybean cultivars by gas chromatography, near-infrared and UV-visible spectroscopy combined with chemometrics. J Agron Crop Sci. (2019) 205:141–56. doi: 10.1111/jac.12311
33. Fuentealba, C, Hernández, I, Saa, S, Toledo, L, Burdiles, P, Chirinos, R, et al. Colour and in vitro quality attributes of walnuts from different growing conditions correlate with key precursors of primary and secondary metabolism. Food Chem. (2017) 232:664–72. doi: 10.1016/j.foodchem.2017.04.029
34. Duarte-Almeida, JM, Santos, RJD, Genovese, MI, and Lajolo, FM. Avaliação da atividade antioxidante utilizando sistema beta-caroteno/ácido linoléico e método de seqüestro de radicais DPPH. Cienc Technol Aliment. (2006) 26:446–52. doi: 10.1590/S0101-20612006000200031
35. Fuentealba, C, Ranilla, LG, Cobos, A, Olaeta, JA, Defilippi, BG, Chirinos, R, et al. Characterization of main primary and secondary metabolites and in vitro antioxidant and antihyperglycemic properties in the mesocarp of three biotypes of Pouteria lucuma. Food Chem. (2016) 190:403–11. doi: 10.1016/j.foodchem.2015.05.111
36. González-Muñoz, A, Quesille-Villalobos, AM, Fuentealba, C, Shetty, K, and Ranilla, LG. Potential of Chilean native corn (Zea mays L.) accessions as natural sources of phenolic antioxidants and in vitro bioactivity for hyperglycemia and hypertension management. J Agric Food Chem. (2013) 61:10995–1007. doi: 10.1021/jf403237p
37. Hu, QP, and Xu, JG. Profiles of carotenoids, anthocyanins, phenolics, and antioxidant activity of selected color waxy corn grains during maturation. J Agric Food Chem. (2011) 59:2026–33. doi: 10.1021/jf104149q
38. Hong, HT, Netzel, ME, and O'Hare, TJ. Anthocyanin composition and changes during kernel development in purple-pericarp supersweet sweetcorn. Food Chem. (2020) 315:126284:126284. doi: 10.1016/j.foodchem.2020.126284
39. Giordano, D, Beta, T, Reyneri, A, and Blandino, M. Changes in the phenolic acid content and antioxidant activity during kernel development of corn (Zea mays L.) and relationship with mycotoxin contamination. Cereal Chem. (2017) 94:315–24. doi: 10.1094/CCHEM-05-16-0155-R
40. Ndolo, VU, and Beta, T. Comparative studies on composition and distribution of phenolic acids in cereal grain botanical fractions. Cereal Chem. (2014) 91:522–30. doi: 10.1094/CCHEM-10-13-0225-R
41. Das, AK, and Singh, V. Antioxidative free and bound phenolic constituents in botanical fractions of Indian specialty maize (Zea mays L.) genotypes. Food Chem. (2016) 201:298–306. doi: 10.1016/j.foodchem.2016.01.099
42. Yuan, Y, Xiang, J, Zheng, B, Sun, J, Luo, D, Li, P, et al. Diversity of phenolics including hydroxycinnamic acid amide derivatives, phenolic acids contribute to antioxidant properties of proso millet. LWT. (2022) 154:112611. doi: 10.1016/j.lwt.2021.112611
43. Collison, A, Yang, L, Dykes, L, Murray, S, and Awika, JM. Influence of genetic background on anthocyanin and copigment composition and behavior during thermoalkaline processing of maize. J Agric Food Chem. (2015) 63:5528–38. doi: 10.1021/acs.jafc.5b00798
44. Lux, PE, Freiling, M, Stuetz, W, von Tucher, S, Carle, R, Steingass, CB, et al. (Poly) phenols, carotenoids, and tocochromanols in corn (Zea mays L.) kernels as affected by phosphate fertilization and sowing time. J Agric Food Chem. (2020) 68:612–22. doi: 10.1021/acs.jafc.9b07009
45. Burt, AJ, Arnason, JT, and García-Lara, S. Natural variation of hydroxycinnamic acid amides in maize landraces. J Cereal Sci. (2019) 88:145–9. doi: 10.1016/j.jcs.2019.06.002
46. Hu, X, Liu, H, Yu, Y, Li, G, Qi, X, Li, Y, et al. Accumulation of phenolics, antioxidant and antiproliferative activity of sweet corn (Zea mays L.) during kernel maturation. Int J Food Sci Technol. (2021) 56:2462–70. doi: 10.1111/ijfs.14879
47. Mohamed, G, Lertrat, K, and Suriharn, B. Phenolic compound, anthocyanin content, and antioxidant activity in some parts of purple waxy corn across maturity stages and locations. Int Food Res J. (2017) 24:490.
48. Trehan, S, Singh, N, and Kaur, A. Diversity and relationship among grain, flour and starch characteristics of Indian Himalayan colored corn accessions. J Food Sci Technol. (2020) 57:3801–13. doi: 10.1007/s13197-020-04412-7
49. Zhang, Z, Liang, Z, Yin, L, Li, QX, and Wu, Z. Distribution of four bioactive flavonoids in maize tissues of five varieties and correlation with expression of the biosynthetic genes. J Agric Food Chem. (2018) 66:10431–7. doi: 10.1021/acs.jafc.8b03865
50. Choi, DJ, Kim, SL, Choi, JW, and Park, YI. Neuroprotective effects of corn silk maysin via inhibition of H2O2-induced apoptotic cell death in SK-N-MC cells. Life Sci. (2014) 109:57–64. doi: 10.1016/j.lfs.2014.05.020
51. Liang, Z, Zhang, B, Su, WW, Williams, PG, and Li, QX. C-Glycosylflavones alleviate tau phosphorylation and amyloid neurotoxicity through GSK3β inhibition. ACS Chem Neurosci. (2016) 7:912–23. doi: 10.1021/acschemneuro.6b00059
52. Marchiosi, R, dos Santos, WD, Constantin, RP, de Lima, RB, Soares, AR, Finger-Teixeira, A, et al. Biosynthesis and metabolic actions of simple phenolic acids in plants. Phytochem Rev. (2020) 19:865–906. doi: 10.1007/s11101-020-09689-2
53. Glagoleva, AY, Vikhorev, AV, Shmakov, NA, Morozov, SV, Chernyak, EI, Vasiliev, GV, et al. Features of activity of the phenylpropanoid biosynthesis pathway in melanin-accumulating barley grains. Front Plant Sci. (2022) 13:923717. doi: 10.3389/fpls.2022.923717
54. Mccallum, JA, and Walker, JR. Phenolic biosynthesis during grain development in wheat (Triticum aestivum L.) III. Changes in hydroxycinnamic acids during grain development. J Cereal Sci. (1991) 13:161–72. doi: 10.1016/S0733-5210(09)80033-7
55. Prior, RL, Wu, X, and Schaich, K. Standardized methods for the determination of antioxidant capacity and phenolics in foods and dietary supplements. J Agric Food Chem. (2005) 53:4290–302. doi: 10.1021/jf0502698
56. KEGG (Kyoto Encyclopedia of Genes and Genomes). Kyoto Encyclopedia of Genes and Genomes. Available at: https://www.genome.jp/kegg/ (Accessed November 15, 2022).
57. Hwang, T, Ndolo, VU, Katundu, M, Nyirenda, B, Bezner-Kerr, R, Arntfield, S, et al. Provitamin a potential of landrace orange maize variety (Zea mays L.) grown in different geographical locations of Central Malawi. Food Chem. (2016) 196:1315–24. doi: 10.1016/j.foodchem.2015.10.067
58. Song, J, Li, D, Liu, N, Liu, C, He, M, and Zhang, Y. Carotenoid composition and changes in sweet and field corn (Zea mays) during kernel development. Cereal Chem. (2016) 93:409–13. doi: 10.1094/CCHEM-11-15-0230-N
59. Baseggio, M, Murray, M, Magallanes-Lundback, M, Kaczmar, N, Chamness, J, Buckler, ES, et al. Natural variation for carotenoids in fresh kernels is controlled by uncommon variants in sweet corn. Plant Genome. (2020) 13:e20008. doi: 10.1002/tpg2.20008
60. Uarrota, VG, Severino, RB, Malinowsky, C, de Oliveira, SK, Kuhnen, S, Yunes, RA, et al. Biochemical profile of leaf, silk and grain samples of eight maize landraces (Zea mays L.) cultivated in two low-input agricultural systems. J Food Biochem. (2014) 38:551–62. doi: 10.1111/jfbc.12087
61. Calvo-Brenes, P, Fanning, K, and O'Hare, T. Does kernel position on the cob affect zeaxanthin, lutein and total carotenoid contents or quality parameters, in zeaxanthin-biofortified sweet-corn? Food Chem. (2019) 277:490–5. doi: 10.1016/j.foodchem.2018.10.141
62. O’Hare, TJ, Fanning, KJ, and Martin, IF. Zeaxanthin biofortification of sweet-corn and factors affecting zeaxanthin accumulation and colour change. Arch Biochem Biophys. (2015) 572:184–7. doi: 10.1016/j.abb.2015.01.015
63. Marković, S, Ledenčan, T, Vuletić, M, Galić, V, Jambrović, A, Zdunić, Z, et al. Chemical components of kernel quality in sh2 sweet corn genotypes (Zea mays L. saccharata Sturt.) as affected by harvest date. J Cent Eur Agric. (2020) 21:577–88. doi: 10.5513/JCEA01/21.3.2677
64. Ryu, SH, Werth, L, Nelson, S, Scheerens, JC, and Pratt, RC. Variation of kernel anthocyanin and carotenoid pigment content in USA/Mexico borderland land races of maize. Econ Bot. (2013) 67:98–109. doi: 10.1007/s12231-013-9232-9
65. Preciado-Ortiz, RE, García-Lara, S, Ortiz-Islas, S, Ortega-Corona, A, and Serna-Saldivar, SO. Response of recurrent selection on yield, kernel oil content and fatty acid composition of subtropical maize populations. Field Crops Res. (2013) 142:27–35. doi: 10.1016/j.fcr.2012.11.019
66. Saoussem, H, Sadok, B, Habib, K, and Mayer, PM. Fatty acid accumulation in the different fractions of the developing corn kernel. Food Chem. (2009) 117:432–7. doi: 10.1016/j.foodchem.2009.04.038
67. Yururdurmaz, C, and Yildiz, H. Fatty acid compositions of Zea mays L. varieties in Turkey. Prog Nutr. (2022) 24:e2022112. doi: 10.23751/pn.v24i3.13268
68. Salvador-Reyes, R, Rebellato, AP, Pallone, JAL, Ferrari, RA, and Clerici, MTPS. Kernel characterization and starch morphology in five varieties of Peruvian Andean maize. Food Res Int. (2021) 140:110044:110044. doi: 10.1016/j.foodres.2020.110044
69. Saini, RK, Rengasamy, KR, Ko, EY, Kim, JT, and Keum, YS. Korean maize hybrids present significant diversity in fatty acid composition: an investigation to identify PUFA-rich hybrids for a healthy diet. Front Nutr. (2020) 7:578761. doi: 10.3389/fnut.2020.578761
70. Saini, RK, and Keum, YS. Omega-3 and omega-6 polyunsaturated fatty acids: dietary sources, metabolism, and significance—a review. Life Sci. (2018) 203:255–67. doi: 10.1016/j.lfs.2018.04.049
71. Kapoor, B, Kapoor, D, Gautam, S, Singh, R, and Bhardwaj, S. Dietary polyunsaturated fatty acids (PUFAs): uses and potential health benefits. Curr Nutr Rep. (2021) 10:232–42. doi: 10.1007/s13668-021-00363-3
72. Kim, KB, Nam, YA, Kim, HS, Hayes, AW, and Lee, BM. α-Linolenic acid: nutraceutical, pharmacological and toxicological evaluation. Food Chem Toxicol. (2014) 70:163–78. doi: 10.1016/j.fct.2014.05.009
73. Dighriri, IM, Alsubaie, AM, Hakami, FM, Hamithi, DM, Alshekh, MM, Khobrani, FA, et al. Effects of omega-3 polyunsaturated fatty acids on brain functions: a systematic review. Cureus. (2022) 14:e30091. doi: 10.7759/cureus.30091
74. Sala-Vila, A, Fleming, J, Kris-Etherton, P, and Ros, E. Impact of α-linolenic acid, the vegetable ω-3 fatty acid, on cardiovascular disease and cognition. Adv Nutr. (2022) 13:1584–602. doi: 10.1093/advances/nmac016
75. Capocchi, A, Bottega, S, Spano, C, and Fontanini, D. Phytochemicals and antioxidant capacity in four Italian traditional maize (Zea mays L.) varieties. Int J Food Sci Nutr. (2017) 68:515–24. doi: 10.1080/09637486.2016.1261809
76. Rodriguez-Salinas, PA, Zavala-Garcia, F, Urias-Orona, V, Muy-Rangel, D, Heredia, JB, and Niño-Medina, G. Chromatic, nutritional and nutraceutical properties of pigmented native maize (Zea mays L.) genotypes from the northeast of Mexico. Arab J Sci Eng. (2020) 45:95–112. doi: 10.1007/s13369-019-04086-0
77. Amador-Rodríguez, KY, Silos-Espino, H, Valera-Montero, LL, Perales-Segovia, C, Flores-Benítez, S, and Martínez-Bustos, F. Physico-chemical, thermal, and rheological properties of nixtamalized creole corn flours produced by high-energy milling. Food Chem. (2019) 283:481–8. doi: 10.1016/j.foodchem.2019.01.044
78. Skrajda-Brdak, M, Konopka, I, Tańska, M, and Sulewska, H. Lipophilic fraction and its antioxidant capacity in sixteen spelt genotypes cultivated in Poland. J Cereal Sci. (2019) 89:102809. doi: 10.1016/j.jcs.2019.102809
79. Ledenčan, T, Horvat, D, Marković, S, Svečnjak, Z, Jambrović, A, and Šimić, D. Effect of harvest date on kernel quality and antioxidant activity in su1 sweet corn genotypes. Agronomy (Basel). (2022) 12:1224. doi: 10.3390/agronomy12051224
80. Kashtoh, H, and Baek, KH. Recent updates on phytoconstituent alpha-glucosidase inhibitors: an approach towards the treatment of type two diabetes. Plan Theory. (2022) 11:2722. doi: 10.3390/plants11202722
81. Hossain, U, Das, AK, Ghosh, S, and Sil, PC. An overview on the role of bioactive α-glucosidase inhibitors in ameliorating diabetic complications. Food Chem Toxicol. (2020) 145:111738:111738. doi: 10.1016/j.fct.2020.111738
82. Alam, F, Shafique, Z, Amjad, ST, and Bin-Asad, MHH. Enzymes inhibitors from natural sources with antidiabetic activity: a review. Phytother Res. (2019) 33:41–54. doi: 10.1002/ptr.6211
83. Sun, L, Warren, FJ, and Gidley, MJ. Natural products for glycaemic control: polyphenols as inhibitors of alpha-amylase. Trends Food Sci Technol. (2019) 91:262–73. doi: 10.1016/j.tifs.2019.07.009
84. Sarkar, D, Christopher, A, and Shetty, K. Phenolic bioactives from plant-based foods for glycemic control. Front Endocrinol. (2021) 12:727503. doi: 10.3389/fendo.2021.727503
85. Serina, JJC, and Castilho, PCMF. Using polyphenols as a relevant therapy to diabetes and its complications, a review. Crit Rev Food Sci Nutr. (2022) 62:8355–87. doi: 10.1080/10408398.2021.1927977
86. Sun, L, and Miao, M. Dietary polyphenols modulate starch digestion and glycaemic level: a review. Crit Rev Food Sci Nutr. (2020) 60:541–55. doi: 10.1080/10408398.2018.1544883
87. Anhê, FF, Desjardins, Y, Pilon, G, Dudonné, S, Genovese, MI, Lajolo, FM, et al. Polyphenols and type 2 diabetes: a prospective review. PharmaNutrition. (2013) 1:105–14. doi: 10.1016/j.phanu.2013.07.004
88. Malunga, LN, Joseph Thandapilly, S, and Ames, N. Cereal-derived phenolic acids and intestinal alpha glucosidase activity inhibition: structural activity relationship. J Food Biochem. (2018) 42:e12635. doi: 10.1111/jfbc.12635
89. Sansenya, S, and Payaka, A. Inhibitory potential of phenolic compounds of Thai colored rice (Oryza sativa L.) against α-glucosidase and α-amylase through in vitro and in silico studies. J Sci Food Agric. (2022) 102:6718–26. doi: 10.1002/jsfa.12039
90. Wang, W, Snooks, HD, and Sang, S. The chemistry and health benefits of dietary phenolamides. J Agric Food Chem. (2020) 68:6248–67. doi: 10.1021/acs.jafc.0c02605
91. Niwa, T, Doi, U, and Osawa, T. Inhibitory activity of corn-derived bisamide compounds against α-glucosidase. J Agric Food Chem. (2003) 51:90–4. doi: 10.1021/jf020758x
92. Bhuyan, P, Ganguly, M, Baruah, I, Borgohain, G, Hazarika, J, and Sarma, S. Alpha glucosidase inhibitory properties of a few bioactive compounds isolated from black rice bran: combined in vitro and in silico evidence supporting the antidiabetic effect of black rice. RSC Adv. (2022) 12:22650–61. doi: 10.1039/D2RA04228B
93. Wen, H, Tang, B, Stewart, AJ, Tao, Y, Shao, Y, and Cui, Y. Erythritol attenuates postprandial blood glucose by inhibiting α-glucosidase. J Agric Food Chem. (2018) 66:1401–7. doi: 10.1021/acs.jafc.7b05033
94. Di Stefano, E, Oliviero, T, and Udenigwe, CC. Functional significance and structure–activity relationship of food-derived α-glucosidase inhibitors. Curr Opin Food Sci. (2018) 20:7–12. doi: 10.1016/j.cofs.2018.02.008
95. Chaudhary, RK, Karoli, SS, Dwivedi, PS, and Bhandari, R. Anti-diabetic potential of corn silk (Stigma maydis): an in-silico approach. J Diabetes Metab Disord. (2022) 21:445–54. doi: 10.1007/s40200-022-00992-7
96. Manyelo, TG, Sebola, NA, Hassan, ZM, Ng’ambi, JW, Weeks, WJ, and Mabelebele, M. Chemical composition and metabolomic analysis of Amaranthus cruentus grains harvested at different stages. Mol Ther. (2022) 27:623. doi: 10.3390/molecules27030623
97. Ferchichi, A, Harrabi, S, Feki, M, and Fellah, H. Bioactive lipids, antibacterial, hypoglycaemic, and antioxidant potentials of immature and mature Vicia faba L. seeds cultivated in Tunisia. Acta Aliment. (2020) 49:254–62. doi: 10.1556/066.2020.49.3.3
98. Parizad, PA, Capraro, J, Scarafoni, A, Bonomi, F, Blandino, M, and Marengo, M. The bio-functional properties of pigmented cereals may involve synergies among different bioactive species. Plant Foods Hum Nutr. (2019) 74:128–34. doi: 10.1007/s11130-019-0715-4
99. Chen, L, Guo, Y, Li, X, Gong, K, and Liu, K. Characterization of polysaccharides from different species of brown seaweed using saccharide mapping and chromatographic analysis. BMC Chem. (2021) 15:1–9. doi: 10.1186/s13065-020-00727-w
100. Lee, CH, Garcia, HS, and Parkin, KL. Bioactivities of kernel extracts of 18 strains of maize (Zea mays). J Food Sci. (2010) 75:C667–72. doi: 10.1111/j.1750-3841.2010.01784.x
101. Saikaew, K, Lertrat, K, Ketthaisong, D, Meenune, M, and Tangwongchai, R. Influence of variety and maturity on bioactive compounds and antioxidant activity of purple waxy corn (Zea mays L. var. ceratina). Int Food Res J. (2018) 25:1985–95.
102. Filiz, E, Cetin, D, and Akbudak, MA. Aromatic amino acids biosynthesis genes identification and expression analysis under salt and drought stresses in Solanum lycopersicum L. Sci Hortic. (2019) 250:127–37. doi: 10.1016/j.scienta.2019.02.044
103. Juliano, BO, and Tuano, APP. 2–gross structure and composition of the rice grain In: J Bao, editor. Rice – Chemistry and technology. Washington, DC: AACC International Press (2019). 31–53.
104. Nattagh-Eshtivani, E, Barghchi, H, Pahlavani, N, Barati, M, Amiri, Y, Fadel, A, et al. Biological and pharmacological effects and nutritional impact of phytosterols: a comprehensive review. Phytother Res. (2022) 36:299–322. doi: 10.1002/ptr.7312
105. Wei, T, Dong, L, Zhong, S, Jing, H, Deng, Z, Wen, Q, et al. Chemical composition of camellia chekiangoleosa Hu. Seeds during ripening and evaluations of seed oils quality. Ind Crop Prod. (2022) 177:114499:114499. doi: 10.1016/j.indcrop.2021.114499
106. Peng, L, Kawagoe, Y, Hogan, P, and Delmer, D. Sitosterol-β-glucoside as primer for cellulose synthesis in plants. Science. (2002) 295:147–50. doi: 10.1126/science.1064281
107. Chateigner-Boutin, AL, Lapierre, C, Alvarado, C, Yoshinaga, A, Barron, C, Bouchet, B, et al. Ferulate and lignin cross-links increase in cell walls of wheat grain outer layers during late development. Plant Sci. (2018) 276:199–207. doi: 10.1016/j.plantsci.2018.08.022
108. Cutignano, A, Mamone, G, Boscaino, F, Ceriotti, A, Maccaferri, M, and Picariello, G. Monitoring changes of lipid composition in durum wheat during grain development. J Cereal Sci. (2021) 97:103131. doi: 10.1016/j.jcs.2020.103131
109. Araujo, WL, Nunes-Nesi, A, Nikoloski, Z, Sweetlove, LJ, and Fernie, AR. Metabolic control and regulation of the tricarboxylic acid cycle in photosynthetic and heterotrophic plant tissues. Plant Cell Environ. (2012) 35:1–21. doi: 10.1111/j.1365-3040.2011.02332.x
Keywords: Zea mays, Peruvian maize, Cabanita, primary metabolites, secondary metabolites, antioxidant capacity, hyperglycemia, biodiversity
Citation: Ranilla LG, Zolla G, Afaray-Carazas A, Vera-Vega M, Huanuqueño H, Begazo-Gutiérrez H, Chirinos R, Pedreschi R and Shetty K (2023) Integrated metabolite analysis and health-relevant in vitro functionality of white, red, and orange maize (Zea mays L.) from the Peruvian Andean race Cabanita at different maturity stages. Front. Nutr. 10:1132228. doi: 10.3389/fnut.2023.1132228
Edited by:
Dejian Huang, National University of Singapore, SingaporeReviewed by:
Beatriz Andrea Acosta-Estrada, Monterrey Institute of Technology and Higher Education (ITESM), MexicoCopyright © 2023 Ranilla, Zolla, Afaray-Carazas, Vera-Vega, Huanuqueño, Begazo-Gutiérrez, Chirinos, Pedreschi and Shetty. This is an open-access article distributed under the terms of the Creative Commons Attribution License (CC BY). The use, distribution or reproduction in other forums is permitted, provided the original author(s) and the copyright owner(s) are credited and that the original publication in this journal is cited, in accordance with accepted academic practice. No use, distribution or reproduction is permitted which does not comply with these terms.
*Correspondence: Lena Gálvez Ranilla, ✉ bGdhbHZlekB1Y3NtLmVkdS5wZQ==
Disclaimer: All claims expressed in this article are solely those of the authors and do not necessarily represent those of their affiliated organizations, or those of the publisher, the editors and the reviewers. Any product that may be evaluated in this article or claim that may be made by its manufacturer is not guaranteed or endorsed by the publisher.
Research integrity at Frontiers
Learn more about the work of our research integrity team to safeguard the quality of each article we publish.